 Guangxu Zhang1,2
 Xiujuan Wang
2,3*Lin Li4*Luyi Sun1,2Yiqun Guo5Yintao Lu4Wei Li6Zhaoqi Wang4
Xiujuan Wang
2,3*Lin Li4*Luyi Sun1,2Yiqun Guo5Yintao Lu4Wei Li6Zhaoqi Wang4
 Jin Qian
1,2Taotao Yang4Wenlong Wang1,2
Jin Qian
1,2Taotao Yang4Wenlong Wang1,2
- 1 Center for Ocean Mega-Science and Key Laboratory of Marine Geology and Environment, Institute of Oceanology, Chinese Academy of Sciences, Qingdao, China
- 2 Laboratory for Marine Mineral Resources, Qingdao National Laboratory for Marine Science and Technology, Qingdao, China
- 3 Frontiers Science Center for Deep Ocean Multispheres and Earth System, Key Lab of Submarine Geosciences and Prospecting Techniques, MOE and College of Marine Geosciences, Ocean University of China, Qingdao, China
- 4 Petrochina Hangzhou Research Institute of Geology, Hangzhou, China
- 5 Haikou Marine Geological Survey Center of China Geological Survey, Haikou, China
- 6 CAS Key Laboratory of Ocean and Marginal Sea Geology, South China Sea Institute of Oceanology, Chinese Academy of Sciences, Guangzhou, China
The amplitude and coherence attributes of three-dimensional (3D) seismic data are used to confirm gas hydrate occurrence and to delineate its distribution in the Zhongjiannan basin, South China Sea. High amplitude anomalies (HAAs) are distributed above or below the regional base of gas hydrate stability zone (BGHSZ), which intersect with the bottom simulating reflectors (BSRs) or are interrupted by different types of pockmarks. The maximum amplitude attribute extracted along T1 (5.5 Ma) horizon is controlled by the widely distributed faults. The layer-bound polygonal faults (PFs) show networks of small normal faults, and the dominant orientations of PFs are similar or orthogonal to the regional tectonic faults, which provide the fluid migration pathways for gas and fluids to form HAAs. BSR shows the strong amplitude and continuous reflection where the faults or PFs can reach the BGHSZ without the influence of the pockmarks. Most of the pockmarks are related to the reactivation of faults and magmation, and some pockmarks are caused by the dissociation of gas hydrate. Around the matured pockmark, the BSR is discontinuous, and HAAs locally appear within the pockmarks. The inverted acoustic impedance profile shows obviously high values of HAAs except in pockmark zones. Partial HAAs occur above BGHSZ, and the continuity is interrupted by the pockmarks with only high values around the pockmarks. We propose that BSR, HAAs, pockmarks, and different types of faults are closely related to the occurrence and distribution of gas hydrates in the study area. This work allows us to understand the relationship between gas hydrate occurrence and accumulation with pockmarks, faults, and magmatic activities.
Introduction
The occurrences of gas hydrates with different morphologies have been confirmed in the northern slope of South China Sea by Guangzhou Marine Geological Survey (GMGS) drilling expeditions since 2007 (e.g., Zhang et al., 2007; Zhang et al., 2014; Yang et al., 2015; Zhang et al., 2015; Yang et al., 2017; Jiangong Wei et al., 2019; Liang et al., 2019; Ye et al., 2019; Zhang et al., 2019; Zhang et al., 2020a; Zhang et al., 2020b). Pore-filling gas hydrates with different thicknesses and saturation were found just above the base of the gas hydrate stability zone in the Pearl River Mouth Basin (PRMB) (Yang et al., 2017; Wang et al., 2011; Wang et al., 2014a; Wang et al., 2022; Zhang et al., 2020a; Zhang et al., 2020b). The gas hydrate-bearing layer shows high amplitude anomalies (HAAs) with the same polarity to the seafloor reflection above BSR showing on the seismic profile (Wang et al., 2016; Zhang et al., 2020a; Wang et al., 2022). The reservoir of gas hydrates in PRMB is mainly clay silt with abundant foraminifera and calcareous debris (Chen et al., 2013; Kang et al., 2018; Li et al., 2018). Moreover, the gas hydrate production test was also conducted in this area where the gas hydrate target is a three-layer structure of a hydrate layer, a mixed layer of hydrate and free gas, and a free gas layer (Li et al., 2018; Qian et al., 2018; Qin et al., 2020). Recently, gas hydrate drilling expeditions in the Qiongdongnan Basin (QDNB) have found that the morphologies of gas hydrates and the seismic anomalies for gas hydrate-bearing layers are quite different from those found in the PRMB. The gas source in the QDNB is mainly thermogenic gas, while that of PRMB is a mixed source or mainly biogenic gas (Wu et al., 2009; Wu et al., 2010; Wang et al., 2014a; Liang et al., 2019; Ye et al., 2019; Zhang et al., 2020b; Lai et al., 2021). Gas hydrates with veins, nodules, massive, and fracture-filled were found from the pressure core samples, and the three dimensional (3D) seismic profiles show chimney-like structures extended to different layers with pull-up reflections and weak amplitude, while it shows the seismic anomalies as acoustic blanking reflection in the two-dimensional seismic profile (e.g., Liang et al., 2019; Ye et al., 2019; Zhang et al., 2019; Wang et al., 2021; Wang et al., 2022). The BSR is approximately parallel to the seafloor, with a discontinuous distribution, obviously different from that observed in the QDNB that is influenced by the widely distributed mass transport depositions. Many studies have shown that the accumulation of gas hydrates is closely related to gas chimneys and faults, which provide upward migration pathways of deep thermogenic gas (Wu et al., 2009; Liang et al., 2019; Ye et al., 2019; Zhang et al., 2020a; Su et al., 2020).
Fluid migration and reservoir are important factors for gas hydrate accumulation in fine-grained sediments. Biogenic gas and thermogenic gas can form gas hydrates. The fluid can migrate upward through diffusion, convection, and gas phase to form gas hydrates within the gas hydrate stability zone (Collett et al., 2009). The biogenesis gases generated in the fine-grained sediments can migrate to the coarse-grained sediments in a short distance by diffusion to form gas hydrates, and they may transport for a long distance along coarse-grained or permeable strata by convection in a gas phase or dissolved gas together with water, which can accumulate in the favorable reservoir to form gas hydrates (Li et al., 2019). Pockmarks with bowl-shaped negative topography on the seabed are formed at the seafloor or buried below the seafloor caused by fluid seepage (e.g., Berndt et al., 2003; Svensen et al., 2004; Hovland et al., 2005; Gay et al., 2006; Cartwright et al., 2007; Prunelé et al., 2016). Faults can serve as migration conduits for hydrocarbon gas and fluids, thereby which can affect the formation and distribution of gas hydrates (Berndt et al., 2003; Cartwrighty et al., 2003; Hustoft et al., 2007; Sun et al., 2010; Laurent et al., 2012; Ostanin et al., 2012). Widely distributed BSRs have been found in the Zhongjiannan Basin (ZJNB), which are related to pockmarks and polygonal faults (Lu et al., 2017; Liu et al., 2019; Lu et al., 2021). The previous study showed that BSRs are not parallel to the seafloor and have variable depths from the seafloor ranging from 184 to 263 m (Lu et al., 2017). However, the controlling factors of gas hydrate distribution, saturation, and thickness are not well known. In this study, we reprocessed the 3D seismic data together with broadband inversion and attribute analysis to reveal the occurrence and controlling factors for gas hydrate. We summarized the relationship between gas hydrate, polygonal faults, normal faults, and pockmarks and their controlling on gas hydrate occurrence and accumulation in the study area.
Geological Setting
The South China Sea (SCS) is one of the largest continental margin basins in the Western Pacific. The Zhongjiannan basin is located at the Western margin of the SCS, and it is near the Qiongdongnan basin, Xisha Island, and Zhongsha Island (Figure 1). The tectonic evolution of the Zhongjiannan basin can be divided into two stages: rift extension and post-rift thermal subsidence by the boundary of 23.3 Ma (Xie et al., 2006). During the rifting period, tectonic activities were relatively active, and multiple groups of the northeast and near east-west oriented faults were developed (Xie et al., 2008). During the post-rift period, the tectonic activity was relatively weak in the Early-Middle Miocene (Zhou et al., 1995), while the neotectonics movement has been active since the late Miocene due to the collision between Taiwan and the Chinese mainland continent (Lüdmann and KinWong, 1999). Widespread magmatic activities, uplifts, and fluid flow systems occurred due to the left-lateral transgression and the right-lateral wrenching along the East Vietnam boundary fault zone since 5.5 Ma (Morley, 2002; Li et al., 2013; Chen et al., 2015). Abundant polygonal faults were developed during the stage of stable thermal subsidence in the post-rift period. Faults and volcanoes were reactivated due to tectonic activity, which can serve as vertical pathways for deep thermogenic gas migration and are beneficial to gas hydrate accumulation (Sun et al., 2011; Sun et al., 2013; Chen et al., 2015; Lu et al., 2017; Chen et al., 2018; Yang et al., 2020).
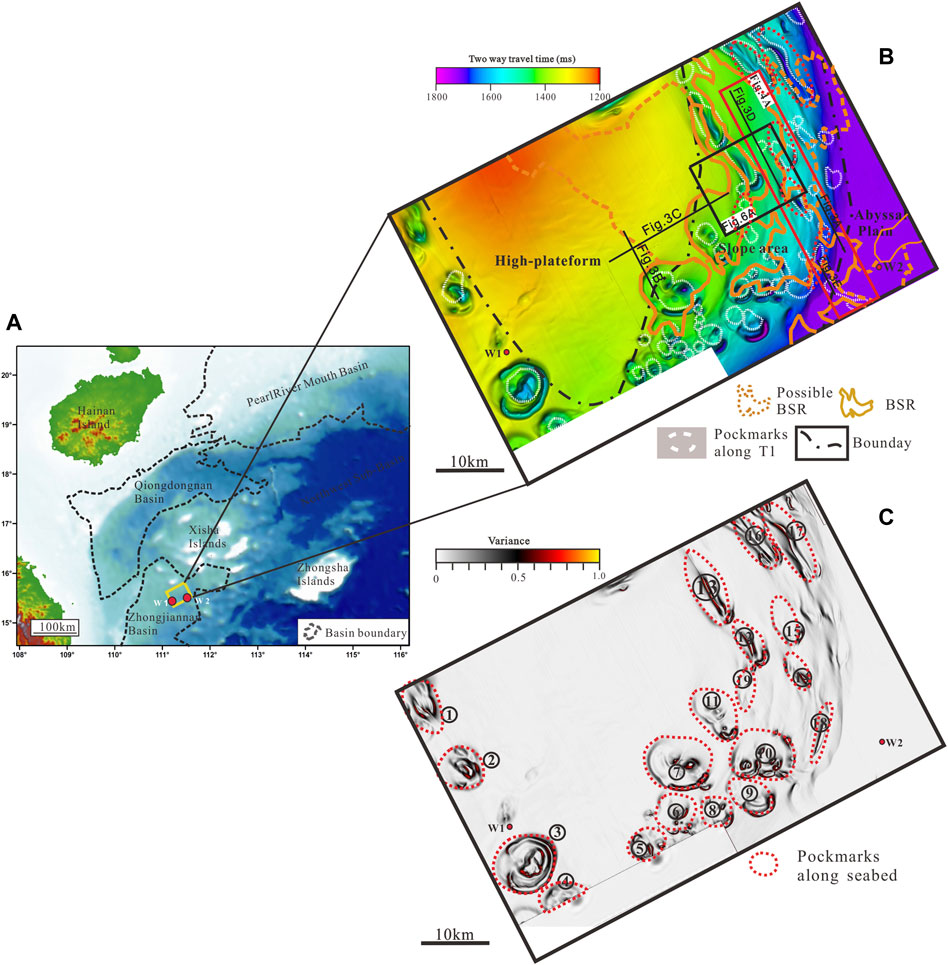
FIGURE 1. (A) The location of Zhongjiannan basin is to the south of Qiongdongnan basin, the northern slope of South China Sea. (B) The water depth of seafloor interpreted from 3D seismic data showing the pockmarks and different types of BSRs. The white break line represents the pockmarks identified along with horizon T1. The black rectangle marks the location of the reprocessed 3D seismic data boundary. (C) The variance slice along the seabed showing the pockmarks. The red break line represents the pockmarks identified along with the horizon seabed.
The stratigraphic sequences in the shallow sediments are quite different since 10.5 Ma (T2) due to lack of well data. We interpreted eight seismic horizons to study the tectonic activity, and its influence on fluid flow and gas hydrate formation, namely, the Seafloor, T1 (5.02 Ma), T2 (10.5 Ma), T3 (16.5 Ma), T4 (23.3 Ma), T5 (28.0 Ma), T6 (35.4), and Tg (56.5 Ma), bounded the intervals named Yinggehai, Huangliu, Meishan, Sanya, Lingshui, Yacheng, and Lingtou Formation, respectively. Based on the sequence stratigraphy analysis and seismic interpretation from core samples, the reflector T1 is the boundary of the Miocene and Pliocene. The thickness of this layer ranges from 300 to 750 ms two-way travel time showing high amplitude reflections in the study area (Figure 2). The water depths range from 800 to 1400m, and two sites were drilled in 2014 in the study area. The geothermal gradient measured at Sites W1 and W2 are about 54.1°C/km and 5.02°C/km, respectively, and the seafloor surface temperature is about 5°C (Li et al., 2022). The calculated methane hydrate stability zone is about 160–240 m using the phase equilibrium curve (Sloan and Koh, 2007). The Miocene and upper strata have low organic matter maturity (Ro<0.5%) and are in the immature stage (Liu et al., 2019), which is the primary strata of biogenic gas.
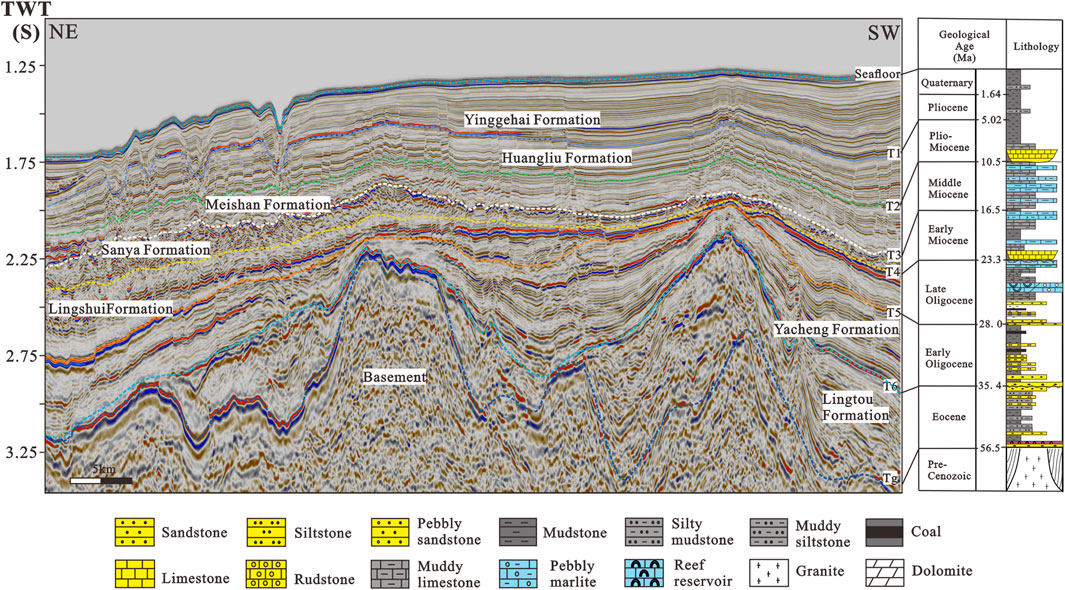
FIGURE 2. Schematic stratigraphic sequences in the Zhongjiannan basin and the main seismic horizons (modifed after Xie et al., 2006; Lu et al., 2017).
Data and Method
Seismic Data
High-resolution 3D seismic data were acquired by WesternGeco Geophysics using eight parallel cables and 960-channel streamers in 2011. The trace interval is 3.25 m, and the time sampling is 2 ms, with a bin spacing of 12.5 and 25 m of the inline and crossline, respectively. Conventional processed 3D seismic data are used to identify deeper structures in the middle and deep strata. BSR was identified from the seismic data in this basin with an area of about 350 km2 (Lu et al., 2017; Li et al., 2022). To study the properties of gas hydrate accumulation and distribution, 100 km2 3D seismic data were reprocessed to improve the signal-to-noise ratio, protect low frequencies, and broaden the frequency bandwidth by suppressing ghost waves. For high-resolution interpretation, horizons T1, T2, T3, T4, T5, and T6 were picked every 20 lines and traces. In some areas of pockmarks and volcanoes, in lines and traces were picked every two to five lines. To understand how polygonal faults and faults have interacted with HAAs and fluid flow in this area, the following attributes of 3D seismic data were extracted: 1) the maximum amplitude along horizon T1 and BGHSZ with different time windows and 2) the coherence slice along T0, T1, T2, and T5 using Petrel E&P are used to describe the lateral amplitude discontinuities and to enhance the faults and fractures. Manual interpretation of fault strikes was carried out from coherence slices. Extracted fault strikes from individual fault segments are then plotted on bidirectional rose diagrams for further structural analysis with the Grapher software. 3) The root mean square (RMS) amplitude attribute along T1 with a 50 ms time window above along the picked horizon are generated to show the sedimentary environment.
Broadband Inversion of Acoustic Impedance
The constrained sparse spike inversion (CSSI) of broadband full-stack seismic data was carried out to obtain the acoustic impedance profile. The input data include the time-migrated seismic data, the average seismic wavelet, horizons, and the low-frequency impedance model. The wavelets are estimated by creating pseudo-wells at different positions. Since the target layer is buried in a shallow depth, the wavelets estimated by different pseudo-wells are relatively stable. Therefore, a zero-phase average wavelet is used to invert acoustic impedance. The low-frequency model is established by combining the compaction trend with the stack velocity due to the lack of gas hydrate logging data in the study area. The frequency range of the compaction trend is about 0–1 Hz, and the frequency range of the velocity field is 0–2 Hz. The compaction trend of the low-frequency model is used to correct the trend of the velocity field model. Gas hydrate saturations have been estimated from the P-wave well log data, inverted seismic velocity or impedance data and rock physics modeling to provide spatial distribution of gas hydrate occurrences (e.g., Helgerud et al., 1999; Lee and Collett, 2009; Lee and Waite, 2008; Lu and Mcmechan, 2002, Lu and McMechan, 2004; Shelander et al., 2012; Riedel and Shankar, 2012; Wang et al., 2011; Wang et al., 2014a, Wang et al., 2016; Wang et al., 2021). Lithology and porosity are essential factors for affecting the estimated gas hydrate saturation.
Till now, no gas hydrate drilling well has been conducted in the area. We used the well logs at the adjacent area with similar sedimentary environments and two oil exploration wells in this basin to get the porosity profile (Li et al., 2022). We used the same method to invert the porosity data in this basin. The inverted acoustic impedance data were used to calculate gas hydrate saturation using the sand/clay or carbonate/clay rock physics models in the Shenhu area (Wang et al., 2016). The main mineralogical compositions are assumed of 40% clay+60% sand and 100% carbonate, respectively. The RMS and maximum value of gas hydrate saturations are extracted along BGHSZ to show the distribution of gas hydrate in the reprocessed seismic data. We can compare gas hydrate identified from reprocessed data to seismic attributes from conventional seismic data in the study area to show the distribution.
Results
Characteristics of BSR and High Amplitude Anomaly Features
BSRs are delineated using the high-resolution and reprocessed 3D seismic data to show the spatial distribution (Figure 3). The BSRs show a weak amplitude in the conventional processed 3D seismic data (Figure 3A–C), while the reprocessed seismic data show continuous BSR and high amplitude reflection indicating the occurrence of gas hydrate (Figure 3E,F, Figure 4D). The seismic response of the gas hydrate layer has a strong amplitude reflection with the revered polarity of the seafloor (Lu et al., 2017; Li et al., 2022). The BSRs show the variations of amplitude, continuity, and spatial distribution at the platform, platform margin, and abyssal plain, including three different geological environments (Figure 3): 1) fault-controlled BSRs and HAAs. Most BSRs and HAAs are related to faults, especially where BSR and HAAs are separated by a low saturation gas hydrate-bearing layer (Figure 3A, C–E); 2) pockmark-influenced BSR. BSR is occurred within or at the edge of pockmarks, which shows the discontinuous, weak-medium amplitude and shallower depth (Figure 3B); and 3) BSR and HAA overlap BGHSZ. BSR is located at the BGHSZ with HAA, and BSR and BGHSZ are consistent (Figure 3D,E).
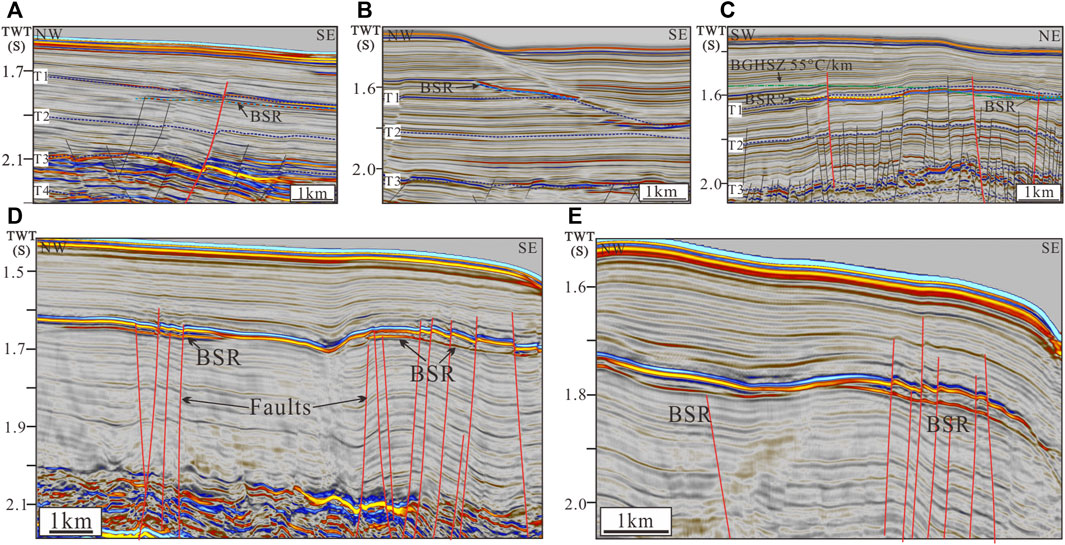
FIGURE 3. (A)–(E) The seismic characteristics of BSR and high amplitude anomalies at different locations and their relationship with faults, pockmarks, and the base of the gas hydrate stability zone calculated from 55°C/km (location shown in Figure 1B).
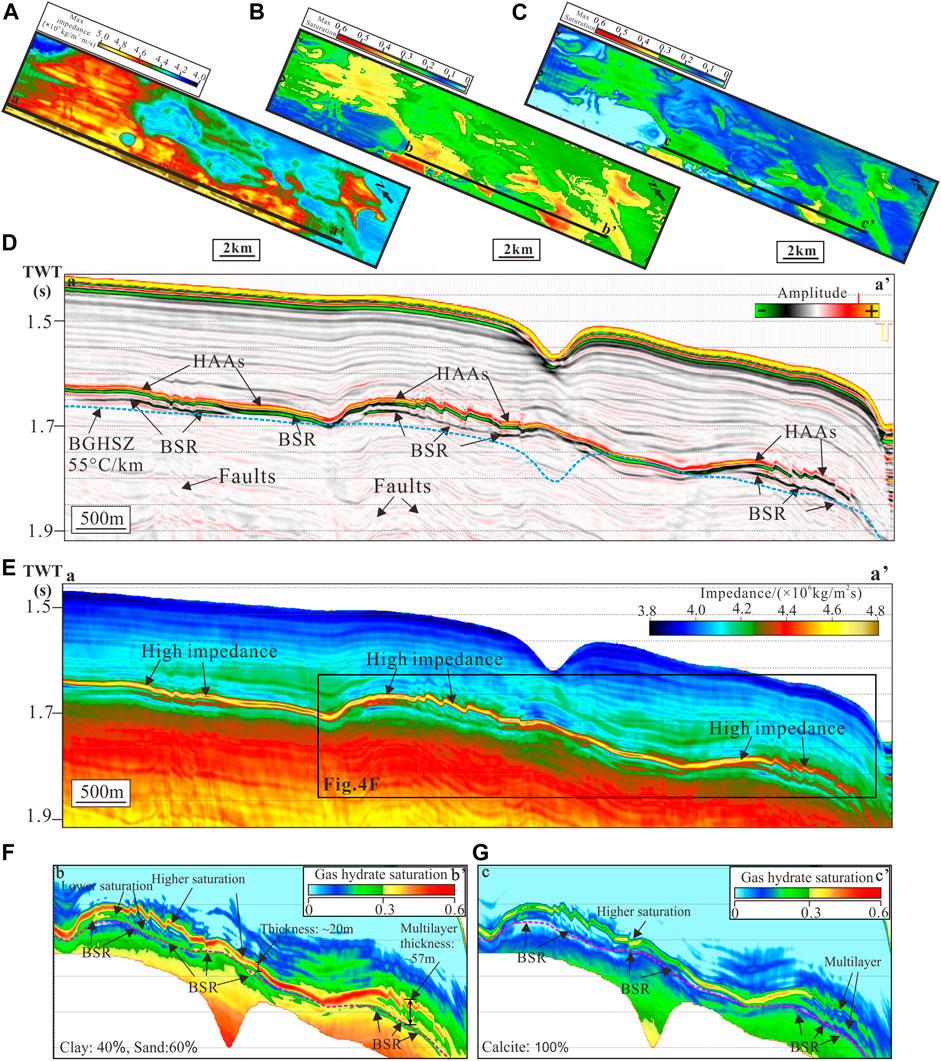
FIGURE 4. (A) Maximum value extracted from the acoustic impedance along BGHSZ with 50 ms spanning windows, showing the distribution of the acoustic impedance. (B) Maximum value of the estimated gas hydrate saturations using the clay/sand model along BGHSZ with a 50 ms search window. (C) Maximum value of the estimated gas hydrate saturation using a model with 100% calcite, showing the distribution of gas hydrate saturation. (D) The reprocessed broadband seismic profile shows BSR and high amplitude anomalies (HAAs). (E) The inverted acoustic impedance profile shows high acoustic impedance of the HAA layer (F)–(G) Gas hydrate saturation profiles estimated from iterative inversion using the lithologies of 40% clay and 60% sand, and carbonate, respectively.
The BSR shows relatively weak amplitude compared to HAAs seen from the reprocessed seismic profile (Figure 4D). The BSR and HAA are easy to distinguish when gas hydrate-bearing sediments are thicker. However, when the BSR, HAA, and BGHSZ match each other, the seismic amplitude is strong. The inverted acoustic impedance shows high acoustic impedance value for the HAA layer, which is continuous and slightly changes. The depths to the seafloor of HAA vary laterally due to the influence of the sedimentary environment.
Characteristics of Acoustic Impedance and Gas Hydrate Saturations
Gas hydrate saturations are estimated using an effective medium model and the inverted acoustic impedance (Li et al., 2022). The estimated gas hydrate saturation using the clay/sand model (with 40% clay and 60% sand) is about 10–50% of the pore space. Due to the lack of drilling data, we are not sure about the lithology of the HAA layer, and we consider the lithology influence on the inverted acoustic impedance. In the fine-grained sediments with high gas hydrate-bearing sediments, calcite content is up to 60% at Site GMGS3-W18 (Kang et al., 2018). We assume that the gas hydrate-bearing sediment with a content of 100% calcite under this extreme condition, and the calculated gas hydrate saturation is significantly reduced, but the average saturation of the HAA layer can reach 20%, and the partial region with gas hydrate saturation is up to 40% (Figure 4E). The thickness of the gas hydrate-bearing layer ranges from 10 to 57 m (Li et al., 2022).
The maximum values of the inverted acoustic impedance are extracted along BGHSZ with time windows of 50 ms to show the distribution of gas hydrate (Figure 4A). The inverted acoustic impedance show similar changes except at the edge of pockmarks. However, the maximum attributes of estimated gas hydrate saturations extracted along BGHSZ with a time window of 50 ms show obviously different features (Figure 4B). Gas hydrate saturations estimated using the clay/sand model are higher than that estimated from the calcite model (Figure 4F,G). There are no gas hydrates around the pockmarks.
Characteristics of Polygonal Faults
Small and “non-tectonic” extensional faults affect about 1000 m of sediments and show the polygonal pattern in plain view, which show small offsets ranging from 10 to 50 ms two-way travel time and a spacing ranging from 100 m to 2 km. The coherency attribute slices are used to show the detailed lateral distribution of polygonal fault discontinuities (Figure 5B–D). The polygonal faults are confined to the stratigraphic intervals from T1 to T4, and the maximum displacement values range from several meters to over 100 m seen from the coherence attribute. The polygonal faults are found in the middle of the platform and southeast parts of the study area and rarely developed in the west part, showing the irregular polygonal map geometry (Figures 5, 6). A high density of polygonal faults is encountered in the platform and slope region. The polygonal faults are orthogonally linked to the adjacent tectonic faults (Figure 5). The seismic section represents discontinuous and sinuous seismic events in the polygonal fault’s interval. Partial polygonal faults can cut through BSRs and HAA layer (Figures 3, 6).
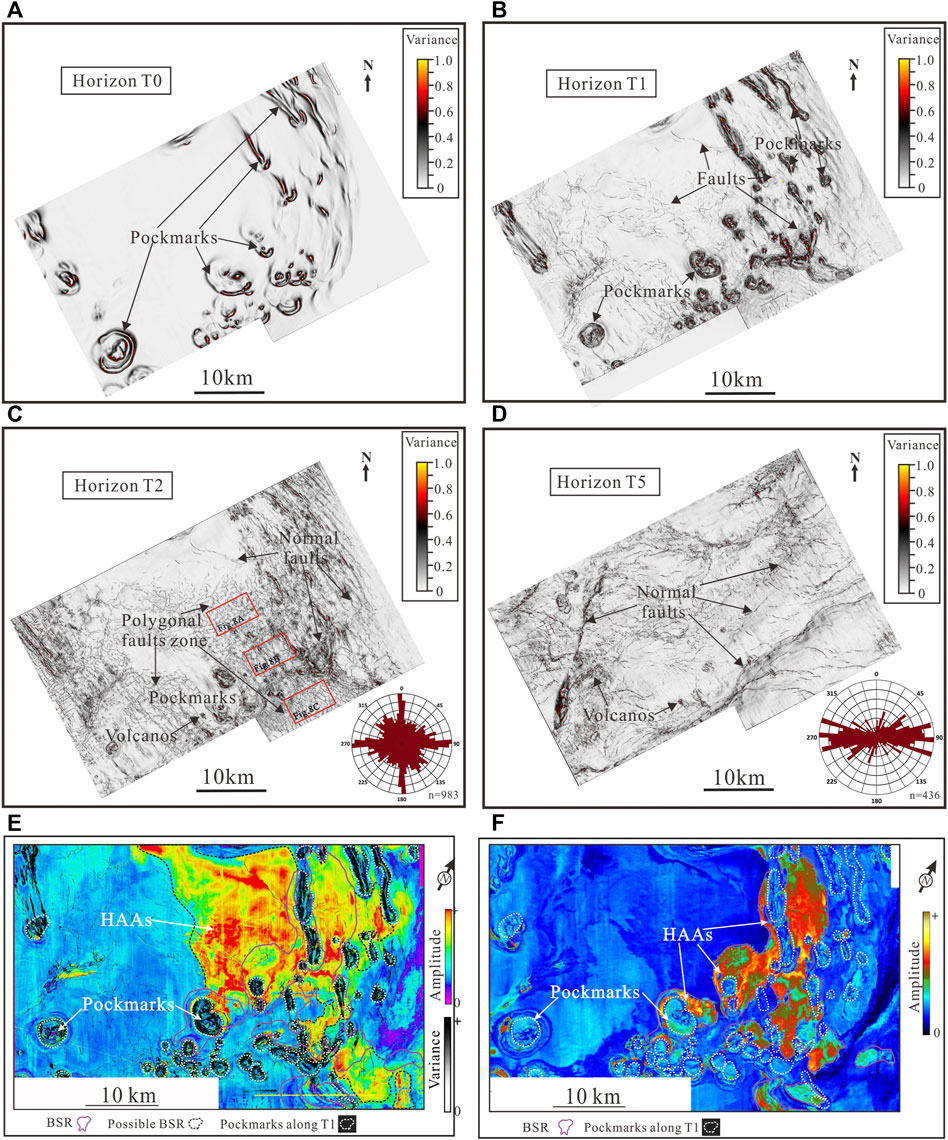
FIGURE 5. (A)–(D) The time slices of the coherence attribute along horizons T0, T1, T2, and T5, respectively. The maps show the variations of polygonal faults and fault systems in the study area. The inset rose diagrams of horizons T2 and T5 showing the strikes of faults, respectively. (E) Maximum amplitude attribute map extracted along T1 with a time window 60 ms above this layer, which overlays on the fault probability volume obtained from variance slice along horizon T1, showing the relationship between HAAs, faults, and pockmarks. (F) Maximum amplitude attribute map extracted along BGHSZ with a time window of 60 ms above and the pockmarks found in the horizon T1 showing the relationship between the distribution of the HAAs and the pockmarks.
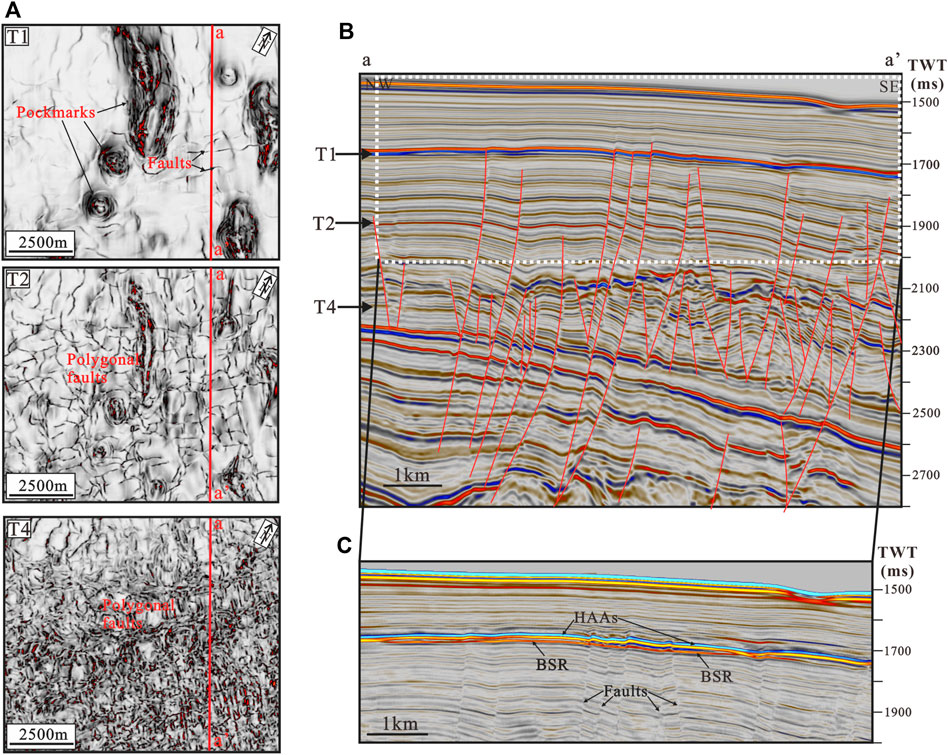
FIGURE 6. Three-dimensionality of polygonal fault geometry. (A) Three coherence slices extracted from horizons T1, T2, and T4, respectively, show polygonal faults’ variations at different depths. (B) Seismic profile showing the position of three coherence slices showing complex tier, with few master faults transecting the full thickness reaching the BSR and HAA and with many other smaller faults (C). The reprocessed seismic profile showing the relationship between BSR, HAAs, and faults.
A representative area for the polygonal fault network block was analyzed to compare the relation between the fault strike and polygonal strike. Faults found from the T5 horizon are mainly tectonic faults with the strike of NE-SW (Figure 5D). In contrast, the coherence attribute slice of the T2 horizon shows that polygonal faults and tectonic faults are widely distributed, and the strikes are N-S and NE-SW (Figure 5C), respectively. By comparing the strikes identified from T2 and T5 horizons, we find that some polygonal faults have similar strikes to tectonic faults and some polygonal faults have quite different strikes. In general, the idealized polygonal planform is a classical hexagonal pattern in which the faults intersect at angles of 60° or so, and faults are almost equal in strike length. This classical pattern is found in the regional area (Figure 5C). At different layers, distinct fault planform patterns are found from three horizons of T1, T2, and T4, showing the significant variations in the fault pattern and connectivity at different depths (Figure 6). The seismic profile shows the positions of the three coherence slices, which is a complex tier. There are few “master” faults that can penetrate through the overlying strata to the BSR and HAA. Many other smaller faults are generated in the local strata and fill in the space between the larger faults intersecting with them at different levels within the tier. The distribution of these faults is very important for the upward migration of fluid flow, which can transport plenty of fluids from deeper sediments to the BGHSZ to form gas hydrate.
Morphological Characteristics of Pockmarks
Pockmarks generally indicate upward migration of gas and fluid with a subsurface deformation feature. Different types of pockmarks have been described using the seismic data and multibeam bathymetry map in the study area (Sun et al., 2011; Sun et al., 2013; Chen et al., 2015; Lu et al., 2017), which are associated with various fluid flow features and structures. The seismic reflection data and the coherence attributes along the seafloor suggest that more than 19 pockmarks are developed with different geometric shapes, including the circular, elliptical, crescents, elongated, or composite types with different diameters and depths (Figures 1, 5A; Table 1). Most of the pockmarks are asymmetrical in plain view. The long axis diameters of the pockmarks range from 3.5 to 10 km, and the short axis diameters range from 0.9 to 6.6 km, with a maximum diameter in excess of 10 km and a depth up to 289 m, lying on the seafloor with V- and U-shaped structures on the seismic profiles. The ratio of long and short axis ranges from 1 to 7.8, pockmarks with large ratio located around the slope belt. In addition, the average water depth of the pockmark-developed area is around 1400 m.
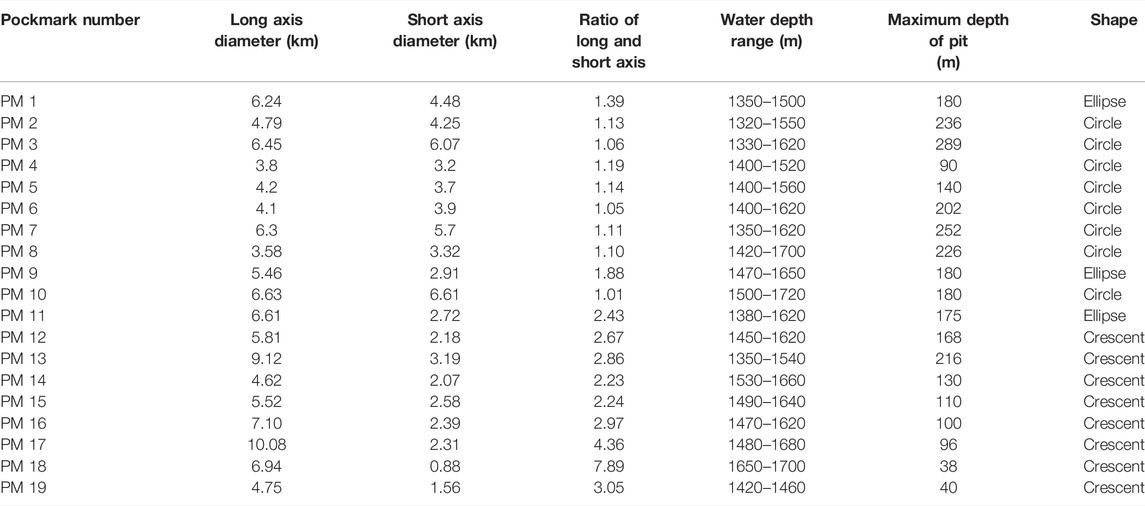
TABLE 1. Summary of morphometrics of the studied pockmarks.
The coherence slices along horizons can illustrate the pockmarks better than coherence slices with a specific time. The coherence slices along the seafloor and horizon T1 are extracted, respectively (Figures 5, 6), which indicate that the modern seafloor pockmarks can be traced back to the T1 layer, and most of the pockmarks have an obvious inheritance. Based on the morphological characteristics and the relationship with BSR and faults, which can be classified into four categories (Figure 7): Type 1 is the paleo-pockmarks developed on the T1 layer, which have continuity with the seafloor pockmarks. High amplitude reflections can be observed within the pockmarks, indicating the gas release along pockmarks. The HAAs show the pull-down reflection, and the faults are developed. BSRs are continuous and have a strong amplitude. There is no BSR under the pockmarks, but there are apparent HAAs and BSR reflections at the adjacent strata around the pockmarks; Type 2 is the buried pockmarks formed at horizon T1, and it is difficult to identify the pockmark at the seafloor. The pull-down reflections are very clear due to fluids migrated along the polygonal faults and faults developed in the deep sediments. The pockmark may be caused by the fluids due to the formation of polygonal faults and cause the dissociation of gas hydrate; Type 3 is that the seismic sections suggest that the pockmarks occur at the seafloor and are not formed along with horizon T1. It is the boundary of the crescent pockmark. The scale of the pockmark is significantly larger than the paleo-pockmarks generated at horizon T1, and the seismic section cannot cover the overall perspective of the pockmark, which is consistent with Type 1; Type 4 is matured larger pockmarks associated with BSRs and HAAs developed at the flank of the pockmark. The formation of pockmarks may be related to the activity of faults and volcanoes. HAAs can be seen inside the pockmark, and partial collapse and deformation are also observed due to subsidence.
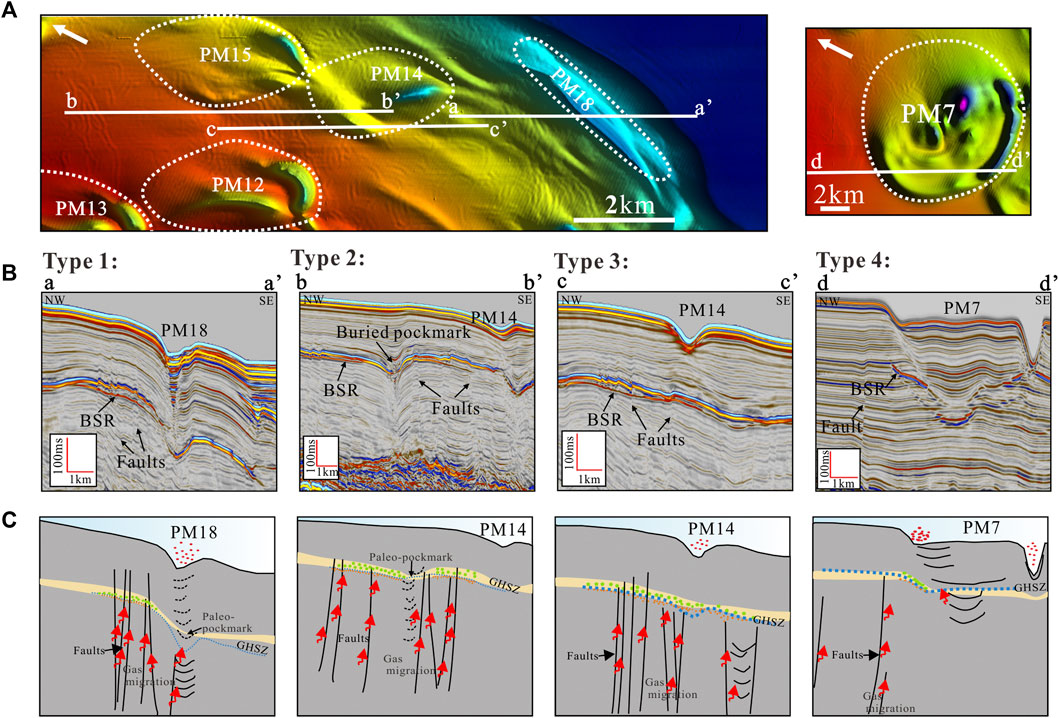
FIGURE 7. (A) Detailed map of the represented pockmarks. (B)–(C) The seismic sections and conceptual view of the four types of pockmarks in the 3D study area, showing the relationship between the pockmarks, faults, and gas hydrate.
Interplay of Gas Hydrate, Pockmarks, Volcanoes, and Faults
Widely developed polygonal faults have been found from the coherence slices of 3D seismic data that were mainly formed in Miocene and Pliocene strata (Figure 5). Several tectonic faults can affect the layer containing polygonal faults, but the polygonal faults of the entire region show the variable strikes and different maturity of the fault networks (Figure 8). The planform geometry of polygonal faults may be influenced by the local stress anisotropy, local structures, or changes in lithology (Cartwright, 2011).
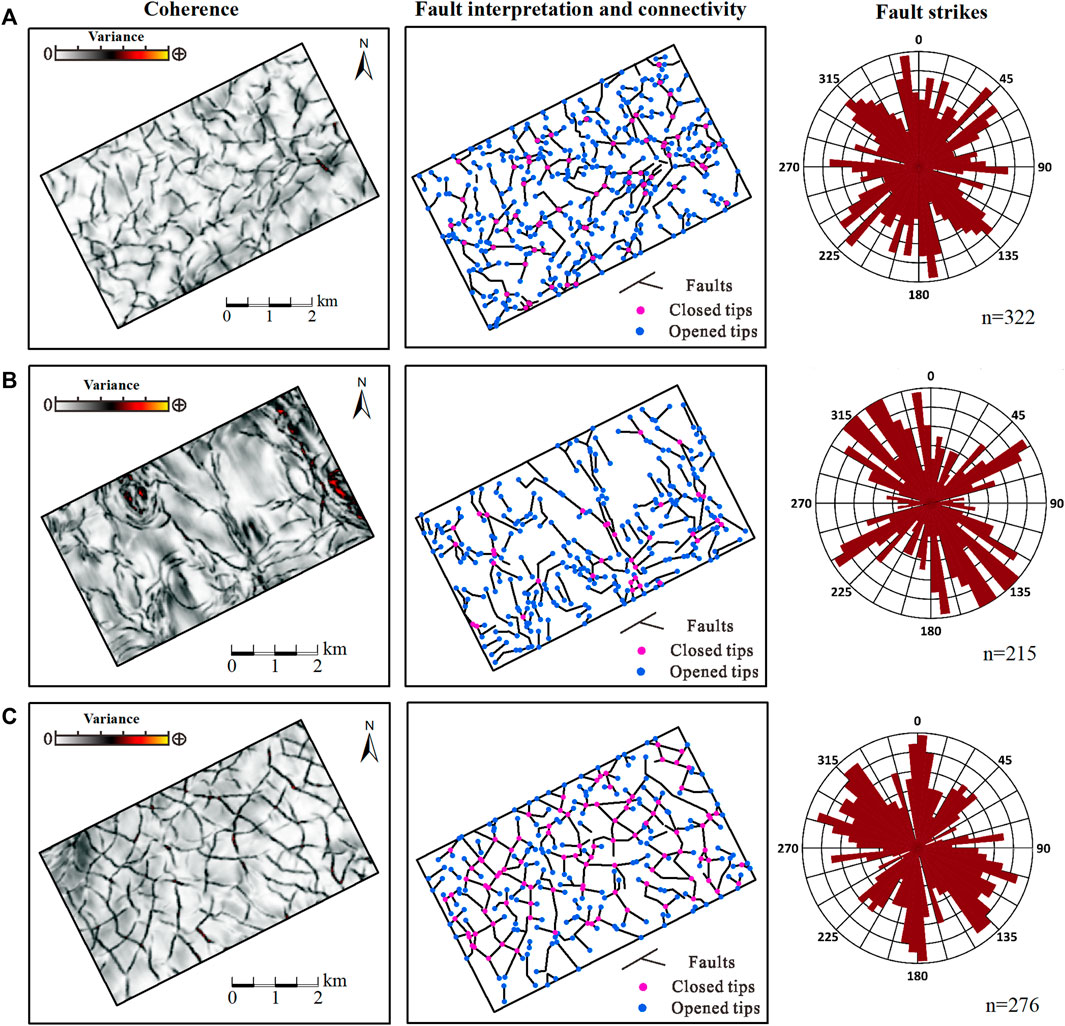
FIGURE 8. (A)–(C) The coherence slices along horizons T2, fault interpretation and connectivity, rose diagram of the fault strikes for areas A, B, and C, respectively. The locations are shown in Figure 5C. The coherence slices showing the fault system. In the fault interpretation and connectivity map: The pink solid dots mark the closed tips of the faults, the blue solid dots mark the opened tips of the faults, the degree of maturity refers to the number of ‘open’ versus ‘closed’ or restricted lateral tips.
We choose three representative areas to show the differences of the strikes, maturity, and the role on fluid flow (Figure 8). The strikes of zone 1 are complex and have several directions, and those of zone 3 focus on two main directions. The maturity of zone 1 is 0.16, which is lower than that of zone 3 with a value of 0.33 due to the differences in lithology, temperature, compaction, and consolidation processes during burial, which indicates that the polygonal faults have plenty of space to grow. The strikes and geometry in zone 2 changed significantly due to the pockmark formation indicating that the orthogonality is reduced. The formations of pockmarks changed the slope gradient, which can influence the directionality of polygonal faults. The strikes of polygonal faults are changed into a ring or radial planform array surrounding the pockmarks. The HAAs show continuous reflection in lateral except at the pockmarks with weak and pull-down reflections. Moreover, HAAs show a high value where some faults are terminated below the HAAs (Figure 9). The pockmarks show irregular and distorted shapes due to the dissociation of gas hydrate formed in T1 horizon, especially at the small-scale pockmarks or buried pockmarks.
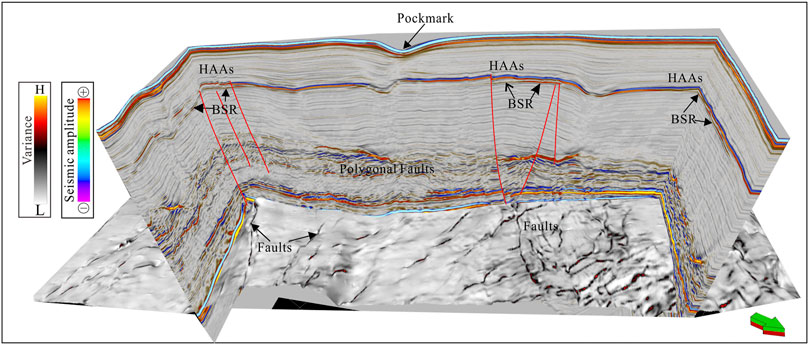
FIGURE 9. 3D perspective view of the coherence slice map of the T5 horizon shows the normal fault formed by tectonics combined with the cross-sections. The BSRs and high amplitude anomalies (HAAs) have been identified.
Volcanoes have been identified from the seismic sections, coherence, and amplitude slice attributes of the seismic data in the study area (Figures 5, 10). The pockmarks show a low coherence value and chaotic, low, or medium amplitude anomalies, with cone or subcone shape in seismic sections. The features of the volcano intensely reconstruct and penetrate the overlying sediments, and partial volcanoes are located beneath the pockmarks (Figure 10B). The diameter of the volcanoes could reach more than 1 km, and their roots could be reached to very deep intervals, and some pockmarks are rooted on them (Figure 10).
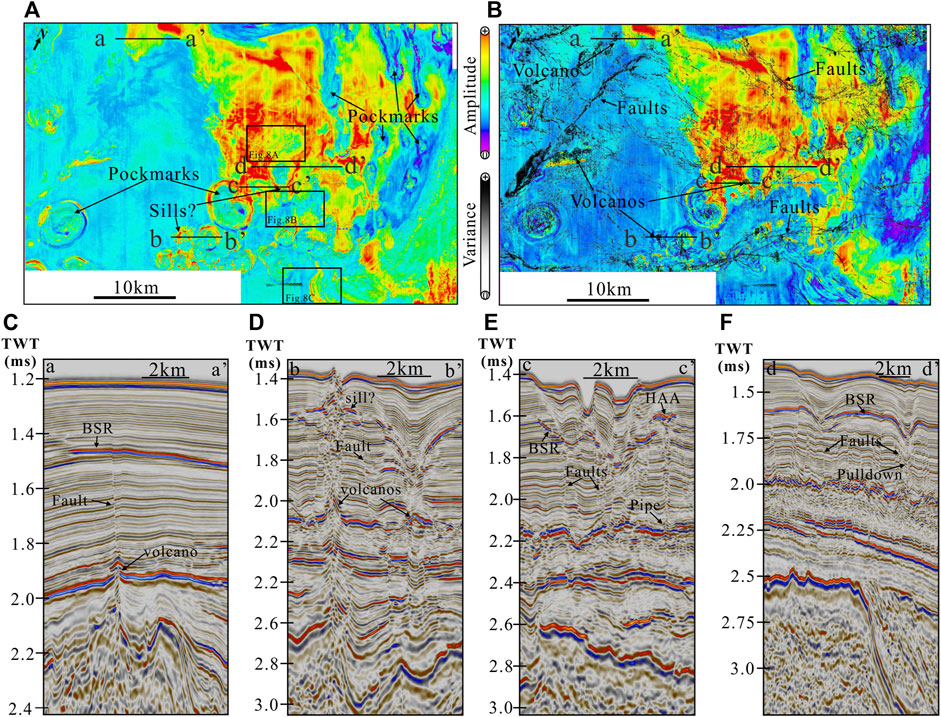
FIGURE 10. (A) Maximum amplitude attribute maps extracted from horizon T1 with a time window of 50 ms showing variations of amplitude. (B) The overlay map of maximum amplitude attribute extracted along horizon T1 within a time window of 50 ms and coherence slice along horizon T5, showing the distribution of the HAAs and deeper faults. (C–F) Showing seismic profiles of a-a′, b-b′, c-c′, and d-d′, respectively, and the seismic characteristics of BSR, faults, and volcanoes have been indicated at each section.
The spatial distributions of HAAs, pockmarks, polygonal faults, tectonic faults associated with uplift, and volcanism show the spatial relationship between them (Figure 10A,B). Some faults are formed above the volcano, which can arrive at HAAs (Figure 10C). Several volcanoes or pipes are found around or the edge of pockmarks in the study area, which are important focused fluid flow pathways for the expulsion of liquid, gas, and sediment to the shallow deposition. The obvious pull-up and chaotic, weak reflections are found in the deeper layers and high amplitude at the shallow layer (Figure 10D). At large-scale or circle pockmarks, the HAAs are observed around or internal the pockmarks seen from the maximum amplitude attribute along with T1 (Figure 10D–F). Therefore, polygonal faults, tectonic faults, volcanoes, and pipes originating from deeper layers provide fluid pathways for deep gas upward migration into the upper sedimentary layer to form gas hydrate.
Discussion
Variations of BSR and High Amplitude Anomalies
Gas hydrates related to BSRs are widely distributed in the Zhongjiannan basin (Lu et al., 2017; Li et al., 2022). The BSR shows the continuous, moderate, and extensive distribution on the platform and patches and high amplitude interrupted by pockmarks at the edge of the platform (Figure 10). High amplitude reflection just above the BGHSZ is an indicator of the elevated gas hydrate-bearing layer, which is similar to that found in the Shenhu area, South China Sea (Wang et al., 2016; Wang et al., 2021). However, the characteristics of the gas hydrate-bearing layer in the Zhongjiannan basin is quite different from that found in the Pearl River Mouth Basin. The gas hydrate layer in the study area is more continuous and larger, showing that lithology controls HAAs except for the pockmark area. The gas hydrate layer can extend tens of kilometers without being interrupted (Figures 3, 4). Moreover, the gas hydrate layer varies from the seafloor depth, and the shallow water area has a greater depth, which indicates that the occurrence of gas hydrate is not only controlled by the temperature–pressure condition. Gas hydrate distribution found in other basins, and SCS has poor spatial continuity and appears to be patched due to the influence of reservoir, fluid flow, and other factors. The gas hydrate-related BSR is usually characterized by strong amplitude, negative polarity, roughly parallel to the seafloor, and a cross-cutting seismic reflector. However, the diagenesis-related BSRs result from the positive acoustic impedance contrast between silicate rich sediments of different diagenetic stages opal A, opal CT, and quartz conversions, and the temperature is about 35–50°C (Hein et al., 1978; Hein et al., 2010) or 45–50°C (Kastner et al., 1977; Keller and Isaacs, 1985) triggered by different factors (e.g., Cartwright, 2011; Davies and Ireland, 2011), which have been widely found in the mid-Norwegian margin (Berndt et al., 2005), southern South Korea Plateau, East Sea (Lee et al., 2003), and South China Sea (Wang et al., 2010; Han et al., 2016; Lu et al., 2017). The geothermal gradient in this area is about 55°C/km; the BSR depth is about 220 m by assuming an average P-wave velocity of 1700 m/s, and the temperature is about 17°C, which indicates that the temperature at the interpreted BSR is difficult to cause the transition between opal A/opal CT. Therefore, the depth range of the BSR is within the temperature–pressure condition and supports gas hydrate-related BSR.
The inverted acoustic impedance profile also shows high values in the HAA area, and the maximum values occur at different intervals (Figure 4). Some appear just above the BSR and some at a distance above the BSR, which is interrupted by the occurrence of pockmarks. We found that most of pockmarks are related to HAA and HAA are related to lithology change. However, sand-rich coarse-grained reservoirs developed in the deepwater marine depositional system also showed HAAs, which are easily to form gas hydrates, such as in the Gulf of Mexico (Boswell et al., 2012; Collett and Boswell, 2012), Nankai Trough (Fujii et al., 2015; Suzuki et al., 2015; Yamamoto, 2015), Ulleung basin (Bahk et al., 2011; Kim et al., 2011), Krishna-Godavari basin (Kumar et al., 2016), and South China Sea (e.g., Wang et al., 2014b; Zhong et al., 2017; Kang et al., 2018; Li et al., 2019). Even if the lithology of carbonates is assumed, the calculated gas hydrate saturation still comes to 20–40% of the pore space. The fine-grained sediments more than a kilometer thick below BGHSZ are the biogenic gas zone. The widely distributed polygonal faults identified from coherence slices are just located below the BGHSZ with different offsets and maturity, which act as the fluid migration pathways from deeper sediments. Therefore, the gas hydrate-bearing layer is controlled by faults and lithology, indicating the contribution of gas migrated from deeper sediments below BGHSZ.
The maximum amplitude and RMS amplitude attributes extracted from horizon T1 and BGHSZ within a 50 ms time window show the distributions of HAAs associated with gas hydrate (Figure 10). The distribution of high amplitude values identified from BGHSZ is smaller than that extracted from the T1 horizon (Figure 10). Many reasons can cause this phenomenon, such as structure II gas hydrate (Sloan and Koh, 2007; Kida et al., 2006; Lu et al., 2007; Bourry et al., 2009; Kida et al., 2009; Klapp et al., 2010), rapid sedimentation (Hornbach et al., 2008; Zander et al., 2018; Han et al., 2021), and hot fluid. At the same geological condition, the base of the structure II hydrate stability zone will be deeper than that of BGHSZ (Sloan and Koh, 2007). The seismic profile shows that HAA is deeper on the platform, where water depth is slightly shallower than that of the edge of the platform. The tectonic faults extend to the HAA layer, which can transport thermogenic gas from deeper sediment to BGHSZ (Figure 10B). Rapid sedimentation will cause the thicker BGHSZ, which has been found in the Black Sea (Zander et al., 2018), Hikurangi margin (Pecher et al., 2017; Han et al., 2021), and Blake Ridge (Hornbach et al., 2008). The sedimentation at the platform is thicker than that of the edge of the platform, where many pockmarks are formed. The formation of pockmarks also indicates the variation of fluid activity, which can cause slightly shallower BGHSZ. Therefore, the variations of HAAs are caused by the occurrence of gas hydrate showing the difference of gas hydrate saturation and the changes of the geological environment. In the future, gas hydrate drilling expedition should be conducted to confirm the distribution and the controlling factors.
Gas Hydrate Accumulation Influenced by Fluid Migration and Pockmarks
Evidence about geological controls on gas hydrate accumulation was summarized through a combination of the fluid migration pathways from coherence slice, the reservoir from RMS amplitude attributes, and pressure–temperature. Figure 11 is a 3D display showing the occurrence of gas hydrate, the faults identified from T2 and T5 horizons, and the basement structural form interpreted from 3D seismic data. Previous studies have shown that the polygonal faults, normal faults, and volcanic activity contribute to the formation of gas hydrate, which provides the fluid migration pathways (Xia et al., 2022). Our study supports this founding about fluid migration. However, we also found that the coupling of lithology and timing of hydrocarbon gas release is very important for the widely distributed gas hydrate in the study area. The tectonic faults rooted from basement uplift provide the pathways for thermogenic gas, while the polygonal faults developed in the strata between T5 and T1 not only increase the permeability of fine-grained sediments but also act as hydrocarbon gas pathways for the vertical migration. Cases of polygonal faults transporting fluids have been applied in the Lower Congo Basin (Gay et al., 2006), Norway continental margin (Berndt et al., 2003; Hustoft et al., 2007), and Scotian slope of the eastern Canada continental margin (Cullen et al., 2008). The RMS and maximum amplitude attributes clearly show the relationship between the BSRs, pockmarks, and different types of faults developed in this area (Figures 9, 10). The development density of faults is directly related to the BSR amplitude strength. From the gas hydrate saturation profile (Figure 4), the relative enrichment gas hydrate-bearing layer is controlled by faults. Even if the gas hydrate layer is above the BGHSZ, the gas hydrate saturation is still higher due to the influence of faults. It can play a crucial role in migrating upward fluids from the deep strata to the shallow favorable gas hydrate-bearing layer. The detailed seismic data interpretation shows that the fluid migration pathways mainly include normal faults, polygonal faults, regional unconformity, and pockmarks (Figures 10, 11).
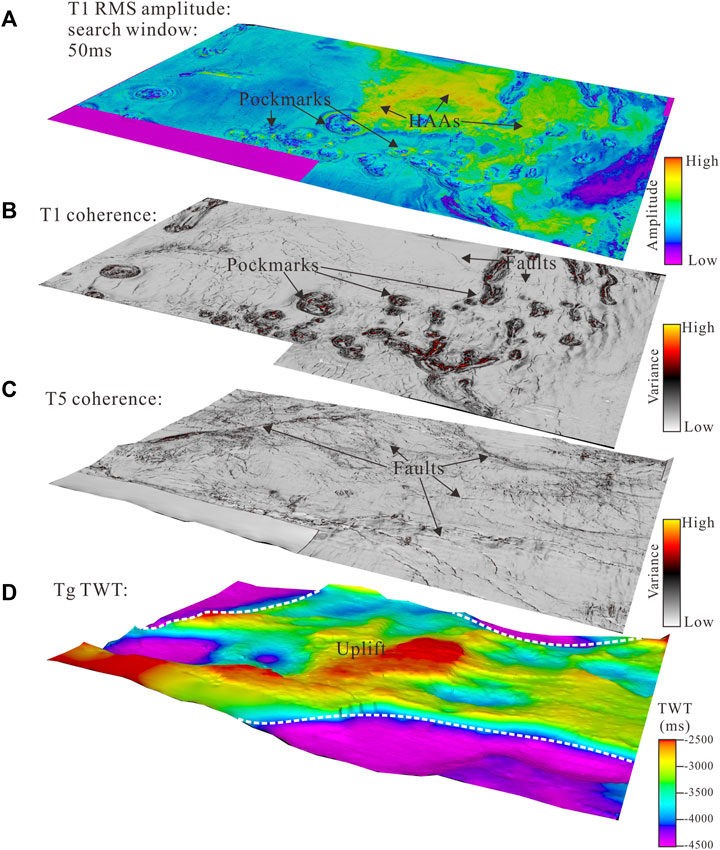
FIGURE 11. (A) RMS amplitude map extracted from horizon T1 with a time window of 50 ms. (B) Coherence slice extracted along horizon T1 showing the distribution of faults and pockmarks. (C) Coherence slice along the horizon T5 showing the distribution of normal faults originated from the basement (D) The isochronal map of horizon Tg showing the lower uplift.
Based on the comprehensive analysis of coherence, amplitude, and acoustic impedance attributes, we propose a schematic model to explain the accumulations and occurrence of gas hydrates and their relationship with pockmarks and different faults (Figure 12). Different types of pockmarks have been found by previous studies, which indicate the fluids’ seep in the Zhongjiannan basin (Sun et al., 2011; Sun et al., 2013; Lu et al., 2017; Chen et al., 2018). There are various mechanisms triggered by fluid advection, salt-tectonic faulting, and gas hydrate dynamics. Even though pockmarks have different patterns, we found that almost all of the pockmarks originate from just below the T1 horizon or below the BSR. The widely distributed BSRs are interrupted by the presence of pockmarks. There are two types of pockmarks triggered by different reasons. Type 1 pockmarks such as Pockmark number six are relatively mature, larger circle pockmarks that are related to the magmatic intrusion or the fault reactivation due to tectonic activity (Figure 10). The extensional role due to the pull-up caused by magmatic activities can produce faults and slumps. The fluids can migrate to seafloor along pathways of faults and volcanoes and form pockmarks. When volcanic activity stops, the strata cool and the crater area collapses downward, which will make the formation of pockmarks. Partial HAAs are found around or within the pockmarks. Type 2 pockmarks are triggered due to the dissociation of gas hydrate caused by tectonic activity. Gas hydrates with elevated saturation are formed at the T1 horizon due to plenty of gas migrated along polygonal faults and tectonic faults and new sedimentation. However, the equilibrium conditions, such as temperature and pressure, for gas hydrate formation may be destroyed due to hot fluids migrated along faults, which will cause the dissociation of gas hydrate, with seafloor subsidence in matured Type 4 pockmarks. BGHSZ shifts upward and becomes shallower under new temperature and pressure balance conditions. The gas generated from deep thermogenic gas and gas hydrate dissociation continues to migrate. Hydrate-related BSRs and HAAs will gradually develop and intersect with the normal sedimentary formation. The BSR will be discontinuous due to gas hydrate dissociation, and the dissociated gas will release to the seafloor along the pockmarks (Figure 12). Therefore, we suggest that thermogenic gas generated in the deeper sediments can migrate to the shallower sediments along faults, volcanoes, and pipes. The biogenic gas generated in Miocene and Pliocene strata can migrate to shallower sediments along these pathways and polygonal faults. The mixed gas sources contribute to the accumulation of gas hydrate at the favorable reservoir.
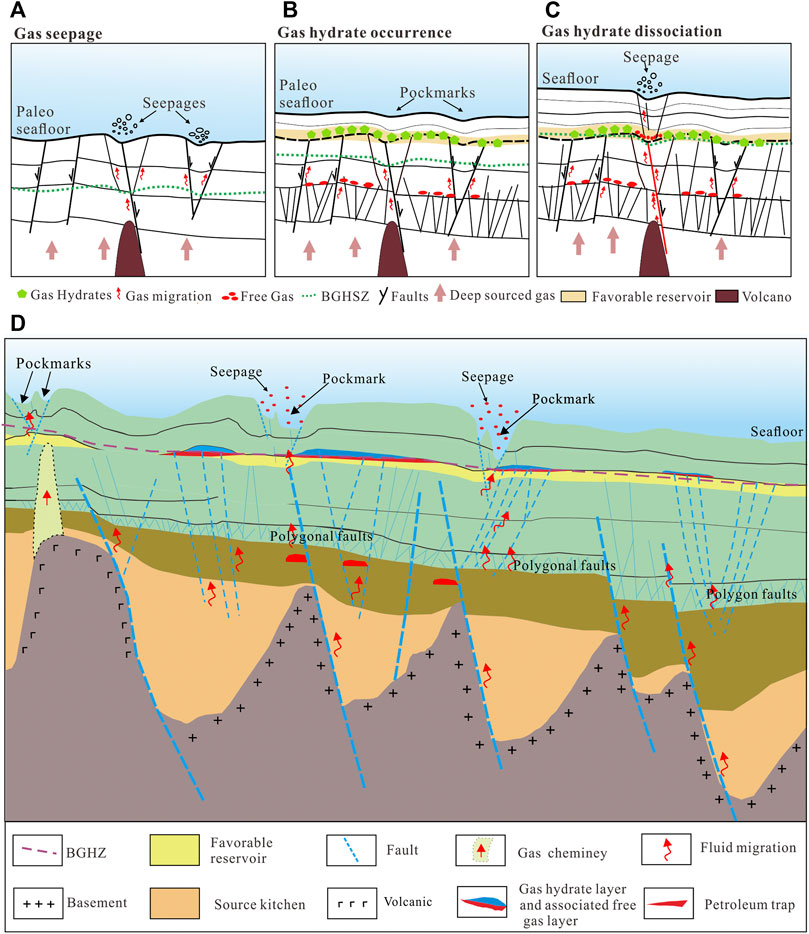
FIGURE 12. (A)–(C) Conceptual model of development of pockmarks controlled by magmatic activity and gas hydrate dissociation below gas hydrate stability throughout heat flux or fault reactivation from the deep. The scenario is composed of three phases (A,B,C). (D)Schematic model map in the study area of the Zhongjiannan basin showing the relationship among gas reservoir, polygonal faults, shallow gas accumulations, BSR, pockmarks, volcano, gas hydrates, and associated free gas.
Conclusion
We use the reprocessed, high-resolution 3D seismic data and seismic attributes to reveal the widely distributed BSRs, HAAs, and pockmarks in the Zhongjiannan basin. The wide and continuous distributions of HAAs are caused by the elevated gas hydrate saturation occurred above the BGHSZ. Since the Miocene, the sediments in the Zhongjiannan basin have been dominated by the fine-grained deposits. Abundance polygonal faults are triggered thermally due to magmatic activity and sedimentation, which can serve as the fluid migration pathways and change the reservoir properties. Fluids with hydrocarbon gas can migrate upward along faults, polygonal faults, and volcanoes to BGHSZ. The HAAs with high acoustic impedance varies from the seafloor depth, and the BSR controlled by faults and sedimentary layer shows gas hydrate occurrence. The HAAs are widely distributed and laterally continuous near the base of gas hydrate stability with a thickness ranging from 20 m to more than 50 m. Faults control the thicker gas hydrate layer, and the continuity is interrupted by the occurrence of pockmarks. Moreover, some pockmarks may be triggered by the dissociation of gas hydrate dissociation. Gas hydrate accumulation is related to magmatic activities, faults, and structural uplift. In the future, gas hydrate drilling expedition should be conducted to confirm the widely, continuous distributed gas hydrate.
Data Availability Statement
The original contributions presented in the study are included in the article/supplementary material; further inquiries can be directed to the corresponding authors.
Author Contributions
GZ and XW contributed to the conception and design of the work and write the drafted manuscript. LL, YG, and YL contributed to the data acquisition and interpretation. LS, WL, JQ, WW, and TY contributed to data analysis and interpretation. ZW and JQ processed the seismic data, and XW inverted the acoustic impedance data for the manuscript. All authors contributed to review and improve the article and approved the submitted version.
Funding
This research was jointly supported by the Shandong Special Fund of Pilot National Laboratory for Marine Science and Technology (Qingdao) (No.2021QNLM020002) and the National Natural Science Foundation of China (Grant No. 42076219), the China Academy of Petroleum Exploration and Development (2019B-4909) and WL is funded by the CAS Pioneer Hundred Talents Program.
Conflict of Interest
The authors declare that the research was conducted in the absence of any commercial or financial relationships that could be construed as a potential conflict of interest.
Publisher’s Note
All claims expressed in this article are solely those of the authors and do not necessarily represent those of their affiliated organizations, or those of the publisher, the editors and the reviewers. Any product that may be evaluated in this article, or claim that may be made by its manufacturer, is not guaranteed or endorsed by the publisher.
References
Bahk, J.-J., Um, I.-K., and Holland, M. (2011). Core Lithologies and Their Constraints on Gas-Hydrate Occurrence in the East Sea, Offshore Korea: Results from the Site UBGH1-9. Mar. Petroleum Geol. 28, 1943–1952. doi:10.1016/j.marpetgeo.2010.12.003
Berndt, C., Bünz, S., and Mienert, J. (2003). Polygonal Fault Systems on the Mid-Norwegian Margin: a Long-Term Source for Fluid Flow. Geol. Soc. Lond. Spec. Publ. 216, 283–290. doi:10.1144/GSL.SP.2003.216.01.18
Berndt, C., Mienert, J., Vanneste, M., and Bünz, S. (2005). in Gas Hydrate Dissociation and Sea-Floor Collapse in the Wake of the Storegga Slide, Norway. Editors B. T. G. Wandås, J. P. Nystuen, E. Eide, and F. Gradstein (Amsterdam: Elsevier), 285–292. Norwegian Petroleum Society (NPF) Special Publication, 12. doi:10.1016/S0928-8937(05)80055-4
Boswell, R., Collett, T. S., Frye, M., Shedd, W., Mcconnell, D. R., and Shelander, D. (2012). Subsurface Gas Hydrates in the Northern Gulf of Mexico. Mar. Petroleum Geol. 34, 4–30. doi:10.1016/j.marpetgeo.2011.10.003
Bourry, C., Chazallon, B., Charlou, J. L., Pierre Donval, J., Ruffine, L., Henry, P., et al. (2009). Free Gas and Gas Hydrates from the Sea of Marmara, Turkey. Chem. Geol. 264, 197–206. doi:10.1016/j.chemgeo.2009.03.007
Cartwright, J. (2011). Diagenetically Induced Shear Failure of Fine-Grained Sediments and the Development of Polygonal Fault Systems. Mar. Petroleum Geol. 28, 1593–1610. doi:10.1016/j.marpetgeo.2011.06.004
Cartwright, J., Huuse, M., and Aplin, A. (2007). Seal Bypass Systems. Bulletin 91, 1141–1166. doi:10.1306/04090705181
Cartwright, J., James, D., and Bolton, A. (2003). The Genesis of Polygonal Fault Systems: a Review. Geol. Soc. Lond. Spec. Publ. 216, 223–243. doi:10.1144/gsl.sp.2003.216.01.15
Chen, F., Su, X., Lu, H., Zhou, Y., and Zhuang, C. (2013). Relations between Biogenic Component (Foraminifera) and Highly Saturated Gas Hydrates Distribution from Shenhu Area, Northern South China Sea. Earth Sci. China Univ. Geosci. 38, 907–915. doi:10.3799/dqkx.2013.089
Chen, J., Song, H., Guan, Y., Yang, S., Pinheiro, L. M., Bai, Y., et al. (2015). Morphologies, Classification and Genesis of Pockmarks, Mud Volcanoes and Associated Fluid Escape Features in the Northern Zhongjiannan Basin, South China Sea. Deep Sea Res. Part II Top. Stud. Oceanogr. 122, 106–117. doi:10.1016/j.dsr2.2015.11.007
Chen, J., Song, H., Guan, Y., Pinheiro, L. M., and Geng, M. (2018). Geological and Oceanographic Controls on Seabed Fluid Escape Structures in the Northern Zhongjiannan Basin, South China Sea. J. Asian Earth Sci. 168, 38–47. doi:10.1016/j.jseaes.2018.04.027
Collett, T. S., and Boswell, R. (2012). Resource and Hazard Implications of Gas Hydrates in the Northern Gulf of Mexico: Results of the 2009 Joint Industry Project Leg II Drilling Expedition. Mar. Petroleum Geol. 34, 1–3. doi:10.1016/j.marpetgeo.2012.01.002002
Collett, T. S., Johnson, A. H., Knapp, C. C., Boswell, R., Energy, N., and Virginia, W. (2009). Natural Gas Hydrates: A Review. AAPG Mem. 89, 146–219. doi:10.1306/13201101M891602
Cullen, J., Mosher, D. C., and Louden, K. (2008). “The Mohican Channel Gas Hydrate Zone , Scotian Slope : Geophysical Structure,” in Proceedings of the 6th International Conference on Gas Hydrates (ICGH 2008), Vancouver, British Columbia, CANADA, July 2008.
Davies, R. J., and Ireland, M. T. (2011). Initiation and Propagation of Polygonal Fault Arrays by Thermally Triggered Volume Reduction Reactions in Siliceous Sediment. Mar. Geol. 289, 150–158. doi:10.1016/j.margeo.2011.05.005
de Prunelé, A., Ruffine, L., Riboulot, V., Peters, C. A., Croguennec, C., Guyader, V., et al. (2017). Focused Hydrocarbon-Migration in Shallow Sediments of a Pockmark Cluster in the Niger Delta (Off Nigeria). Geochem. Geophys. Geosyst. 18, 93–112. doi:10.1002/2016GC006554
Fujii, T., Suzuki, K., Takayama, T., Tamaki, M., Komatsu, Y., Konno, Y., et al. (2015). Geological Setting and Characterization of a Methane Hydrate Reservoir Distributed at the First Offshore Production Test Site on the Daini-Atsumi Knoll in the Eastern Nankai Trough, Japan. Mar. Petroleum Geol. 66, 310–322. doi:10.1016/j.marpetgeo.2015.02.037
Gay, A., Lopez, M., Cochonat, P., Séranne, M., Levaché, D., and Sermondadaz, G. (2006). Isolated Seafloor Pockmarks Linked to BSRs, Fluid Chimneys, Polygonal Faults and Stacked Oligocene-Miocene Turbiditic Palaeochannels in the Lower Congo Basin. Mar. Geol. 226, 25–40. doi:10.1016/j.margeo.2005.09.018
Han, J., Leng, J., and Wang, Y. (2016). Characteristics and Genesis of the Polygonal Fault System in Southern Slope of the Qiongdongnan Basin, South China Sea. Mar. Petroleum Geol. 70, 163–174. doi:10.1016/j.marpetgeo.2015.11.022
Han, S., Bangs, N. L., Hornbach, M. J., Pecher, I. A., Tobin, H. J., and Silver, E. A. (2021). The Many Double BSRs across the Northern Hikurangi Margin and Their Implications for Subduction Processes. Earth Planet. Sci. Lett. 558, 116743. doi:10.1016/j.epsl.2021.116743
Hein, J. R., Scholl, D. W., Barron, J. A., Jones, M. G., and Miller, J. (1978). Diagenesis of Late Cenozoic Diatomaceous Deposits and Formation of the Bottom Simulating Reflector in the Southern Bering Sea*. Sedimentology 25, 155–181. doi:10.1111/j.1365-3091.1978.tb00307.x
Hein, J. R., Scholl, D. W., Barron, J. A., Jones, M. G., and Miller, J. (2010). Diagenesis of Late Cenozoic Diatomaceous Deposits and Formation of the Bottom Simulating Reflector in the Southern Bering Sea. Sedimentology 25, 155–181. doi:10.1111/j.1365-3091.1978.tb00307.x
Helgerud, M. B., Dvorkin, J., Nur, A., Sakai, A., and Collett, T. (1999). Elastic-wave Velocity in Marine Sediments with Gas Hydrates: Effective Medium Modeling. Geophys. Res. Lett. 26, 2021–2024. doi:10.1029/1999GL900421
Hornbach, M. J., Saffer, D. M., Holbrook, W. S., Van Avendonk, H. J. A., and Gorman, A. R. (2008). Three-dimensional Seismic Imaging of the Blake Ridge Methane Hydrate Province: Evidence for Large, Concentrated Zones of Gas Hydrate and Morphologically Driven Advection. J. Geophys. Res. 113, 1–15. doi:10.1029/2007JB005392
Hovland, M., Svensen, H., Forsberg, C. F., Johansen, H., Fichler, C., Fosså, J. H., et al. (2005). Complex Pockmarks with Carbonate-Ridges off mid-Norway: Products of Sediment Degassing. Mar. Geol. 218, 191–206. doi:10.1016/j.margeo.2005.04.005
Hustoft, S., Mienert, J., Bünz, S., and Nouzé, H. (2007). High-resolution 3D-Seismic Data Indicate Focussed Fluid Migration Pathways above Polygonal Fault Systems of the Mid-Norwegian Margin. Mar. Geol. 245, 89–106. doi:10.1016/j.margeo.2007.07.004
Jiangong Wei, J., Liang, J., Lu, J., Zhang, W., and He, Y. (2019). Characteristics and Dynamics of Gas Hydrate Systems in the Northwestern South China Sea - Results of the Fifth Gas Hydrate Drilling Expedition. Mar. Petroleum Geol. 110, 287–298. doi:10.1016/j.marpetgeo.2019.07.028
Kang, D., Liang, J., Kuang, Z., Lu, J., Guo, Y., Liang, J., et al. (2018). Application of Elemental Capture Spectroscopy Logging in Hydrate Reservoir Evaluation in the Shenhu Sea Area. Nat. Gas. Ind. 38, 54–60. doi:10.3787/j.issn.1000-0976.2018.12.006
Kastner, M., Keene, J. B., and Gieskes, J. M. (1977). Diagenesis of Siliceous Oozes-I. Chemical Controls on the Rate of Opal-A to Opal-CT Transformation-An Experimental Study. Geochim. Cosmochim. Acta 41, 1041–1059. doi:10.1016/0016-7037(77)90099-0
Keller, M. A., and Isaacs, C. M. (1985). An Evaluation of Temperature Scales for Silica Diagenesis in Diatomaceous Sequences Including a New Approach Based on the Miocene Monterey Formation, California. Geo-Marine Lett. 5, 31–35. doi:10.1007/BF02629794
Kida, M., Khlystov, O., Zemskaya, T., Takahashi, N., Minami, H., Sakagami, H., et al. (2006). Coexistence of Structure I and II Gas Hydrates in Lake Baikal Suggesting Gas Sources from Microbial and Thermogenic Origin. Geophys. Res. Lett. 33, 10–13. doi:10.1029/2006GL028296
Kida, M., Suzuki, K., Kawamura, T., Oyama, H., Nagao, J., Ebinuma, T., et al. (2009). Characteristics of Natural Gas Hydrates Occurring in Pore-Spaces of Marine Sediments Collected from the Eastern Nankai Trough, off Japan. Energy fuels.. 23, 5580–5586. doi:10.1021/ef900612f
Kim, G. Y., Yi, B. Y., Yoo, D. G., Ryu, B. J., and Riedel, M. (2011). Evidence of Gas Hydrate from Downhole Logging Data in the Ulleung Basin, East Sea. Mar. Petroleum Geol. 28, 1979–1985. doi:10.1016/j.marpetgeo.2011.01.011
Klapp, S. A., Murshed, M. M., Pape, T., Klein, H., Bohrmann, G., Brewer, P. G., et al. (2010). Mixed Gas Hydrate Structures at the Chapopote Knoll, Southern Gulf of Mexico. Earth Planet. Sci. Lett. 299, 207–217. doi:10.1016/j.epsl.2010.09.001
Kumar, P., Collett, T. S., Vishwanath, K., Shukla, K. M., Nagalingam, J., Lall, M. V., et al. (2016). Gas Hydrate-Bearing S and Reservoir Systems in the Offshore of India : Results of the India National Gas Hydrate Program Expedition 02. Fire Ice 16, 1–8.
Lai, H., Fang, Y., Kuang, Z., Ren, J., Liang, J., Lu, J. a., et al. (2021). Geochemistry, Origin and Accumulation of Natural Gas Hydrates in the Qiongdongnan Basin, South China Sea: Implications from Site GMGS5-W08. Mar. Petroleum Geol. 123, 104774. doi:10.1016/j.marpetgeo.2020.104774
Laurent, D., Gay, A., Baudon, C., Berndt, C., Soliva, R., Planke, S., et al. (2012). High-resolution Architecture of a Polygonal Fault Interval Inferred from Geomodel Applied to 3D Seismic Data from the Gjallar Ridge, Vøring Basin, Offshore Norway. Mar. Geol. 332-334, 134–151. doi:10.1016/j.margeo.2012.07.016
Lee, G. H., Kim, H.-J., Jou, H.-T., and Cho, H.-M. (2003). Opal-A/opal-CT Phase Boundary Inferred from Bottom-Simulating Reflectors in the Southern South Korea Plateau, East Sea (Sea of Japan). Geophys. Res. Lett. 30, 1–4. doi:10.1029/2003GL018670
Lee, M. W., and Collett, T. S. (2009). Gas Hydrate Saturations Estimated from Fractured Reservoir at Site NGHP-01-10, Krishna-Godavari Basin, India. J. Geophys. Res. 114, 1–13. doi:10.1029/2008JB006237
Lee, M. W., and Waite, W. F. (2008). Estimating Pore-Space Gas Hydrate Saturations from Well Log Acoustic Data. Geochem. Geophys. Geosyst. 9, a–n. doi:10.1029/2008GC002081
Li, S., Suo, Y., Liu, X., Dai, L., Yu, S., Zhao, S., et al. (2013). Basic Strcutural Pattern and Tectonic Models of the South China Sea: Problems, Advances and Controversies. Mar. Geol. Quat. Geol. 32, 35–53. doi:10.3724/sp.j.1140.2012.06035
Li, J.-f., Ye, J., Qin, X.-w., Qiu, H.-j., Wu, N.-y., Lu, H.-l., et al. (2018). The First Offshore Natural Gas Hydrate Production Test in South China Sea. China Geol. 1, 5–16. doi:10.31035/cg2018003
Li, J., Lu, J. a., Kang, D., Ning, F., Lu, H., Kuang, Z., et al. (2019). Lithological Characteristics and Hydrocarbon Gas Sources of Gas Hydrate-Bearing Sediments in the Shenhu Area, South China Sea: Implications from the W01B and W02B Sites. Mar. Geol. 408, 36–47. doi:10.1016/j.margeo.2018.10.013
Li, L., Wang, B., Sun, L., Wang, Z., Lu, Y., Yang, T., et al. (2022). The Characteristic and Controlling Factors of the Concentrated Gas Hydrate Occurrence in the Zhongjian Basin, South China Sea. Earth Sci. 46, 72. doi:10.3799/dqkx.2022.072
Li, W., Cook, A., Daigle, H., Malinverno, A., Nole, M., and You, K. (2019). Factors Controlling Short‐Range Methane Migration of Gas Hydrate Accumulations in Thin Coarse‐Grained Layers. Geochem. Geophys. Geosyst. 20, 3985–4000. doi:10.1029/2019GC008405
Liang, J., Zhang, W., Lu, J. a., Wei, J., Kuang, Z., He, Y., et al. (2019). Geological Occurrence and Accumulation Mechanism of Natural Gas Hydrates in the Eastern Qiongdongnan Basin of the South China Sea: Insights from Site GMGS5-W9-2018. Mar. Geol. 418, 106042. doi:10.1016/j.margeo.2019.106042
Liu, J., Yang, R., Zhang, J., Wei, W., and Wu, D. (2019). Gas Hydrate Accumulation Conditions in the Huaguang Depression of Qiongdongnan Basin and Prediction of Favorable Zones. Mar. Geol. Quat. Geol. 39, 134–142. doi:10.16562/j.cnki.0256-1492.2018072701
Lu, S., and Mcmechan, G. A. (2002). Estimation of Gas Hydrate and Free Gas Saturation, Concentration, and Distribution from Seismic Data. Geophysics 67, 582–593. doi:10.1190/1.1468619
Lu, S., and McMechan, G. A. (2004). Elastic Impedance Inversion of Multichannel Seismic Data from Unconsolidated Sediments Containing Gas Hydrate and Free Gas. Geophysics 69, 164–179. doi:10.1190/1.1649385
Lu, H., Seo, Y.-t., Lee, J.-w., Moudrakovski, I., Ripmeester, J. A., Chapman, N. R., et al. (2007). Complex Gas Hydrate from the Cascadia Margin. Nature 445, 303–306. doi:10.1038/nature05463
Lu, Y., Luan, X., Lyu, F., Wang, B., Yang, Z., Yang, T., et al. (2017). Seismic Evidence and Formation Mechanism of Gas Hydrates in the Zhongjiannan Basin, Western Margin of the South China Sea. Mar. Petroleum Geol. 84, 274–288. doi:10.1016/j.marpetgeo.2017.04.005
Lu, Y., Xu, X., Luan, X., Jiang, S., Ran, W., Yang, T., et al. (2021). Morphology, Internal Architectures, and Formation Mechanisms of Mega-Pockmarks on the Northwestern South China Sea Margin. Interpretation 9, T1039–T1054. doi:10.1190/INT-2020-0175.1
Lüdmann, T., and KinWong, H. (1999). Neotectonic Regime on the Passive Continental Margin of the Northern South China Sea. Tectonics 311, 113–138. doi:10.1016/S0040-1951(99)00155-9
Morley, C. K. (2002). A Tectonic Model for the Tertiary Evolution of Strike-Slip Faults and Rift Basins in SE Asia. Tectonophysics 347, 189–215. doi:10.1016/S0040-1951(02)00061-6
Ostanin, I., Anka, Z., di Primio, R., and Bernal, A. (2012). Identification of a Large Upper Cretaceous Polygonal Fault Network in the Hammerfest Basin: Implications on the Reactivation of Regional Faulting and Gas Leakage Dynamics, SW Barents Sea. Mar. Geol. 332-334, 109–125. doi:10.1016/j.margeo.2012.03.005
Pecher, I. A., Villinger, H., Kaul, N., Crutchley, G. J., Mountjoy, J. J., Huhn, K., et al. (2017). A Fluid Pulse on the Hikurangi Subduction Margin: Evidence from a Heat Flux Transect across the Upper Limit of Gas Hydrate Stability. Geophys. Res. Lett. 44, 12385–12395. doi:10.1002/2017GL076368
Qian, J., Wang, X., Collett, T. S., Guo, Y., Kang, D., and Jin, J. (2018). Downhole Log Evidence for the Coexistence of Structure II Gas Hydrate and Free Gas below the Bottom Simulating Reflector in the South China Sea. Mar. Petroleum Geol. 98, 662–674. doi:10.1016/j.marpetgeo.2018.09.024
Qin, X. W., Lu, J. A., Lu, H. L., Qiu, H. J., Liang, J. Q., Kang, D. J., et al. (2020). Coexistence of Natural Gas Hydrate, Free Gas and Water in the Gas Hydrate System in the Shenhu Area, South China Sea. China Geol. 3, 210–220. doi:10.31035/cg2020038
Riedel, M., and Shankar, U. (2012). Combining Impedance Inversion and Seismic Similarity for Robust Gas Hydrate Concentration Assessments - A Case Study from the Krishna-Godavari Basin, East Coast of India. Mar. Petroleum Geol. 36, 35–49. doi:10.1016/j.marpetgeo.2012.06.006
Shelander, D., Dai, J., Bunge, G., Singh, S., Eissa, M., and Fisher, K. (2012). Estimating Saturation of Gas Hydrates Using Conventional 3D Seismic Data, Gulf of Mexico Joint Industry Project Leg II. Mar. Petroleum Geol. 34, 96–110. doi:10.1016/j.marpetgeo.2011.09.006
Sloan, E. D., and Koh, C. A. (2007). Clathrate Hydrates of Natural Gases (third ed) CRC Press, Boca Raton, America, 10–18. doi:10.1201/9781420008494
Su, P., Liang, J., Zhang, W., Liu, F., Wang, F., Li, T., et al. (2020). Natural Gas Hydrate Accumulation System in the Shenhu Sea Area of the Northern South China Sea. Nat. Gas. Ind. 40, 77–89. doi:10.3787/j.issn.1000-0976.2020.08.006
Sun, Q., Wu, S., Lü, F., and Yuan, S. (2010). Polygonal Faults and Their Implications for Hydrocarbon Reservoirs in the Southern Qiongdongnan Basin, South China Sea. J. Asian Earth Sci. 39, 470–479. doi:10.1016/j.jseaes.2010.04.002
Sun, Q., Wu, S., Hovland, M., Luo, P., Lu, Y., and Qu, T. (2011). The Morphologies and Genesis of Mega-Pockmarks Near the Xisha Uplift, South China Sea. Mar. Petroleum Geol. 28, 1146–1156. doi:10.1016/j.marpetgeo.2011.03.003
Sun, Q., Wu, S., Cartwright, J., Lüdmann, T., and Yao, G. (2013). Focused Fluid Flow Systems of the Zhongjiannan Basin and Guangle Uplift, South China Sea. Basin Res. 25, 97–111. doi:10.1111/j.1365-2117.2012.00551.x
Suzuki, K., Schultheiss, P., Nakatsuka, Y., Ito, T., Egawa, K., Holland, M., et al. (2015). Physical Properties and Sedimentological Features of Hydrate-Bearing Samples Recovered from the First Gas Hydrate Production Test Site on Daini-Atsumi Knoll Around Eastern Nankai Trough. Mar. Petroleum Geol. 66, 346–357. doi:10.1016/j.marpetgeo.2015.02.025
Svensen, H., Planke, S., Malthe-Sørenssen, A., Jamtveit, B., Myklebust, R., Rasmussen Eidem, T., et al. (2004). Release of Methane from a Volcanic Basin as a Mechanism for Initial Eocene Global Warming. Nature 429, 542–545. doi:10.1038/nature02575.110.1038/nature02566
Wang, X., Wu, S., Yuan, S., Wang, D., Ma, Y., Yao, G., et al. (2010). Geophysical Signatures Associated with Fluid Flow and Gas Hydrate Occurrence in a Tectonically Quiescent Sequence, Qiongdongnan Basin, South China Sea. Geofluids 10, 351–368. doi:10.1111/j.1468-8123.2010.00292.x
Wang, X., Hutchinson, D. R., Wu, S., Yang, S., and Guo, Y. (2011). Elevated Gas Hydrate Saturation within Silt and Silty Clay Sediments in the Shenhu Area, South China Sea. J. Geophys. Res. 116, B05102. doi:10.1029/2010JB007944
Wang, X., Lee, M., Collett, T., Yang, S., Guo, Y., and Wu, S. (2014a). Gas Hydrate Identified in Sand-Rich Inferred Sedimentary Section Using Downhole Logging and Seismic Data in Shenhu Area, South China Sea. Mar. Petroleum Geol. 51, 298–306. doi:10.1016/j.marpetgeo.2014.01.002
Wang, X., Collett, T. S., Lee, M. W., Yang, S., Guo, Y., and Wu, S. (2014b). Geological Controls on the Occurrence of Gas Hydrate from Core, Downhole Log, and Seismic Data in the Shenhu Area, South China Sea. Mar. Geol. 357, 272–292. doi:10.1016/j.margeo.2014.09.040
Wang, X., Qian, J., Collett, T. S., Shi, H., Yang, S., Yan, C., et al. (2016). Characterization of Gas Hydrate Distribution Using Conventional 3D Seismic Data in the Pearl River Mouth Basin, South China Sea. Interpretation 4, SA25–SA37. doi:10.1190/INT-2015-0020.1
Wang, X., Jin, J., Guo, Y., Li, J., Li, Y., Qian, J., et al. (2021). The Characteristics of Gas Hydrate Accumulation and Quantitative Estimation in the North Slope of South China Sea. Earth Sci. 46, 1038–1057. doi:10.3799/dqkx.2020.321
Wang, X., Zhou, J., Li, L., Jin, J., Li, J., Guo, Y., et al. (2022). “Bottom Simulating Reflections in the South China Sea BT - World Atlas of Submarine Gas Hydrates in Continental Margins,” in (Springer International Publishing), 163–172. doi:10.1007/978-3-030-81186-0_13
Wu, N., Yang, S., Wang, H., Liang, J., Gong, Y., Lu, Z., et al. (2009). Gas-bearing Fluid Influx Sub-system for Gas Hydrate Geological System in Shenhu Area, Northern South China Sea. Chin. J. Geophys. Ed. 52, 1641–1650. doi:10.3969/j.issn.0001-5733.2009.06.027
Wu, N., Yang, S., Zhang, H., Liang, J., Wang, H., and Lu, J. a. (2010). Gas Hydrate System of Shenhu Area, Northern South China Sea:Wire-Line Logging, Geochemical Results and Preliminary Resources Estimates. Proc. Annu. Offshore Technol. Conf. 1, 654–666. doi:10.4043/20485-ms
Xia, Y., Yang, J., Chen, Y., Lu, S., Wang, M., Deng, S., et al. (2022). A Review of the Global Polygonal Faults: Are They Playing a Big Role in Fluid Migration? Front. Earth Sci. 9, 1–16. doi:10.3389/feart.2021.786915
Xie, X., Müller, R. D., Li, S., Gong, Z., and Steinberger, B. (2006). Origin of Anomalous Subsidence along the Northern South China Sea Margin and its Relationship to Dynamic Topography. Mar. Petroleum Geol. 23, 745–765. doi:10.1016/j.marpetgeo.2006.03.004
Xie, X., Müller, R. D., Ren, J., Jiang, T., and Zhang, C. (2008). Stratigraphic Architecture and Evolution of the Continental Slope System in Offshore Hainan, Northern South China Sea. Mar. Geol. 247, 129–144. doi:10.1016/j.margeo.2007.08.005
Yamamoto, K. (2015). Overview and Introduction: Pressure Core-Sampling and Analyses in the 2012-2013 MH21 Offshore Test of Gas Production from Methane Hydrates in the Eastern Nankai Trough. Mar. Petroleum Geol. 66, 296–309. doi:10.1016/j.marpetgeo.2015.02.024
Yang, S., Zhang, M., Liang, J. Q., Lu, J., Zhang, Z. J., Holland, M., et al. (2015). Preliminary Results of China’s Third Gas Hydrate Drilling Expedition: a Critical Step from Discovery to Development in the South China Sea. Cent. Nat. Gas. Oil 412, 386–7614.
Yang, S., Liang, J., Lu, J., Qu, C., and Liu, B. (2017). New Understandings on the Characteristics and Controlling Factors of Gas Hydrate Reservoirs in the Shenhu Area on the Northern Slope of the South China Sea. Earth Sci. Front. 24, 1–14. doi:10.13745/j.esf.yx.2016-12-43
Yang, Z., Wang, B., Li, L., Li, D., Zhang, Y., and Sun, G. (2020). Characteristics of Pockmarks and Their Genesis Zhongjian Offshore Area, South China Sea. Mar. Geol. Front. 36, 42–49. doi:10.16028/j.1009-2722.2018.025
Ye, J., Wei, J., Liang, J., Lu, J., Lu, H., Zhang, W., et al. (2019). Complex Gas Hydrate System in a Gas Chimney, South China Sea. Mar. Petroleum Geol. 104, 29–39. doi:10.1016/j.marpetgeo.2019.03.023
Zander, T., Choi, J. C., Vanneste, M., Berndt, C., Dannowski, A., Carlton, B., et al. (2018). Potential Impacts of Gas Hydrate Exploitation on Slope Stability in the Danube Deep-Sea Fan, Black Sea. Mar. Petroleum Geol. 92, 1056–1068. doi:10.1016/j.marpetgeo.2017.08.010
Zhang, H. Q., Yang, S. X., Wu, N. Y., Su, X., Holland, M., Schultheiss, P., et al. (2007). Successful and Surprising Results for China’s First Gas Hydrate Drilling Expedition. Fire Ice Methane Hydrate Newsl. 7, 6–9.
Zhang, G. X., Yang, S. X., Zhang, M., Liang, J. Q., Lu, J., Holland, M., et al. (2014). GMGS2 Expedition Investigates Rich and Complex Gas Hydrate Environment in the South China Sea. Fire Ice 14, 1–5.
Zhang, G., Liang, J., Lu, J. a., Yang, S., Zhang, M., Holland, M., et al. (2015). Geological Features, Controlling Factors and Potential Prospects of the Gas Hydrate Occurrence in the East Part of the Pearl River Mouth Basin, South China Sea. Mar. Petroleum Geol. 67, 356–367. doi:10.1016/j.marpetgeo.2015.05.021
Zhang, W., Liang, J., Su, P., Wei, J., Gong, Y., Lin, L., et al. (2019). Distribution and Characteristics of Mud Diapirs, Gas Chimneys, and Bottom Simulating Reflectors Associated with Hydrocarbon Migration and Gas Hydrate Accumulation in the Qiongdongnan Basin , Northern Slope of the South China Sea. Geol. J. 54, 3556–3573. doi:10.1002/gj.3351
Zhang, W., Liang, J., Wan, Z., Su, P., Huang, W., Wang, L., et al. (2020a). Dynamic Accumulation of Gas Hydrates Associated with the Channel-Levee System in the Shenhu Area, Northern South China Sea. Mar. Petroleum Geol. 117, 104354. doi:10.1016/j.marpetgeo.2020.104354
Zhang, W., Liang, J., Wei, J., Lu, J. a., Su, P., Lin, L., et al. (2020b). Geological and Geophysical Features of and Controls on Occurrence and Accumulation of Gas Hydrates in the First Offshore Gas-Hydrate Production Test Region in the Shenhu Area, Northern South China Sea. Mar. Petroleum Geol. 114, 104191. doi:10.1016/j.marpetgeo.2019.104191
Zhong, G., Liang, J., Guo, Y., Kuang, Z., Su, P., and Lin, L. (2017). Integrated Core-Log Facies Analysis and Depositional Model of the Gas Hydrate-Bearing Sediments in the Northeastern Continental Slope, South China Sea. Mar. Petroleum Geol. 86, 1159–1172. doi:10.1016/j.marpetgeo.2017.07.012
Keywords: gas hydrate, high amplitude anomalies, polygonal fault, pockmarks, Zhongjiannan basin
Citation: Zhang G, Wang X, Li L, Sun L, Guo Y, Lu Y, Li W, Wang Z, Qian J, Yang T and Wang W (2022) Gas Hydrate Accumulation Related to Pockmarks and Faults in the Zhongjiannan Basin, South China Sea. Front. Earth Sci. 10:902469. doi: 10.3389/feart.2022.902469
Received: 23 March 2022; Accepted: 02 May 2022;
Published: 17 June 2022.
Edited by:
Pibo Su, Guangzhou Marine Geological Survey, ChinaReviewed by:
Jiangxin Chen, Qingdao Institute of Marine Geology (QIMG), ChinaMing Su, Sun Yat-sen University, China
Jinxiu Yang, China University of Petroleum, China
Copyright © 2022 Zhang, Wang, Li, Sun, Guo, Lu, Li, Wang, Qian, Yang and Wang. This is an open-access article distributed under the terms of the Creative Commons Attribution License (CC BY). The use, distribution or reproduction in other forums is permitted, provided the original author(s) and the copyright owner(s) are credited and that the original publication in this journal is cited, in accordance with accepted academic practice. No use, distribution or reproduction is permitted which does not comply with these terms.
*Correspondence: Xiujuan Wang, d2FuZ3hpdWp1YW5Ab3VjLmVkdS5jbg==; Lin Li, bGlsaW5faHpAcGV0cm9jaGluYS5jb20uY24=