 Yue Li1,2
 Yougui Song1,3*
 Kathryn E. Fitzsimmons4,5
 Aditi K. Dave4,5
 Yuming Liu1Xiulan Zong1Huanyu Sun6Huifang Liu1Rustam Orozbaev7,8
- 1State Key Laboratory of Loess and Quaternary Geology, Institute of Earth Environment, Chinese Academy of Sciences, Xi’an, China
- 2Key Laboratory of Desert and Desertification, Northwest Institute of Eco-Environment and Resources, Chinese Academy of Sciences, Lanzhou, China
- 3CAS Center for Excellence in Quaternary Science and Global Change, Xi’an, China
- 4Department of Geosciences, University of Tübingen, Tübingen, Germany
- 5Research Group for Terrestrial Palaeoclimates, Max Planck Institute for Chemistry, Mainz, Germany
- 6College of Resource Environment and Tourism, Capital Normal University, Beijing, China
- 7Institute of Geology, National Academy of Sciences of Kyrgyz Republic, Bishkek, Kyrgyzstan
- 8Research Center for Ecology and Environment of Central Asia (Bishkek), Bishkek, Kyrgyzstan
Loess is a ubiquitous, silty aeolian sediment common across the semiarid to subhumid regions in the Northern Hemisphere. As such, the physical characteristics of loess sediment, such as modal grain size and quartz crystallinity index, have the potential to inform us about dust transport pathways and corresponding atmospheric circulation responsible for entrainment, transport, and deposition. In this article, we combine detailed granularity analyses and non-parametric end-member modeling with investigations of the quartz crystallinity index of three loess deposits, extending from East to Central Asia, with the aim of identifying dust transport processes and the climate subsystems responsible for them. We find marked differences in the grain size characteristics of Eastern and Central Asian loess. Given potential linkages of fine particles to the westerly jet stream, here we focused on the fine-grained end-members in the loess. The fine-grained components of the Central Asian Bishkek (BSK) and Chashmanigar (CMG) loess may be derived from individual particles carried at high altitude by major climate subsystems such as the westerlies. However, similar quartz crystallinity indexes of fine- and coarse-grained components in the Central Asian loess indicated that surface-level wind strength might influence the releases from proximal-sourced regions and abundances in the upper atmosphere for the fine particles. By contrast, the fine-grained component of the East Asian [Fanshan18 (FS18)] loess seems to yield physical similarities to the Tertiary Red Clays underlying many loess stratigraphies, and has been interpreted to relate to transport associated with the East Asian winter monsoon. It was further supported by quartz crystallinity indexes of the <16 μm fractions in the FS18 loess, basically consistent with those of the deserts in North China, highlighting the near-surface northwesterly winter monsoon as the dominant transport dynamics of fine-grained dust. In addition, comparisons of quartz crystallinity indexes of fine-grained components between the East and Central Asian loess also suggest that variations in fine particles within the loess might not be related to transport by the higher-level westerlies, which is in disagreement with the previous model. Therefore, our results indicate that variations in fine-grained end-members in loess are difficult to reliably document the variabilities of higher-level westerlies.
1 Introduction
Aeolian loess deposits cover about 10% of the global land surface and are extensively distributed in the semiarid to subhumid regions around the world (Taylor et al., 1983; Liu, 1985; Tsoar and Pye, 1987; Rousseau and Hatté, 2021). The enhanced dustiness and the associated climatic effects over Late Quaternary make it especially important to understand past dust activity (Claquin et al., 2003; Sun and An, 2005; Antoine et al., 2009; Rasmussen et al., 2014; Kang et al., 2015; Stevens et al., 2016; Újvári et al., 2017), which play a key role in reducing the large uncertainties that exist in Earth system models (Shao et al., 2011; Choobari et al., 2014; Liu et al., 2018). Loess archives act as a direct indicator of paleo-dust activity, and its formation generally occurs in four stages, production, deflation, transport, and deposition of particles (Smalley, 1966; Pye, 1995; Wright, 2001; Muhs et al., 2014). The latter three stages have important consequences for landform evolution, biogeochemical cycles, regional climate, human health, and desertification (Ravi et al., 2011, and references therein). Therefore, loess records can serve as the reliable tools to reconstruct past atmospheric circulation patterns and dynamic environments (e.g., Qin et al., 2005; Bokhorst et al., 2011; Vandenberghe, 2013; Obreht et al., 2015; Újvári et al., 2016; DiPietro et al., 2017).
Loess grain size properties also improved our understanding of dust source areas (Dong et al., 2016), transportation pathways (Varga, 2011), and paleo-atmospheric circulation (Bokhorst et al., 2011; Varga, 2011). Multiple peaks in loess grain size distribution (GSD) were related to different transport modes (Folk and Ward, 1957; Weltje, 1997; Sun et al., 2004; Qin et al., 2005). Consequently, the analysis of GSD is a promising way to strengthen the physical basis for interpreting aeolian processes using loess records. Recent years have seen increasing statistical analysis of loess grain size to identify subpopulation [grain size end-member (EM)] within bulk samples (Weltje, 1997; Sun et al., 2002; Sun et al., 2004; Prins et al., 2007; Prins and Vriend, 2007; Vriend et al., 2011; Vandenberghe, 2013; Li et al., 2018a; Vandenberghe et al., 2018; Varga et al., 2019; Jiang et al., 2020). The different EMs were interpreted to reveal distinct atmospheric transport mechanisms, modes, and travel distances (e.g., Újvári et al., 2016; Vandenberghe, 2013, and references therein). In some cases, the end-member approach has also been employed to indicate variations in the geological context or source area (e.g., Prins et al., 2007; Bokhorst et al., 2011). Therefore, the grain size partitioning model provides a clearer perspective for identifying the natural processes where aeolian loess was transported. There have been two different unmixing methods of grain size spectra: parametric decomposition and non-parametric decomposition (Prins et al., 2007; Dietze et al., 2014; Vandenberghe et al., 2018). The former uses parametric curve-fitting procedures to disintegrate the polymodal grain size distribution curve of a single sample into aggregates of unimodal statistical probability distribution functions with the Weibull function or normal function (Sun et al., 2002; Sun et al., 2004; Qin et al., 2005; Sun D. H. et al., 2008; Varga, 2011; Wang et al., 2017). The latter is performed based on the whole grain size database, and a numerical–statistical inversion technique is employed to identify fixed sedimentary populations (EMs) from the measured grain size distribution curves of the samples by weighting them with an appropriate score (Weltje, 1997; Varga et al., 2019). Generally, the EMs obtained by non-parametric decomposition are polymodal, and those of parametric curve fitting are logically unimodal (Varga et al., 2019). For interpretations of (sub)populations, non-parametric decomposition can only provide results of more simultaneous sedimentation mechanisms, such as seasonal dust signal, yet the results of parametric curve fitting can indicate process-related elements of background and dust storm depositional components for each sample (Varga et al., 2019). Hateren et al. (2017) reviewed several non-parametric end-member modeling algorithms and evaluated their accuracies, and Weltje and Prins (2003) argued that for the parametric end-member fitting, defects exist in the uniqueness of results and physical theory on GSDs. While Dietze et al. (2022) also indicated constraints and limitations of non-parametric end-member modeling analysis (EMMA). Regardless of those debates, despite theoretical differences, the two methods can produce similar results and both have been intensively employed (Sun, 2004; Park et al., 2014; Nottebaum et al., 2015; Újvári et al., 2016; DiPietro et al., 2017; Li et al., 2018a; Varga et al., 2019; Jiang et al., 2020).
However, the origin of the fine-grained EMs in loess is relatively complex: 1) deposition as individual particle, which is transported by large-scale high-altitude winds in long-term suspension mode from distant source (Sun et al., 2004; Sun D. H. et al., 2008; Park et al., 2014); 2) attachment to larger grains from near-source regions (Pye, 1987); 3) deposition as silt- or sand-sized aggregates (Derbyshire et al., 1995; Pye, 1995; Falkovich et al., 2001; Mason et al., 2003; Qiang et al., 2010b; Mason et al., 2011; Újvári et al., 2016); and 4) production by post-depositional weathering and pedogenic processes (Xiao et al., 1995; Bland, 1998; Wang et al., 2006; Hao et al., 2008). As a result, the controversial interpretations for the fine-grained components in loess have hampered detailed understanding of their potential links to the westerlies (Sun, 2004; Prins et al., 2007; Vriend et al., 2011; Nottebaum et al., 2014).
In this article, we carried out non-parametric EMMA to elucidate aeolian dust dispersal patterns in East and Central Asia based on the loess GSDs. Given the complexity of explanations to finer components (Mason et al., 2011; Újvári et al., 2016), we separated the bulk samples into two or three size fractions, and measured crystallinity index (hereafter referred to as CI) of quartz mineral in size fractions to examine different origins for the fine- and coarse-grained particles. Quartz is an ubiquitous and weather-resistant rock-forming mineral. Quartz CI reflects temperature and crystallization rates during formation and depends on the types of source rocks (Murata and Norman, 1976). From this, the index has been applied to the identification of the dust sources in the Chinese Loess Plateau (CLP) and the Japan Sea (Ono et al., 1998; Toyoda and Naruse, 2002; Nagashima et al., 2007; Sun et al., 2007; Sun Y. et al., 2008; Nagashima et al., 2011; Sun et al., 2013). It has benefited from the successful distinguishment of the major Gobi and sandy deserts in North and Northwest China (Sun et al., 2013).
This study aims to shed light on the aeolian processes responsible for loess accumulation in different geographical provinces of Asia, and in particular to assess the imprint of the westerlies in the loess records by comparisons of the end-member subpopulations and the CI results. In addition, this study contributes toward correcting the deviation in genetic interpretations of end-members for the loess grain size.
2 Materials and Methods
2.1 Study Area
The mid-latitudes of Eurasia is the most important loess area in the Northern Hemisphere (Muhs, 2013). The Siberian High (SH) as a semipermanent anticyclone dominates Eurasia, and cold and dense air masses produced by the SH lead to strong outbreaks of cold and dry northerly winds in a belt stretching from East Asia through portions of West Asia and central and northern Europe (Aizen et al., 2001; Cohen et al., 2001; Gong and Ho, 2002). While high-altitude atmosphere over Eurasia prevails westerly stream, and northward and southward migration of the westerly winds can directly modulate spatial distributions of precipitation in Europe and Central Asia (Aizen et al., 2001; Luetscher et al., 2015; Wassenburg et al., 2016; Perşoiu et al., 2019; Lan et al., 2021). Meanwhile, the intimate relationship between spatial variations in East Asian summer monsoon precipitation and the westerly jet path across East Asia during Holocene has also been identified (Nagashima et al., 2013; Herzschuh et al., 2019).
The study area involves East and Central Asia. In East Asia, the CLP loess is well known for its vast area of coverage and continuous deposition during the Quaternary (Liu, 1985; Liu and Ding, 1998; An, 2000; Guo et al., 2000). The CLP in north-central China covers an area of ∼36 × 104 km2 (Li and Lu, 2010), extending from ∼100 to 115°E to ∼35 to 45°N (Maher, 2016). Loess accumulation on the CLP is driven by winter monsoon near-surface winds associated with the SH pressure system and/or westerly circulation of the Northern Hemisphere (Liu, 1985; Porter et al., 2001; Roe, 2009; Lu et al., 2010; Maher, 2016; Sun et al., 2020). By contrast, comparatively patchy piedmont loess deposits of varying thickness are widely distributed along the high mountains in Central Asia (Song et al., 2021), including the Pamir and Alai ranges (Dodonov, 1991; Dodonov and Baiguzina, 1995; Dodonov et al., 1999; Ding et al., 2002), the Tian Shan (Zhou et al., 1995; Fang et al., 2002; Song et al., 2014; Youn et al., 2014; Fitzsimmons et al., 2018; Li G. et al., 2020), and the Altai (Zykin and Zykina, 2015) mountain margins. Since climate change in Central Asia is mainly controlled by the dynamics of westerly air masses (Aizen et al., 2001; Chen et al., 2019; Guan et al., 2019), deposition of the piedmont loess over the region could respond to the changes of the westerly (Ding et al., 2002; Vandenberghe et al., 2006; Li et al., 2016a; Li et al., 2019b; Fan et al., 2021; Jia et al., 2022) despite strong influences of the SH pressure system and the Asiatic polar fronts (Sorrel et al., 2007; Machalett et al., 2008; Groll et al., 2013; Li et al., 2018a). Particularly, our areas of interest are the Kyrgyz Tian Shan (northern Central Asia), the Afghan–Tajik Basin (southern Central Asia), and the Yanqin-Huailai-Zhoulu Basin (East Asia) (Figure 1). Comparisons of loess records from these sites would contribute to deciphering potential links between fine-grained components in loess and westerly airflow in consideration of the aforementioned descriptions and position of the Yanqin-Huailai-Zhoulu Basin downwind of the Kyrgyz Tian Shan and the Afghan–Tajik Basin (Figure 2).
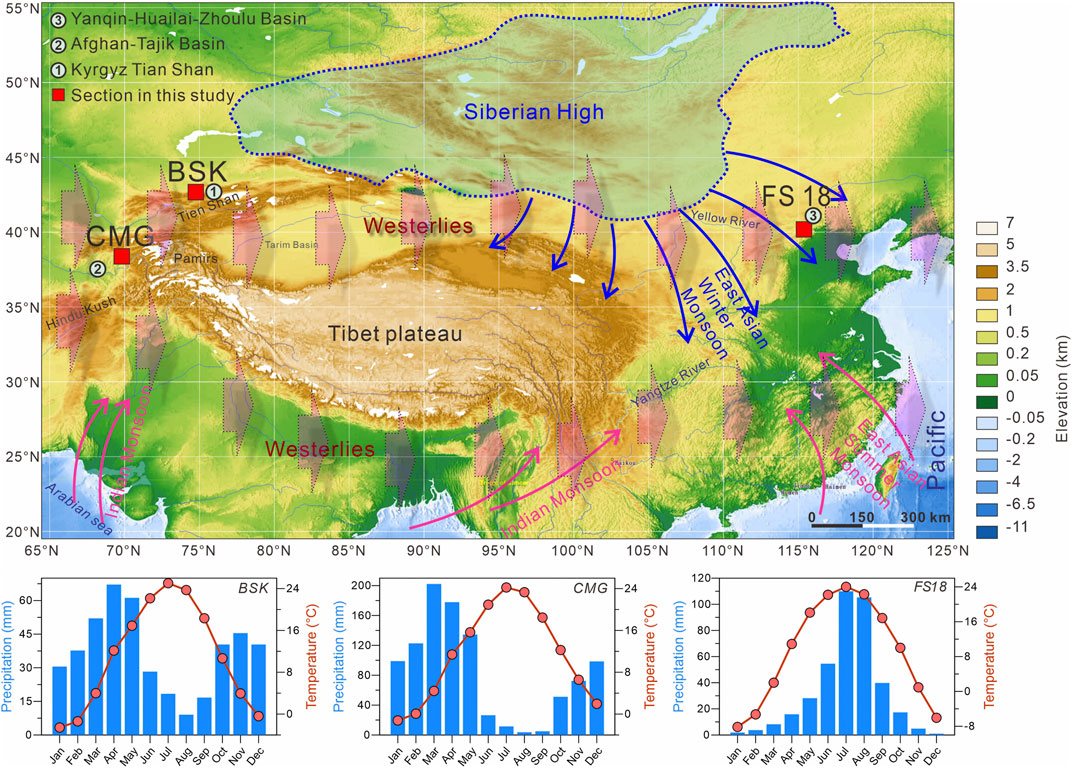
FIGURE 1. Locations of the studied loess sections and monthly precipitation and temperature at the sampling sites.
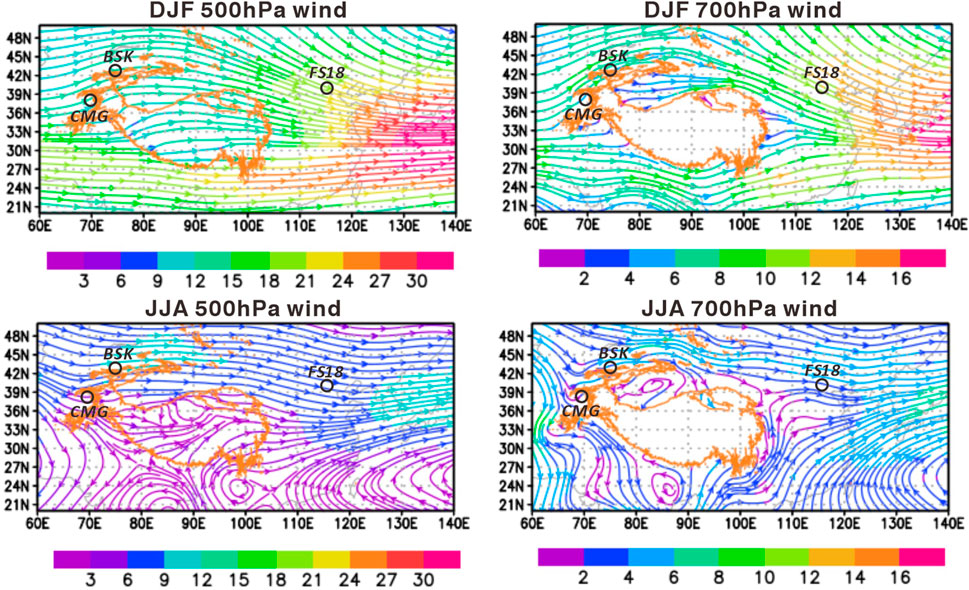
FIGURE 2. Mean winter and summer streamlines (m s−1) at 500 hPa (∼5,000 m.a.s.l.) and 700 hPa (∼3,000 m.a.s.l.) for 1980–2016 across East and Central Asia (URL: https://gmao.gsfc.nasa.gov/reanalysis/MERRA-2/). The orange lines represent the 1,700 m isohypse lines.
The Kyrgyz Tian Shan is located in the southwestern Central Asia Orogenic Belt (CAOB) (Yakubchuk, 2004). It mainly consists of Precambrian continental fragments intruded by Cambrian to Silurian granitoids (Glorie et al., 2010; Kroner et al., 2013; Alexeiev et al., 2016), connecting to the Ili Block in China (Han et al., 2016). This region is mainly influenced by the mid-latitude westerlies, the SH, northerly polar fronts, and Asian monsoon systems (Machalett et al., 2008; Cheng et al., 2012; Sorg et al., 2012; Groll et al., 2013; Karger et al., 2017; Fitzsimmons et al., 2018; Guan et al., 2019). Maximum rainfall occurs in spring (March, April, and May) along the loess piedmonts over the region (Li et al., 2020c) (Figure 1). The SH expands southward in winter and brings with it cold temperatures, dry conditions, and strong wind and associated dust activity to the Kyrgyz Tian Shan (Cheng et al., 2012; Li et al., 2018a; Shi et al., 2020). The thickness of the outcropped loess in the Kyrgyz Tian Shan generally ranges from several meters to 20 m according to field observations (Song et al., 2021), while the thickest loess section already reported in the region is the 80 m-thick Remisowka section near Almaty (Machalett et al., 2006). The loess section with a thickness of ∼20 m in the northern Krygyz Tian Shan was accumulated since the last glacial period based on quartz optically stimulated luminescence (OSL) dating (Youn et al., 2014); by comparison, the preliminary estimate of the paleomagnetic age of the Remisowka section is older than 800 ka (Song et al., 2021), though needs further chronological assessment (Machalett et al., 2006; Machalett et al., 2008; Fitzsimmons et al., 2018). The Moyun-Kum and Taukum deserts are located in about 180–200 km northwest and north of the Kyrgyz Tian Shan, respectively; however, a recent study suggested that the deserts are not the main source of the fine-grained loess, while piedmont slopes and alluvial–proluvial plains are common sources for both deserts and loess over the region (Li et al., 2020b).
The Afghan–Tajik Basin is bordered by the Tian Shan Mountains to the north and northeast, by the western Pamir Mountains to the east, and by the Hindu Kush Mountains to the south. The SH has a dominant impact on the precipitation variability during winter season (Feng et al., 2011). In summer, the subtropical high occupies the basin due to the onset of the Indian summer monsoon (Li et al., 2016b). The dust emissions and accumulations maximize during the hot and dry summer season (Dodonov et al., 1999; Ding et al., 2002; Li et al., 2019a), and dust activity in the basin are largely controlled by changes in the intensity of the Caspian Sea–Hindu Kush Index (CasHKI) (Li et al., 2019a). The loess mantle in the basin is extremely thick, attaining a thickness of 100–200 m (Dodonov, 1991; Frechen and Dodonov, 1998; Parviz et al., 2020b). The early magnetostratigraphic correlation estimated that the oldest loess in Tajikistan started to accumulate since Gauss polarity period (2.6 Ma) (Dodonov and Penkov, 1977). Ding et al. (2002) demonstrated the bottom paleomagnetic age of 1.77 Ma for the Chashmanigar section, and recent paleomagnetic analysis extended the basal age of this section to 2.13 Ma about the Reunion subchron (Parviz et al., 2020a). The great deserts such as Karakum and Kyzylkum are situated to the west and northwest of the basin (Ding et al., 2002). However, based on loess trace elements and meteorological reanalysis data, Li et al. (2019a) suggested that the deserts may have a minor contribution to loess formation in southern Tajikistan.
The Yanqin-Huailai-Zhoulu Basin is a fault basin, located at the margins of the NE CLP (Wang et al., 2014; Xiong et al., 2001). The annual precipitation and the highest temperature in the basin primarily occur during summer (Figure 1) (Xiong et al., 2001). The pedostratigraphic properties of the loess in the Yanqin-Huailai-Zhoulu Basin indicated loess deposition occurred during glacial periods with strengthened East Asian winter monsoon, whereas the palaeosols were developed during interglacial periods with the predominant East Asian summer monsoon (Xiong et al., 2001). Loess in the basin mainly occurs on uplands along the piedmonts of the mountains and covers terraces of different heights; loess over the region is commonly about 10–20 m thick, with a maximum thickness of about 100 m in the southern basin (Xiong et al., 2001). According to Xiong et al. (2001), the thickest loess deposit consists of 14 loess-paleosol couplets, underlain by fluvial pebbly conglomerates, and its paleomagnetic age extends back to 1.1 Ma. The present margin of the Hunshandake desert is about 180–200 km northwest of the loess regions in the Yanqin-Huailai-Zhoulu Basin (Xiong et al., 1999a; Xiong et al., 2001), and correspondingly, the loess can provide essential information on evolution of the desert (Xiong et al., 1999b).
2.2 Field Sampling
We analyzed GSDs of bulk samples and CI of quartz mineral for the loess samples from the BSK, CMG, and FS18 sections, which are located in the Kyrgyz Tian Shan, the Afghan–Tajik Basin, and Yanqin-Huailai-Zhoulu Basin, respectively (Figure 1). The FS18 section is located downwind of the BSK and CMG sections, with the westerlies as an important connection (Figure 2). Therefore, as stated earlier, our results could be used to examine the significance of the westerlies during the process of loess transport in the study area.
The BSK loess section (74°46′50.1″E, 42°42′15.5″N, 1,432 m a.s.l; Figures 3A,D) is located in the Kyrgyz Tian Shan (Figure 1), near the Norus River in the Chui region, Kyrgyzstan and 24 km from the southeast part of Bishkek city (Li et al., 2020c). The section was exposed by road excavation, with a thickness of ∼18 m. According to the OSL dating results of Youn et al. (2014), the BSK section roughly spans MIS1-5. The detailed lithologic features of the BSK section have been described in Li et al. (2020c), and its stratigraphy is also shown in Figure 3A.
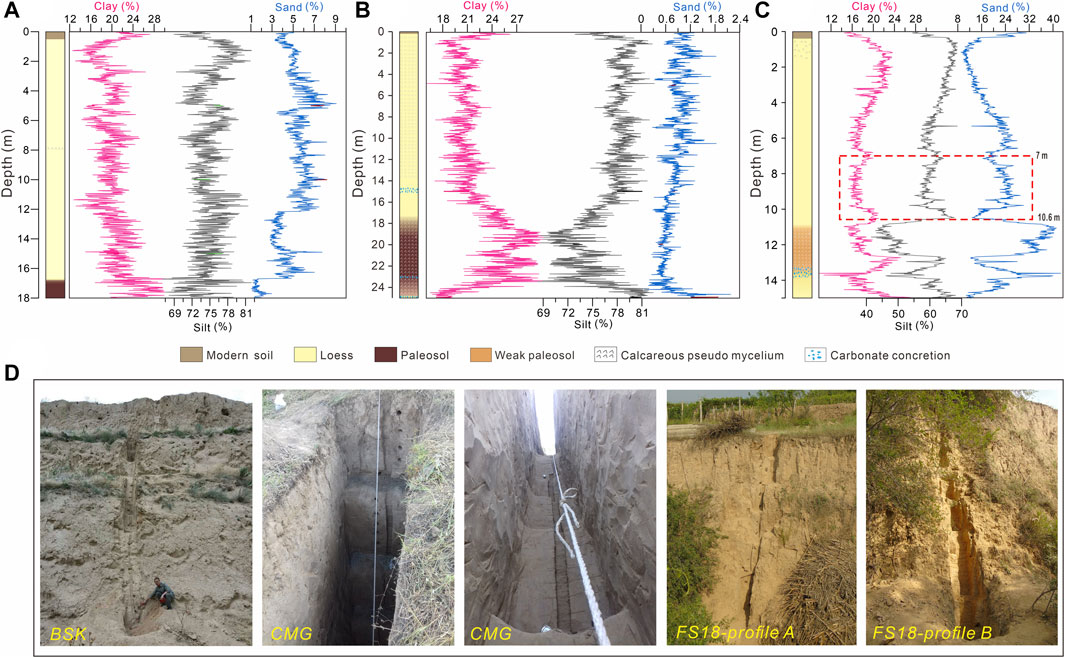
FIGURE 3. Stratigraphic logs (A–C), grain size results (A–C) and photos (D) of the BSK, CMG and FS18 loess sections. The red dashed box in (C) indicates the depth interval [7–10.6 m in FS18-subsection (B)] that is not used for the analyses due to its chronological overlap with the upper 7 m (Supplementary Material).
The CMG loess section (69°49′54.7″E, 38°23′18.9″N, 1,549 m a.s.l; Figures 3B,D) is almost located in the same position as the Chashmanigar section studied by Ding et al. (2002). The section has a thickness of 25 m, which is exposed by gravitational sliding. The section is assumed to span MIS1-5 based on paleomagnetic dating and orbitally tuned time scale (Ding et al., 2002; Yang et al., 2006). In the section, upper 0.2 m is grayish-brown modern soil, characterized by a loose soil texture, and enriched in modern plant roots (Figure 3B). The 0.2–17.5 m depth is homogeneous and yellow loess unit, with a massive, loose, and porous structure (Figure 3B). Calcareous pseudo mycelium is heavily distributed from top to bottom of the loess layer. Carbonate concretions with a diameter of >10 cm occur in the 14.5–15.25 m horizon. The 17.5–24.75 m depth is a reddish brown paleosol unit (Figure 3B), implying strong pedogenesis. The paleosol layer evenly contains root-like calcareous channels. The 24.75–25 m depth is a grayish-yellow loess layer with loose structure. Carbonate concretions of 2–3 cm in diameter occur at depths of 22.8–22.95 m and 24.9 m.
The FS18 loess section (115°23′51.2″ E, 40°11′46.5″ N, 853 m a.s.l; Figures 3C,D) is located in approximately 90 km northwest of Beijing. The section is a composite of two vertical subsections [A (7 m thick) and B (8 m thick), Figure 3D], which are 40 m apart. Thus, the section has a total thickness of 15 m. The 0–0.4 m depth is modern surface soil; the 0.4–11.2 m depth is the loess unit, characterized by grayish-yellow, silt, loose and porous structure, with uniform texture, vertical joint, and very few black Fe–Me oxide, and calcareous mycelium. A weak paleosol unit at 11.2–13.4 m depth is brown, fine silt, or clayey silt, with compaction structure and abundant calcareous mycelium. The 13.4–15 m depth is the second loess unit, which is grayish-yellow silt. In addition, calcareous nodules of ϕ = 1–3 cm occur at the 13.1–13.9 cm depth.
We collected some bracketing samples from the FS18 section for luminescence dating (Supplementary Text S1; Supplementary Table S1; Supplementary Figure S2), and the results show that the section also spans MIS1-5. We initially assumed that the subsections A and B represented a continuous sequence. However, luminescence dating of key levels (Supplementary Figure S2) showed substantial temporal overlap between the subsections. Without additional samples we were unable to develop a robust age model incorporating the two subsections in order to integrate our granulometry data and therefore we treat the two subsections as separate, with a gap in the depths, but nevertheless discontinuously spanning the last full glacial cycle. Specifically, the luminescence dating results indicated a chronological overlap between 0–7 m and 7–10.6 m depths (Supplementary Text S2). Figure 3C also showed similar variation trends in grain sizes between them despite of striking differences shown in the top of the upper 7 m. Therefore, subsection A (0–7 m) and 10.6–15 m depth in subsection B were used to conduct the EMMA in the consideration of the relatively higher sedimentation rate for the upper 7 m (Supplementary Figure S2).
After removing the superficial weathered sediment from the three sections, samples were collected at 2-cm resolution. A total of 900 samples for BSK section, 1,250 samples for CMG section, and 750 samples for FS18 section were prepared for grain size tests (Supplementary Table S2). Subsequently, 48 samples (14 from BSK section, 16 from CMG section, and 17 from FS18 section) were selected and separated into two or three size fractions (BSK and CMG section: <16 μm and >16 μm; FS18 section: <16 μm, 16–63 μm and >63 μm) for measuring the quartz CI.
2.3 Experimental Methods
2.3.1 Grain Size
Prior to grain size measurements, 0.5 g of dry bulk sample was pretreated by the removal of organic matter and carbonate using H2O2 and HCl, respectively (Lu and An, 1997). Samples were then dispersed for 10 min by ultrasonification with 10 ml 10% (NaPO3)6 solution. The Mie theory was used to obtain the relationship between the particles size and the light intensity distribution pattern (Grehan and Gouesbet, 1979; Wiscombe, 1980). Therefore, the information on both refractive index (RI) and absorptive index (AI or imaginary refractive index) of analyzed materials are required (Eshel et al., 2004). In this study, water was used as the dispersant with a RI = 1.33 at 20°C, and the default setting of RI = 1.52 and AI = 0.1 were applied, primarily because these parameters are targeted at soil samples (e.g., loess) (Eshel et al., 2004; Malvern Instruments, 2009). Particle size distribution was calculated for 100 grain size classes within a measuring range of 0.02–2,000 μm. Replicate analyses indicated an analytical error of <2%. The grain size results used in this study can be seen in Supplementary Table S1. Grain size distribution was analyzed using a Malvern 3000 laser instrument at the State Key Laboratory of Loess and Quaternary Geology, Institute of Earth Environment, Chinese Academy of Sciences.
2.3.2 Crystallinity Index (CI) of Quartz
A total of 48 CI samples are selected from the three sections (Figure 7; Supplementary Table S3). Five grams of each sample were treated with 30% H2O2 and 30% HCl to remove organic matter and carbonate, respectively (Sun et al., 2007; Zhao et al., 2012). The fractions of <16 μm and >16 μm were then isolated by gravitational settling based on Stokes’ law (Gibbs, 1974). In addition, the fraction of >63 μm within the FS18 loess was also extracted by wet sieving due to its higher contents.
CI was measured by following Ma et al. (2013), using an X’pert Pro MPD X-ray diffractometer (XRD) at the State Key Laboratory of Loess and Quaternary Geology, Institute of Earth Environment, Chinese Academy of Sciences. Powders of the aforementioned different fractions were placed in the glass holder and irradiated with a Cu Kα source with voltage at 40 kV and 40 mA. The scanning angle ranges from 66° to 69° (2θ), with a scan speed of 0.01 s−1 and a step speed of 25.0 s (Zhao et al., 2012). The CI was calculated using the following equation (Murata and Norman, 1976):
where the factor F is estimated as 12.24 (Zhao et al., 2012); a refers to the difference between the crest value at 67.74° (2θ) and the valley value at 67.84 (2θ); b is the difference between the crest value at 67.74° (2θ) and the background value. Absolute error of multiple measurements of CI for standard quartz sample (CI = 10) is ±0.15 (Ma et al., 2013). The XRD spectra for calculating the CI and the CI values of each fraction are accessible in Supplementary Table S3.
2.4 End-Member Modeling Analysis (EMMA) of Grain Size Distributions
As mentioned earlier, non-parametric EMMA is simultaneously conducted with a whole sequence based on the covariance structure of the dataset. They use the principles of eigenspace analysis and different scaling procedures to describe GSDs as a linear combination of end-members and their weighting scores (Weltje, 1997; Dietze et al., 2012). After the estimation of minimum number of EMs required for an appropriate approximation of the measured data, the size distributions and weighting scores for every end-members are determined (Varga et al., 2019), which makes the interpretation of EMs more statistically and physically descriptive (Paterson and Heslop, 2015). Various numerical techniques have recently become available, such as AnalySize (Paterson and Heslop, 2015), BEMMA (Yu et al., 2016), and EMMAgeo (Dietze et al., 2012). Hateren et al. (2017) suggested that AnalySize can yield accurate reproductions of artificial grain size datasets. Therefore, AnalySize was employed in this study. The relevant theories and calculative processes can be seen in Paterson and Heslop (2015).
The parametric curve-fitting technique is also applied here to evaluate the explanations of grain size EMs in previous studies. The parametric EMMA assumes that under steady and known dynamics of the transport mode and transport agent, the grain size of sediment displays a single-component distribution, which is controlled by a single factor (Sun et al., 2002; Sun et al., 2004), namely, different transport mechanisms produce unique modal grain sizes in the sediment they deposit (Ashley, 1978; Bagnold and Barndorff-Nielsen, 1980). The grain size distribution curves were decomposed using Weibull functions, an approach that is developed by Sun et al. (2002). Moreover, grain size parameters of the end-members were calculated from the analytical data with GRADISTAT (Version 4.0; Blott and Pye, 2001).
3 Results
3.1 Grain Size
The mean particle size distribution and the range of volume frequency for each size class of the BSK section are similar to those of the CMG section, both distinctly differing from those of the FS18 section (Figures 4A–C). The size ranges of the BSK and CMG sections generally span 0.2–300 μm, with the primary modes of ∼13 μm. The overall mean particle size distributions of the BSK and CMG sections show a unimodal pattern, with a slight skewness toward the coarse part of distribution (Figures 4A,B). An additional small peak occurs at 0.4–1.8 μm for the BSK and CMG loess (Figures 4A,B). The mean particle size distribution of the FS18 section presents a multimodal pattern, with peaks centering in 0.6 μm, 7 μm, and 50 μm (Figure 4C). In addition, the maximum values of each size class for the FS18 section also show obvious peak at 500–2,000 μm, despite lack of the peak in mean particle size distribution (Figure 4C).
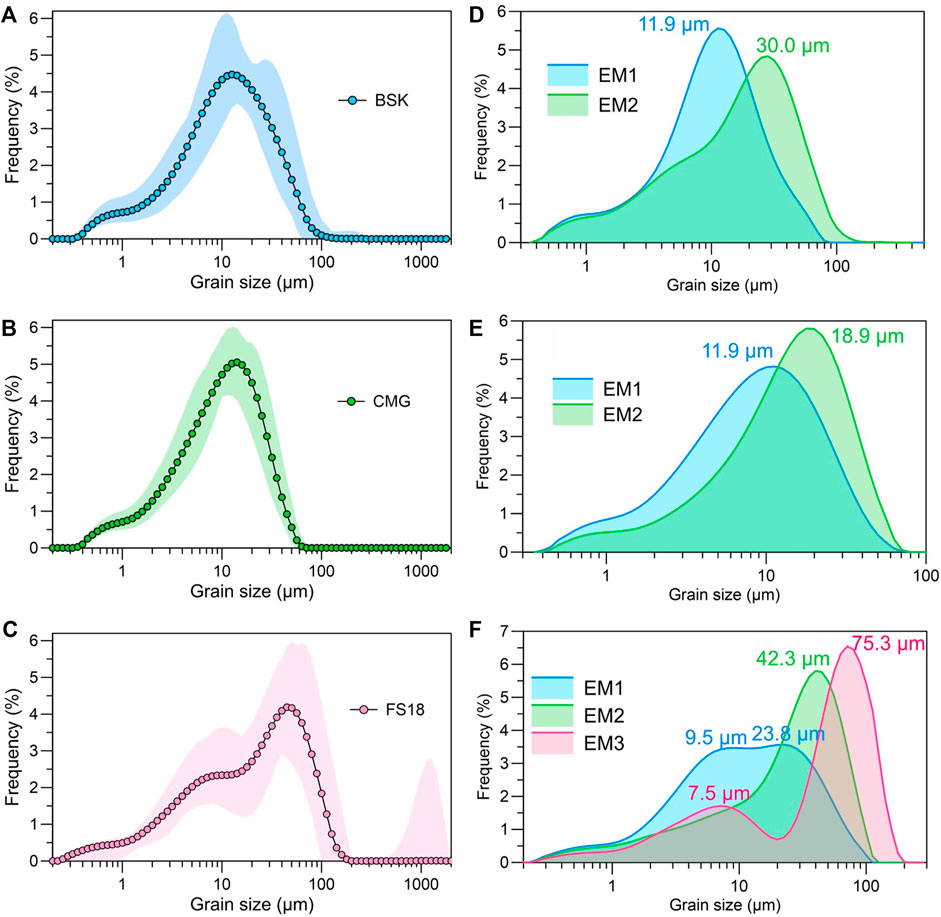
FIGURE 4. Mean grain size distribution and range of volume frequency for each size class in loess for the BSK (A), CMG (B), FS18 (C) loess sections, and grain size partitioned components of the BSK (D), CMG (E), and FS18 (F) loess. The minimum and maximum values of the GSDs [colored shade in (A), (B), (C)] were found in each size class and the averages refer to the mean volume frequencies of each size class.
Figures 3A–C shows the variations in clay, silt, and sand fractions in the BSK, CMG, and FS18 loess. The BSK and CMG loess are dominated by silt fraction, with mean proportions of 75 and 77%, respectively. While the silt fraction in the FS18 loess is relatively less, with an average of 60%. The silt fraction decreases lightly down the BSK section with significant fluctuations, and the clay fraction displays a variation trend opposite to the silt fraction (Figure 3A). The proportions of sand fraction in the BSK section range from 1.1 to 12.8%. The clay and silt fractions in the CMG section show more significant inverse relationship (Figure 3B). The proportions of clay fraction are much higher in the paleosol unit than in the loess unit. The sand fraction of the CMG loess displays the low contents, compared to that of the BSK section, with gradually decreasing trend (Figure 3B). In contrast, the proportions of silt fraction in the FS18 section follows the opposite trend of the sand fraction (Figure 3C). Notably, the sand-sized contents in the FS18 section are relatively higher (21.2%) than those in the BSK and CMG sections. The clay and silt fractions in the FS18 loess synchronously change; whereas the clay-sized contents vary with small amplitudes, relative to the silt-sized content.
3.2 Non-Parametric End-Member Modeling of Grain Size Data
The two criteria used for selecting the number of EM are parsimony and reproducibility (Prins and Weltje, 1999). Specifically, parsimony is the minimum number of EMs, and for reproducibility, it is generally accepted that the number of EMs should explain over 95% of the variance of the entire grain size dataset. The coefficient of determination (R2) and mean angular deviation (θ) are calculated to identify the minimal numbers of EMs necessary for a good statistical explanation of the data. Relatively higher R2 and lower θ suggest a better statistical fit (Paterson and Heslop, 2015). In the correlation map of the BSK loess between R2 and end-member quantity (Supplementary Figure S3a), end-member modeling yields the best results with 2 EMs; for models with more than 1 EMs, θ is less than 5°. Therefore, two EMs were modeled for the BSK loess, which yield R2 > 0.98. The same is true for the CMG loess (Supplementary Figure S3b). However, the 3-EM model provides a realistic resolution for the FS18 loess (Supplementary Figure S3c), which meets the requirements of a minimum EM number and maximum reproducibility (Paterson and Heslop, 2015).
Figures 4D–F show the GSD of each EM for the three loess sections, with the modal sizes being exhibited. The two EMs of the BSK and CMG loess present a unimodal pattern (Figures 4D,E). The modal size of the EM1s for both sections is same (11.9 μm); whereas, the mode of the EM2 of the BSK loess is significantly larger than that of the CMG loess. The three identified EMs in the FS18 loess display very different grain size distributions from each other (Figure 4F). The EM1 and EM3 of the FS18 loess show a bimodal pattern; the frequencies for the two modes (9.5 and 23.8 μm) of the EM1 are of essential equality; the primary mode of the EM3 is 75.3 μm, and the secondary one is 7.5 μm. The EM2 unmixed in the FS18 loess shows a unimodal pattern (modal grain size of 42.3 µm), markedly skewed toward the coarser side.
3.3 Quartz CI
The CI values of quartz for the >16 μm and <16 μm fractions do not show evident variabilities down the BSK and CMG section (Figures 5A,B). Overall, both the BSK and CMG sections have similar CI values for the >16 μm and <16 μm fractions, respectively. In comparison to the BSK and CMG sections, the CI differences between fine- and coarse-grained quartz particles in the FS18 loess are significantly higher (Figure 5C), likely indicating that different size fractions are probably originated from different host rocks (Sun et al., 2013). However, the CI values of the coarse-grained fractions of the FS18 loess (including 16–63 μm and >63 μm fractions) are similar to those of the BSK and CMG loesses (Figure 5).
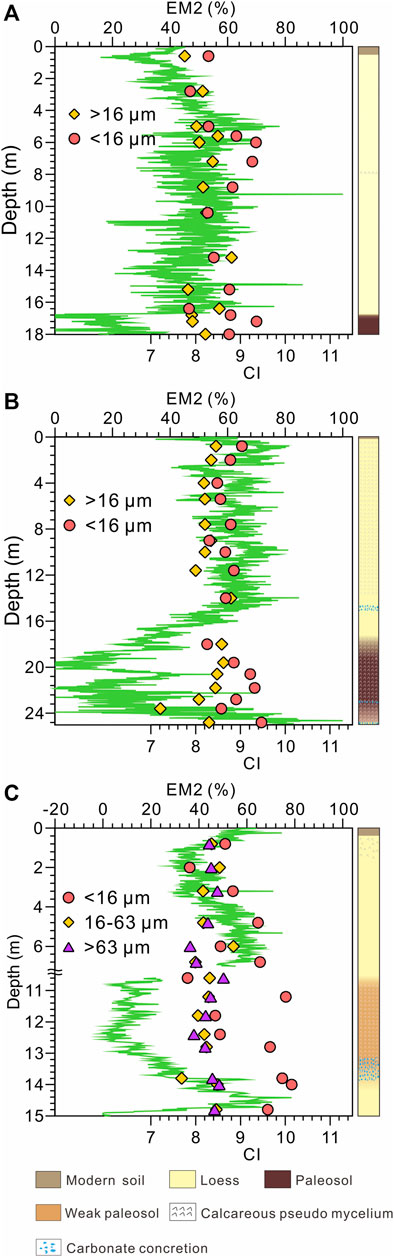
FIGURE 5. Variations in CI and mean grain size of the BSK (A), CMG (B), and FS18 (C) sections.
4 Discussion
4.1 Likely Processes Responsible for Fine-Grained EMs in East and Central Asia
Coarse components of the BSK and CMG loesses were deposited during dust storms and non-dust storm processes, respectively, while coarse particles in the FS18 loess was also related to seasonal dust storms, but with higher energies, relative to the BSK loess, due to relative closeness to the SH pressure center (Supplementary Text S3). Moreover, the sand-grained EM in the FS18 loess was affected by availability of sediments (Supplementary Text S3). As a result, coarse-size fractions are unlikely to be transported by high-altitude westerly air streams. Inversely, the size of 20–30 µm is often regarded as the maximum grain size subjected to long-distance dust transport (Tsoar and Pye, 1987; Kok et al., 2012; Ryder et al., 2013). Therefore, here we exclusively discuss physical implications of fine-grained EM, and their links to the high-altitude westerlies because of the possibility that westerly jet stream is responsible for fine-grained dust transportation and deposition processes.
EM1s of both BSK and CMG loess have a modal grain size of 11.9 μm (Figures 4D,E), whereas Vandenberghe (2013) did not point out a subgroup with such a modal size. Fine-grained fractions in loess deposits can be produced by post-depositional weathering and pedogenic processes (Xiao et al., 1995; Bland, 1998; Wang et al., 2006; Hao et al., 2008). However, weathering process rarely influence ∼2–10 µm fraction of aeolian sediments (Sun D. H. et al., 2008). Although weathering process produces a small amount of superfine grains, their sizes are seldom larger than 1 µm in diameter (Paton, 1978; Bronger and Heinkele, 1990), and even the chemical mechanism of grain size variation is unimportant for mineral dust particles larger than 0.3 µm (Qin et al., 2005). Moreover, we have used the reasonable pretreatment approach of size measurement (Lu and An, 1997) to eliminate the soil organic matter (SOM) and carbonate, which are easily influenced by chemical weathering and pedogenesis. Consequently, we exclude the influences of chemical weathering and post-depositional pedogenesis on the EM1s.
Particle size distributions of modern dust from the Kyrgyz Tian Shan typically yield a modal peak of approximately 10 µm (Schettler et al., 2014). Figure 8 also shows that the primary end-member components identified from the GSDs of modern eolian dusts at a height of 100 m have a modal size of ∼10 µm (Sun et al., 2003). Dust particles in the Dunde ice core in the western Qilian Shan, Northern China, also has a majority of its mass distribution concentrated within a modal grain size of 4–12 μm (Wu et al., 2009). Similarly, the modal sizes of long-range transported (LRT) dust on the glacier surface of the NE-TP range from 9.8 to 12 μm (Wei et al., 2019). In the eastern Tian Shan, the modal size of dust at Miaoergou glacier is 13 μm, that at glacier No. 1 is 11.5 μm and that at glacier No. 51 is 11.0 μm (Dong et al., 2009). The mode size of the microparticles in Muztagata ice core from the eastern Pamirs centers at ∼10 μm (Wu et al., 2006). The mode of LRT dust size distribution for the cryoconite particles deposited on the TP glaciers generally ranges at 5–21 μm (Dong et al., 2020, and references therein). Thus, observational data from the dust modal size in glaciers and ice-cores demonstrate that fine particles with a modal grain size similar to that of EM1 in the BSK and CMG loess can be transported and deposited in the upper-level troposphere as individual mineral grains (Sun, 2004).
However, fine particles may also be deposited by attachment to larger grains from near-source regions (Pye, 1987), or as silt- or sand-sized aggregates (Derbyshire et al., 1995; Pye, 1995; Falkovich et al., 2001; Mason et al., 2003; Qiang et al., 2010b; Mason et al., 2011; Újvári et al., 2016). Based on the observed dust storms, Qiang et al. (2010b) suggested that the fine-grained components in the deposits of dust storm were most likely to settle by forming aggregates and/or adhering to larger grains, which deciphered the independence of the depositions of fine particles on the variations in wind strength during the most severe dust storms. Formation of aggregates that increases particle mass, and/or attachment to larger particles, enables fine grains to be deposited during dust storms; as a result, fine- and coarse-grained dust are transported together by low-level dust storms from the same adjoining sources (Pye, 1995; Mctainsh et al., 1997; Qiang et al., 2010b). Therefore, it cannot be ruled out that the EM1s in Central Asian loess were also possibly transported as aggregates and/or adhering to larger particles at a relatively low level in the atmosphere from the proximal source areas.
EM1 of the FS18 loess is characterized by two distinct modal sizes (Figure 4F), which is rarely observed for the typical Quaternary loess in the CLP (Prins and Vriend, 2007). In contrast, it was found that the GSDs of the EM1 is in good agreement with those of red clay in the CLP, as a fraction that cannot be further unmixed (Figure 6). Therefore, the EM1 was deposited under the very similar depositional environment to that of the Tertiary Red Clay. The GSDs of the original Red Clay have been modified by the post-depositional pedogenic process (Sun et al., 2006; Shang et al., 2016). Inversely, Vandenberghe et al. (2004) concluded that the clay fraction of the Xifeng Red Clay may not have a pedogenic origin but was transported by wind. Regardless of the influence of pedogenesis, Sun et al. (2006) suggested that the Red Clay deposits revealed significant fluctuations of the paleo-monsoon climate in East Asia at since late Miocene time. The size distributions of Red Clay indicated that its accumulation was most likely controlled by East Asian monsoon circulation rather than westerlies (Cao et al., 2001). Based on the mean grain sizes of both bulk samples and chemically isolated quartz grains of the Late Tertiary Red Clay deposits from six localities spanning across 550 km on the CLP, Miao et al. (2004) indicated that the Red Clay was transported mainly by northerly low-level winds, or the winds at least with a strong northerly component, associated with East Asian winter monsoon. In addition, study of the CLP dust source indicated that the dust source largely remained unchanged across the Pliocene–Pleistocene boundary, suggesting that the East Asian Monsoon played an important role in the deposition of the Red Clay as well as in the Quaternary loess and that the main winds transporting dust have not drastically changed trajectory since the Miocene (Bird et al., 2020). Therefore, we considered the FS18 EM1 to be transported by a weaker winter monsoon wind based on GSD characterizations.
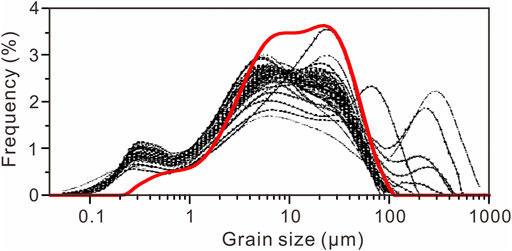
FIGURE 6. Comparisons between GSDs of the EM1 identified in the FS18 loess (red line) and the red clay in the CLP (black lines, Cao et al., 2001).
4.2 Assessing the Ability of Loess Grain Sizes to Track Variabilities of the Westerlies
4.2.1 Evidence From Fine-Grained EM
Optical satellite data showed that the LRT dust in the Kyrgyz Tian Shan was sourced from a minor part of a dust plume moving northward from northeastern Afghanistan (Schettler et al., 2014). Dust in Muztagata ice core from the eastern Pamirs might be sourced from the Central Asian deserts, such as Kyzylkum and Karakum(Wu et al., 2006). Dust particles in the glaciers from eastern Tian Shan were released from the dust sources of Central Asia (e.g., the Taklimakan and Gobi deserts) (Dong et al., 2009). The potential sources of LRT dust in TP glaciers include the northern Chinese deserts (e.g., Gobi deserts, Qaidam deserts, Badain Jaran, and Tengger deserts) and Taklimakan deserts (Dong et al., 2020). Therefore, the LRT dust with finer grain size in the Tian Shan, Muztagata, and TP glaciers also originated from the nearby Asian dust sources, which were fed by the surrounding orogenic belts (ultimate provenances). It implies that dust storms in those sources strongly affected the concentration of dust deposited to the high mountains, for example, in eastern Tian Shan (Dong et al., 2009). The stronger surface winds, producing more frequent and/or intensive dust storms in the dust source regions, would enhance the atmospheric dust loadings and vice versa (Ruth et al., 2007; Qiang et al., 2010a; Xu et al., 2018). Consequently, dust on the glacier surface showed significant differences in concentrations and particle size distributions during the Asian dust and non-dust seasons, implying aeolian dust activity changed with seasonality and reached a different glacial elevation (Dong et al., 2020). Based on the aforementioned genetic interpretations of the non-parametric EMs of the BSK and CMG loess, they partially represent the LRT dust. In analogy to case of the LRT dust, grain sizes, and percentages of the EM1s in the BSK and CMG loess also depended on changes of near-surface winds, even if they are transported by the westerly wind circulations after being lifted to the high elevation. However, that added more uncertainties to the hypothesis that the fine-grained EMs are an indicator of change in intensity and pathway of high-altitude westerly circulation (Sun, 2004). Therefore, variations in the EM1s did not merely respond to variability in the westerlies, and thus were not expected to fully indicate changes of the westerlies. In addition, the revelation of variations in large-scale westerly circulations using loess deposits is based on the direct linkages between the dust-bearing wind systems and the larger atmospheric circulations. However, these linkages are usually complicated by the overland geomorphological settings. The Tian Shan, Alai, and Altai mountain ranges and Pamirs in Central Asia have a huge topographic effect on the mid-latitude westerlies (Rugenstein and Chamberlain, 2018; Kang et al., 2020; Wang et al., 2020). Therefore, the complex topography over the region results in varying wind trajectories and influences transport of aeolian loess sediments (Fitzsimmons et al., 2018; Li et al., 2018b; Sprafke et al., 2018; Li et al., 2020b). In this context, it also implies that large uncertainties exist in the investigation of the regional westerly circulations based on sedimentary properties of loess deposits in Central Asia.
The EM1 of the FS18 loess was derived from a transport-deposition mode similar to the Tertiary Red Clay, as stated earlier. Thus, it was mainly transported by low-level East Asian winter monsoon over short distances, rather than high-altitude westerly (Miao et al., 2004; Bird et al., 2020). Meanwhile, interpretation of coarser populations (EM2) indicates the FS18 section is close to the source areas and the SH pressure center (Supplementary Text S3b), which may also overwhelm the influence of the westerlies. Therefore, it is not straightforward to examine the signal of westerlies based on the FS18 loess. Moreover, even for the loess records from the central and southeastern CLP, dominant transport dynamics of the fine-grained particles therein is strongly associated with changes in the intensity of the near-surface northwesterly winter monsoon (Sun Y. et al., 2008). In conclusion, the present results, combined with the previous study of loess provenance, suggest that fine-grained EMs identified from the CLP loess are still primarily related to East Asian winter monsoon, rather than the westerly jet.
We also considered the results of parametric EMMA for the BSK, CMG, and FS18 loesses using Weibull function (Supplementary Figure S5). The fine-grained EM of the FS18 loess shows a mode size of 7.43 μm. Fine component in the CLP loess generally has a mode size range of 3–6 µm (Sun et al., 2004) or 2–8 µm (Sun D. H. et al., 2008). While loess deposits from the west coast of South Korea displayed a fine component with mode sizes of 2.7–4.4 µm (Park et al., 2014). Thus, it is plausible that the downwind of the westerlies yielded finer component with a smaller modal size than that in the upwind. However, the finer components in the BSK and CMG loesses showed peaks around modal particle sizes of 0.86 and 3.32 µm, respectively. This was also against the transport of fine particles by westerlies.
4.2.2 Evidence From Quartz CI
Supports for the aforementioned conclusions also come from the analyses of quartz CI. Previous studies indicated that the fine-grained EMs in Chinese loess obtained by non-parametric EMMA originated from long-term suspension transport by high-altitude westerlies (Prins et al., 2007; Vriend et al., 2011; Nottebaum et al., 2014). It assumes that the fine grains have a different source area from the coarse grains (Xie et al., 2014). However, our CI values indicated the similar sources between the fine- and coarse-grained fractions of the BSK and CMG loesses (Figures 5A,B), which thereby might not lend support to the assumption that the fine-grained components of loess deposits were hypothesized to be transported by the high-altitude westerlies. Therefore, our CI results and the previous findings (e.g., Qiang et al., 2010b; Xie et al., 2014) calls for a crucial problem that whether variations in the finer EMs of loess sediments were associated with the intensity and pathways of the westerlies and to what extent the loess grain sizes might document changes in the westerlies.
Figure 7 shows that most of the <16 μm fractions in the FS18 loess have CI values consistent with those of the deserts in North China (Tengger, Badain Juran, and Mu Us Deserts). By contrast, these CI values evidently differ from those of Taklamakan Desert (>2,000 km away from the CLP) (Figure 7). Therefore, based on the observations, fine-grained components in the CLP loess were still dominated by proximal sources (such as the deserts in North China) (Sun Y. et al., 2008), which were largely affected by dust input of the weak low-level winds (Miao et al., 2004), instead of the high-altitude westerlies in a long-distance transport. On the other hand, the EM2 of the FS18 loess was interpreted to indicate frequency and intensity of dust storm (Supplementart Text S3). When the percentage of the EM2 increased (frequent, strong dust storm), the CI values of the fine (<16 μm) fractions were similar to those of Mongolia Gobi (Figures 5C, 7), suggesting increased contributions of fine-grained dust from the distant Gobi Desert in southern Mongolia to the CLP due to the intensified northwesterly winter monsoon. When the percentage of the EM2 decreased (weaker winds), the CI values of the fine fractions were consistent with those of deserts in North China (Figures 5C, 7), seemingly indicating that the westerlies were responsible for dust transportation and deposition processes in the FS18 section (Figure 7) due to the weakened near-surface northwesterly winter monsoon. However, the notably different CI values of the fine-grained components between the FS18 loess and Taklamakan Desert demonstrated less input of fine particles from the distant dust source in long-term suspension. While dust from the Taklamakan Desert can be transported by the westerly jet stream for long distance, once entrained to elevations >5,000 m (Sun, 2002a, b). Consequently, the high-altitude westerly jet did not act as a major dynamics of fine-grained dust transportation for the FS18 loess. Although more research is required to reveal the aeolian processes for the supply of fine particles from deserts in North China to the FS18 section during interglacial, the present provenance-tracing results emphasized the near-surface northwesterly winter monsoon as the dominant transport dynamics of fine-grained dust (Zhang et al., 1999; Sun Y. et al., 2008).
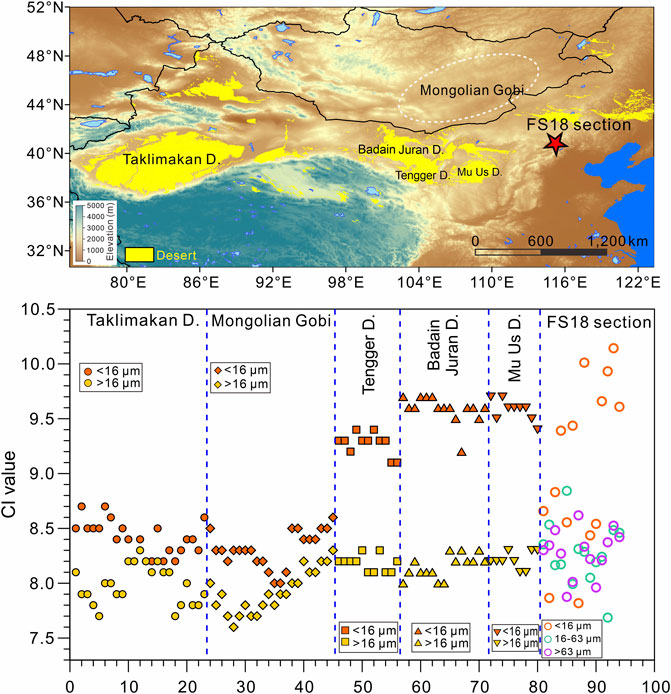
FIGURE 7. Upper panel: locations of the involved sites. Lower panel: crystallinity indices of quartz for <16 μm and >16 μm fractions from the five deserts in North and Northwest China (Sun et al., 2013), and for <16 μm, 16–63 μm and >63 μm fractions from the FS18 loess.
Although Taklamakan dust can be easily transported eastward by high-altitude westerly airflow (Sun, 2002a; Sun, 2002b), particularly in spring (Yuan et al., 2019), it is expected that deposition of fine particles decreases when wind speed increases for their Uf/u* ratio of <0.1 (Uf: the settling velocity of particle; u*: the drag velocity of wind current) (Tsoar and Pye, 1987; Qiang et al., 2010b). Conversely, finer dust particles can be emitted from the deserts in the north or northwest of the CLP (e.g., Tengger and Badain Juran Deserts) (Figure 8) by strong saltation bombardment in the low-level atmosphere (Shao et al., 2020) that is supported by the consistent ɛNd isotopic values between those deserts and the CLP loess (Zhao, 2015). Thus, it is possible that the fine dust particles were transported by the northwesterly winter monsoon winds in short suspension from the nearby source areas, in agreement with our earlier mentioned argument.
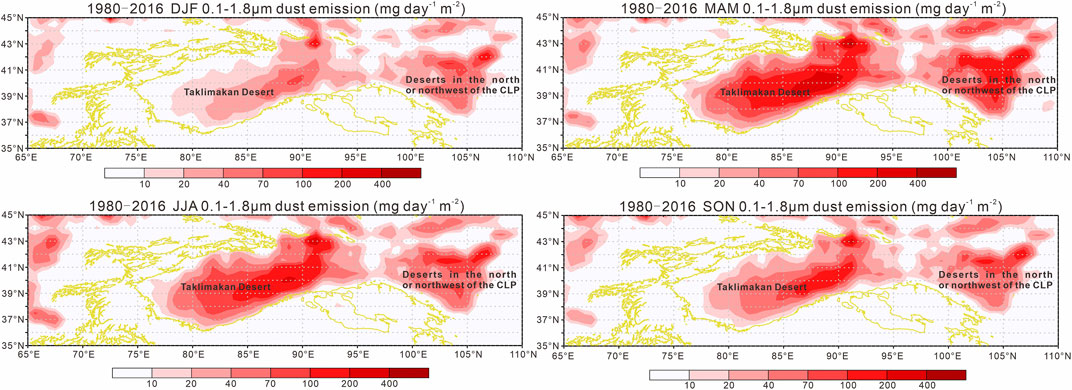
FIGURE 8. DUFLUXU dust emission flux (kg m−1 s−1) of winter (DJF), spring (MAM), summer (JJA), autumn (SON), and for the year 1980–2016. Particle size of the dust is 0.1–1.8 μm, and the positive/negative flux value represents eastbound/westbound direction. Data are collected from MERRA2 reanalysis data (https://disc.gsfc.nasa.gov/daac-bin/FTPSubset2.pl, Gelaro et al., 2017), with spatial resolution of 0.625° × 0.5° (longitude × latitude). The yellow line represents 1,700 m isohypse line.
Figure 9 shows that near-surface air streams can be lifted into the upper westerly jet due to block of the Tian Shan ranges, and the higher-level westerlies have the capacity to carry mineral aerosols from Central Asia to East Asia. Subsequently, we compared the CI values of the <16 μm fractions of BSK and CMG loess with the FS18 loess. The differences in CI (Figures 5C, 7) indicates that the fine grains at FS18 located at northeastern margins of the CLP are different from those observed in the BSK and CMG sections, suggesting that the fine-grained component observed at FS18 is unlikely to be sourced from Central Asia, consequently raising caution on previous assumptions that fine particles of loess in the CLP were transported by westerlies.
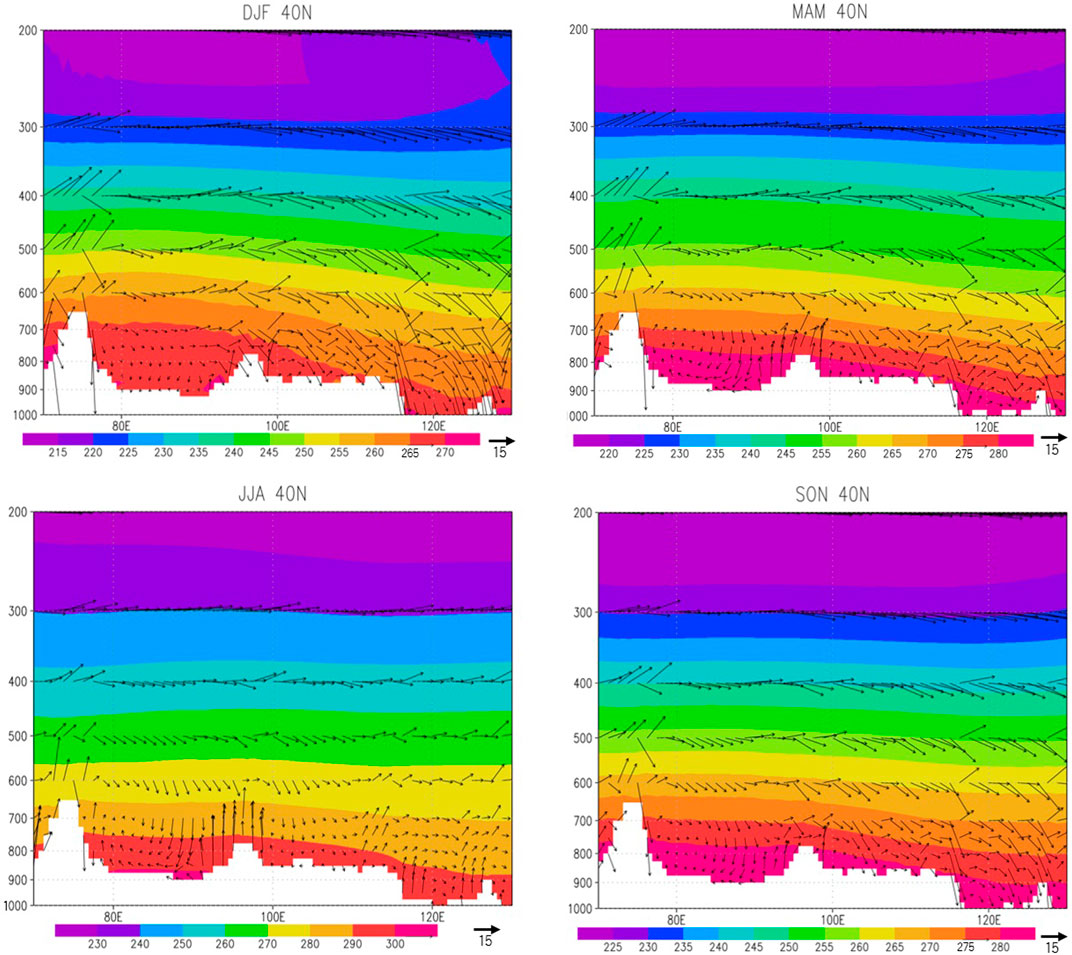
FIGURE 9. Longitude pressure cross section of wind vectors (horizontal unit: m s−1, vector unit: −10−2 Pa s−1) and air temperature (colored, unit: K) in the Modern-Era Retrospective Analysis for Research and Applications, version 2 (MERRA2), dataset (Gelaro et al., 2017), along 40°N for climatological mean. DJF: winter; MAM: spring; JJA: summer; SON: fall.
4.2.3 Evidence From Previous Studies
Once off the ground, the fine-grained fraction can be dispersed for thousands of kilometers from the source areas at a much higher atmospheric level (Glaccum and Prospero, 1980; Rea et al., 1985; Pye, 1987; Tsoar and Pye, 1987), and the grain sizes of the uplifted fine-grained dust changes very little with increasing transport distance (Rea et al., 1985; Rea and Hovan, 1995; Nilson and Lehmkuhl, 2001; Sun D. H. et al., 2008). However, Sun (2004) observed the temporal and spatial variations in the modal size of the fine components for both glacial loess and interglacial paleosol across the CLP. Therefore, the model size changes possibly provided an evidence for the delivery of fine components in loess deposits by northwesterly winter monsoon from relatively nearby sources, such as deserts in northern China, instead of high-altitude westerlies. Furthermore, orbital- and suborbital-scale meridional movements of the pathway of the westerlies may reach ∼10° in latitude (Toggweiler and Russell, 2008), significantly larger than that shown by Sun (2004), which also appeared not to support the links between fine components in the CLP loess and the westerly jet stream. Therefore, whether grain sizes of the CLP loess were imprinted with signs of the westerlies is worth revisiting. Based on the comparisons of the quartz CI values and analyses of the fine-grained EMs, as discussed earlier, this study suggested that variations in fine-grained fractions in loess are difficult to reliably document the variabilities of higher-level westerlies.
5 Conclusion
With the loess records from East (FS18 section) and Central (BSK and CMG sections) Asia, non-parametric EMMAs of grain size data and quartz CI tests were carried out to examine signals of the westerlies in the loess grain size records. Three EMs are distinguished in the FS18 loess, and two EMs in the BSK and CMG sections, respectively, which are able to characterize the dust transportation and deposition processes over the regions. In this study, we focused on the fine EMs in the loess in consideration of their potential linkages to the westerly jet stream. However, complicated origins and transportation and deposition processes of the fine-grained components in the BSK and CMG loess introduced some uncertainties in the model that variations in fine-grained EM of the loess were related to variations in high-altitude westerlies. While the fine component of the FS18 loess was derived from the transport-deposition mode controlled by the East Asian winter monsoon as the case of the Tertiary Red Clay, rather than the high-altitude westerlies. These interpretations were strengthened by the provenance-tracing results of coarse- and fine fractions in the loess based on quartz CI. Comparisons of the quartz CI values suggested that the fine-grained particles were characterized by relatively nearby sources, and that their transport-deposition mode might not be associated with the high-altitude westerlies. Consequently, it is suggested that variations in fine-grained fractions in loess are difficult to reliably document the variabilities of higher-level westerlies.
Data Availability Statement
The original contributions presented in the study are included in the article/Supplementary Material; further inquiries can be directed to the corresponding author.
Author Contributions
YuL and YS contributed to conception and design of the study. YuL, AD, XZ, HS, HL, and RO organized the database. YuL, AD, and YmL performed the statistical analysis. YuL wrote the first draft of the manuscript. YuL, KF, and AD wrote sections of the manuscript. All authors contributed to manuscript revision, read, and approved the submitted version.
Funding
This work was supported by the Natural Science Foundation of China (grant numbers 42102238 and 41977385), Key Laboratory of Desert and Desertification, Chinese Academy of Sciences (grant number KLDD-2020-009), the project of Special Research Assistant, Chinese Academy of Sciences, and an independent Max Planck Research Group awarded to KEF from the Max Planck Society.
Conflict of Interest
The authors declare that the research was conducted in the absence of any commercial or financial relationships that could be construed as a potential conflict of interest.
Publisher’s Note
All claims expressed in this article are solely those of the authors and do not necessarily represent those of their affiliated organizations, or those of the publisher, the editors, and the reviewers. Any product that may be evaluated in this article, or claim that may be made by its manufacturer, is not guaranteed or endorsed by the publisher.
Acknowledgments
The authors thank Heng Liu from Xi’an Institute for Innovative Earth Environment Research for his help in plotting and Z Peric from Max Planck Institute for Chemistry for assistance in the luminescence dating laboratory.
Supplementary Material
The Supplementary Material for this article can be found online at: https://www.frontiersin.org/articles/10.3389/feart.2022.901629/full#supplementary-material
References
Aizen, E. M., Aizen, V. B., Melack, J. M., Nakamura, T., and Ohta, T. (2001). Precipitation and Atmospheric Circulation Patterns at Mid-Latitudes of Asia. Int. J. Climatol. 21 (5), 535–556. doi:10.1002/joc.626
Alexeiev, D. V., Kröner, A., Hegner, E., Rojas-Agramonte, Y., Biske, Y. S., Wong, J., et al. (2016). Middle to Late Ordovician Arc System in the Kyrgyz Middle Tianshan: From Arc-Continent Collision to Subsequent Evolution of a Palaeozoic Continental Margin. Gondwana Res. 39, 261–291. doi:10.1016/j.gr.2016.02.003
An, Z. (2000). The History and Variability of the East Asian Paleomonsoon Climate. Quat. Sci. Rev. 19 (1-5), 171–187. doi:10.1016/s0277-3791(99)00060-8
Antoine, P., Rousseau, D.-D., Moine, O., Kunesch, S., Hatté, C., Lang, A., et al. (2009). Rapid and Cyclic Aeolian Deposition During the Last Glacial in European Loess: A High-Resolution Record from Nussloch, Germany. Quat. Sci. Rev. 28 (25–26), 2955–2973. doi:10.1016/j.quascirev.2009.08.001
Ashley, G. M. (1978). Interpretation of Polymodal Sediments. J. Geol. 86 (4), 411–421. doi:10.1086/649710
Bagnold, R. A., and Barndorff-Nielsen, O. (1980). The Pattern of Natural Size Distributions. Sedimentology 27 (2), 199–207. doi:10.1111/j.1365-3091.1980.tb01170.x
Bird, A., Millar, I., Rodenburg, T., Stevens, T., Rittner, M., Vermeesch, P., et al. (2020). A Constant Chinese Loess Plateau Dust Source Since the Late Miocene. Quat. Sci. Rev. 227, 106042. doi:10.1016/j.quascirev.2019.106042
Bland, W. (1998). Weathering: An Introduction to the Scientific Principles. New York: Oxford University Press.
Blott, S. J., and Pye, K. (2001). GRADISTAT: A Grain Size Distribution and Statistics Package for the Analysis of Unconsolidated Sediments. Earth Surf. Process. Landforms 26 (11), 1237–1248. doi:10.1002/esp.261
Bokhorst, M. P., Vandenberghe, J., Sümegi, P., Łanczont, M., Gerasimenko, N. P., Matviishina, Z. N., et al. (2011). Atmospheric Circulation Patterns in Central and Eastern Europe During the Weichselian Pleniglacial Inferred from Loess Grain-Size Records. Quat. Int. 234, 62–74. doi:10.1016/j.quaint.2010.07.018
Bronger, A., and Heinkele, T. (1990). Mineralogical and Clay Mineralogical Aspects of Loess Research. Quat. Int. 7-8, 37–51. doi:10.1016/1040-6182(90)90037-5
Cao, J., Zhang, X., Cheng, Y., and Lu, H. (2001). Size Distribution of the Late Cenozoic Red Clay and the Winter Monsoon Variations. Mar. Geol. Quat. Geol. 21 (3), 99–106. (in Chinese with English Abstract). doi:10.16562/j.cnki.0256-1492.2001.03.016
Chen, F., Chen, J., Huang, W., Chen, S., Huang, X., Jin, L., et al. (2019). Westerlies Asia and Monsoonal Asia: Spatiotemporal Differences in Climate Change and Possible Mechanisms on Decadal to Sub-Orbital Timescales. Earth-Sci. Rev. 192, 337–354. doi:10.1016/j.earscirev.2019.03.005
Cheng, H., Zhang, P. Z., Spötl, C., Edwards, R. L., Cai, Y. J., Zhang, D. Z., et al. (2012). The Climatic Cyclicity in Semiarid‐arid Central Asia over the Past 500,000 Years. Geophys. Res. Lett. 39 (1), 1705. doi:10.1029/2011gl050202
Choobari, O. A., Zawar-Reza, P., and Sturman, A. (2014). The Global Distribution of Mineral Dust and its Impacts on the Climate System: A Review. Atmos. Res. 138, 152–165. doi:10.1016/j.atmosres.2013.11.007
Claquin, T., Roelandt, C., Kohfeld, K., Harrison, S., Tegen, I., Prentice, I., et al. (2003). Radiative Forcing of Climate by Ice-Age Atmospheric Dust. Clim. Dyn. 20 (2), 193–202. doi:10.1007/s00382-002-0269-1
Cohen, J., Saito, K., and Entekhabi, D. (2001). The Role of the Siberian High in Northern Hemisphere Climate Variability. Geophys. Res. Lett. 28 (2), 299–302. doi:10.1029/2000gl011927
Derbyshire, E., Kemp, R., and Meng, X. M. (1995). Variations in Loess and Palaeosol Properties as Indicators of Palaeoclimatic Gradients across the Loess Plateau of North China. Quat. Sci. Rev. 14 (7-8), 681–697. doi:10.1016/0277-3791(95)00077-1
Dietze, E., Hartmann, K., Diekmann, B., Ijmker, J., Lehmkuhl, F., Opitz, S., et al. (2012). An End-Member Algorithm for Deciphering Modern Detrital Processes from Lake Sediments of Lake Donggi Cona, NE Tibetan Plateau, China. Sediment. Geol. 243-244, 169–180. doi:10.1016/j.sedgeo.2011.09.014
Dietze, E., Maussion, F., Ahlborn, M., Diekmann, B., Hartmann, K., Henkel, K., et al. (2014). Sediment Transport Processes across the Tibetan Plateau Inferred from Robust Grain-Size End Members in Lake Sediments. Clim. Past. 10 (1), 91–106. doi:10.5194/cp-10-91-2014
Dietze, M., Schulte, P., and Dietze, E. (2022). Application of End‐Member Modelling to Grain‐Size Data: Constraints and Limitations. Sedimentology 69 (2), 845–863. doi:10.1111/sed.12929
Ding, Z. L., Ranov, V., Yang, S. L., Finaev, A., Han, J. M., and Wang, G. A. (2002). The Loess Record in Southern Tajikistan and Correlation with Chinese Loess. Earth Planet. Sci. Lett. 200 (3-4), 387–400. doi:10.1016/s0012-821x(02)00637-4
DiPietro, L. M., Driese, S. G., Nelson, T. W., and Harvill, J. L. (2017). Variations in Late Quaternary Wind Intensity From Grain-Size Partitioning of Loess Deposits in the Nenana River Valley, Alaska. Quat. Res. 87 (2), 258–274. doi:10.1017/qua.2017.3
Dodonov, A. E., and Baiguzina, L. L. (1995). Loess Stratigraphy of Central Asia: Palaeoclimatic and Palaeoenvironmental Aspects. Quat. Sci. Rev. 14 (7-8), 707–720. doi:10.1016/0277-3791(95)00054-2
Dodonov, A. E., Shackleton, N., Zhou, L. P., Lomov, S. P., and Finaev, A. F. (1999). Quaternary Loess-Paleosol Stratigraphy of Central Asia: Geochronology, Correlation, and Evolution of Paleoenvironments. Stratigr. Geol. Correl. 7 (6), 581–593.
Dodonov, A., and Penkov, A. (1977). Some Data on the Stratigraphy of the Watershed Loesses in the Tajik Depression. Quat. Res. 47, 67–76.
Dong, X. X., Yang, S. L., Tang, Z. H., and Ding, Z. L. (2016). A Grain-Size-Based Model for Dust Source-To-Sink Distance Reconstruction: A Case Study From Chinese Loess (In Chinese). Sci. Sin. Terrae 46, 1406–1412. doi:10.1360/N072016-00102
Dong, Z., Brahney, J., Kang, S., Elser, J., Wei, T., Jiao, X., et al. (2020). Aeolian Dust Transport, Cycle and Influences in High-Elevation Cryosphere of the Tibetan Plateau Region: New Evidences from Alpine Snow and Ice. Earth-Science Rev. 211, 103408. doi:10.1016/j.earscirev.2020.103408
Dong, Z., Li, Z., Wang, F., and Zhang, M. (2009). Characteristics of Atmospheric Dust Deposition in Snow on the Glaciers of the Eastern Tien Shan, China. J. Glaciol. 55 (193), 797–804. doi:10.3189/002214309790152393
Eshel, G., Levy, G. J., Mingelgrin, U., and Singer, M. J. (2004). Critical Evaluation of the Use of Laser Diffraction for Particle-Size Distribution Analysis. Soil Sci. Soc. Am. J. 68 (3), 736–743. doi:10.2136/sssaj2004.7360
Falkovich, A. H., Ganor, E., Levin, Z., Formenti, P., and Rudich, Y. (2001). Chemical and Mineralogical Analysis of Individual Mineral Dust Particles. J. Geophys. Res. 106 (D16), 18029–18036. doi:10.1029/2000jd900430
Fan, Y., Jia, J., Xia, D., Meadows, M., and Wang, Z. (2021). Seasonality of Response to Millennial‐Scale Climate Events of the Last Glacial: Evidence From Loess Records Over Mid‐Latitude Asia. Geochem. Geophys. Geosyst. 22 (10), e2021GC009903. doi:10.1029/2021gc009903
Fang, X., Shi, Z., Yang, S., Yan, M., Li, J., and Jiang, P. A. (2002). Loess in the Tian Shan and its Implications for the Develop-Ment of the Gurbantunggut Desert and Drying of Northern Xinjiang. Chin. Sci. Bull. 47 (16), 1381–1387. doi:10.1360/02tb9305
Feng, Z. D., Ran, M., Yang, Q. L., Zhai, X. W., Wang, W., Zhang, X. S., et al. (2011). Stratigraphies and Chronologies of Late Quaternary Loess-Paleosol Sequences in the Core Area of the Central Asian Arid Zone. Quatern. Int. 240 (1), 156–166. doi:10.1016/j.quaint.2010.10.019
Fitzsimmons, K. E., Sprafke, T., Zielhofer, C., Günter, C., Deom, J.-M., Sala, R., et al. (2018). Loess Accumulation in the Tian Shan Piedmont: Implications for Palaeoenvironmental Change in Arid Central Asia. Quat. Int. 469, 30–43. doi:10.1016/j.quaint.2016.07.041
Folk, R. L., and Ward, W. C. (1957). Brazos River Bar: A Study in the Significance of Grain Size Parameters. J. Sediment. Res. 27 (1), 3–26. doi:10.1306/74d70646-2b21-11d7-8648000102c1865d
Frechen, M., and Dodonov, A. E. (1998). Loess Chronology of the Middle and Upper Pleistocene in Tadjikistan. Geol. Rundsch. 87 (1), 2–20. doi:10.1007/s005310050185
Gelaro, R., McCarty, W., Suárez, M. J., Todling, R., Molod, A., Takacs, L., et al. (2017). The Modern-Era Retrospective Analysis for Research and Applications, Version 2 (MERRA-2). J. Clim. 30 (14), 5419–5454. doi:10.1175/Jcli-D-16-0758.1
Glaccum, R. A., and Prospero, J. M. (1980). Saharan Aerosols Over the Tropical North-Atlantic - Mineralogy. Mar. Geol. 37 (3-4), 295–321.
Glorie, S., De Grave, J., Buslov, M. M., Elburg, M. A., Stockli, D. F., Gerdes, A., et al. (2010). Multi-Method Chronometric Constraints on the Evolution of the Northern Kyrgyz Tien Shan Granitoids (Central Asian Orogenic Belt): From Emplacement to Exhumation. J. Asian Earth Sci. 38 (3-4), 131–146. doi:10.1016/j.jseaes.2009.12.009
Gong, D. Y., and Ho, C. H. (2002). The Siberian High and Climate Change Over Middle to High Latitude Asia. Theor. Appl. Climatol. 72 (1-2), 1–9. doi:10.1007/s007040200008
Grehan, G., and Gouesbet, G. (1979). Mie Theory Calculations: New Progress, with Emphasis on Particle Sizing. Appl. Opt. 18 (20), 3489–3493. doi:10.1364/ao.18.003489
Groll, M., Opp, C., and Aslanov, I. (2013). Spatial and Temporal Distribution of the Dust Deposition in Central Asia - Results from a Long Term Monitoring Program. Aeolian Res. 9 (9), 49–62. doi:10.1016/j.aeolia.2012.08.002
Guan, X., Yang, L., Zhang, Y., and Li, J. (2019). Spatial Distribution, Temporal Variation, and Transport Characteristics of Atmospheric Water Vapor Over Central Asia and the Arid Region of China. Glob. Planet. Change 172, 159–178. doi:10.1016/j.gloplacha.2018.06.007
Guo, Z., Biscaye, P., Wei, L., Chen, X., Peng, S., and Liu, T. (2000). Summer Monsoon Variations Over the Last 1.2 Ma from the Weathering of Loess-Soil Sequences in China. Geophys. Res. Lett. 27 (12), 1751–1754. doi:10.1029/1999gl008419
Han, Y., Zhao, G., Sun, M., Eizenhöfer, P. R., Hou, W., Zhang, X., et al. (2016). Late Paleozoic Subduction and Collision Processes During the Amalgamation of the Central Asian Orogenic Belt along the South Tianshan Suture Zone. Lithos 246-247, 1–12. doi:10.1016/j.lithos.2015.12.016
Hao, Q., Oldfield, F., Bloemendal, J., and Guo, Z. (2008). Particle Size Separation and Evidence for Pedogenesis in Samples from the Chinese Loess Plateau Spanning the Past 22 m.Y. Geology 36 (9), 727–730. doi:10.1130/g24940a.1
Hateren, J. A. V., Prins, M. A., and Balen, R. T. V. (2017). On the Genetically Meaningful Decomposition of Grain-Size Distributions: A Comparison of Different End-Member Modelling Algorithms. Sediment. Geol. 375, 49–71. doi:10.1016/j.sedgeo.2017.12.003
Herzschuh, U., Cao, X., Laepple, T., Dallmeyer, A., Telford, R. J., Ni, J., et al. (2019). Position and Orientation of the Westerly Jet Determined Holocene Rainfall Patterns in China. Nat. Commun. 10 (1), 2376. doi:10.1038/s41467-019-09866-8
Jia, J., Wang, N., Wang, Z., Wang, S., Meadows, M., Wang, L., et al. (2022). Weakened Dust Activity in Southern Central Asia During Heinrich Events. Palaeogeog. Palaeoclimatol. Palaeoecol. 587, 110805. doi:10.1016/j.palaeo.2021.110805
Jiang, Q., Qingzhen, H., Peng, S., and Qiao, Y. (2020). Grain-Size Evidence for the Transport Pathway of the Xiashu Loess in Northern Subtropical China and its Linkage with Fluvial Systems. Aeolian Res. 46, 100613. doi:10.1016/j.aeolia.2020.100613
Kang, J., Zan, J., Bai, Y., Fang, X., Chen, C., Guan, C., et al. (2020). Critical Altitudinal Shift from Detrital to Pedogenic Origin of the Magnetic Properties of Surface Soils in the Western Pamir Plateau, Tajikistan. Geochem. Geophy. Geosy. 21 (2), e2019GC008752. doi:10.1029/2019gc008752
Kang, S., Wang, X., Lu, Y., Liu, W., Song, Y., and Wang, N. (2015). A High-Resolution Quartz OSL Chronology of the Talede Loess Over the Past ∼30 Ka and its Implications for Dust Accumulation in the Ili Basin, Central Asia. Quat. Geochronol. 30, 181–187. doi:10.1016/j.quageo.2015.04.006
Karger, D. N., Conrad, O., Böhner, J., Kawohl, T., Kreft, H., Soria-Auza, R. W., et al. (2017). Climatologies at High Resolution for the Earth's Land Surface Areas. Sci. Data 4, 170122. doi:10.1038/sdata.2017.122
Kok, J. F., Parteli, E. J. R., Michaels, T. I., and Karam, D. B. (2012). The Physics of Wind-Blown Sand and Dust. Rep. Prog. Phys. 75 (10), 106901. doi:10.1088/0034-4885/75/10/106901
Kröner, A., Alexeiev, D. V., Rojas-Agramonte, Y., Hegner, E., Wong, J., Xia, X., et al. (2013). Mesoproterozoic (Grenville-Age) Terranes in the Kyrgyz North Tianshan: Zircon Ages and Nd-Hf Isotopic Constraints on the Origin and Evolution of Basement Blocks in the Southern Central Asian Orogen. Gondwana Res. 23 (1), 272–295. doi:10.1016/j.gr.2012.05.004
Lan, J., Wang, T., Dong, J., Kang, S., Cheng, P., Zhou, K. e., et al. (2021). The Influence of Ice Sheet and Solar Insolation on Holocene Moisture Evolution in Northern Central Asia. Earth-Sci. Rev. 217, 103645. doi:10.1016/j.earscirev.2021.103645
Li, G., Yang, H., Stevens, T., Zhang, X., Zhang, H., Wei, H., et al. (2020a). Differential Ice Volume and Orbital Modulation of Quaternary Moisture Patterns Between Central and East Asia. Earth Planet. Sci. Lett. 530, 115901. doi:10.1016/j.epsl.2019.115901
Li, L., and Lu, H. (2010). A Preliminarily Quantitative Estimation of the Sedimentation and Erosion Rates of Loess Deposits in Chinese Loess Plateau Over the Past 250 Ka. Acta Geog. Sin. 65 (1), 37–52. doi:10.11821/xb201001005
Li, Y., Song, Y., Lai, Z., Han, L., and An, Z. (2016a). Rapid and Cyclic Dust Accumulation During MIS 2 in Central Asia Inferred from Loess OSL Dating and Grain-Size Analysis. Sci. Rep. 6 (1), 32365. doi:10.1038/srep32365
Li, Y., Song, Y., Chen, X., Li, J., Mamadjanov, Y., and Aminov, J. (2016b). Geochemical Composition of Tajikistan Loess and its Provenance Implications. Palaeogeog. Palaeoclimatol. Palaeoecol. 446, 186–194. doi:10.1016/j.palaeo.2016.01.025
Li, Y., Song, Y., Fitzsimmons, K. E., Chang, H., Orozbaev, R., and Li, X. (2018a). Eolian Dust Dispersal Patterns Since the Last Glacial Period in Eastern Central Asia: Insights from a Loess-Paleosol Sequence in the Ili Basin. Clim. Past. 14 (3), 271–286. doi:10.5194/cp-14-271-2018
Li, Y., Song, Y., Fitzsimmons, K. E., Chen, X., Prud'homme, C., and Zong, X. (2020b). Origin of Loess Deposits in the North Tian Shan Piedmont, Central Asia. Palaeogeog. Palaeoclimatol. Palaeoecol. 559, 109972. doi:10.1016/j.palaeo.2020.109972
Li, Y., Song, Y., Fitzsimmons, K. E., Chen, X., Wang, Q., Sun, H., et al. (2018b). New Evidence for the Provenance and Formation of Loess Deposits in the Ili River Basin, Arid Central Asia. Aeolian Res. 35, 1–8. doi:10.1016/j.aeolia.2018.08.002
Li, Y., Song, Y., Kaskaoutis, D. G., Chen, X., Mamadjanov, Y., and Tan, L. (2019a). Atmospheric Dust Dynamics in Southern Central Asia: Implications for Buildup of Tajikistan Loess Sediments. Atmos. Res. 229, 74–85. doi:10.1016/j.atmosres.2019.06.013
Li, Y., Song, Y., Orozbaev, R., Dong, J., Li, X., and Zhou, J. (2020c). Moisture Evolution in Central Asia Since 26 Ka: Insights from a Kyrgyz Loess Section, Western Tian Shan. Quat. Sci. Rev. 249, 106604. doi:10.1016/j.quascirev.2020.106604
Li, Y., Song, Y., Yin, Q., Han, L., and Wang, Y. (2019b). Orbital and Millennial Northern Mid-latitude Westerlies Over the Last Glacial Period. Clim. Dyn. 53 (5), 3315–3324. doi:10.1007/s00382-019-04704-5
Liu, T., and Ding, Z. (1998). Chinese Loess and the Paleomonsoon. Annu. Rev. Earth Planet. Sci. 26 (1), 111–145. doi:10.1146/annurev.earth.26.1.111
Liu, Y., Zhang, M., Liu, Z., Xia, Y., Huang, Y., Peng, Y., et al. (2018). A Possible Role of Dust in Resolving the Holocene Temperature Conundrum. Sci. Rep. 8 (1), 4434. doi:10.1038/s41598-018-22841-5
Lu, H., Wang, X., and Li, L. (2010). Aeolian Sediment Evidence that Global Cooling Has Driven Late Cenozoic Stepwise Aridification in Central Asia. Geol. Soc. Lond. Spec. Publ. 342 (1), 29–44. doi:10.1144/sp342.4
Lu, H. Y., and An, Z. S. (1997). Pretreatment Methods in Loess–Palaeosol Granulometry. Chin. Sci. Bull. 42, 237–240. doi:10.1007/bf03182616
Luetscher, M., Boch, R., Sodemann, H., Spötl, C., Cheng, H., Edwards, R. L., et al. (2015). North Atlantic Storm Track Changes During the Last Glacial Maximum Recorded by Alpine Speleothems. Nat. Commun. 6 (1), 6344. doi:10.1038/ncomms7344
Ma, L., Zhao, J., and Sun, Y. (2013). Variability of the Crystallinity Index of Quartz from Eolian Deposits on the Chinese Loess Plateau. J. Earth Environ. 4 (2), 1255–1260. (In Chinese with English Abstract). doi:10.7515/JEE201302003
Machalett, B., Frechen, M., Hambach, U., Oches, E. A., Zöller, L., and Marković, S. B. (2006). The Loess Sequence from Remisowka (Northern Boundary of the Tien Shan Mountains, Kazakhstan)-Part I: Luminescence Dating. Quatern. Int. 152–153, 192–201. doi:10.1016/j.quaint.2005.12.014
Machalett, B., Oches, E. A., Frechen, M., Zoller, L., Hambach, U., Mavlyanova, N. G., et al. (2008). Aeolian Dust Dynamics in Central Asia During the Pleistocene: Driven by the Long-Term Migration, Seasonality, and Permanency of the Asiatic Polar Front. Geochem. Geophy. Geosy. 9 (8), Q08Q09. doi:10.1029/2007gc001938
Maher, B. A. (2016). Palaeoclimatic Records of the Loess/Palaeosol Sequences of the Chinese Loess Plateau. Quat. Sci. Rev. 154, 23–84. doi:10.1016/j.quascirev.2016.08.004
Malvern Instruments (2009). Determination of the Particle Absorption for Laser Diffraction Size Calculations, 1–4. Malvern Application Note (MRK1308-01).
Mason, J. A., Greene, R. S. B., and Joeckel, R. M. (2011). Laser Diffraction Analysis of the Disintegration of Aeolian Sedimentary Aggregates in Water. Catena 87 (1), 107–118. doi:10.1016/j.catena.2011.05.015
Mason, J. A., Jacobs, P. M., Greene, R. S. B., and Nettleton, W. D. (2003). Sedimentary Aggregates in the Peoria Loess of Nebraska, USA. Catena 53 (4), 377–397. doi:10.1016/s0341-8162(03)00073-0
Mctainsh, G. H., Nickling, W. G., and Lynch, A. W. (1997). Dust Deposition and Particle Size in Mali, West Africa. Catena 29 (3), 307–322. doi:10.1016/s0341-8162(96)00075-6
Miao, X., Sun, Y., Lu, H., and Mason, J. A. (2004). Spatial Pattern of Grain Size in the Late Pliocene ‘Red Clay' Deposits (North China) Indicates Transport by Low-Level Northerly Winds. Palaeogeog. Palaeoclimatol. Palaeoecol. 206 (1-2), 149–155. doi:10.1016/j.palaeo.2004.01.018
Muhs, D. R., Cattle, S. R., Crouvi, O., Rousseau, D. D., Sun, J. M., and Zárate, M. A. (2014). Loess Records. Berlin: Springer-Verlag.
Muhs, D. R. (2013). The Geologic Records of Dust in the Quaternary. Aeolian Res. 9, 3–48. doi:10.1016/j.aeolia.2012.08.001
Murata, K. J., and Norman, M. B. (1976). An Index of Crystallinity for Quartz. Am. J. Sci. 276 (9), 1120–1130. doi:10.2475/ajs.276.9.1120
Nagashima, K., Tada, R., Tani, A., Sun, Y., Isozaki, Y., Toyoda, S., et al. (2011). Millennial-Scale Oscillations of the Westerly Jet Path During the Last Glacial Period. J. Asian Earth Sci. 40 (6), 1214–1220. doi:10.1016/j.jseaes.2010.08.010
Nagashima, K., Tada, R., Tani, A., Toyoda, S., Sun, Y., and Isozaki, Y. (2007). Contribution of Aeolian Dust in Japan Sea Sediments Estimated from ESR Signal Intensity and Crystallinity of Quartz. Geochem. Geophys. Geosyst. 8 (2), Q02Q04. doi:10.1029/2006GC001364
Nagashima, K., Tada, R., and Toyoda, S. (2013). Westerly Jet-East Asian Summer Monsoon Connection During the Holocene. Geochem. Geophys. Geosyst. 14 (12), 5041–5053. doi:10.1002/2013gc004931
Nilson, E., and Lehmkuhl, F. (2001). Interpreting Temporal Patterns in the Late Quaternary Dust Flux from Asia to the North Pacific. Quat. Int. 76-77, 67–76. doi:10.1016/s1040-6182(00)00090-2
Nottebaum, V., Lehmkuhl, F., Stauch, G., Hartmann, K., Wünnemann, B., Schimpf, S., et al. (2014). Regional Grain Size Variations in Aeolian Sediments Along the Transition Between Tibetan Highlands and North-Western Chinese Deserts - The Influence of Geomorphological Settings on Aeolian Transport Pathways. Earth Surf. Process. Landforms 39 (14), 1960–1978. doi:10.1002/esp.3590
Nottebaum, V., Stauch, G., Hartmann, K., Zhang, J., and Lehmkuhl, F. (2015). Unmixed Loess Grain Size Populations Along the Northern Qilian Shan (China): Relationships Between Geomorphologic, Sedimentologic and Climatic Controls. Quatern. Int. 372, 151–166. doi:10.1016/j.quaint.2014.12.071
Obreht, I., Zeeden, C., Schulte, P., Hambach, U., Eckmeier, E., Timar-Gabor, A., et al. (2015). Aeolian Dynamics at the Orlovat Loess-Paleosol Sequence, Northern Serbia, Based on Detailed Textural and Geochemical Evidence. Aeolian Res. 18, 69–81. doi:10.1016/j.aeolia.2015.06.004
Ono, Y., Naruse, T., Ikeya, M., Kohno, H., and Toyoda, S. (1998). Origin and Derived Courses of Eolian Dust Quartz Deposited During Marine Isotope Stage 2 in East Asia, Suggested by ESR Signal Intensity. Glob. Planet. Change 18 (3-4), 129–135. doi:10.1016/s0921-8181(98)00012-5
Park, C.-S., Hwang, S., Yoon, S.-O., and Choi, J. (2014). Grain Size Partitioning in Loess-Paleosol Sequence on the West Coast of South Korea Using the Weibull Function. Catena 121, 307–320. doi:10.1016/j.catena.2014.05.018
Parviz, N., Shen, Z. S., Yunus, M., and Zulqarnain, S. (2020b). Loess Deposits in Southern Tajikistan (Central Asia): Magnetic Properties and Paleoclimate. Quat. Geochronol. 60, 101114. doi:10.1016/j.quageo.2020.101114
Parviz, N., Shen, Z., Yunus, M., and Zulqarnain, S. (2020a). Loess Deposits in Southern Tajikistan (Central Asia): Magnetic Properties and Paleoclimate. Quat. Geochronol. 60, 101114. doi:10.1016/j.quageo.2020.101114
Paterson, G. A., and Heslop, D. (2015). New Methods for Unmixing Sediment Grain Size Data. Geochem. Geophys. Geosyst. 16 (12), 4494–4506. doi:10.1002/2015gc006070
Perşoiu, A., Ionita, M., and Weiss, H. (2019). Atmospheric Blocking Induced by the Strengthened Siberian High Led to Drying in West Asia During the 4.2 Ka BP Event–A Hypothesis. Clim. Past. 15 (2), 781–793. doi:10.5194/cp-15-781-2019
Porter, S. C., Hallet, B., Wu, X., and An, Z. (2001). Dependence of Near-Surface Magnetic Susceptibility on Dust Accumulation Rate and Precipitation on the Chinese Loess Plateau. Quat. Res. 55 (3), 271–283. doi:10.1006/qres.2001.2224
Prins, M. A., and Vriend, M. (2007). Glacial and Interglacial Eolian Dust Dispersal Patterns Across the Chinese Loess Plateau Inferred from Decomposed Loess Grain-Size Records. Geochem. Geophy. Geosy. 8 (7), Q07Q05. doi:10.1029/2006gc001563
Prins, M. A., Vriend, M., Nugteren, G., Vandenberghe, J., Lu, H., Zheng, H., et al. (2007). Late Quaternary Aeolian Dust Input Variability on the Chinese Loess Plateau: Inferences from Unmixing of Loess Grain-Size Records. Quat. Sci. Rev. 26 (1-2), 230–242. doi:10.1016/j.quascirev.2006.07.002
Prins, M. A., and Weltje, G. J. (1999). “End-Member Modelling of Grain-Size Distributions of Sediment Mixture,” in Geologica Ultraiectina (Utrecht: Utrecht University).
Pye, K. (1995). The Nature, Origin and Accumulation of Loess. Quat. Sci. Rev. 14 (7-8), 653–667. doi:10.1016/0277-3791(95)00047-x
Qiang, M., Chen, F., Wang, Z., Niu, G., and Song, L. (2010a). Aeolian Deposits at the Southeastern Margin of the Tengger Desert (China): Implications for Surface Wind Strength in the Asian Dust Source Area Over the Past 20,000 Years. Palaeogeog. Palaeoclimatol. Palaeoecol. 286 (1-2), 66–80. doi:10.1016/j.palaeo.2009.12.005
Qiang, M., Lang, L., and Wang, Z. (2010b). Do Fine-Grained Components of Loess Indicate Westerlies: Insights from Observations of Dust Storm Deposits at Lenghu (Qaidam Basin, China). J. Arid. Environ. 74 (10), 1232–1239. doi:10.1016/j.jaridenv.2010.06.002
Qin, X., Cai, B., and Liu, T. (2005). Loess Record of the Aerodynamic Environment in the East Asia Monsoon Area Since 60,000 Years Before Present. J. Geophys. Res. Solid Earth 110 (B1), B01204. doi:10.1029/2004jb003131
Rasmussen, S. O., Bigler, M., Blockley, S. P., Blunier, T., Buchardt, S. L., Clausen, H. B., et al. (2014). A Stratigraphic Framework for Abrupt Climatic Changes During the Last Glacial Period Based on Three Synchronized Greenland Ice-Core Records: Refining and Extending the INTIMATE Event Stratigraphy. Quat. Sci. Rev. 106, 14–28. doi:10.1016/j.quascirev.2014.09.007
Ravi, S., D'Odorico, P., Breshears, D. D., Field, J. P., Goudie, A. S., Huxman, T. E., et al. (2011). Aeolian Processes and the Biosphere. Rev. Geophys. 49. doi:10.1029/2010RG000328
Rea, D. K., and Hovan, S. A. (1995). Grain Size Distribution and Depositional Processes of the Mineral Component of Abyssal Sediments: Lessons from the North Pacific. Paleoceanography 10 (2), 251–258. doi:10.1029/94pa03355
Rea, D. K., Leinen, M., and Janecek, T. R. (1985). Geologic Approach to the Long-Term History of Atmospheric Circulation. Science 227 (4688), 721–725. doi:10.1126/science.227.4688.721
Roe, G. (2009). On the Interpretation of Chinese Loess as a Paleoclimate Indicator. Quat. Res. 71 (2), 150–161. doi:10.1016/j.yqres.2008.09.004
Rousseau, D. D., and Hatté, C. (2021). Ground-Air Interface: The Loess Sequences, 13Markers of Atmospheric Circulation. Switzerland: Springer.
Rugenstein, J. K. C., and Chamberlain, C. P. (2018). The Evolution of Hydroclimate in Asia Over the Cenozoic: A Stable-Isotope Perspective. Earth-Science Rev. 185, 1129–1156. doi:10.1016/j.earscirev.2018.09.003
Ruth, U., Bigler, M., Röthlisberger, R., Siggaard-Andersen, M.-L., Kipfstuhl, S., Goto-Azuma, K., et al. (2007). Ice Core Evidence for a Very Tight Link Between North Atlantic and East Asian Glacial Climate. Geophys. Res. Lett. 34 (3), L03706. doi:10.1029/2006GL027876
Ryder, C. L., Highwood, E. J., Lai, T. M., Sodemann, H., and Marsham, J. H. (2013). Impact of Atmospheric Transport on the Evolution of Microphysical and Optical Properties of Saharan Dust. Geophys. Res. Lett. 40 (10), 2433–2438. doi:10.1002/grl.50482
Schettler, G., Shabunin, A., Kemnitz, H., Knoeller, K., Imashev, S., Rybin, A., et al. (2014). Seasonal and Diurnal Variations in Dust Characteristics on the Northern Slopes of the Tien Shan - Grain-Size, Mineralogy, Chemical Signatures and Isotope Composition of Attached Nitrate. J. Asian Earth Sci. 88, 257–276. doi:10.1016/j.jseaes.2014.03.019
Shang, Y., Beets, C. J., Tang, H., Prins, M. A., Lahaye, Y., Van Elsas, R., et al. (2016). Variations in the Provenance of the Late Neogene Red Clay Deposits in Northern China. Earth Planet. Sci. Lett. 439, 88–100. doi:10.1016/j.epsl.2016.01.031
Shao, Y., Wyrwoll, K.-H., Chappell, A., Huang, J., Lin, Z., McTainsh, G. H., et al. (2011). Dust Cycle: An Emerging Core Theme in Earth System Science. Aeolian Res. 2 (4), 181–204. doi:10.1016/j.aeolia.2011.02.001
Shao, Y., Zhang, J., Ishizuka, M., Mikami, M., Leys, J., and Huang, N. (2020). Dependency of Particle Size Distribution at Dust Emission on Friction Velocity and Atmospheric Boundary-Layer Stability. Atmos. Chem. Phys. 20, 12939–12953. doi:10.5194/acp-20-12939-2020
Shi, L., Zhang, J., Yao, F., Zhang, D., and Guo, H. (2020). Temporal Variation of Dust Emissions in Dust Sources Over Central Asia in Recent Decades and the Climate Linkages. Atmos. Environ. 222, 117176. doi:10.1016/j.atmosenv.2019.117176
Smalley, I. (1966). The Properties of Glacial Loess and the Formation of Loess Deposits. J. Sediment. Res. 36 (3), 669–676. doi:10.1306/74d7153c-2b21-11d7-8648000102c1865d
Song, Y., Chen, X., Qian, L., Li, C., Li, Y., Li, X., et al. (2014). Distribution and Composition of Loess Sediments in the Ili Basin, Central Asia. Quatern. Int. 334-335, 61–73. doi:10.1016/j.quaint.2013.12.053
Song, Y., Li, Y., Cheng, L., Zong, X., Kang, S., Ghafarpour, A., et al. (2021). Spatio-Temporal Distribution of Quaternary Loess Across Central Asia. Palaeogeog. Palaeoclimatol. Palaeoecol. 567, 110279. doi:10.1016/j.palaeo.2021.110279
Sorg, A., Bolch, T., Stoffel, M., Solomina, O., and Beniston, M. (2012). Climate Change Impacts on Glaciers and Runoff in Tien Shan (Central Asia). Nat. Clim. Change 2 (10), 725–731. doi:10.1038/nclimate1592
Sorrel, P., Popescu, S.-M., Klotz, S., Suc, J.-P., and Oberhänsli, H. (2007). Climate Variability in the Aral Sea Basin (Central Asia) During the Late Holocene Based on Vegetation Changes. Quat. Res. 67 (3), 357–370. doi:10.1016/j.yqres.2006.11.006
Sprafke, T., Fitzsimmons, K. E., Grützner, C., Elliot, A., Marquer, L., and Nigmatova, S. (2018). Reevaluation of Late Pleistocene Loess Profiles at Remizovka (Kazakhstan) Indicates the Significance of Topography in Evaluating Terrestrial Paleoclimate Records. Quat. Res. 89, 674–690. doi:10.1017/qua.2017.103
Stevens, T., Buylaert, J.-P., Lu, H., Thiel, C., Murray, A., Frechen, M., et al. (2016). Mass Accumulation Rate and Monsoon Records from Xifeng, Chinese Loess Plateau, Based on a Luminescence Age Model. J. Quat. Sci. 31 (4), 391–405. doi:10.1002/jqs.2848
Sun, D., Bloemendal, J., Rea, D. K., An, Z., Vandenberghe, J., Lu, H., et al. (2004). Bimodal Grain-Size Distribution of Chinese Loess, and its Palaeoclimatic Implications. Catena 55 (3), 325–340. doi:10.1016/s0341-8162(03)00109-7
Sun, D., Bloemendal, J., Rea, D. K., Vandenberghe, J., Jiang, F., An, Z., et al. (2002). Grain-Size Distribution Function of Polymodal Sediments in Hydraulic and Aeolian Environments, and Numerical Partitioning of the Sedimentary Components. Sediment. Geol. 152, 263–277. doi:10.1016/s0037-0738(02)00082-9
Sun, D. H., Chen, F. H., Bloemendal, J., and Su, R. X. (2003). Seasonal Variability of Modern Dust over the Loess Plateau of China. J. Geophys Res-Atmos 108 (D21), 4665. doi:10.1029/2003jd003382
Sun, D. H. (2004). Monsoon and Westerly Circulation Changes Recorded in the Late Cenozoic Aeolian Sequences of Northern China. Glob. Planet. Change 41 (1), 63–80. doi:10.1016/j.gloplacha.2003.11.001
Sun, D. H., Su, R. X., Bloemendal, J., and Lu, H. Y. (2008a). Grain-Size and Accumulation Rate Records from Late Cenozoic Aeolian Sequences in Northern China: Implications for Variations in the East Asian Winter Monsoon and Westerly Atmospheric Circulation. Palaeogeog. Palaeoclimatol. Palaeoecol. 264 (1-2), 39–53. doi:10.1016/j.palaeo.2008.03.011
Sun, J. M. (2002a). Provenance of Loess Material and Formation of Loess Deposits on the Chinese Loess Plateau. Earth Planet. Sci. Lett. 203 (3-4), 845–859. doi:10.1016/s0012-821x(02)00921-4
Sun, J. M. (2002b). Source Regions and Formation of the Loess Sediments on the High Mountain Regions of Northwestern China. Quat. Res. 58 (3), 341–351. doi:10.1006/qres.2002.2381
Sun, Y., and An, Z. (2005). Late Pliocene-Pleistocene Changes in Mass Accumulation Rates of Eolian Deposits on the Central Chinese Loess Plateau. J. Geophys. Res.: Atmos. 110 (D23), D23101. doi:10.1029/2005JD006064
Sun, Y., Chen, H., Tada, R., Weiss, D., Lin, M., Toyoda, S., et al. (2013). ESR Signal Intensity and Crystallinity of Quartz from Gobi and Sandy Deserts in East Asia and Implication for Tracing Asian Dust Provenance. Geochem. Geophy. Geosy. 14 (14), 2615–2627. doi:10.1002/ggge.20162
Sun, Y., Lu, H., and An, Z. (2006). Grain Size of Loess, Palaeosol and Red Clay Deposits on the Chinese Loess Plateau: Significance for Understanding Pedogenic Alteration and Palaeomonsoon Evolution. Palaeogeog. Palaeoclimatol. Palaeoecol. 241 (1), 129–138. doi:10.1016/j.palaeo.2006.06.018
Sun, Y., Tada, R., Chen, J., Chen, H., Toyoda, S., Tani, A., et al. (2007). Distinguishing the Sources of Asian Dust Based on Electron Spin Resonance Signal Intensity and Crystallinity of Quartz. Atmos. Environ. 41 (38), 8537–8548. doi:10.1016/j.atmosenv.2007.07.014
Sun, Y., Tada, R., Chen, J., Liu, Q., Toyoda, S., Tani, A., et al. (2008b). Tracing the Provenance of Fine-Grained Dust Deposited on the Central Chinese Loess Plateau. Geophys. Res. Lett. 35 (1), L01804. doi:10.1029/2007GL031672
Sun, Y., Yan, Y., Nie, J., Li, G., Shi, Z., Qiang, X., et al. (2020). Source-to-Sink Fluctuations of Asian Aeolian Deposits Since the Late Oligocene. Earth-Sci. Rev. 200, 102963. doi:10.1016/j.earscirev.2019.102963
Taylor, S. R., Mclennan, S. M., and Mcculloch, M. T. (1983). Geochemistry of Loess, Continental Crustal Composition and Crustal Model Ages. Geochim. Cosmochim. Acta 47 (11), 1897–1905. doi:10.1016/0016-7037(83)90206-5
Toggweiler, J. R., and Russell, J. (2008). Ocean Circulation in a Warming Climate. Nature 451 (7176), 286–288. doi:10.1038/nature06590
Toyoda, S., and Naruse, T. (2002). Eolian Dust from the Asian Deserts to the Japanese Islands Since the Last Glacial Maximum: The Basis for the ESR Method. Trans. Jpn. Geomorphol. Union 23, 811–820. Available at: http://ci.nii.ac.jp/naid/110001273013
Tsoar, H., and Pye, K. (1987). Dust Transport and the Question of Desert Loess Formation. Sedimentology 34 (1), 139–153. doi:10.1111/j.1365-3091.1987.tb00566.x
Újvári, G., Kok, J. F., Varga, G., and Kovács, J. (2016). The Physics of Wind-Blown Loess: Implications for Grain Size Proxy Interpretations in Quaternary Paleoclimate Studies. Earth-Science Rev. 154, 247–278. doi:10.1016/j.earscirev.2016.01.006
Újvári, G., Stevens, T., Molnár, M., Demény, A., Lambert, F., Varga, G., et al. (2017). Coupled European and Greenland Last Glacial Dust Activity Driven by North Atlantic Climate. P. Natl. A. Sci. India. A. 114 (50), E10632–E10638. doi:10.1073/pnas.1712651114
Vandenberghe, J. (2013). Grain Size of Fine-Grained Windblown Sediment: A Powerful Proxy for Process Identification. Earth-Sci. Rev. 121, 18–30. doi:10.1016/j.earscirev.2013.03.001
Vandenberghe, J., Lu, H., Sun, D., Huissteden, J. V., and Konert, M. (2004). The Late Miocene and Pliocene Climate in East Asia as Recorded by Grain Size and Magnetic Susceptibility of the Red Clay Deposits (Chinese Loess Plateau). Palaeogeog. Palaeoclimatol. Palaeoecol. 204 (3-4), 239–255. doi:10.1016/s0031-0182(03)00729-6
Vandenberghe, J., Renssen, H., van Huissteden, K., Nugteren, G., Konert, M., Lu, H., et al. (2006). Penetration of Atlantic Westerly Winds into Central and East Asia. Quat. Sci. Rev. 25 (17-18), 2380–2389. doi:10.1016/j.quascirev.2006.02.017
Vandenberghe, J., Sun, Y., Wang, X., Abels, H. A., and Liu, X. (2018). Grain-Size Characterization of Reworked Fine-Grained Aeolian Deposits. Earth-Sci. Rev. 177, 43–52. doi:10.1016/j.earscirev.2017.11.005
Varga, G. (2011). Similarities Among the Plio–Pleistocene Terrestrial Aeolian Dust Deposits in the World and in Hungary. Quatern. Int. 234 (1), 98–108. doi:10.1016/j.quaint.2010.09.011
Varga, G., Újvári, G., and Kovács, J. (2019). Interpretation of Sedimentary (Sub)Populations Extracted from Grain Size Distributions of Central European Loess-Paleosol Series. Quatern. Int. 502, 60–70. doi:10.1016/j.quaint.2017.09.021
Vriend, M., Prins, M. A., Buylaert, J.-P., Vandenberghe, J., and Lu, H. (2011). Contrasting Dust Supply Patterns Across the North-Western Chinese Loess Plateau During the Last Glacial-Interglacial Cycle. Quatern. Int. 240 (1), 167–180. doi:10.1016/j.quaint.2010.11.009
Wang, H., Mason, J. A., and Balsam, W. L. (2006). The Importance of Both Geological and Pedological Processes in Control of Grain Size and Sedimentation Rates in Peoria Loess. Geoderma 136 (1-2), 388–400. doi:10.1016/j.geoderma.2006.04.005
Wang, X., Carrapa, B., Sun, Y., Dettman, D. L., Chapman, J. B., Caves Rugenstein, J. K., et al. (2020). The Role of the Westerlies and Orography in Asian Hydroclimate Since the Late Oligocene. Geology 48, 728–732. doi:10.1130/g47400.1
Wang, X., Løvlie, R., Chen, Y., Yang, Z., Pei, J., and Tang, L. (2014). The Matuyama-Brunhes Polarity Reversal in Four Chinese Loess Records: High-Fidelity Recording of Geomagnetic Field Behavior or a Less Than Reliable Chronostratigraphic Marker? Quat. Sci. Rev. 101, 61–76. doi:10.1016/j.quascirev.2014.07.005
Wang, X., Wei, H., Khormali, F., Taheri, M., Kehl, M., Frechen, M., et al. (2017). Grain-Size Distribution of Pleistocene Loess Deposits in Northern Iran and its Palaeoclimatic Implications. Quatern. Int. 429, 41–51. doi:10.1016/j.quaint.2016.01.058
Wassenburg, J. A., Dietrich, S., Fietzke, J., Fohlmeister, J., Jochum, K. P., Scholz, D., et al. (2016). Reorganization of the North Atlantic Oscillation During Early Holocene Deglaciation. Nat. Geosci. 9 (8), 602–605. doi:10.1038/ngeo2767
Wei, T., Dong, Z., Kang, S., Rostami, M., Ulbrich, S., and Shao, Y. (2019). Hf-Nd-Sr Isotopic Fingerprinting for Aeolian Dust Deposited on Glaciers in the Northeastern Tibetan Plateau Region. Glob. Planet. Change 177 (JUN), 69–80. doi:10.1016/j.gloplacha.2019.03.015
Weltje, G. J. (1997). End-Member Modeling of Compositional Data: Numerical-Statistical Algorithms for Solving the Explicit Mixing Problem. Math. Geol. 29 (4), 503–549. doi:10.1007/bf02775085
Weltje, G. J., and Prins, M. A. (2003). Muddled or Mixed? Inferring Palaeoclimate from Size Distributions of Deep-Sea Clastics. Sediment. Geol. 162 (1), 39–62. doi:10.1016/s0037-0738(03)00235-5
Wiscombe, W. J. (1980). Improved Mie Scattering Algorithms. Appl. Opt. 19 (9), 1505–1509. doi:10.1364/ao.19.001505
Wright, J. S. (2001). “Desert” Loess Versus “Glacial” Loess: Quartz Silt Formation, Source Areas and Sediment Pathways in the Formation of Loess Deposits. Geomorphology 36 (3-4), 231–256. doi:10.1016/s0169-555x(00)00060-x
Wu, G. J., Zhang, C. L., Gao, S. P., Yao, T. D., Tian, L. D., and Xia, D. S. (2009). Element Composition of Dust from a Shallow Dunde Ice Core, Northern China. Glob. Planet. Change 67 (3-4), 186–192. doi:10.1016/j.gloplacha.2009.02.003
Wu, G., Yao, T., Xu, B., Li, Z., Tian, L., Duan, K., et al. (2006). Grain Size Record of Microparticles in the Muztagata Ice Core. Sci. China Ser. D. Earth Sci. 49 (001), 10–17. doi:10.1007/s11430-004-5093-5
Xiao, J., Porter, S. C., An, Z., Kumai, H., and Yoshikawa, S. (1995). Grain Size of Quartz as an Indicator of Winter Monsoon Strength on the Loess Plateau of Central China During the Last 130,000 Yr. Quat. Res. 43 (1), 22–29. doi:10.1006/qres.1995.1003
Xie, Y., Meng, J., and Guo, L. (2014). REE Geochemistry of Modern Eolian Dust Deposits in Harbin City, Heilongjiang Province, China: Implications for Provenance. Catena 123, 70–78. doi:10.1016/j.catena.2014.07.008
Xiong, S., Ding, Z., and Liu, D. (1999a). Comparisons of Grain Size Characteristics of Red Earth from Southern China with that of Loess and Dune Sand from Bering Region. Chin. Sci. Bull. 44 (18), 1690–1693. doi:10.1007/bf03183492
Xiong, S., Ding, Z., and Liu, T. (2001). Climatic Implications of Loess Deposits from the Beijing Region. J. Quat. Sci. 16 (6), 575–582. doi:10.1002/jqs.618
Xiong, S., Ding, Z., and Liu, T. (1999b). Loess Deposits in Beijing Region since Last 1.2 Ma and Desert Expansion over Northern China (In Chinese). Mar. Geol. Quat. Geol. 19 (3), 67–73.
Xu, B., Wang, L., Gu, Z., Hao, Q., Wang, H., Chu, G., et al. (2018). Decoupling of Climatic Drying and Asian Dust Export During the Holocene. J. Geophys. Res. Atmos. 123 (2), 915–928. doi:10.1002/2017JD027483
Yakubchuk, A. (2004). Architecture and Mineral Deposit Settings of the Altaid Orogenic Collage: A Revised Model. J. Asian Earth Sci. 23 (5), 761–779. doi:10.1016/j.jseaes.2004.01.006
Yang, S., Ding, F., and Ding, Z. (2006). Pleistocene Chemical Weathering History of Asian Arid and Semi-Arid Regions Recorded in Loess Deposits of China and Tajikistan. Geochim. Cosmochim. Acta 70 (7), 1695–1709. doi:10.1016/j.gca.2005.12.012
Youn, J. H., Seong, Y. B., Choi, J. H., Abdrakhmatov, K., and Ormukov, C. (2014). Loess Deposits in the Northern Kyrgyz Tien Shan: Implications for the Paleoclimate Reconstruction During the Late Quaternary. Catena 117, 81–93. doi:10.1016/j.catena.2013.09.007
Yu, S.-Y., Colman, S. M., and Li, L. (2016). BEMMA: A Hierarchical Bayesian End-Member Modeling Analysis of Sediment Grain-Size Distributions. Math. Geosci. 48 (6), 723–741. doi:10.1007/s11004-015-9611-0
Yuan, T., Chen, S., Huang, J., Wu, D., Lu, H., Zhang, G., et al. (2019). Influence of Dynamic and Thermal Forcing on the Meridional Transport of Taklimakan Desert Dust in Spring and Summer. J. Clim. 32 (3), 749–767. doi:10.1175/jcli-d-18-0361.1
Zhang, X. Y., Arimoto, R., and An, Z. S. (1999). Glacial and Interglacial Patterns for Asian Dust Transport. Quat. Sci. Rev. 18 (6), 811–819. doi:10.1016/s0277-3791(98)00028-6
Zhao, J., Chen, H., Song, Y., and Sun, Y. (2012). Determination of Quartz Content and Crystallinity Index from Loess Samoles. Mar. Geol. Quat. Geol. 32 (5), 131–135. (In Chinese with English Abstract). doi:10.3724/SP.J.1140.2012.05131
Zhao, W. (2015). Geochemistry Characteristics of Clay-Sized Fractions from East Asian Deserts — Mineral Dust Provenance, Transport and Tracer (In Chinese, Nanjing University). Nanjing: School of Earth Science and Engineering. Nanjing University.
Zhou, L. P., Dodonov, A. E., and Shackleton, N. J. (1995). Thermoluminescence Dating of the Orkutsay Loess Section in Tashkent Region, Uzbekistan, Central Asia. Quat. Sci. Rev. 14 (7-8), 721–730. doi:10.1016/0277-3791(95)00056-9
Keywords: loess, grain size, end-member modeling, quartz crystallinity index, westerlies
Citation: Li Y, Song Y, Fitzsimmons KE, Dave AK, Liu Y, Zong X, Sun H, Liu H and Orozbaev R (2022) Investigating Potential Links Between Fine-Grained Components in Loess and Westerly Airflow: Evidence From East and Central Asia. Front. Earth Sci. 10:901629. doi: 10.3389/feart.2022.901629
Received: 22 March 2022; Accepted: 27 April 2022;
Published: 13 June 2022.
Edited by:
Steven L. Forman, Baylor University, United StatesReviewed by:
György Varga, Research Centre for Astronomy and Earth Sciences, HungaryXinbo Gao, Institute of Geology and Geophysics (CAS), China
Copyright © 2022 Li, Song, Fitzsimmons, Dave, Liu, Zong, Sun, Liu and Orozbaev. This is an open-access article distributed under the terms of the Creative Commons Attribution License (CC BY). The use, distribution or reproduction in other forums is permitted, provided the original author(s) and the copyright owner(s) are credited and that the original publication in this journal is cited, in accordance with accepted academic practice. No use, distribution or reproduction is permitted which does not comply with these terms.
*Correspondence: Yougui Song, c3lnQGllZWNhcy5jbg==