 Jinbo Song1,2
 Qiang Zhang
 Gang Wang
 Chong-Yu Xu
95% of researchers rate our articles as excellent or good
Learn more about the work of our research integrity team to safeguard the quality of each article we publish.
Find out more
ORIGINAL RESEARCH article
Front. Earth Sci. , 20 May 2022
Sec. Interdisciplinary Climate Studies
Volume 10 - 2022 | https://doi.org/10.3389/feart.2022.900866
This article is part of the Research Topic Climate Change and Associated Impacts View all 16 articles
The ecological conservation and high-quality development of the Yellow River basin (YRB) has been adopted as a major national strategy of China. However, the YRB is still afflicted by floods. Here, we proposed a flood risk indicator using direct economic loss degree and improved the SNRD (station-based nonlinear regression downscaling model) and simulated extreme precipitation processes. The correlation coefficient of downscaled average extreme precipitation of CMORPH and CMIP6 data reached 0.817. Moreover, we evaluated flood risk and flood hazard across the YRB based on the sixth phase Coupled Model Intercomparison Project (CMIP6) data under different SSPs. Under SSP126, SSP245, and SSP585 scenarios, the areas with increasing flood hazards during 2015–2045 accounted for 65.2, 69.0, and 64.5% of the entire YRB. In the spatial pattern, flood hazards decreased from southeastern to northwestern parts of the YRB. When compared with the spatial pattern of flood risks in 2015, regions with high flood risks expanded slightly and regions with low flood risks shrunk slightly. Higher flood risks can be observed in the middle and lower YRB and particularly in the lower YRB. These findings are critical for the mitigation of flood risk across the YRB under warming climate.
Floods have devastating casualties and property losses (Lai et al., 2016; Hu et al., 2018; Li et al., 2021; Zhang et al., 2022). According to the “Yearbook of Meteorological Disasters in China”, from 2003 to 2018, the annual average disaster-affected population of China reached 107.127 million due to rainstorms and floods, accounting for 32.3% of the total population affected by all meteorological disasters. The average annual direct economic loss due to floods reached to 134.95 billion RMB, accounting for 44.5% of the total direct economic loss by all meteorological disasters (CMA, 2020). In the backdrop of global warming and rapid urbanization, the threats of floods to agricultural production, human life, and socioeconomic development will be further exacerbated. The Intergovernmental Panel on Climate Change (IPCC) Sixth Assessment Report (AR6) shows that intensifying global warming will lead to increased frequency and intensity of future extreme precipitation changes (IPCC, 2021). In China, precipitation extremes will be more frequent and more severe in the future (Duan et al., 2019), and climate change and land use change would increase the probability of heavy rains and flooding; moreover, rapid urbanization caused by increasing population and economic development will also increase flood risk (Duan et al., 2016). It has been well evidenced that increasing temperature tends to trigger the intensification of precipitation. The temperature changes can influence precipitation changes by altering the thermodynamic properties of air masses and, hence, the moisture transportation (Zhang et al., 2013). Meanwhile, with respect to population exposure to extreme precipitation, more people and the land in China will be exposed to extreme precipitation events (Wang et al., 2020; Ridolfi et al., 2021). In addition to the increase in extreme precipitation, the booming development of the socio-economy will also lead to a significant increase in flood risk (Hallegatte et al., 2013; Yu et al., 2019).
The AR6 report attached considerable importance to extreme weather and climate events at regional scales (IPCC, 2021), and signified risk evaluation of rainstorms and floods in different regions. The YRB is an important grain-producing area in China, holding an unshakable position in socioeconomic development, and ecological conservation in China. Nowadays, ecological protection and high-quality development of the YRB are accepted as major national strategies, while frequent floods and resultant frequent levee breaches and channel avulsions pose great challenges to the regional sustainability of the socio-economy (Chen et al., 2012; Zhang and Fang, 2017). Floods severely constrain regional, social, and economic development, posing a huge threat to the population and cities in the basin, especially in the lower YRB. The lower YRB has a low-lying terrain with a dense population and a highly-developed socio-economy. In addition, there has been built an 800-km long confined and super-elevated channel belt perching around 10 m above the surrounding ground; hence, economic losses and fatalities would be massive if the river banks were breached. The documentary records show that the lower Yellow River changed its course on 26 occasions from 602 BCE to 1949 CE (YRCC, 2001). Therefore, a thorough investigation of flood risk and relevant driving factors and predicting future spatiotemporal evolution of flood risk in the YRB under different SSPs are of great significance for flood control, flood mitigation, and high-quality development of the YRB.
A number of publications have been reported to address the evaluation of flood risk. Many techniques have been used for flood risk evaluation, such as risk evaluation based on historical flood data and mathematical-statistical methods (Benito et al., 2004; Rodda, 2005; Coeur and Lang, 2008), flood risk evaluation based on remote sensing and GIS techniques (Sanyal and Lu, 2005; Mason et al., 2010; Waghwala and Agnihotri, 2019), and index system-based flood risk evaluation (Okazawa et al., 2011; Kandilioti and Makropoulos, 2012). In addition, flood risk evaluation has also been done, based on the modeling of flood scenarios (Abdulrazzak et al., 2019). Using the flood data from 1989 to 2015, Luu et al. (2019) used the multiple linear regression TOPSIS method for the evaluation of flood risk across Vietnam. Rahman and Thakur (2018) extracted flood-induced submerged areas using Synthetic Aperture Radar (SAR) data and analyzed the flood-induced submerged area, flood inundation process, and spatiotemporal evolution of floods. Zischg et al. (2018) validated a 2D flood model and quantified flood risk across Sweden.
It is of paramount importance to evaluate flood risk in a warming climate based on multisource datasets at the river basin scale since mitigation of flood is done at the river basin scale (Beylich et al., 2021). Therefore, a lot of work has been done on the evaluation of flood risk at river basin scales in China. Zhang et al. (2018) evaluated the flood risk in the Pearl River Basin of China, based on the peak flow data of 78 stations from 1951 to 2014 and historical flood records of the past 1,000 years. Wu et al. (2015) developed a model for the evaluation of flood risk based on GIS and disaster risk theory and evaluated flood risk across the Huai River basin. Liu et al. (2019) did an integrated risk assessment for agricultural drought and flood based on entropy information diffusion theory in the middle and lower Yangtze River basin, China. However, relatively few reports are available, addressing flood risk evaluation over the YRB. Ji et al. (2021), based on the cellular automata-Markov model and SWAT model, predicted the future runoff and flood risk over the YRB in the context of land use and climate changes. Liu et al. (2018) analyzed the impacts of climate change on flood risk across the YRB for the next 30 years. Qiu et al. (2010) used a distributed hydrological model to analyze the impact of land-use changes on flood risk over the YRB. However, a lot of studies at present are subjective in the selection of indicators for flood risk evaluation, while the weights should be optimally determined.
In order to study the driving factors of flood risk of YRB and temporal and spatial evolution of flood risk under different SSPs in the future, we conducted the following tasks: 1) we proposed a flood risk indicator to reflect the degree of harmful effects caused by floods, especially the degree of direct economic loss, and the flood hazard indicator to reflect the frequency and intensity of rainstorms and floods; 2) we analyzed the driving factors behind the flood risk of YRB by using the geodetector method (Wang and Hu, 2012) and correlation analysis, screened-out indicators having significant impacts on the flood risk indicator and took the power of determinant value obtained by the geodetector as the indicator weight; 3) based on CMIP6 data, we used the FLUS model and improved the SNRD downscaling model to explore future land use changes and precipitation patterns across the YRB, which would affect the flood risk indicator and flood hazard indicator of YRB in the future; and 4) we calculated the flood risk indicator and the flood hazard indicator and evaluated the temporal and spatial evolution of flood risk covering a period of 2015–2045 under different SSPs. This study helped in highlighting flood risk changes in both space and time, bridging the knowledge gap in regional sustainability in the backdrop of a warming climate, and enhancing mitigation of floods over the YRB. These points constitute the major objectives and motivation of this study.
The Yellow River flows through nine provinces of China, that is, Qinghai, Sichuan, Gansu, Ningxia, Inner Mongolia, Shaanxi, Shanxi, Henan, and Shandong, with a basin area of 795,000 km2 (YRCC, 2020). Considering the resolution of CMORPH data (0.25° × 0.25°) and the size of the study area, we divided the entire YRB into 419 risk units with a grid size of 0.5°*0.5° (Figure 1). The analysis procedure of this current study is shown in Figure 2. The multisource data included precipitation, land use, social, and economy, and so on (Supplementary Table S1).
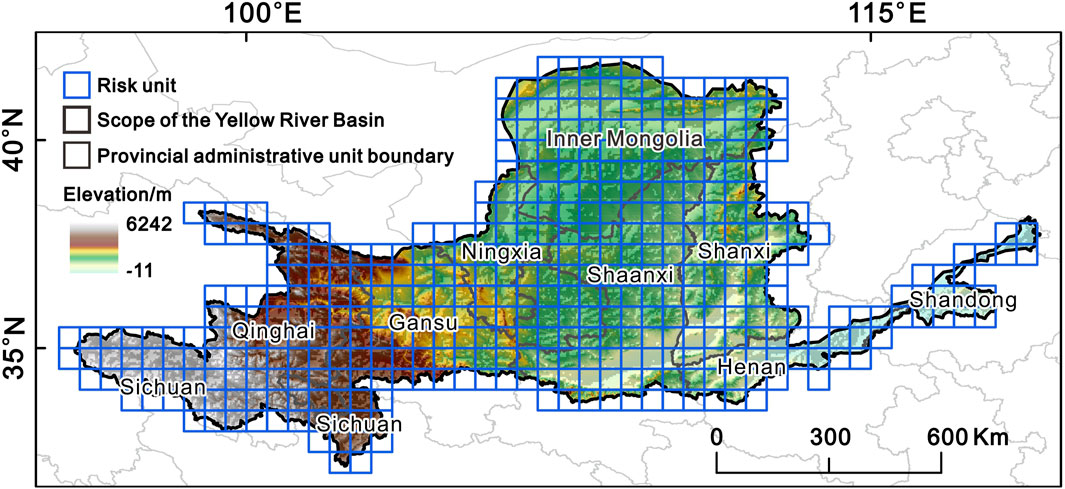
FIGURE 1. Yellow River basin and the division of flood risk units. Considering the resolution of CMORPH data (0.25° × 0.25°) and the size of the study area, the entire YRB was subdivided into 419 risk units with a grid size of 0.5°*0.5°.
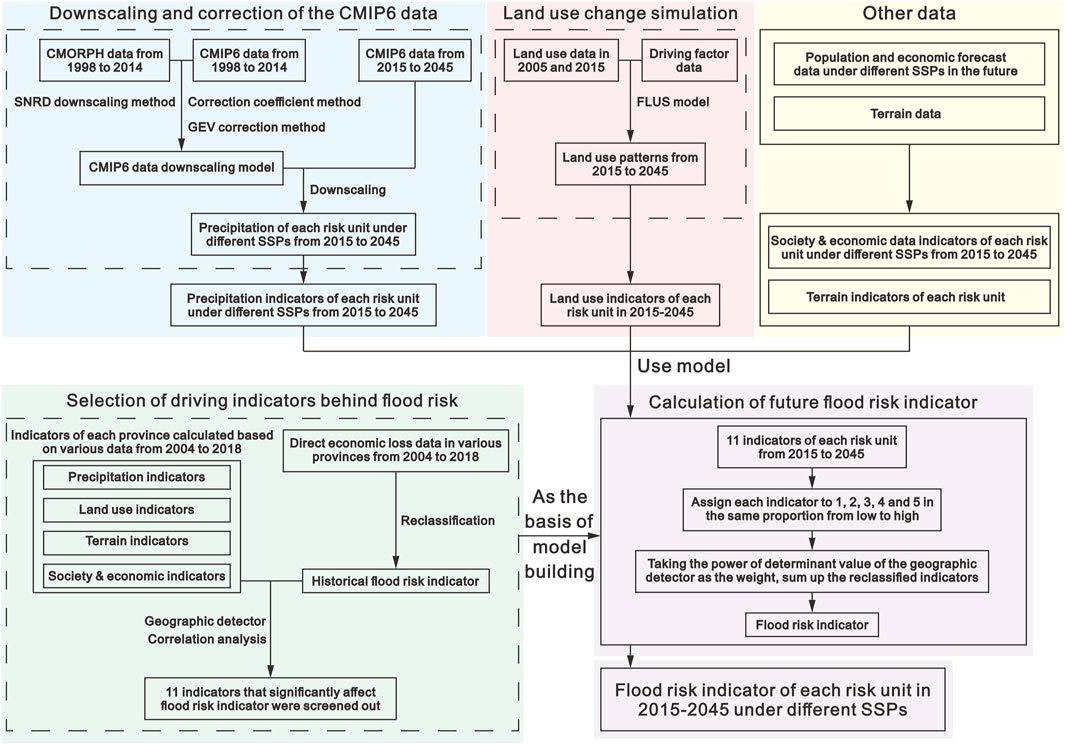
FIGURE 2. Analysis procedure of this current study.
The precipitation data we used included CMORPH data (Janowiak et al., 2005) and Coupled Model Intercomparison Project Phase 6 (CMIP6) data (https://esgf-index1.ceda.ac.uk/search/cmip6-ceda/). The CMORPH data (0.25° × 0.25°, 3 h, https://ftp.cpc.ncep.noaa.gov/precip/CMORPH_V1.0/) from 1998 to 2014 was used for daily precipitation calculation of each risk unit, construction, and precision evaluation of CMIP6 data downscaling model, and precipitation indicators calculation of provinces in the Yellow River basin from 2004 to 2018. Based on the historical CMIP6 data from 1998–2010 and 2011–2014 (combined with CMORPH data), the downscaling model was constructed and tested. Based on the CMIP6 data of SSP126, SSP245, SSP370, and SSP585 from 2015 to 2045, daily precipitation at each risk unit under different SSPs was calculated, which was used to predict the future flood hazard indicator and risk indicator.
In this study, we also used the ESA land use data (http://maps.elie.ucl.ac.be/CCI/viewer/) from 2004 to 2018. The land use types in the Yellow River basin were divided into cropland, green land (including forest and grassland), water area, built-up land, and unused land. This data was used to simulate the land usage pattern in the study area from 2015 to 2045, and calculate the land use indicators of each province in the YBR from 2004 to 2018. Combining the land use data, land use driving factor data, and the FLUS model, we predicted the future land use pattern of the YRB. The driving factors behind land use included natural factors, accessibility factors, and social and economic factors: 1) The natural factors included elevation, slope and aspect, elevation data sourced from Geospatial Data Cloud Platform (http://www.gscloud.cn), and slope and aspect data were calculated based on the elevation data; 2) The accessibility factors included distance to rivers, roads, railways, coastlines, and administrative centers, they were calculated based on vector data in the 1:100 million national basic geographic database and were sourced from the national geographic information resource directory service system (www.webmap.cn); 3) The social and economic factors (http://www.resdc.cn/DOI) included the spatial distribution of population density (Xu, 2017b) and GDP data (Xu, 2017a) in 2015.
We also used social and economic data, terrain data, and disaster data. The data of population quantity, population density, GDP, average GDP per person, and GDP per unit area of each province from 2004 to 2018 were sourced from Statistical Yearbooks of provinces across the YRB and were used as various social and economic indicators of the provinces within the YRB from 2004 to 2018. Shared socioeconomic path (SSPs) population and economic estimation data (Huang et al., 2019; Jing et al., 2019) was used to calculate the population and GDP indicators under different SSPs in the study area from 2015 to 2045. Terrain data, including elevation, slope, and aspect was used to calculate the terrain indicator of each risk unit in the study area and each province within the YRB. The disaster data referred to flood-induced direct economic loss data by provinces from 2004 to 2018, which were extracted from the Yearbook of Meteorological Disasters in China (CMA, 2020) and were used to screen the influencing factors of flood risk.
We used the precipitation datasets from 20 CMIP6 models with high temporal resolution (day) under historical, SSP126, SSP245, SSP370, and SSP585 scenarios of future emissions (Supplementary Table S2). Meanwhile, we improved a precipitation downscaling model based on precipitation data during the period from 1998 to 2010 to downscale the CMIP6 dataset. In addition, we used the precipitation data covering a period from 2011 to 2014 to evaluate the downscaling performance of the improved precipitation downscaling model. Then we had done the precipitation downscaling practice for the CMIP6 data from 2015 to 2045. The improvement and evaluation of the downscaling model can be elaborated as follows: 1) Adoption of the basic precipitation downscaling model. Based on the historical precipitation data of CMIP6 and the CMORPH data from 1998 to 2010 (the CMORPH precipitation data were used to reflect the actual observed precipitation data and hereafter), a nonlinear regression downscaling model (station-based nonlinear regression downscaling model, SNRD) (Shen et al., 2021) was used to downscale the CMIP6 precipitation data. Based on the SNRD model, 20 CMIP6 models can be ensembled to produce one new precipitation downscaling dataset which has the same spatial resolution (0.5° × 0.5°) as the risk unit. 2) Improvement of the abovementioned precipitation downscaling models. The first step was to correct the precipitation data using the correction coefficient method with the aim to overcome the underestimation of summer precipitation and the overestimation of winter precipitation. Correction of daily precipitation at each risk unit can be elaborated as follows:
where i denotes the month, j denotes the year,
The second step was to fit extreme precipitation using the generalized extreme value (GEV) distribution (Kharin and Zwiers, 2005), enhancing the modeling performance of the precipitation downscaling model. In this study, we defined the time period with daily precipitation of the top 5% for a certain period as extreme precipitation days, and then we obtained the fitting parameters at each risk unit by fitting the extreme daily precipitation data from 1998 to 2010, and these parameters were used to obtain extreme precipitation during the period of 2011–2045 at each risk unit. The final step was to deal with the outliers and negative precipitation values of the aforementioned downscaled precipitation. The downscaled extreme precipitation at risk units exceeding the maximum precipitation relative to the historical precipitation (1998–2010) was corrected to the maximum precipitation during the historical period, and the negative precipitation value in the downscaling results was corrected to 0. Then, we verified the abovementioned precipitation downscaling model by comparison between precipitation indicators, such as rainstorm days, days of heavy rain, and five-day maximum precipitation for each risk unit during 2011–2014, and the precipitation indicators based on CMORPH precipitation data during 2011–2014. In this study, we downscaled the CMIP6 data from 2015 to 2045 under different SSPs to explore changes in precipitation across the YRB.
The land use and land cover changes over the YRB would significantly affect the future evolution of flood risk (Qiu et al., 2010; Ji et al., 2021). Here, we simulated the spatial patterns of land use and land cover changes over the YRB using the FLUS model during a period from 2015 to 2045. The FLUS model is based on the historical land use pattern of a certain area and simulates the future land use changes in the area under the impacts of various driving factors. This model contains two computing modules, i.e., cellular automata and optimal probability computation based on the artificial neural network. The FLUS model can be called by GeoSOS-FLUS software for land use simulation (Liu et al., 2017). Based on land use driving factor data of the Yellow River basin and land use data from 2005 to 2015, we simulated and predicted the spatial pattern of land use changes using the FLUS model in 2025, 2035, and 2045. Furthermore, we set the same model parameters in GeoSOS-FLUS and simulated land use pattern in 2015 based on the spatial patterns of land use changes in 2005. We compared the simulated spatial pattern of land use in 2015 with the real-world spatial pattern of land use in 2015, evaluating modeling performance of FLUS in simulating land use changes based on the Kappa coefficient and the overall modelling accuracy.
Here, we listed flood-induced direct economic loss recorded in the Yearbook of Meteorological Disasters in China (CMA, 2020) in the provinces passed by the Yellow River from 2004 to 2018 and categorized flood-induced direct economic loss into low, slightly low, middle, slightly high, and high level in equal proportions (each accounted for 20% of the records). We assigned 1, 2, 3, 4, and 5 to different levels of flood-induced direct economic loss as the historical flood risk indicator over the years. It was generally accepted that flood risk was jointly determined by the precipitation factor, land use factor, terrain factor, and social and economic factor. Extreme precipitation can induce serious floods, and precipitation is one of the most important indicators affecting flood hazards and flood risks (Okazawa et al., 2011). Land use changes will affect flood risk in the river basin, for example, the increase of built-up land and cropland with high property value will increase the potential damage when floods occur (Schmitt et al., 2004). At the same time, urbanization and the increase of impervious surfaces will affect infiltration and flood runoff (Ogden et al., 2011). The terrain factors, such as elevation and slope, will affect the drainage capacity and the possibility of flooding in the area, and social and economic factors, such as population density, will affect the potential danger of flood to human life and health (Kandilioti and Makropoulos, 2012). Therefore, we calculated 77 indicators that may influence flood risk (Supplementary Table S3), including 26 precipitation indicators (Nos. 1–26), 10 land use indicators (Nos. 27–37), and 36 terrain indicators (Nos. 38–74), five social and economic indicators (Nos. 74–79).
Then, we screened out the indicators that were significantly correlated with the historical flood risk indicator (the correlation coefficient was significant at 0.001 significance level). Then, we performed attribution analysis using the geodetector method to screen out the indicators with a power of the determinant value of >0.35. In so doing, the screened-out indicators were convincing and the number of indicators screened out was moderate. Finally, a total of 11 indicators that significantly affected flood risk indicators were screened out (Table 1). We calculated the future flood risk indicator based on the screened-out indicators listed in Table 1.
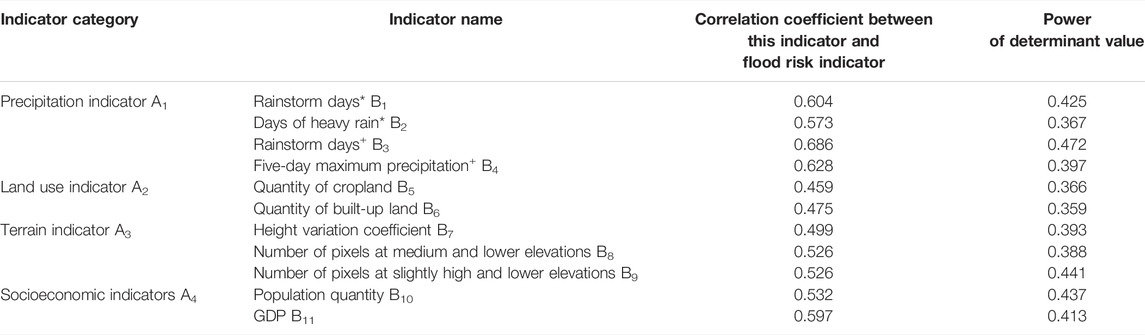
TABLE 1. Indicators that significantly affect the flood risk indicator.
Based on the screened-out indicators (Table 1), we calculated future flood risk indicators for each risk unit following the analysis procedure as shown in Figure 2. First, we computed indicators in Table 1 for each risk unit from 2015 to 2045 under different SSPs. Here, precipitation and society and economic data were changing over the years and SSPs, land use was also changing over the years, and terrain data were kept the same in different years under SSPs. Then, we listed the values of each indicator at each SSP, each year, and each risk unit, and reassigned 1, 2, 3, 4, and 5 to each indicator in the order from low to high in equal proportion to eliminate the influence of different dimensions and magnitudes on each indicator. Finally, we took the power of determinant value obtained by the geodetector method as the indicator weight and did the weighted sum of each indicator at each risk unit to calculate the future flood risk for all risk units under SSPs.
Therefore, the calculation method of flood risk indicator was as follows:
where Irisk denotes the flood risk indicator; B1, B2, B3, … , B11 are the indicators assigned 1, 2, 3, 4, and 5; B1 denotes the indicator “Rainstorm days*”; B2 denotes the indicator “Days of heavy rain*”; B3 denotes the indicator “Rainstorm days+”; B4 denotes the indicator “Five-day maximum precipitation+”; B5 denotes the indicator “Quantity of cropland”; B6 denotes the indicator “Quantity of built-up land”; B7 denotes the indicator “Height variation coefficient”; B8 denotes the indicator “Number of pixels at medium and lower elevations”; B9 denotes the indicator “Number of pixels at slightly high and lower elevations; B10 denotes the indicator “population quantity”; and B11 denotes the indicator “GDP.”
We evaluated the reliability of the results by a comparison between the calculated flood risk indicator using the aforementioned methods and the real flood risk indicator obtained by actual flood-induced direct economic loss, and the correlations were significant at the 0.001 significance level. The power of the determinant obtained by the geodetector reached 0.484. These verification results well-evidenced the modeling accuracy and can be accepted for further calculation of the future flood risk indicator. In this case, we adopted the abovementioned techniques to calculate the flood risk indicator across the YRB covering the period from 2015 to 2045 under different SSPs. It is worth noting that the indicators “Rainstorm days*” and “Rainstorm days+” at each risk unit had the same values, which were equal to the number of rainstorm days for the risk unit in a certain year and SSPs. Moreover, the indicators “Days of heavy rain*” and “Five-day maximum precipitation+” were the number of heavy rain days and the five-day largest precipitation amount for the risk unit in a certain year and SSP.
Different from the flood risk indicator, the flood hazard indicator is only determined by the precipitation indicator in Table 1. The calculation procedure was as follows: calculate the “Rainstorm days*”, “Rainstorm days+”, “Days of heavy rain*”, and “Five-day maximum precipitation +”, rank indicators from low to high values, and assign 1, 2, 3, 4, and 5 to each ranked indicators in equal proportion. Then, we took the power of determinant value by geodetector as the index weight and did weighted summation of each index to calculate the flood hazard indicator.
Therefore, the calculation method for flood hazard indicator was as follows:
where Ihazard denotes the flood hazard indicator; B1, B2, B3, and B4 are the indicators assigned 1, 2, 3, 4, and 5; B1 denotes the indicator “Rainstorm days*”; B2 denotes the indicator “Days of heavy rain*”; B3 denotes the indicator “Rainstorm days+”; and B4 denotes the indicator “Five-day maximum precipitation+”.
The advantages of the flood risk indicator calculation method proposed in this study are as follows: 1) the flood risk indicator was rigorously defined and used to reflect flood-induced direct economic loss; 2) rigorous selection of risk-related indicators that were directly related to flooding risk; 3) when calculating the flood risk indicator, precipitation, land use, terrain, social and economic, and other indicators were thoroughly considered, showing holistic impacts of driving factors on the flood.
After the calculation of the flood risk indicator and flood hazard indicator at all risk units in 2015–2045 under different SSPs, the following methods were adopted for further processing:
1) When displaying and analyzing the spatial distribution pattern of flood risk indicator (and flood hazard indicator), we divided the flood risk indicator (and flood hazard indicator) of each year, each SSP, and each risk unit into low, slightly low, medium, slightly high, and high grades (all accounting for 20%) according to the proportional method, and used the Kriging interpolation method to process the data of each risk unit, and drew a map based on the interpolation results.
2) Using Mann–Kendall (MK) trend test (Guo et al., 2018) with a significance level of 0.05 to explore the changing trend of flood hazard indicators under different SSPs.
3) Because the frequency and intensity of extreme precipitation events fluctuate over time, the flood hazard indicator and flood risk indicator tend to fluctuate over time. Therefore, in order to reflect the overall change trend of flood risk indicator and eliminate the influence of interannual fluctuation, we calculated linear regression between the flood hazard indicator of each risk unit under each SSPs and the year, and then calculated the fitting values of flood risk indicators of each risk unit under SSPs from 2015 to 2045 according to the regression equation, and used them to replace the measured values. Based on this value, the flood risk indicator of each risk unit under each SSP was calculated.
The comparison between simulated and real-world land use patterns in 2015 showed a Kappa coefficient of 0.958 and the overall modeling accuracy was 0.979, indicating that the prediction accuracy was acceptable. The simulated land use pattern over the YRB from 2015 to 2045 is shown in Figure 3, which reveals the expanding built-up land area from 1.4 to 3.4% during 2015–2045 based on the FLUS model, and expanding built-up land was found mainly in Xi’an, Zhengzhou, Luoyang, and Taiyuan, while the cultivated land and unused land decreased slightly and the proportion of cultivated land (unused land) decreased from 30.2 (3.2%) to 28.7% (2.7%) in the future 30 years. Green land and cultivated lands were the main land use and land cover types across the YRB, accounting for 64.1 and 29.5% of the average annual land area of the YRB, respectively. The cultivated land was mainly distributed in the southeastern parts of the YRB, and the green land was mainly distributed in the western and northwestern parts of the YRB.
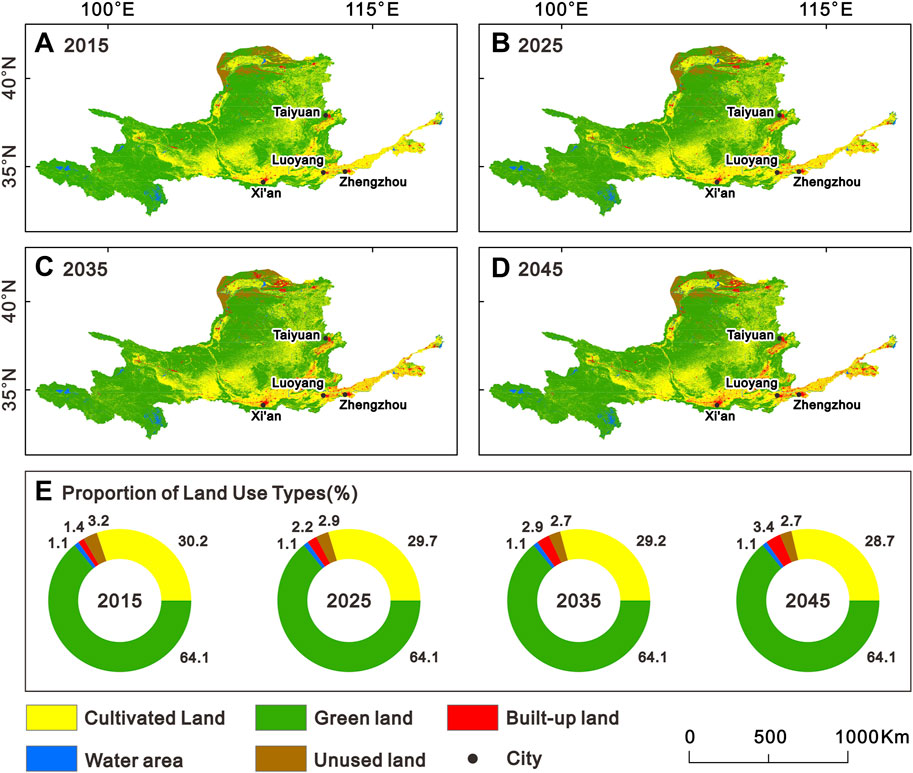
FIGURE 3. Spatial pattern and area proportion of land use types in the Yellow River basin from 2015 to 2045. (A–D) Respectively refer to the spatial pattern of land use in 2015, 2025, 2035, and 2045. (E) Refers to the proportion of various land use types over the years.
Comparison of areal average daily precipitation of the downscaled CMIP6 and CMORPH data across the YRB from 2011 to 2014 indicated underestimation (overestimation) of summer (winter) precipitation by SNRD (Figure 4A). In addition, downscaled precipitation by SNRD poorly described the extreme precipitation processes. Figure 4B shows that the improved SNRD model well overcame the underestimation (overestimation) of summer (winter) precipitation. The improved or modified SNRD enhanced the downscaling performance of the SNRD model.
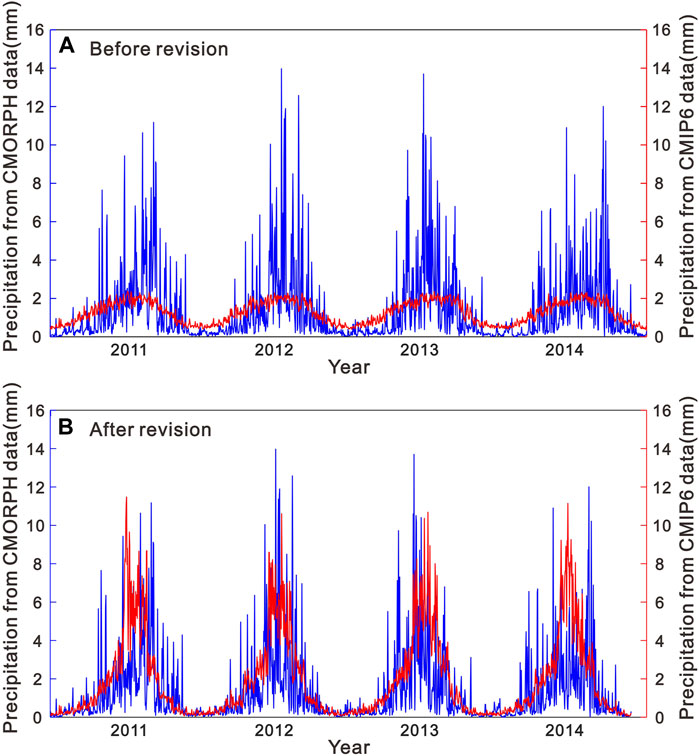
FIGURE 4. Comparison of the average daily precipitation in the Yellow River basin obtained from CMORPH and CMIP6 downscaling data from 2011 to 2014 before (A) and after correction (B).
Based on the CMIP6 data and the CMORPH data, we computed the long-term average of rainstorm days, days of heavy rain, and five-day maximum precipitation for all risk units. Then, we did a correlation analysis of the downscaled CMIP6 data and CMORPH data (Table 2). We found that correlations between downscaled CMIP6 data and CMORPH data were statistically significant at 0.001 significance level. Based on the downscaled CMIP6 data using the original SNRD (Step 1), corrected downscaled precipitation using the correction coefficient (Step 2), and holistically corrected downscaled precipitation (Step 3) from 2011 to 2014, we calculated the average precipitation during the time interval with precipitation amount larger than 5% percentile for 2011–2014. We standardized the Taylor plot (Figure 5), reflecting differences in average precipitation by the downscaled CMIP6 after different corrections and CMORPH data. Figure 5 shows a closer relation of corrected downscaled CMIP6 by the correction coefficient to CMORPH data with increased correlation coefficients from 0.611 to 0.758 and was significant at 0.001 significance level. The standard deviation and central RMSE were closer to the CMORPH data. After all, corrections were done to the SNRD-based downscaling practice, the downscaled CMIP6 data was closer to the CMORPH data with a correlation coefficient increased to 0.817. These findings evidenced that the corrected downscaled CMIP6 data can better depict precipitation changes after correction by the GEV distribution function.
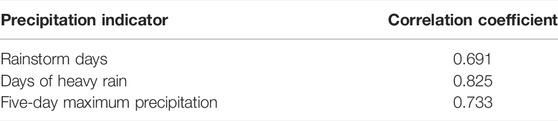
TABLE 2. Correlation coefficient between downscaled CMIP6 data and CMORPH data.
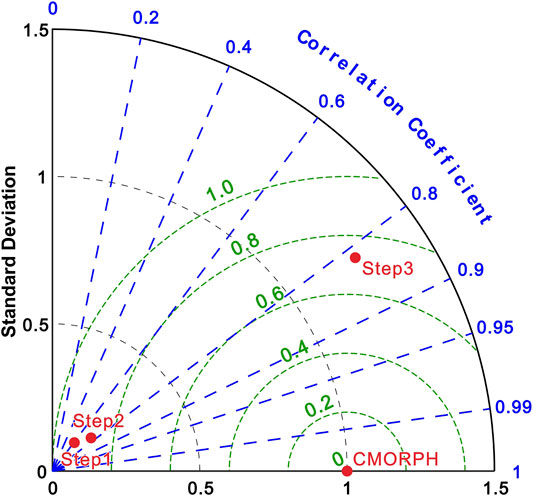
FIGURE 5. Standardized Taylor diagram of spatial distribution sequence of average precipitation in extreme precipitation period of each risk unit obtained from CMORPH data and CMIP6 downscaling data in different stages of correction (Step 1: before correction; Step 2: only correction by correction coefficient method; Step 3: complete all corrections).
It can be seen from Figure 6 that under SSP126, SSP245, and SSP585, the risk units with an increasing (significantly increasing) flood hazard indicator from 2015 to 2045 reached 65.2, 69.0, and 64.5% (4.8, 6.2, and 4.1% respectively), being significantly more than the risk units with decreasing flood hazard indicator (33.6, 29.8, and 32.9%, respectively) and significantly decreasing flood hazard indicator (1.7, 0.2, and 0.7% respectively). Under SSP370, the proportion of risk units with an upward trend in the flood hazard indicator was 46.0%, being slightly less than the risk units with a downward trend (52.3%) in the flood hazard indicator, while risks units with a significant upward trend (3.3%) in flood hazard indicator were more than risk units with a significant downward trend (2.4%) in flood hazard indicator. All these findings indicated that the overall flood hazard indicator across the YRB was amplified from 2015 to 2045, which was manifested by the increase in the frequency and intensity of rainstorms and flood events.
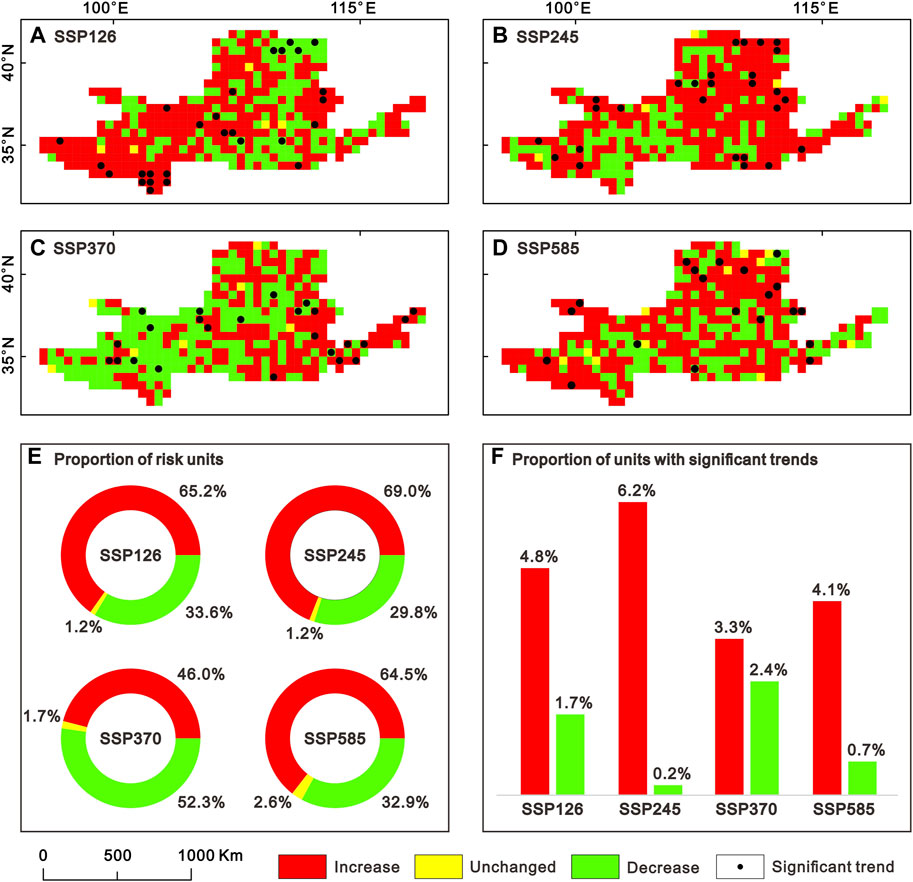
FIGURE 6. Trends in flood hazard indicators in the Yellow River basin from 2015 to 2045 under SSP126, SSP245, SSP370, and SSP585 based on the Mann-Kendall (MK) trend test with a significance level of 0.05 (A–D); the proportion of risk units with various trends under SSP126, SSP245, SSP370, and SSP585 (E) and proportion of risk units with a significant increase or decrease under SSP126, SSP245, SSP370, and SSP585 (F).
The spatial pattern of long-term (from 2015 to 2045) average flood hazard indicators under different SSPs is shown in Figure 7. It can be seen from Figure 7 that no remarkable difference can be identified in the flood hazard indicator over the YRB under different SSPs, while the flood hazard indicator was subjected to obvious spatial differentiation, and this spatial differentiation tended to be weak in the southeastern parts to the northwestern parts of the YRB. Meanwhile, high and slightly high flood hazard indicator area was identified mainly concentrated in the southeastern parts of the YRB. This was because the extreme precipitation amounts decreased from southeastern to northwestern parts of the YRB, and higher extreme precipitation amount can be observed in eastern and southeastern parts of the YRB (Li et al., 2017) with higher frequency and intensity of rainstorms and flood events.
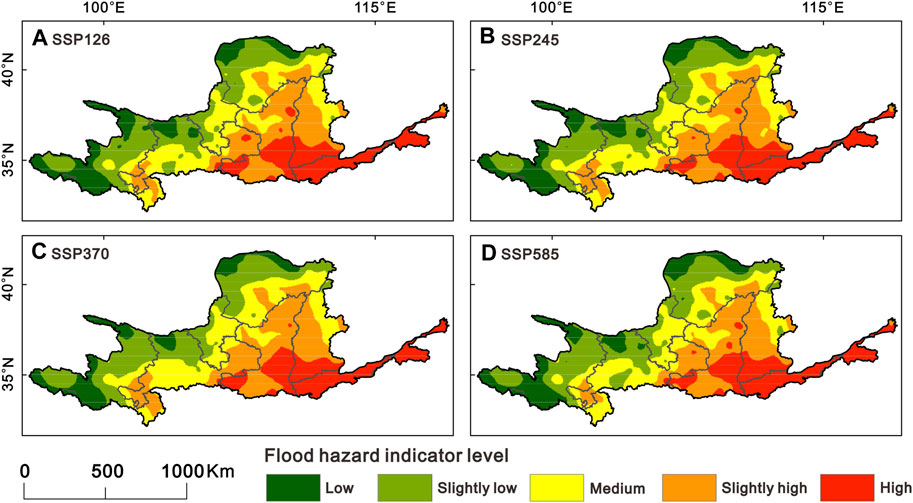
FIGURE 7. Spatial distribution of flood hazard indicator (multiyear average from 2015 to 2045) in the Yellow River basin under SSP126 (A), SSP245 (B), SSP370 (C), and SSP585 (D).
Figure 8 demonstrates the flood risk indicator over the YRB covering a period from 2015 to 2045 under different SSPs. We found no distinct differences in flood risk indicator values under different SSPs. The period from 2015 to 2045 witnessed a slight increase in the flood risk indicator over the YRB. When compared to the spatial distribution of flood risk indicators in 2015, in 2045, areas with high flood risk indicators would expand slightly, but areas with low flood risk indicators would shrink slightly. Just as presented in the aforementioned section, the flood hazard indicator over the YRB would increase as a whole from 2015 to 2045. Also, the rainstorm and flood events would become more frequent and intensified. Meanwhile, the built-up land would increase from 1.4 to 3.4% in 2045 (Figure 3), according to the estimated population and the economic data of the shared socioeconomic pathways (SSPs), under SSP126, SSP245, SSP370, and SSP585, the total GDP of the YRB in 2045 would be 3.93, 3.75, 3.00, and 4.29 times higher than that of 2015, respectively. Therefore, given the occurrence of floods, the YRB would suffer higher economic losses. Furthermore, the flood risk indicator would be subject to more obvious spatial differentiation. High and slightly high flood risk indicator area is mainly distributed in the southeastern parts of the YRB, including the lower and middle YRB, the southern part of the YRB, and the northern part of the Ningxia (Figure 9A).
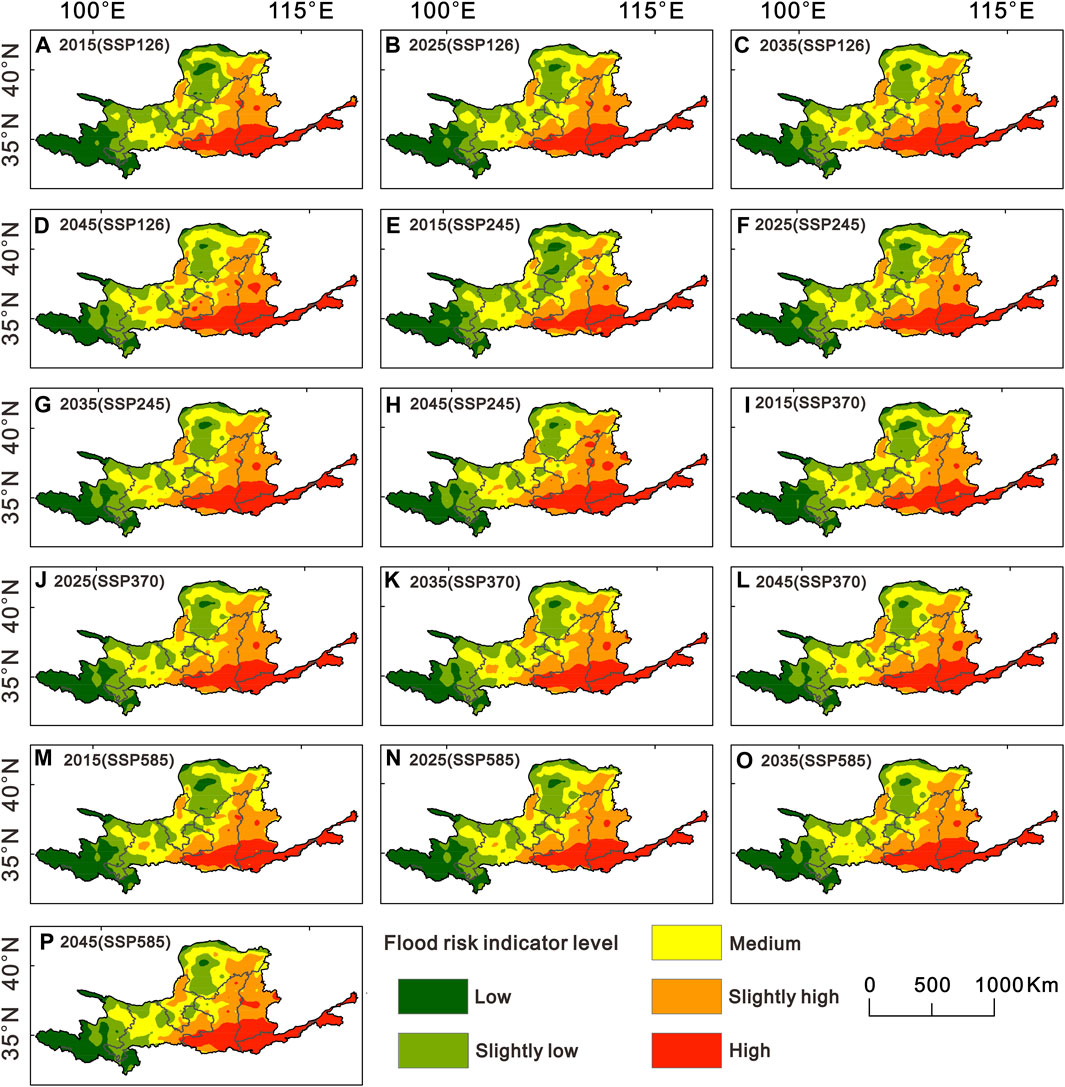
FIGURE 8. Flood risk indicator in the Yellow River basin under SSP126 (A–D), SSP245 (E–H), SSP370 (I–L), and SSP585 (M–P) from 2015 to 2045.
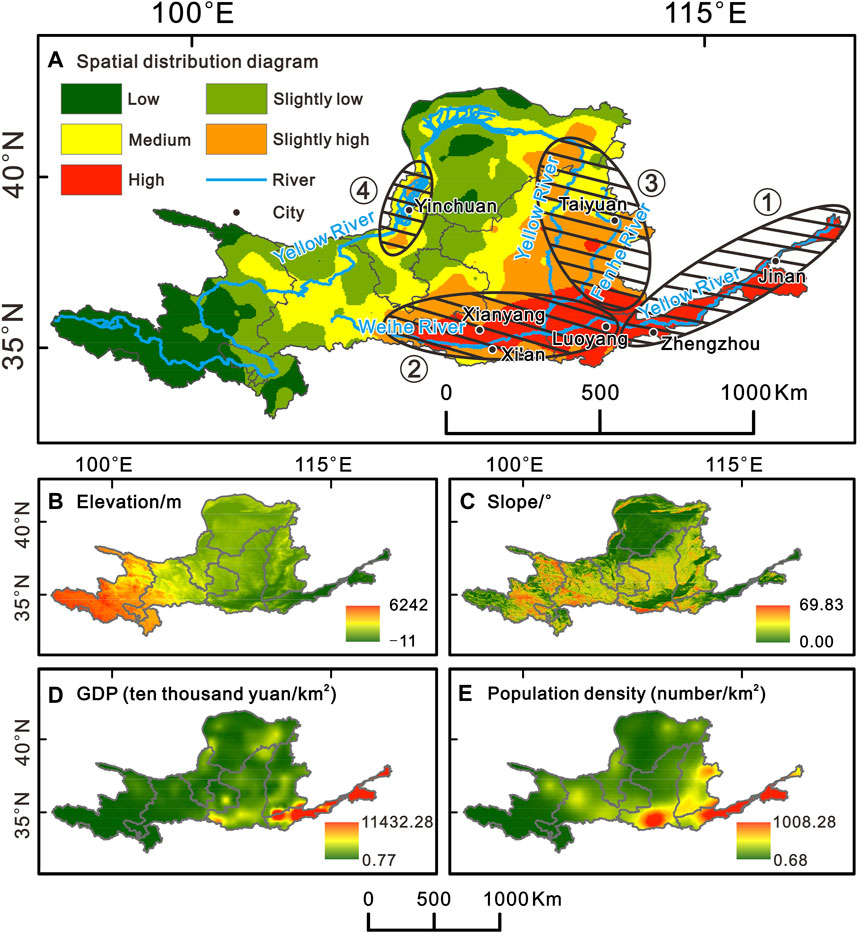
FIGURE 9. Spatial pattern of regions with slightly high and high flood risks in the Yellow River Basin (A) and distribution map of some influencing factors (B–E). Note: In Figure 9A, ① the lower reaches of the Yellow River, ② the southern part of the Yellow River basin, ③ the middle Yellow River basin, and ④ the northern part of Ningxia. Figure 9A shows the spatial pattern of flood risks in the Yellow River basin in 2025 under SSP245. Figures 9D–E shows the spatial pattern of distribution of population and GDP under shared socioeconomic pathways (SSPs) in 2025 under SSP245.
The lower YRB is low-lying in terrain with high risks of extreme precipitation and is vulnerable to flooding inundation (Figures 9A,C). In addition, the lower YRB is dominated by cultivated land and built-up land (Figure 3) with a highly-developed economy and dense population (Figures 9D,E), such as, according to China City Statistical Yearbook 2020 (Urban Social and Economic Investigation Division of National Bureau of Statistics, 2020), Zhengzhou (in 2019, the city’s annual average population reached 8.73 million, and the regional GDP reached 1.159 trillion RMB), and Jinan (with an average annual population of 7.91 million in 2019 and a GDP of 944.3 billion RMB) (Figure 9A). Massive economic losses can be expected given the occurrence of flood events. For example, on July 17–22, 2021, Henan Province suffered torrential rain, with an hourly rainfall of 201.9 mm from 16:00 to 17:00 on July 20, breaking the record of the maximum hourly rainfall on the Chinese mainland. The accumulated rainfall in 3 h was 333 mm and that in 24 h was 627.4 mm (Zhong et al., 2021), which caused extremely serious casualties and property losses. Therefore, the lower YRB is at high flood risk. According to the “Yellow River Yearbook”, in the 20 years from 1919 to 1938, floods occurred in 14 out of 20 years in the lower YRB. The river banks along the lower YRB are higher than the surrounding ground. There stands an 800-km long confined and super-elevated channel belt perching around 10 m above the surrounding ground (Chen et al., 2012). If the river bank breaches, flood bursts, and massive economic losses and fatalities would occur. In addition, more evidence indicated that the length of the elevated channel and riverbank in the lower YRB increased to 550 km, and the main trough is 1.16 m higher than the floodplain on average, posing a serious threat to the downstream cities and residents (Zhang and Fang, 2017).
The distribution of high flood risk indicators in the southern part of the YRB can be attributed to the high frequency of extreme precipitation events. Vast low-lying plains combined with hills and highlands accelerate flow confluence when heavy precipitation events occur (Figures 9B,C). At the same time, the Wei River flows through this region (Figure 9A), and the Wei River has high sediment content and muddy water. The sand deposition is serious, and the river bed will also rise. Floods with high sediment content have posed serious threats to this region (Li and Xia, 2020). In addition, built-up land and arable land in this area are widely distributed (Figure 3) with a densely populated and highly-developed economy (Figures 9D,E). For example, according to China City Statistical Yearbook 2020 (Urban Social and Economic Investigation Division of National Bureau of Statistics, 2020), Luoyang (the city’s annual average population reached 7.43 million in 2019 and a regional GDP reached 503.5 billion RMB), Xi’an (with an average annual population of 9.4 million in 2019 and a GDP of 932.1 billion RMB), Xianyang (with an average population of 4.59 million in 2019 and a GDP of 2,195 million RMB) (Figure 9A), are all under high flood risk.
The middle YRB is dominated by the Fenhe Plain, the spatial combination of hills and plains accelerates the speed of flow in plain areas (Figures 9B,C). High frequent extreme precipitation renders the middle YRB susceptible to floods (YRCC, 2020). Meanwhile, built-up land and arable land in this area are widely distributed (Figure 3). A relatively dense population and developed socio-economy render this region susceptible to flood-induced losses (Figures 9D,E). The middle YRB is not only seriously threatened by torrential rains and floods, but is also the main source of floods for the lower YRB, posing a threat to the lower YRB (YRCC, 2020). The mainstream of the Yellow River flows through the northern part of Ningxia (Figure 9A), which is located in the Ningxia Plain with low-lying terrain (Figures 9B,C). There are major cities, such as Yinchuan with an average annual population of 1.97 million and a regional GDP of 189.7 billion RMB in 2019 (Urban Social and Economic Investigation Division of National Bureau of Statistics, 2020) (Figure 9), being highly susceptible to floods. From the Qing Dynasty to 1949, there occurred 24 recorded serious floods in Ningxia, about one serious flood even per 13 years (YRCC, 2020).
There are still critical scientific issues in flood risk evaluation, such as subjectivity in the selection of evaluation indicators and obscure definitions of flood risk. Here, we classified flood-induced direct economic losses, quantifying flood risk indicators. Meanwhile, correlation analysis and geodetector were adopted to evaluate the weights of indicators, such as precipitation, land use, terrain, social, and economy that have profound impacts on flood risk over the YRB. Furthermore, we did a holistic evaluation of flood risk indicators and flood hazard indicators using the FLUS model and the improved SNRD downscaling model across the YRB from 2015 to 2045 under different SSPs. We obtained the following important findings and conclusions.
1) From the simulated land use pattern over the YRB from 2015 to 2045, we detected expanding built-up land area from 1.4 to 3.4% from 2015 to 2045 and a slight decrease in cultivated land and unused land from 30.2 (3.2%) to 28.7% (2.7%) in the future 30 years. The cultivated land is mainly distributed in the southeastern parts of the YRB, and the green land is mainly distributed in the western and northwestern parts of the YRB. These changes in land use and land cover change have enhanced susceptibility to flooding. In addition, we improved the SNRD precipitation downscaling model using correction coefficient and GEV model, greatly improving the accuracy of downscaled extreme precipitation.
2) In most areas of the Yellow River basin, the flood hazard is increasing from 2015 to 2045 under SSP126, SSP245, and SSP585, which is manifested by the increase in the frequency and intensity of rainstorm and flood events. Therefore, we can conclude that flood hazards would be amplified in the backdrop of climate change during 2015–2045. With respect to the spatial pattern of flood hazard indicators, we identified high and slightly high flood hazard indicators mainly concentrated in the southeastern parts of the YRB of the basin. Specifically, flood hazard indicators decreases from southeastern to northwestern parts of the YRB as a whole, and high and slightly high flood hazard indicator was identified mainly in the middle and lower YRB.
3) We detected no distinct difference in flood risk indicators across the YRB under different SSPs. From 2015 to 2045, we depicted a slight increase in the flood risk indicator over the YRB. Meanwhile, when compared to the spatial distribution of flood risk indicators in 2015, we found slightly expanded areas with high flood risk indicators and slightly shrunk regions with low flood risk indicators. Specifically, we found regions with high and slightly high flood risk indicators mainly in the southeastern parts of the YRB, including the lower and middle YRB, the southern YRB, and the northern parts of Ningxia.
4) For evaluating uncertainties, we first calculated the daily precipitation of each risk unit in 2015–2045 under different SSPs based on CMIP6 data but we must admit that the simulation of future precipitation by each CMIP6 model itself was uncertain and the spatial resolution of CMIP6 data was coarse, although we used the SNRD method to downscale CMIP6 data and corrected the downscaling result, the uncertainty of future precipitation prediction still existed. Second, we used the FLUS model to predict the future land use change in the Yellow River basin based on the land use pattern in 2005 and 2015, which was based on the assumption that land use change in 2005–2015 in the Yellow River basin would remain unchanged in 2015–2045. Once the new land use policy is adopted in the Yellow River basin, the future land use simulation based on the FLUS model would be modified, which would introduce uncertainty. At the same time, shared socioeconomic path (SSPs) population and economic estimation data used in this study also involve uncertainties because the data of the future period is obtained by estimation. Finally, there are uncertainties in flood risk assessment methods, although this study screened the driving indicators behind flood risk and verified the accuracy of the research method many times. However, the model constructed in this study was still relatively simple, with inadequate consideration given to some indicators that are difficult to quantify, such as disaster prevention policies and disaster mitigation capabilities but the mechanism of flood disaster is very complicated. Therefore, the calculation method of future flood risk indicator was also one of the sources of uncertainty.
In this study, we inadequately considered the disaster mitigation capability of each risk unit in the Yellow River basin, including fortification level, drainage pipeline construction level, reliability of disaster prevention system, emergency rescue management capability, etc. Because these factors were difficult to express quantitatively, it was also difficult to predict their changing trends with time under different SSPs. Therefore, the flood risk indicator calculated in this study has not included these factors; our findings here reflected the relative degree of potential losses that each risk unit would suffer under the influence of a flood disaster. The results can better reflect which areas need to improve their disaster mitigation capabilities to deal with high potential flood risks.
The original contributions presented in the study are included in the article/Supplementary Material, further inquiries can be directed to the corresponding author.
JS contributed to the computation and original version of the manuscript. QZ contributed to the funding support, the idea behind this study, revision of the original version, and guidance. WW, ZS, GW, and C-YX contributed to the revision of this manuscript. VS contributed to the editing of the manuscript, critical improvement of the analysis, interpretation of this results and overall improvement of the quality of this manuscript.
This research was financially supported by the National Natural Science Foundation of China, Grant No. 42041006, the China National Key R&D Program, Grant No. 2019YFA0606900, and the Research Council of Norway (FRINATEK Project No. 274310).
The authors declare that the research was conducted in the absence of any commercial or financial relationships that could be construed as a potential conflict of interest.
All claims expressed in this article are solely those of the authors and do not necessarily represent those of their affiliated organizations, or those of the publisher, the editors, and the reviewers. Any product that may be evaluated in this article, or claim that may be made by its manufacturer, is not guaranteed or endorsed by the publisher.
The Supplementary Material for this article can be found online at: https://www.frontiersin.org/articles/10.3389/feart.2022.900866/full#supplementary-material
Abdulrazzak, M., Elfeki, A., Kamis, A., Kassab, M., Alamri, N., Chaabani, A., et al. (2019). Flash Flood Risk Assessment in Urban Arid Environment: Case Study of Taibah and Islamic Universities' Campuses, Medina, Kingdom of Saudi Arabia. Geomatics, Nat. Hazards Risk 10, 780–796. doi:10.1080/19475705.2018.1545705
Benito, G., Lang, M., Barriendos, M., Llasat, M. C., Frances, F., Ouarda, T., et al. (2004). Use of Systematic, Palaeoflood and Historical Data for the Improvement of Flood Risk Estimation. Review of Scientific Methods. Nat. Hazards 31, 623–643.
Beylich, M., Haberlandt, U., and Reinstorf, F. (2021). Daily vs. Hourly Simulation for Estimating Future Flood Peaks in Mesoscale Catchments. Hydrology Res. 52, 821–833. doi:10.2166/nh.2021.152
Cœur, D., and Lang, M. (2008). Use of Documentary Sources on Past Flood Events for Flood Risk Management and Land Planning. COMPTES RENDUS Geosci. 340, 644–650. doi:10.1016/j.crte.2008.03.001
Chen, Y., Syvitski, J. P. M., Gao, S., Overeem, I., and Kettner, A. J. (2012). Socio-Economic Impacts on Flooding: A 4000-Year History of the Yellow River, China. AMBIO 41, 682–698. doi:10.1007/s13280-012-0290-5
China Meteorological Administration (CMA) (2020). Yearbook of Meteorological Disasters in China 2019. Beijing: Meteorological Press, 183–185. (in Chinese).
Duan, W., Hanasaki, N., Shiogama, H., Chen, Y., Zou, S., Nover, D., et al. (2019). Evaluation and Future Projection of Chinese Precipitation Extremes Using Large Ensemble High-Resolution Climate Simulations. J. Clim. 32, 2169–2183. doi:10.1175/JCLI-D-18-0465.1
Duan, W., He, B., Nover, D., Fan, J., Yang, G., Chen, W., et al. (2016). Floods and Associated Socioeconomic Damages in China over the Last Century. Nat. Hazards 82, 401–413. doi:10.1007/s11069-016-2207-2
Guo, M., Li, J., He, H., Xu, J., and Jin, Y. (2018). Detecting Global Vegetation Changes Using Mann-Kendal (MK) Trend Test for 1982-2015 Time Period. Chin. Geogr. Sci. 28, 907–919. doi:10.1007/s11769-018-1002-2
Hallegatte, S., Green, C., Nicholls, R. J., and Corfee-Morlot, J. (2013). Future Flood Losses in Major Coastal Cities. Nat. Clim. Change 3, 802–806. doi:10.1038/NCLIMATE1979
Hu, P., Zhang, Q., Shi, P., Chen, B., and Fang, J. (2018). Flood-induced Mortality across the Globe: Spatiotemporal Pattern and Influencing Factors. Sci. Total Environ. 643, 171–182. doi:10.1016/j.scitotenv.2018.06.197
Huang, J., Qin, D., Jiang, T., Wang, Y., Feng, Z., Zhai, J., et al. (2019). Effect of Fertility Policy Changes on the Population Structure and Economy of China: From the Perspective of the Shared Socioeconomic Pathways. Earth's Future 7, 250–265. doi:10.1029/2018EF000964
Janowiak, J. E., Kousky, V. E., and Joyce, R. J. (2005). Diurnal Cycle of Precipitation Determined from the CMORPH High Spatial and Temporal Resolution Global Precipitation Analyses. J. Geophys. Res. 110. doi:10.1029/2005JD006156
Ji, G., Lai, Z., Xia, H., Liu, H., and Wang, Z. (2021). Future Runoff Variation and Flood Disaster Prediction of the Yellow River Basin Based on CA-Markov and SWAT. Land 10, 421. Land. 10. doi:10.3390/land10040421
Jing, C., Tao, H., Jiang, T., Wang, Y., Zhai, J., Cao, L., et al. (2020). Population, Urbanization and Economic Scenarios over the Belt and Road Region under the Shared Socioeconomic Pathways. J. Geogr. Sci. 30, 68–84. doi:10.1007/s11442-020-1715-x
Kandilioti, G., and Makropoulos, C. (2012). Preliminary Flood Risk Assessment: the Case of Athens. Nat. Hazards 61, 441–468. doi:10.1007/s11069-011-9930-5
Kharin, V. V., and Zwiers, F. W. (2005). Estimating Extremes in Transient Climate Change Simulations. J. Clim. 18, 1156–1173. doi:10.1175/JCLI3320.1
Lai, C., Shao, Q., Chen, X., Wang, Z., Zhou, X., Yang, B., et al. (2016). Flood Risk Zoning Using a Rule Mining Based on Ant Colony Algorithm. J. Hydrology 542, 268–280. doi:10.1016/j.jhydrol.2016.09.003
Li, B. Q., Hou, B. D., Dong, X. Y., and Wang, H. J. (2017). A Multifactor Analysis of the Spatial Distribution of Annual Mean Extreme Precipitation-Taking the Yellow River Basin as an Example. IOP Conf. Ser. Earth Environ. Sci. 82, 012025. doi:10.1088/1755-1315/82/1/012025
Li, J., and Xia, J. (2020). Modelling of Hyperconcentrated Flood Routing and Channel Evolution in the Lower Weihe River. Arab. J. Geosci. 13. doi:10.1007/s12517-020-06028-9
Li, X., Hu, Q., Wang, R., Zhang, D., and Zhang, Q. (2021). Influences of the Timing of Extreme Precipitation on Floods in Poyang Lake, China. Hydrology Res. 52, 26–42. doi:10.2166/nh.2021.078
Liu, L., Jiang, T., Xu, H., and Wang, Y. (2018). Potential Threats from Variations of Hydrological Parameters to the Yellow River and Pearl River Basins in China over the Next 30 Years. Water 10, 883. doi:10.3390/w10070883
Liu, X., Liang, X., Li, X., Xu, X., Ou, J., Chen, Y., et al. (2017). A Future Land Use Simulation Model (FLUS) for Simulating Multiple Land Use Scenarios by Coupling Human and Natural Effects. Landsc. Urban Plan. 168, 94–116. doi:10.1016/j.landurbplan.2017.09.019
Liu, Y., You, M., Zhu, J., Wang, F., and Ran, R. (2019). Integrated Risk Assessment for Agricultural Drought and Flood Disasters Based on Entropy Information Diffusion Theory in the Middle and Lower Reaches of the Yangtze River, China. Int. J. Disaster Risk Reduct. 38, 101194. doi:10.1016/j.ijdrr.2019.101194
Luu, C., von Meding, J., and Mojtahedi, M. (2019). Analyzing Vietnam's National Disaster Loss Database for Flood Risk Assessment Using Multiple Linear Regression-TOPSIS. Int. J. Disaster Risk Reduct. 40, 101153. doi:10.1016/j.ijdrr.2019.101153
Mason, D. C., Speck, R., Devereux, B., Schumann, G. J.-P., Neal, J. C., and Bates, P. D. (2010). Flood Detection in Urban Areas Using TerraSAR-X. IEEE Trans. Geosci. Remote Sens. 48, 882–894. doi:10.1109/TGRS.2009.2029236
Ogden, F. L., Raj Pradhan, N., Downer, C. W., and Zahner, J. A. (2011). Relative Importance of Impervious Area, Drainage Density, Width Function, and Subsurface Storm Drainage on Flood Runoff from an Urbanized Catchment. Water Resour. Res. 47. doi:10.1029/2011WR010550
Okazawa, Y., Yeh, P. J.-F., Kanae, S., and Oki, T. (2011). Development of a Global Flood Risk Index Based on Natural and Socio-Economic Factors. Hydrological Sci. J. 56, 789–804. doi:10.1080/02626667.2011.583249
Qiu, Y., Jia, Y., Zhao, J., Wang, X., Bennett, J., and Zhou, Z. (2010). Valuation of Flood Reductions in the Yellow River Basin under Land Use Change. J. Water Resour. Plann. Manage. 136, 106–115. doi:10.1061/(ASCE)0733-9496
Rahman, M. R., and Thakur, P. K. (2018). Detecting, Mapping and Analysing of Flood Water Propagation Using Synthetic Aperture Radar (SAR) Satellite Data and GIS: A Case Study from the Kendrapara District of Orissa State of India. Egypt. J. Remote Sens. Space Sci. 21, S37–S41. doi:10.1016/j.ejrs.2017.10.002
Ridolfi, E., Mondino, E., and Di Baldassarre, G. (2021). Hydrological Risk: Modeling Flood Memory and Human Proximity to Rivers. Hydrology Res. 52, 241–252. doi:10.2166/nh.2020.195
Rodda, H. J. E. (2005). The Development and Application of a Flood Risk Model for the Czech Republic. Nat. Hazards 36, 207–220. doi:10.1007/s11069-004-4549-4
Sanyal, J., and Lu, X. X. (2005). Remote Sensing and GIS-Based Flood Vulnerability Assessment of Human Settlements: a Case Study of Gangetic West Bengal, India. Hydrol. Process. 19, 3699–3716. doi:10.1002/hyp.5852
Schmitt, T., Thomas, M., and Ettrich, N. (2004). Analysis and Modeling of Flooding in Urban Drainage Systems. J. Hydrology 299, 300–311. doi:10.1016/j.jhydrol.2004.08.012
Shen, Z., Zhang, Q., Singh, V. P., Sun, P., He, C., and Cheng, C. (2021). Station‐based Non‐linear Regression Downscaling Approach: A New Monthly Precipitation Downscaling Technique. Int. J. Climatol. 41, 5879–5898. doi:10.1002/joc.7158
Shui-xin, Z., Yan, Z., Sheng, H., Zi-tong, C., Wei-yu, D., Ye-rong, F., et al. (2021). Verification and Assessment of Real-Time Forecasts of Two Extreme Heavy Rain Events in Zhengzhou by Operational NWP Models. J. Trop. Meteorology 27, 406–417. doi:10.46267/j.1006-8775.2021.035
Urban Social and Economic Investigation Division(USEID) of National Bureau of Statistics (2020). CHINA CITY STATISTICAL YEARBOOK 2020, 13-19. Beijing: China Statistics, 69–75. (in Chinese).
Waghwala, R. K., and Agnihotri, P. G. (2019). Flood Risk Assessment and Resilience Strategies for Flood Risk Management: A Case Study of Surat City. Int. J. Disaster Risk Reduct. 40, 101155. doi:10.1016/j.ijdrr.2019.101155
Wang, G., Zhang, Q., Yu, H., Shen, Z., and Sun, P. (2020). Double Increase in Precipitation Extremes across China in a 1.5 °C/2.0 °C Warmer Climate. Sci. Total Environ. 746, 140807. doi:10.1016/j.scitotenv.2020.140807
Wang, J.-F., and Hu, Y. (2012). Environmental Health Risk Detection with GeogDetector. Environ. Model. Softw. 33, 114–115. doi:10.1016/j.envsoft.2012.01.015
Wu, Y., Zhong, P.-a., Zhang, Y., Xu, B., Ma, B., and Yan, K. (2015). Integrated Flood Risk Assessment and Zonation Method: a Case Study in Huaihe River Basin, China. Nat. Hazards 78, 635–651. doi:10.1007/s11069-015-1737-3
Xu, X. L. (2017a). Data from: China's GDP Spatial Distribution Kilometer Grid Data Set. Data Registration and Publishing System of Chinese Academy of Sciences Resources and Environment Science Data Center. Available at: http://www.resdc.cn/DOI.
Xu, X. L. Data from: China's Population Spatial Distribution Kilometer Grid Data Set. Data Registration and Publishing System of Chinese Academy of Sciences Resources and Environment Science Data Center. (2017b). Available at: http://www.resdc.cn/
Yellow River Conservancy Commission (YRCC) (2001). The Chronicle of Events of the Yellow River. Yellow River Water Conservancy Publishing House, 715. (in Chinese).
Yellow River Conservancy Commission (YRCC) (2020). Yellow River Yearbook 2020. Yellow River Yearbook Press, 86–92. (in Chinese).
Yu, H., Zhang, Q., Xu, C.-Y., Du, J., Sun, P., and Hu, P. (2019). Modified Palmer Drought Severity Index: Model Improvement and Application. Environ. Int. 130, 104951. doi:10.1016/j.envint.2019.104951
Zhang, H., Luo, J., Wu, J., and Yu, M. (2022). Spatial-temporal Characteristics and Driving Factors of Flash Floods in Shaanxi Province Considering Regional Differentiation. Hydrology Res. 53, 156–174. doi:10.2166/nh.2021.103
Zhang, Q., Gu, X., Singh, V. P., Shi, P., and Sun, P. (2018). More Frequent Flooding? Changes in Flood Frequency in the Pearl River Basin, China, since 1951 and over the Past 1000 Years. Hydrol. Earth Syst. Sci. 22, 2637–2653. doi:10.5194/hess-22-2637-2018
Zhang, Q., Li, J., Singh, V. P., and Xiao, M. (2013). Spatio-temporal Relations between Temperature and Precipitation Regimes: Implications for Temperature-Induced Changes in the Hydrological Cycle. Glob. Planet. Change 111, 57–76. doi:10.1016/j.gloplacha.2013.08.012
Zhang, X., and Fang, X. (2017). Temporal and Spatial Variation of Catastrophic River Floodings in the Lower Yellow River from AD 960 to 1938. Holocene 27, 1359–1369. doi:10.1177/0959683617690590
Keywords: flood risk, risk evaluation, CMIP6, shared socioeconomic pathways, Yellow River basin
Citation: Song J, Zhang Q, Wu W, Singh VP, Shen Z, Wang G and Xu C-Y (2022) Amplifying Flood Risk Across the Lower Yellow River Basin, China, Under Shared Socioeconomic Pathways. Front. Earth Sci. 10:900866. doi: 10.3389/feart.2022.900866
Received: 21 March 2022; Accepted: 19 April 2022;
Published: 20 May 2022.
Edited by:
Xing Yuan, Nanjing University of Information Science and Technology, ChinaReviewed by:
Fei Yuan, Hohai University, ChinaCopyright © 2022 Song, Zhang, Wu, Singh, Shen, Wang and Xu. This is an open-access article distributed under the terms of the Creative Commons Attribution License (CC BY). The use, distribution or reproduction in other forums is permitted, provided the original author(s) and the copyright owner(s) are credited and that the original publication in this journal is cited, in accordance with accepted academic practice. No use, distribution or reproduction is permitted which does not comply with these terms.
*Correspondence: Qiang Zhang, emhhbmdxNjhAYm51LmVkdS5jbg==
Disclaimer: All claims expressed in this article are solely those of the authors and do not necessarily represent those of their affiliated organizations, or those of the publisher, the editors and the reviewers. Any product that may be evaluated in this article or claim that may be made by its manufacturer is not guaranteed or endorsed by the publisher.
Research integrity at Frontiers
Learn more about the work of our research integrity team to safeguard the quality of each article we publish.