 Huarui Hu
 Binwei Xia1,2*
- 1State Key Laboratory of Coal Mine Disaster Dynamics and Control, Chongqing University, Chongqing, China
- 2School of Resources and Safety Engineering, Chongqing University, Chongqing, China
The disturbance due to coal mining causes the surrounding rock to undergo a complex process of stress changes during which the axial pressure and the confining pressure usually change accordingly at the same time. Existing studies generally investigated this process from a static perspective, which was not rigorous. The mechanical characterization of rock is very important to understand the failure of rock mass and the safety of mining during mining disturbance. Based on theoretical analysis, we conducted axial loading and radial unloading tests on the cracked sandstone, which was combined with the ultrasonic testing technology to examine its failure rules and to characterize and analyze its failure process using longitudinal wave velocity. The results demonstrated that crack length and angle had a significant impact on the strength and mechanical properties of sandstone, and the former had a greater impact on the strength of sandstone than the latter. As the crack length increased, the strength, elastic modulus, and deformation modulus of sandstone decreased, and the strength of sandstone increased as the crack angle increased. Elastic and deformation moduli first decreased and then increased. Furthermore, Poisson’s ratio increased slowly, then decreased slowly, and finally increased rapidly as the lateral pressure coefficient diminished, and Poisson’s ratio was more sensitive to changes in the angle. In this study, the change of longitudinal wave velocity reflected the whole process of sandstone failure. When the wave velocity was stable, the rock was at the yield limit point. Moreover, when the wave velocity was unstable, the sandstone was in a progressive failure period, and as a result, the wave velocity decreased and the sandstone cracked.
Introduction
There are a large number of natural cracks in the rock mass (Hoxha et al., 2005) that will develop and finally form a crack network under the influence of the rock mass structure, crustal stress, and coal mining. This changes the structure and mechanical properties of the cracked rock mass and destroys the integrity of the rock mass (Xue et al., 2021; Long et al., 2018; Zhang et al., 2019; Hu et al., 2022; Huang et al., 2016a). Furthermore, it may cause geological disasters and huge safety hazards to normal production operations, especially in deep surrounding rocks with complex stress environments, because a slight disturbance may cause great damage (Zhao et al., 2019; Niu et al., 2020; Zhou and Bi, 2012; Zhao et al., 2020). In the coal mining process, the surrounding rock affected by mining disturbance experiences a process in which the axial pressure first increases and then decreases until it is destroyed, and the confining pressure gradually decreases during this period (Figure 1) (Xie et al., 2011; Meng et al., 2017; Liang et al., 2020). As the mining work advances, the axial pressure at point A first increases and then decreases, while the confining pressure is always decreasing. The deformation characteristics, strength characteristics, and mechanical characteristics of surrounding rock under dynamic disturbance are quite different from those under static load (Xie et al., 2009; Gao et al., 2019; Guo and Yu, 2021). Usually, the confining pressure is in an unloaded state when the axial pressure increases. The static loading ignores the impact of engineering activities on coal and rock mass, and cannot reflect the in-situ stress state of rock mass and mining path (Kolymbas et al., 2012; Chanyshev and Abdulin, 2014; Cheng et al., 2019; Behera et al., 2020). Therefore, considering the in-situ state of the rock mass and the mining path, the study of the instability and failure law of the surrounding rock during coal seam mining is important for surrounding rock support.
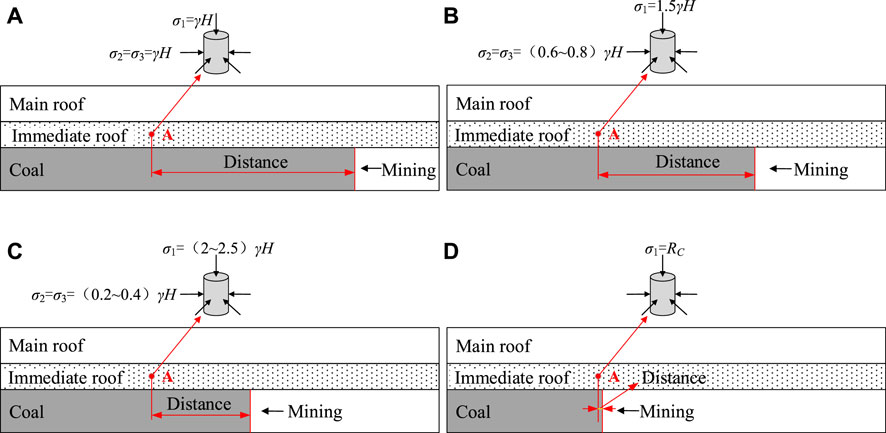
FIGURE 1. Stress diagram of the roof in coal mining.
Several scholars and experts have already studied the mechanical behavior and strength change law of rock under the action of mining. Lu et al. (2020) and Zhang et al. (2018) studied the deformation and failure of surrounding rock under different true triaxial stress paths under original rock stress conditions. Bai et al. (2019) used true triaxial equipment to study surrounding rock under excavation conditions and to investigate three-dimensional stress change and its failure law. Xie et al. (2011) and Peng et al. (2015) conducted the conventional triaxial unloading tests under the mining-induced stress for three types of typical mining layouts to investigate the mining-induced mechanical behavior of rock in front of the longwall panel. The results indicated that the energy dissipation during mining unloading was smaller than that in the conventional laboratory tests. Li and Sun, (2021), Yang et al. (2018), and Zhao J. et al. (2020) analyzed the excavation process with the help of laboratory tests and numerical simulation methods. They believed that mining disturbances would affect the stress distribution law, displacement, and failure law of surrounding rock, and local stress concentration would have a greater impact on crack propagation. Among them, it has obvious effects on crack propagation, rock failure mode and mechanical properties of mining or excavation (Gao et al., 2005; Ghamgosar and Erarslan, 2016; Yin and Chen, 2020).
To explore the influence of underground excavation activities on rock masses, scholars have carried out a lot of research on this topic from a dynamics or statics perspective. Yang and Hu, (2020) studied the crack initiation and crack propagation law under the condition of unloading of the confining pressure, and investigated their influence on rock fracture. Zhou and Bi. (2015) studied the impact of the unloading rate and dynamic parameters on the stress field and crack development law of surrounding rock during dynamic unloading. Through the triaxial compression test and numerical simulation. Cong et al. (2020) explored the influence of the unloading stress level on the failure mechanism of the specimen from macroscopic and microscopic perspectives. Li et al. (2020) and Tao et al. (2013) used LS-DYNA to simulate the unloading process of the rock under three-dimensional stress during the underground excavation process and analyzed the rock failure process from the perspective of energy release. Zhao et al. (2021) analyzed the changes of rock crack propagation and elastic modulus and Poisson’s ratio under cyclic loading and unloading. Liu et al. (2017) and Yan et al. (2020) analyzed the fatigue deformation modulus, and energy evolution and crack growth laws of jointed rock masses under loading and unloading conditions from the dynamic and static perspectives. Under different stress paths, the stress-strain curve, irreversible strain, elastic modulus, and Poisson’s ratio of the fractured rock mass show significant differences (Liu et al., 2017; Shi et al., 2020). In particular, the confining pressure has a significant effect on the expansion of the fracture and the macro-mechanical properties of the rock (Huang et al., 2016b; Liu and Dai. 2018; Yang and Zhang, 2020). However, these studies failed to represent rock behavior under mining-induced stress conditions.
In this research, we performed an experimental study to realize the influence of the inclination and size of a single crack on the mechanical properties of sandstone under complex stress paths. In this regard, we collected the acoustic wave velocity data in a damaged layer of sandstone to characterize the process of rock damage. Through the Geotechnical Consulting and Testing Systems triaxial rock testing system (GCTS RTX3000), the stress path of the surrounding rock during coal mining was designed to simulate the crack process of the cracked sandstone. In this way, the mechanical properties of the sandstone specimen with a single crack were examined, and the relationship between the width of the sandstone crack and the acoustic wave velocity was established. This is useful for assessing the impact of coal mining on the surrounding rock and engineering safety.
Test Methodology
Sample Preparation
Sandstone samples were cut from a single block without visible cracks and processed into cylinders with a diameter of 50 mm and a height of 100 mm. The specimens were polished on both sides to ensure that they were flat, which met the requirements of the International Society for Rock Mechanics and Engineering. The cracks with different lengths and inclination angles were prefabricated in the center of the specimens, and the width of the cracks was 1 mm. In Table 1, D and H denote the diameters and heights of the specimens, respectively, and α and 2L indicate the inclination angle of the cracks and length of the specimens. Each experiment was conducted three times.
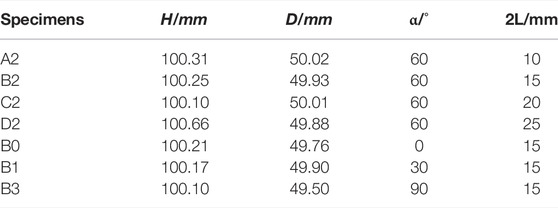
TABLE 1. Physical properties of sandstone specimens.
Experimental Setup
The mechanical behaviors of the sandstone were examined using a stiff servo-controlled testing machine, GCTS Triaxial Rock Testing System (RTX-3000) (Figure 2A), which had a frame stiffness of 10 GN/m. The testing machine was equipped with a triaxial confining pressure cell of 210 MPa as well as linear variable differential transformers (LVDTs) for axial and circumferential strain measurements, and the maximum confining pressure can be loaded up to 70 MPa. A thermoplastic membrane was wrapped around the specimens during the tests. Moreover, the two axial extensometers that were fixed on black rings existing on the sides of the specimens were the axial strain LVDTs, and the central rim was the radial strain LVDT. The measurement range is from −6 to 6 mm, and the measurement error is less than 0.25%. Then external loads were applied to the specimens using the loading platens. After launching wave transducers that were mounted between the top and bottom platens, they received the P and S wave signals.
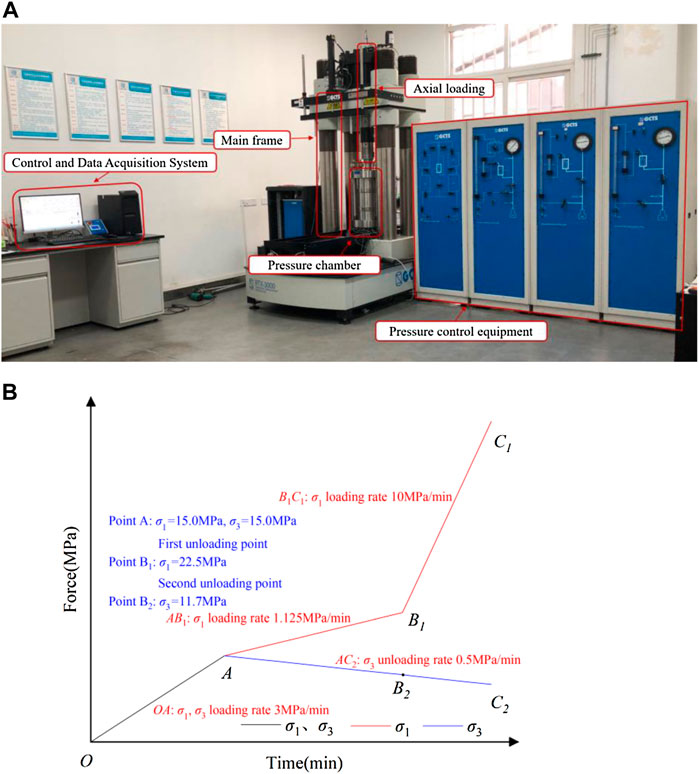
FIGURE 2. Test equipment and plan. (A) The true-triaxial module of GCTS triaxial rock testing system (RTX-3000). (B) The stress path of σ1 and σ3.
The test scheme was designed based on the 8,203 working face of the Datong Tongxin coal mine, Datong City, Shanxi Province, China. The initial rock stress of the immediate roof was 15 MPa σ1, σ2, and σ3 represent the three-dimensional stresses applied on the rock samples to simulate the stress state of rock mass during excavation. The hydrostatic pressure (σ1 = σ2 = σ3) was imposed with a rate of 3.0 MPa/min up to 15 MPa. Then σ1 was simultaneously raised to 22.5 MPa at the rate of 1.125 MPa/min, and σ3 was simultaneously reduced at the rate of 0.5 MPa/min. Finally, while reducing σ3 at the rate of 0.5 MPa/min, the stress σ1 was increased with a rate of 10 MPa/min until rock failure occurred (Figure 2B).
Results
Stress-Strain Curves of Sandstone With Different Single-Crack Geometries
The stress-strain curves of sandstone with different single-crack geometries are depicted in Figures 3, 4, indicating relationships between
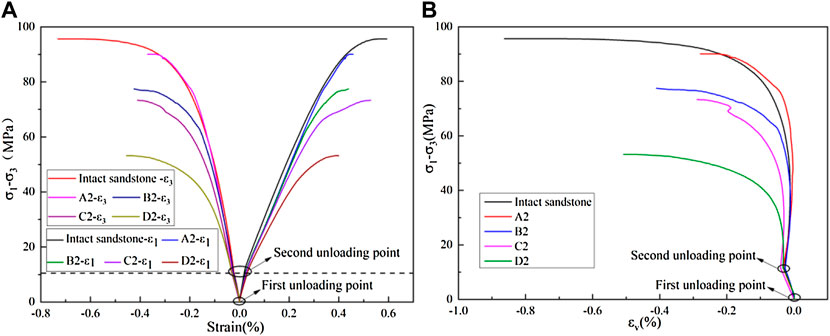
FIGURE 3. Stress-strain curve of sandstone samples with different crack lengths and an intact sample: (A) deviator stress vs minimum principal strain; (B) deviator stress vs volumetric strain (A2, 60°, 10 mm; B2, 60°, 15 mm; C2, 60°, 20 mm; D2, 60°, 25 mm; B0, 0°, 15 mm; B1, 30°, 15 mm; B3, 90°, 15 mm).
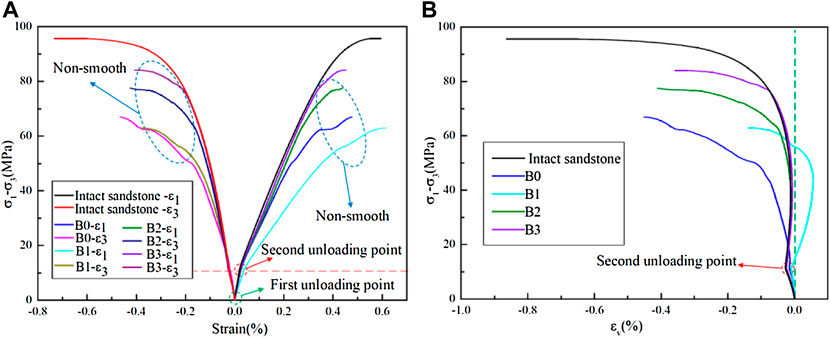
FIGURE 4. Stress-strain curve of sandstone samples with different single-crack angles and an intact sample: (A) deviator stress vs minimum principal strain; (B) deviator stress vs volumetric strain (A2, 60°, 10 mm; B2, 60°, 15 mm; C2, 60°, 20 mm; D2, 60°, 25 mm; B0, 0°, 15mm; B1, 30°, 15 mm; B3, 90°, 15 mm).
As crack length increased during elastic deformation, the elastic limit decreased significantly (Figure 3A). For sandstone samples with different single-crack angles (Figure 4A), the elastic limits of sample B3 and the intact sandstone were essentially the same, revealing that when the crack angle was 90°, the elastic limit was insensitive to elastic deformation. However, it must be noted that some cracks likely propagated in sample B3 because of the stress concentration near the tips of the pre-existing single crack, which was clearly different from the initially intact sample. Sample B1 had the smallest elastic limit, and
During the failure stage, the sandstone deformation changed from purely elastic to elastic-plastic and the stress concentration near the tips of the pre-existing single crack became more apparent. Therefore, the (
The
Failure Behaviors of the Sandstone Specimens
The failure modes of samples with different crack lengths were mostly X-shaped conjugate shear failure (Figures 5B–D). For sample A2, however, the crack angle deflected and became parallel to the direction of maximum principal stress during stress loading, resulting in the formation of a single shear failure surface that had three cracks at the crack tips: one shear crack and two tensile cracks. The crack initiation angle of θ is the angle between the pre-existing crack and the new crack, which is assumed positive anticlockwise and negative clockwise. The initiation angle θ of the tensile crack was 29° and that of the shear crack was 7° (Figure 5A). Figures 5B,C show the failure modes of samples B2 and C2. It can be seen that two tensile cracks and two shear cracks were formed at the crack tips where the θ ranged from 14° to 35° for the tensile crack and from −99° to −130° for the shear crack. Because
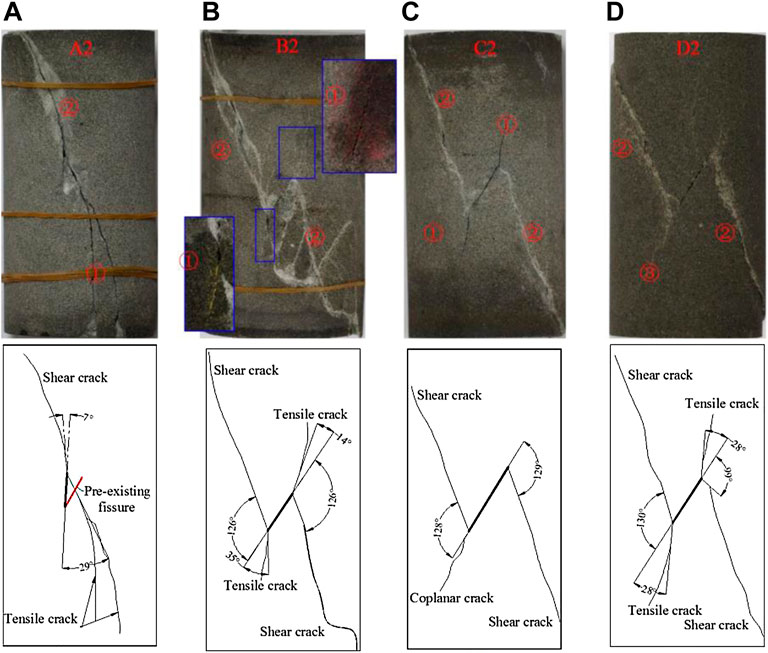
FIGURE 5. Failure modes of sandstone samples with a fixed crack angle of 60° and single crack lengths of (A) A2, 60°, 10 mm, (B) B2, 60°, 15 mm, (C) C2, 60°, 20 mm, and (D) D2, 60°, 25 mm.
Figure 6 displays the failure modes of samples with different single crack angles. Sample B2 underwent an X-shaped conjugate shear failure, but samples B0, B1, and B3 underwent a single shear failure just like the intact sample. Sample B0 produced two shear cracks at the crack tips and two tensile cracks parallel to the maximum principal stress at the crack tips and middle, where θ of shear cracks was between −64° to −71° (Figure 6A). However, samples B1 and B3 only produced two shear cracks at the crack tips and θ was between −100° to −156° (Figures 6B,D). The failure degree of samples B0 and B2 around the crack was complex and spalling was observed, suggesting that the stress distribution around the crack was complicated.
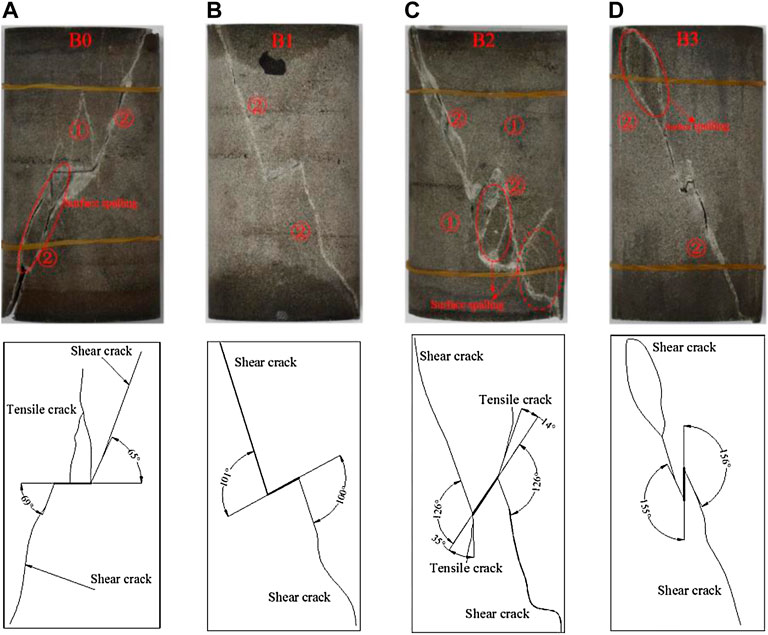
FIGURE 6. Failure modes of sandstone samples with a single crack length of 15 mm and crack angles of (A) B0, 0°, (B) B1, 30°, (C) B2, 60°, and (D) B3, 90°.
According to the above analysis, tensile and shear cracks were formed in single-crack samples under unloading conditions. The failure modes of samples containing single cracks included single shear failure, tensile-shear comprehensive failure, and X-shaped conjugate shear failure (coplanar and non-coplanar). As the length of the pre-crack increased, the failure modes were as follows: tensile-shear comprehensive failure, X-shaped non-coplanar shear failure, and X-shaped coplanar shear failure (Figure 5). In the loading and unloading test, when the axial pressure was close to the peak value, the shear cracks stopped propagating, but tensile cracks were generated at the tip of the prefabricated crack. As the axial pressure continued to increase, the shear cracks and tensile cracks began to propagate. Because the shear cracks propagated faster, a shear failure surface was formed in the specimen until it was broken, then the tensile crack stopped expanding. Because the prefabricated crack length in the specimen was different, the crack initiation angle and deflection angle were different, and the tensile crack propagation length was also different. When the prefabricated crack was longer (Figure 5D), it was easier to observe this phenomenon. The sample with a crack length of 25 mm showed an X-shaped coplanar shear failure. Figure 6 exhibits that with increasing crack angle, the variation magnitude of θ was about 30°. The crack angle influences the crack propagation and failure of the specimen. The failure modes of samples with different single crack angles were as follows: tensile-shear comprehensive failure, single shear failure, and X-shaped conjugate inclined plane shear failure.
Discussion
Effect of Single-Crack Geometry on Sandstone Deformation Parameters and Strength
The loading and unloading stress paths show the trace of
where E is rock specimen deformation modulus; μ is rock specimen Poisson’s ratio, and λ is lateral pressure coefficient, which is the ratio of confining pressure to axial stress.
Equation 1 is suitable for linear elastic deformation. When a sample passes through the yield point, the
where ES is the deformation modulus of the peak strength, and
Εt1, Εt2, and Ε50 are defined as elastic modulus in the first and second unloading stages and at 50% of compressive strength. The Εt1, Ε50, Εt2, and ΕS values of single-crack samples under loading-unloading test were calculated through Eqs. 1, 2 (Figures 7A,B). The following relationship was obtained during the loading and unloading stress paths:
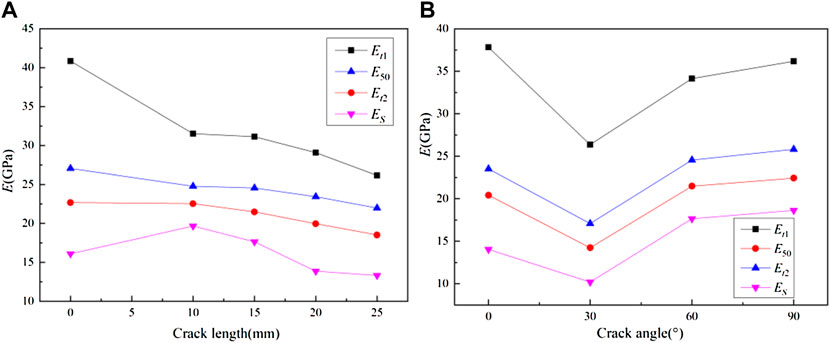
FIGURE 7. Elastic and deformation moduli of samples containing single cracks for (A) crack length (B) crack angle.
The elastic and deformation moduli of the unloading stage generally decreased with increasing crack length (Figure 7A). A specimen with a crack length of zero is considered an intact specimen. One exception was the deformation modulus ΕS of sample A2 because the crack angle deflected under stress towards the maximum principal stress direction. For samples with different single-crack angles, the elastic and deformation moduli of the unloading stage initially decreased and then increased with increasing crack angle (Figure 7B).
Figure 8 presents the relationship between Poisson’s ratio (μ) and lateral pressure coefficient (λ) of cracked sandstones with different lengths and angles in the loading and unloading tests. The lateral pressure coefficient refers to the ratio of the horizontal compressive stress to the vertical compressive stress. During the test, as the axial stress increased and the confining pressure decreased, the lateral pressure coefficient gradually decreased. It can be observed that there was a large lateral deformation during the unloading process of the rock mass, thus, the Poisson’s ratio (μ) at the first unloading stage exceeded 0.5. In the elastic deformation stage, because of the small value of vσ1/vσ3 in the first unloading stage, the confining pressure unloading rate (vσ3) had a greater influence on Poisson’s ratio. At this time, the volume expanded because Poisson’s ratio had a nearly linear increase with decreasing lateral pressure coefficient. When vσ1 increased to a certain value, the axial loading rate suddenly increased to 10 MPa/min and entered the second unloading stage. At this time, the value of vσ1/vσ3 was 20, the value of (σ1 - σ1) increased rapidly, and σ1 became the primary factor that controlled the deformation of the specimen. Furthermore, the axial compression deformation increased significantly, and the transverse deformation changed less. The cracks generated in the previous unloading stage in the sample were compacted, and the sample volume gradually decreased. Moreover, the Poisson’s ratio decreased almost linearly with the decrease of the lateral pressure coefficient. With the increase of σ1 and the decrease of σ3, the lateral pressure coefficient gradually decreased, and the rate of decrease was faster than that of the first unloading stage. Furthermore, new cracks were generated in the sandstone sample, the sample changed from volume compression to volume expansion, and Poisson’s ratio increased rapidly. At this time, the sample was in the unsteady fracture development stage. Finally, the specimen had obvious expansion and shear failures.
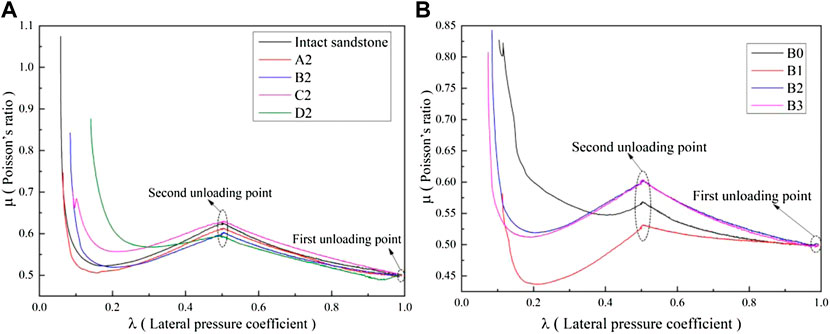
FIGURE 8. Relationship between Poisson’s ratio (μ) and lateral pressure coefficient (λ) of the single-crack samples: (A) crack length (A2, 10 mm; B2, 15 mm; C2, 20 mm; D2, 25 mm); (B) crack angle (B0, 0°; B1, 30°; B2, 60°; B3, 90°).
Sample failure under the loading and unloading stress paths caused the volume to expand and the sandstone Poisson’s ratio to increase. Eq. 1 shows that Poisson’s ratio was not only related to lateral pressure coefficient but also to
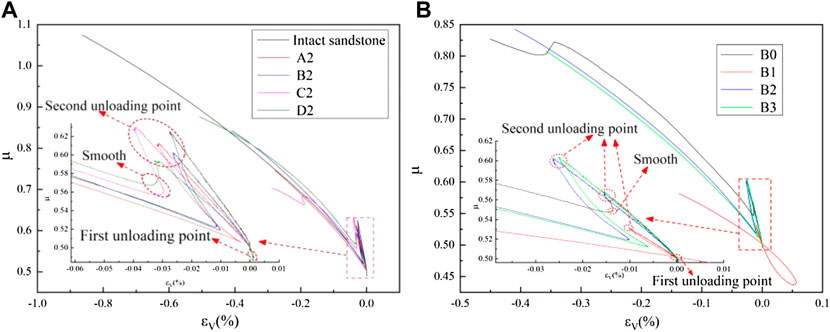
FIGURE 9. Relationship between Poisson’s ratio and volumetric strain of the single-crack samples: (A) crack length (A2, 10 mm; B2, 15 mm; C2, 20 mm; D2, 25 mm); (B) crack angle (B0, 0°; B1, 30°; B2, 60°; B3, 90°).
According to the results presented above, the
Relationship Between the Ultrasonic Velocity and Stress of Sandstone Specimens
Ultrasonic techniques are a non-destructive testing method that can effectively evaluate the mechanical properties of rocks (Zhu et al., 2020; Zuo et al., 2020). During the test, the travel time increment of the ultrasonic wave through a specimen is equal to the time increment when the cracks are filled with air. Based on the P wave velocity, the rock failure process can be characterized and analyzed, The equation which is commonly employed to calculate the crack width (w) as follows (Wang and Li, 2015):
where w is the total crack width (mm), the positive or negative value of w reflects the development of cracks in the sample, and the value of w can be understood as the cumulative value of the crack change in each wave speed test cycle, and its absolute value reflects the deformation of the sample; v is the wave velocity through the sandstone specimen during the test (m/s); v0 is the wave velocity through the sandstone specimen before loading (m/s); H is the height of the sandstone specimen (m), and va is the propagation speed of sound waves in the air (340 m/s). After performing a simple mathematical calculation, Eq. 3 can be written as follows:
Figures 10, 11 show the observed relationships between the crack width, ultrasonic velocities, axial stress, and axial strain. First, the width of the crack decreased rapidly, then it decreased at a slower rate, and the rate gradually decreased until it reached zero. At this time, the width of the crack remained constant. As the stress gradually changed, the crack width began to increase. The above process reflected the compaction stage and the elastic deformation stage of the sandstone specimen after it was loaded. Furthermore, the stable development stage, unstable crack development stage, and other processes of crack evolution were observed during the process. In the initial stage of the crack compaction, the cracks of sandstone specimens became closed quickly and the amount of crack closure was large. After the first stage of unloading of the confining pressure, the crack closure rate of the sandstone specimens was significantly reduced rapidly, and in the second stage of unloading of the confining pressure, the crack closure rate of the sandstone specimens showed a nonlinear decrease, and the initial crack closure rate was larger than the former and then gradually decreased. This was because the ratio of the axial loading speed to the confining pressure unloading rate became bigger after the second unloading. After the first unloading stage, as the sandstone became gradually compacted, it entered the elastic deformation stage, and the rate of crack width reduction decreased and tended to be zero. Figures 10, 11 show that when the crack propagation started from the crack stable point, the stress-strain curve was linear elastic. After this point, the microcracks began to develop continuously, and the stress-strain curve started to increase nonlinearly. This point was the yield point. After that, the unstable crack development stage began. At this time, the amount of cracking and closure of the newly generated cracks remained the same, and the crack width and wave velocity remained unchanged (Figures 10A–D, 11A–D). As the axial pressure increased, the confining pressure decreased, the stress difference gradually increased, and the cracks continued to expand and gradually accumulate. When the cracks developed towards the crack propagation point, the new crack and the original crack were connected, causing the specimen to rupture macroscopically, and the stress value corresponding to this point was the peak strength.
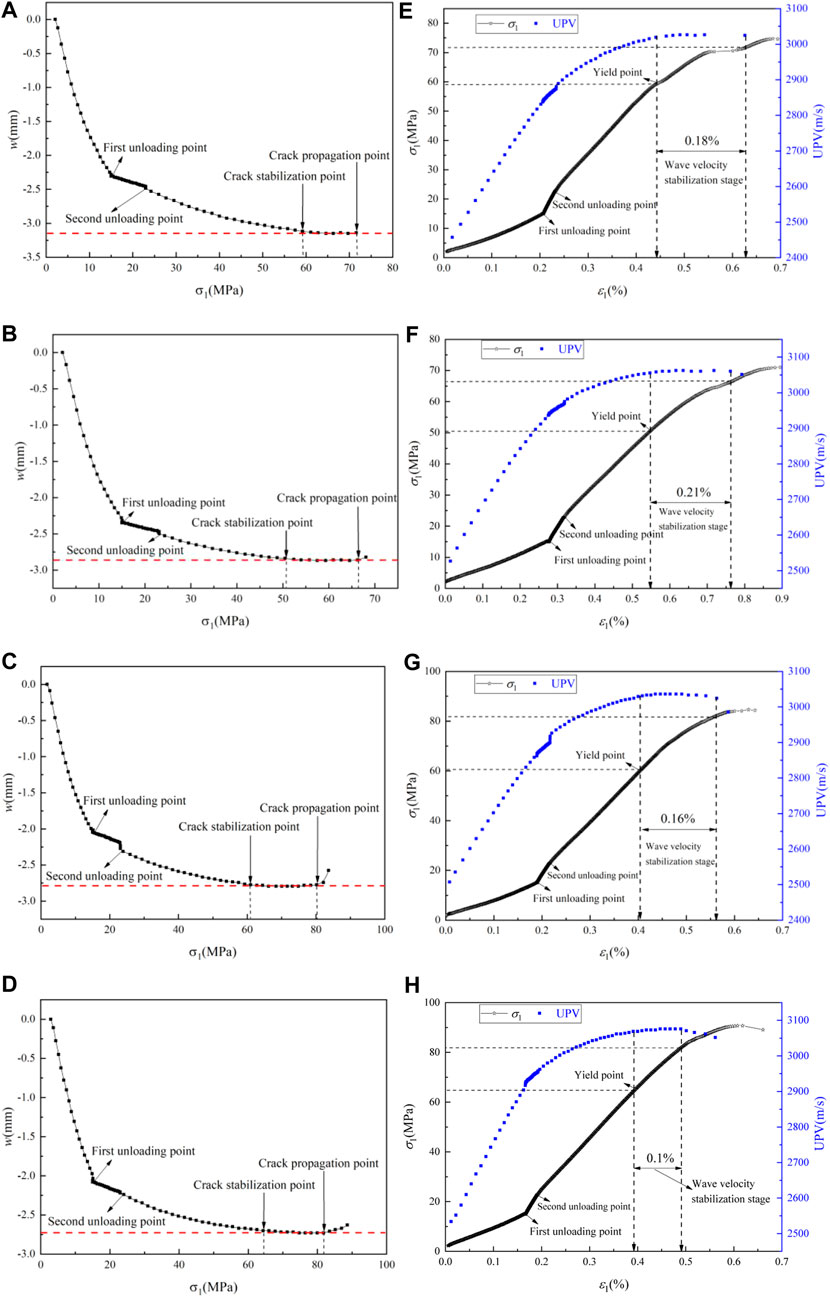
FIGURE 10. The relationship between axial stress and total crack width (A,B,C,D), and between wave velocity and axial strain (E,F,G,H) of cracked sandstone specimens with different inclination angles.
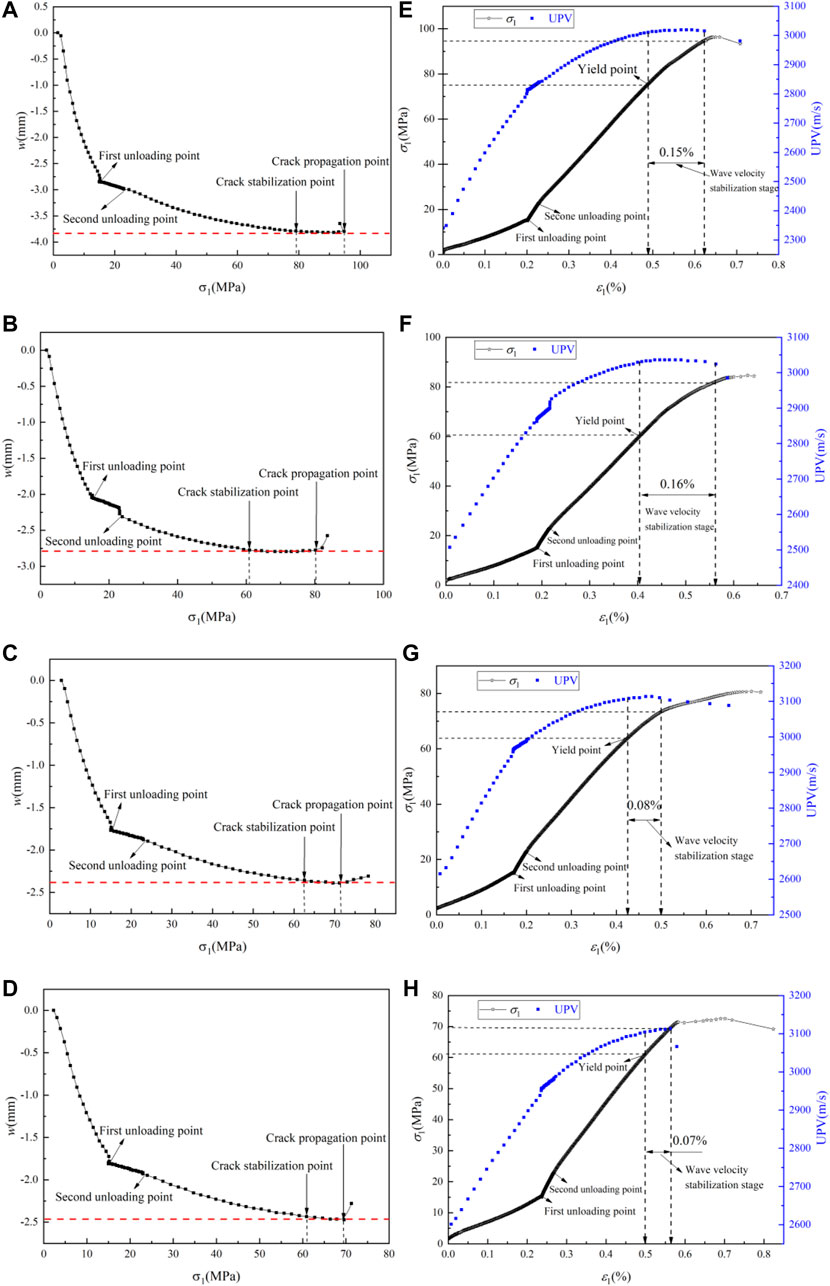
FIGURE 11. The relationship between axial stress and total crack width (A,B,C,D), and between wave velocity and axial strain (E,F,G,H) of cracked sandstone specimens with different lengths.
The length of the prefabricated cracks of the specimens in Figure 10 are all 15 mm, and the inclination angles are 0° (Figures 10A,E), 30° (Figures 10B,F), 60° (Figures 10C,G), and 90° (Figures 10D,H). It can be observed from Figure 10 that the strength of the rock mass was different under different inclination angles. As the inclination angle increased, the strength of the sandstone specimens first decreased and then increased, and the crack stabilization point and the yield point appeared at different time points, that is, the smaller the yield strength was, the later the crack stabilization point appeared. But in the earlier times, the two had a great degree of consistency. The crack propagation point strength was the peak strength of the specimen, and the corresponding axial stress strengths were 71.5, 66.5, 80.5, and 81.0 MPa, which were consistent with the actual measured values. At different inclination angles, the degree of axial strain change between the crack stabilization point and the crack propagation point was different. It first increased and then decreased, which was attributed to the brittleness of the rock. The inclination angles of the specimens in Figure 11 are all 60°, and the lengths of the prefabricated cracks are 10 mm (Figures 11A,E), 15 mm (Figures 11B,F), 20 mm (Figures 11C,G), and 25 mm (Figures 11D,H). The figure shows that with the increase of the length of the prefabricated crack, the peak strength of the specimen gradually decreased (95 MPa, then 80.5 MPa, then 72 MPa, and finally 69.5 MPa), which was in line with the reality. Besides, the proportion of the wave velocity stabilization stage (Figures 10, 11) reflected the brittle strength of the specimen. The larger the proportion was, the longer the duration of failure from yield to the peak was, indicating that the specimen was weaker and conformed to the law of rock brittleness (Chen et al., 2018). Based on this, we concluded that the law of strength change of the rock mass specimen can be predicted and analyzed according to the change of P wave velocity.
Conclusion
In this study, we experimentally investigated the strength, deformation, failure behaviors, and ultrasonic properties of sandstone under triaxial loading-unloading conditions. Based on the experimental observations, the following conclusions were drawn:
1) The sandstone elastic and deformation moduli reduced under the loading and unloading stress paths, which was not related to single-crack geometry and we had:
2) Under the loading and unloading stress paths, Poisson’s ratio was closely related to the lateral pressure coefficient and volumetric strain. The Poisson’s ratio underwent slow increases, then slow decreases, and finally, rapid increases with lateral pressure coefficient decreases. Shorter durations of the volume deformation stage were associated with a smaller decrease of Poisson’s ratio, and shorter durations of the constant volume stage were associated with smooth stress-strain curves at the onset of the expansion in the second unloading stage.
3) All samples suffered shear failure, and the failure mode of the samples became more complex with the increase of crack length. However, the failure mode of the sample does not change significantly with the increase of the crack angle.
4) The ultrasound P wave velocity was closely related to the crack development degree. When the wave velocity keeps stable, the crack development was in a dynamic equilibrium state. At this time, the velocity change rate was zero, and the specimen reached the stress yield limit, indicating that the specimen was compacted. Then the specimen experienced the wave velocity stabilization stage. The longer the duration of this stage was, the weaker the brittleness of the specimen was.
Data Availability Statement
The raw data supporting the conclusion of this article will be made available by the authors, without undue reservation.
Author Contributions
HH: Experiment, data curation, formal analysis, methodology, writing—original draft. BX: Funding acquisition, supervision, methodology, writing—review and editing. YL: Methodology, data curation. YG: Experiment, data curation.
Funding
This work was jointly supported by the National Natural Science Foundation of China (grant number 51974042), the National Natural Science Foundation of China (grant number U19B2009), the Major Special Projects of Science and Technology in Shanxi Province (grant number 20191101015).
Conflict of Interest
The authors declare that the research was conducted in the absence of any commercial or financial relationships that could be construed as a potential conflict of interest.
Publisher’s Note
All claims expressed in this article are solely those of the authors and do not necessarily represent those of their affiliated organizations, or those of the publisher, the editors and the reviewers. Any product that may be evaluated in this article, or claim that may be made by its manufacturer, is not guaranteed or endorsed by the publisher.
References
Bai, Q., Tibbo, M., Nasseri, M. H. B., and Young, R. P. (2019). True Triaxial Experimental Investigation of Rock Response Around the Mine-By Tunnel under an In Situ 3D Stress Path. Rock Mech. Rock Eng. 52, 3971–3986. doi:10.1007/s00603-019-01824-6
Behera, B., Yadav, A., Singh, G. S. P., and Sharma, S. K. (2020). A Numerical Modeling Approach for Evaluation of Spalling Associated Face Instability in Longwall Workings under Massive Sandstone Roof. Eng. Fail. Anal. 117, 104927. doi:10.1016/j.engfailanal.2020.104927
Chanyshev, A. I., and Abdulin, I. M. (2014). Stress-strain State of Enclosing Rock Mass Around an Arbitrary Cross-Section Excavation by Measurement of Displacements of the Excavation Walls. J. Min. Sci. 50 (1), 18–24. doi:10.1134/s1062739114010037
Chen, G. Q., Zhao, C., Wei, T., and Wang, J. C. (2018). Evaluation Method of Brittle Characteristics of Rock Based on Full Stress-Strain Curve and Crack Initiation Stress. Chin. J. Rock Mech. Eng. 37 (1), 51–59. (in Chinese).
Cheng, G., Li, L., Zhu, W., Yang, T., Tang, C., Zheng, Y., et al. (2019). Microseismic Investigation of Mining-Induced Brittle Fault Activation in a Chinese Coal Mine. Int. J. Rock Mech. Min. Sci. 123, 104096. doi:10.1016/j.ijrmms.2019.104096
Cong, Y., Wang, Z., Zheng, Y., and Zhang, L. (2020). Effect of Unloading Stress Levels on Macro- and Microfracture Mechanisms in Brittle Rocks. Int. J. Geomech. 20 (6), 04020066. doi:10.1061/(asce)gm.1943-5622.0001647
Gao, C. Y., Xu, J., He, P., and Liu, J.-F. (2005). Study on Mechanical Properties of Marble under Loading and Unloading Conditions. Chin. J. Geotechnical Eng. 24 (3), 456–460.
Gao, R., Yu, B., and Meng, X. (2019). Stress Distribution and Surrounding Rock Control of Mining Near to the Overlying Coal Pillar in the Working Face. Int. J. Min. Sci. Technol. 29, 881–887. doi:10.1016/j.ijmst.2018.07.003
Ghamgosar, M., and Erarslan, N. (2016). Experimental and Numerical Studies on Development of Fracture Process Zone (FPZ) in Rocks under Cyclic and Static Loadings. Rock Mech. Rock Eng. 49 (3), 893–908. doi:10.1007/s00603-015-0793-z
Guo, H., Yu, W., Liu, Y., Li, K., Kang, X., Wang, C., et al. (2021). Mechanism of Overlying Crack-Stress Evolution when Mining on the Dual Fault Zone. Geotech. Geol. Eng. 39, 3729–3740. doi:10.1007/s10706-021-01720-3
Hoxha, D., Lespinasse, M., Sausse, J., and Homand, F. (2005). A Microstructural Study of Natural and Experimentally Induced Cracks in a Granodiorite. Tectonophysics 395 (1-2), 99–112. doi:10.1016/j.tecto.2004.09.004
Hu, H., Xia, B., Luo, Y., and Peng, J. (2022). Energy Characteristics of Sandstones with Different Crack Angles under True Triaxial Cyclic Loading and Unloading. Energy Sci. Eng. 10, 1418–1430. doi:10.1002/ese3.1110
Huang, Y.-H., Yang, S.-Q., Tian, W.-L., Zeng, W., and Yu, L.-Y. (2016a). An Experimental Study on Fracture Mechanical Behavior of Rock-like Materials Containing Two Unparallel Fissures under Uniaxial Compression. Acta Mech. Sin. 32 (3), 442–455. doi:10.1007/s10409-015-0489-3
Huang, Y.-H., Yang, S.-Q., and Zeng, W. (2016b). Experimental and Numerical Study on Loading Rate Effects of Rock-like Material Specimens Containing Two Unparallel Fissures. J. Cent. South Univ. 23, 1474–1485. doi:10.1007/s11771-016-3200-3
Kolymbas, D., Lavrikov, S. V., and Revuzhenko, A. F. (2012). Deformation of Anisotropic Rock Mass in the Vicinity of a Long Tunnel. J. Min. Sci. 48 (6), 962–974. doi:10.1134/s1062739148060032
Li, C., Zhang, X., Wei, C., and Nie, Y. (2020). Study on Plastic Zone Distribution Characteristic of Coal and Rock Mass in Excavation from Crosscut Coal. Geofluids 2020, 1–14. doi:10.1155/2020/6610399
Li, N., Sun, W., Huang, fnm., Chen, D., Zhang, S., and Yan, M. (2021). Acoustic Emission Source Location Monitoring of Laboratory-Scale Hydraulic Fracturing of Coal under True Triaxial Stress. Nat. Resour. Res. 30, 2297–2315. doi:10.1007/s11053-021-09821-9
Liang, Z., Song, W., and Liu, W. (2020). Theoretical Models for Simulating the Failure Range and Stability of Inclined Floor Strata Induced by Mining and Hydraulic Pressure. Int. J. Rock Mech. Min. Sci. 132, 104382. doi:10.1016/j.ijrmms.2020.104382
Liu, Y., Dai, F., Dong, L., Xu, N., and Feng, P. (2018). Experimental Investigation on the Fatigue Mechanical Properties of Intermittently Jointed Rock Models under Cyclic Uniaxial Compression with Different Loading Parameters. Rock Mech. Rock Eng. 51, 47–68. doi:10.1007/s00603-017-1327-7
Liu, Y., Dai, F., Fan, P., Xu, N., and Dong, L. (2017). Experimental Investigation of the Influence of Joint Geometric Configurations on the Mechanical Properties of Intermittent Jointed Rock Models under Cyclic Uniaxial Compression. Rock Mech. Rock Eng. 50 (6), 1453–1471. doi:10.1007/s00603-017-1190-6
Lu, J., Yin, G., Zhang, D., Gao, H., Li, C., and Li, M. (2020). True Triaxial Strength and Failure Characteristics of Cubic Coal and Sandstone under Different Loading Paths. Int. J. Rock Mech. Min. Sci. 135, 104439. doi:10.1016/j.ijrmms.2020.104439
Meng, X.-R., Peng, R., Zhao, G.-M., and Li, Y.-M. (2017). Roadway Engineering Mechanical Properties and Roadway Structural Instability Mechanisms in Deep Wells. KSCE J. Civ. Eng. 22 (5), 1954–1966. doi:10.1007/s12205-017-1298-y
Niu, W. J., Feng, X. T., Xiao, Y. X., Feng, G.-L., Yao, Z.-B., and Hu, L. (2020). Identification of Potential High-Stress Hazards in Deep-Buried Hard Rock Tunnel Based on Microseismic Information: a Case Study. Bull. Eng. Geol. Environ. 80 (7), 1265–1285. doi:10.1007/s10064-020-01973-x
Peng, R., Ju, Y., Wang, J. G., Xie, H., Gao, F., and Mao, L. (2015). Energy Dissipation and Release during Coal Failure under Conventional Triaxial Compression. Rock Mech. Rock Eng. 48, 509–526. doi:10.1007/s00603-014-0602-0
Shi, H. Y., Ma, Z. K., Zhu, Q. J., Shi, J. J., and Zhao, Z. Q. (2020). Comparison of Shape Characteristics of Plastic Zone Around Circular Tunnel under Different Strength Criteria. J. Mech. 36 (6), 1–8. doi:10.1017/jmech.2020.45
Tao, M., Li, X., and Li, D. (2013). Rock Failure Induced by Dynamic Unloading under 3D Stress State. Theor. Appl. Fract. Mech. 65, 47–54. doi:10.1016/j.tafmec.2013.05.007
Wang, Y., and Li, X. (2015). Experimental Study on Cracking Damage Characteristics of a Soil and Rock Mixture by UPV Testing. Bull. Eng. Geol. Environ. 74 (3), 775–788. doi:10.1007/s10064-014-0673-x
Xie, G. X., Chang, J. C., and Yang, K. (2009). Investigations into Stress Shell Characteristics of Surrounding Rock in Fully Mechanized Top-Coal Caving Face. Int. J. Rock Mech. Min. Sci. 46 (1), 172–181. doi:10.1016/j.ijrmms.2008.09.006
Xie, H. P., Zhou, H. W., Liu, J. F., Gao, F., Zhang, R., Xue, D. J., et al. (2011). Mining-induced Mechanical Behavior in Coal Seams under Different Mining Layouts. J. China Coal Soc. 36 (7), 1067–1074. (in Chinese).
Xue, Y., Ma, X., Qiu, D., Yang, W., Li, X., Kong, F., et al. (2021). Analysis of the Factors Influencing the Nonuniform Deformation and a Deformation Prediction Model of Soft Rock Tunnels by Data Mining. Tunn. Undergr. Space Technol. 109, 103769. doi:10.1016/j.tust.2020.103769
Yan, Z., Dai, F., Liu, Y., Du, H., and Luo, J. (2020). Dynamic Strength and Cracking Behaviors of Single-Flawed Rock Subjected to Coupled Static-Dynamic Compression. Rock Mech. Rock Eng. 53, 4289–4298. doi:10.1007/s00603-020-02165-5
Yang, S.-Q., Chen, M., Fang, G., Wang, Y.-C., Meng, B., Li, Y.-H., et al. (2018). Physical Experiment and Numerical Modelling of Tunnel Excavation in Slanted Upper-Soft and Lower-Hard Strata. Tunn. Undergr. Space Technol. 82, 248–264. doi:10.1016/j.tust.2018.08.049
Yang, S. Q., and Hu, B. (2020). Creep and Permeability Evolution Behavior of Red Sandstone Containing a Single Fissure under a Confining Pressure of 30 MPa. Sci. Rep. 10 (1), 1900. doi:10.1038/s41598-020-58595-2
Yang, Y., and Zhang, Z. (2020). Dynamic Fracturing Process of Fissured Rock under Abrupt Unloading Condition: A Numerical Study. Eng. Fract. Mech. 231, 107025. doi:10.1016/j.engfracmech.2020.107025
Yin, T., and Chen, Q. (2020). Simulation-based Investigation on the Accuracy of Discrete Fracture Network (Dfn) Representation. Comput. Geotechnics 121, 103487. doi:10.1016/j.compgeo.2020.103487
Zhang, L., Huang, G., Luo, J. Y., and Xin, Z. (2018). A Surrounding Rock Stress Distribution Model for Deep Mining. Indian J. Geo-Marine Sci. 47 (12), 2407–2414.
Zhang, X., Wen, Z., Liu, J., Luo, L., and Sun, B. (2019). Research on Distribution and Evolution Laws of Surrounding Rock Stress during the Island Panel Mining in Multiple Complex Stope. Geotech. Geol. Eng. 37 (4), 3355–3366. doi:10.1007/s10706-019-00850-z
Zhao, J., Zhang, X., Jiang, N., Yin, L., and Guo, W. (2020). Porosity Zoning Characteristics of Fault Floor under Fluid-Solid Coupling. Bull. Eng. Geol. Environ. 79 (3), 2529–2541. doi:10.1007/s10064-019-01701-0
Zhao, Y., Bi, J., Wang, C., and Liu, P. (2021). Effect of Unloading Rate on the Mechanical Behavior and Fracture Characteristics of Sandstones under Complex Triaxial Stress Conditions. Rock Mech. Rock Eng. 54, 4851–4866. doi:10.1007/s00603-021-02515-x
Zhao, Y., Lin, B., Liu, T., Zheng, Y., Kong, J., Li, Q., et al. (2020). Mechanism of Multifield Coupling-Induced Outburst in Mining-Disturbed Coal Seam. Fuel 272, 117716. doi:10.1016/j.fuel.2020.117716
Zhao, Z., Tan, Y., Chen, S., Ma, Q., and Gao, X. (2019). Theoretical Analyses of Stress Field in Surrounding Rocks of Weakly Consolidated Tunnel in a High-Humidity Deep Environment. Int. J. Rock Mech. Min. Sci. 122, 104064. doi:10.1016/j.ijrmms.2019.104064
Zhou, X. P., and Bi, J. (2015). Numerical Simulation of Zonal Disintegration of the Surrounding Rock Masses Around a Deep Circular Tunnel under Dynamic Unloading. Int. J. Comput. Methods 12 (3), 1550020.
Zhou, X. P., and Bi, J. (2012). Zonal Disintegration Mechanism of Cross-Anisotropic Rock Mass Around a Deep Circular Tunnel under Dynamic Unloading. Theor. Appl. Fract. Mech. 60 (1), 15–22. doi:10.1016/j.tafmec.2012.06.003
Zhu, Z., Ranjith, P. G., Tian, H., Jiang, G., Dou, B., and Mei, G. (2021). Relationships between P-Wave Velocity and Mechanical Properties of Granite after Exposure to Different Cyclic Heating and Water Cooling Treatments. Renew. Energy 168, 375–392. doi:10.1016/j.renene.2020.12.048
Keywords: cracked sandstone, mining-induced stress path, deformation characteristics, failure characteristics, ultrasonic velocity
Citation: Hu H, Xia B, Luo Y and Gao Y (2022) Effect of Crack Angle and Length on Mechanical and Ultrasonic Properties for the Single Cracked Sandstone Under Triaxial Stress Loading-Unloading. Front. Earth Sci. 10:900238. doi: 10.3389/feart.2022.900238
Received: 20 March 2022; Accepted: 21 April 2022;
Published: 05 May 2022.
Edited by:
Sheng-Qi Yang, China University of Mining and Technology, ChinaReviewed by:
Junxin Guo, Southern University of Science and Technology, ChinaFengqiang Gong, Southeast University, China
Copyright © 2022 Hu, Xia, Luo and Gao. This is an open-access article distributed under the terms of the Creative Commons Attribution License (CC BY). The use, distribution or reproduction in other forums is permitted, provided the original author(s) and the copyright owner(s) are credited and that the original publication in this journal is cited, in accordance with accepted academic practice. No use, distribution or reproduction is permitted which does not comply with these terms.
*Correspondence: Huarui Hu, aGhydWkxMDA0QGNxdS5lZHUuY24=; Binwei Xia, eGJ3ZWkzM0BjcXUuZWR1LmNu