 Max Cardoso Langer1*†
 Pedro L. Godoy1,2,3†
- 1Department of Biology, Universidade de São Paulo, Ribeirão Preto, Brazil
- 2Department of Anatomical Sciences, Stony Brook University, New York, NY, United States
- 3Department of Zoology, Universidade Federal do Paraná, Curitiba, Brazil
The early Mesozoic is marked by several global-scale environmental events, including the emplacement of large igneous provinces, such as the Siberian Traps, Wrangellia, and Central Atlantic Magmatic Province (CAMP). These have been hypothesised as drivers of the successful diversification of Pan-Aves, the lineage of archosaurs closer to birds than to crocodiles. We characterize here the diversification and body size evolution of terrestrial pan-avians (excluding pterosaurs) along the Triassic and Early Jurassic, using phylogenetic- and occurrence-based approaches, in an attempt to test the influence of such drivers. As diversity metrics, we quantified raw species richness and phylogenetic diversity (using time-calibrated phylogenetic trees), and net diversification rates were estimated with PyRate and the episodic fossilized-birth-death model. We have also characterised through-time patterns of body size (femoral length) and estimated body size evolutionary rates. Our results indicate that macroevolutionary shifts estimated from occurrence data are placed more recently in time than those from phylogenetic-based approaches, as shown by the higher diversity increase, diversification rates, and body size disparity of terrestrial Pan-Aves in the Carnian. This is consistent with hypotheses suggesting that the Carnian Pluvial Episode (CPE) was crucial for the early radiation of the group. Yet, phylogeny-based results show higher diversity/diversification rates for the Ladinian and Norian, suggesting a minor effect for the Carnian Pluvial Episode (CPE). We also found no meaningful shifts in diversity, diversification, or size-related metrics across the Triassic-Jurassic boundary. Even if the end-Triassic mass extinction possibly emptied ecospace, allowing dinosaur diversity to increase during the Jurassic, our results suggest that this expansion did not occur fast and homogeneously for the entire group. In fact, a sustained reduction in diversity and sub-zero net diversification rates are seen after the extinction, but macroevolutionary patterns here should be interpreted with care towards the end of the Early Jurassic, as they may be biased by an “edge effect.” Overall, few macroevolutionary shifts were consistently identified across all results, suggesting that the early diversification of terrestrial pan-avians was more nuanced and complex than anticipated.
Introduction
With about ten thousand catalogued species, crown-clade Aves corresponds to the most diverse group of living tetrapods (Clarke et al., 2020), with its origin buried deep into the Cretaceous Period (Lee et al., 2014). In fact, such diversity has been mostly shaped by the mass extinction at the end of that time interval (Field et al., 2018), after which most modern avian groups radiated (Kuhl et al., 2021). Yet, the evolutionary history of the entire avian lineage (Pan-Aves) is far more ancient, also encompassing most of the Mesozoic Era. During that time, it produced one of the most notable, long-scale radiations known in the history of life, the dinosaurs. Previous studies based on body fossils have made a compelling case that the bird-crocodile divergence occurred early in the Triassic (Ezcurra and Butler, 2018), matching the lowest range—249 million years ago (Ma)—of molecular-clock estimates (Chiari et al., 2012) and the footprint record of ornithodirans (a clade including the bulk of Pan-Aves) in Olenekian (ca. 251-247 Ma) rocks of Poland (Brusatte et al., 2011).
In fact, the early pan-avian radiation is considered to have occurred after the easing of the harsh environmental conditions associated to the Permo-Triassic mass extinction (Sun et al., 2012; Ezcurra and Butler, 2018), henceforth influenced by the emplacement of the Siberian Traps LIP (Large Igneous Province) at ca. 252 Ma (Burgess et al., 2017). Yet, the age of the oldest pan-avian body-fossils is controversial, due to the uncertainty in cross-continental correlation of tetrapod faunas based on which their bearing deposits are pinned in the Triassic timescale (Irmis, 2011; Marsicano et al., 2016). These include aphanosaurs from Russia and India (Benton et al., 2017; Liu et al., 2018; Ezcurra et al., 2021) and possibly younger ornithodirans from southern Africa (Nesbitt et al., 2010; Nesbitt et al., 2013; Peecook et al., 2013). However, there is consensus that those likely Middle Triassic pan-avians are older than all other recognised members of the lineage (Novas et al., 2021).
Although pan-avians were part of the biotic recovery from the Permo-Trassic extinction, their Early-Middle Triassic fossil record is meagre. This pattern drastically changes in the Carnian (ca. 237-227 Ma), when sedimentary deposits with a significant content of dinosaurs (e.g., Ischigualasto and Santa Maria formations) or non-dinosaur Pan-Aves (Chañares Formation) have been recorded especially across south Pangaea (Langer et al., 2018). The Late Triassic rise of dinosaurs was variously related to environmental shifts that took place during that period (Langer et al., 2010; Brusatte et al., 2011), nicknamed their “lucky break” by Benton (1984). More recently, data accumulated suggesting a pivotal role for the Carnian Pluvial Episode (CPE) in such environmental changes (Dal Corso et al., 2020), leading to the radiation of several groups, including the dinosaurs (Bernardi et al., 2018; Benton et al., 2018; Irmis 2011).
Starting at ca. 234 Ma and lasting for a maximum of two million years (Dal Corso et al., 2020; Mancuso et al., 2020), CPE was synchronous to, or slightly preceded, the oldest tetrapod faunas with uncontroversial dinosaur body-fossils in South America (Langer et al., 2018; Desojo et al., 2020), as well as the oldest dinosauromorph-dominated ichnofaunas of the Southern Alps (Bernardi et al., 2018) and other parts of the world (Mancuso et al., 2020). Hence, it has been considered as a potential trigger of such early rise/dominance (Benton et al., 2018), perhaps linked to the emplacement the Wrangellia LIP volcanism (Dal Corso et al., 2020). It is important to note, however, that it is not until somewhat later in the Triassic that dinosaurs actually became not only more diverse, but also dominant and widespread in terrestrial ecosystems (Brusatte et al., 2008; Irmis, 2011; Benton et al., 2018; Mancuso et al., 2020), with “prosauropods” representing a major component of several Norian tetrapod faunas in Europe, Greenland, South America, and South Africa. According to Kent and Clemmensen (2021), this might have been influenced by a dip in atmospheric pCO2 at ca. 215–212 Ma of uncertain origins, but close in time to the Manicouagan impact.
The end-Triassic mass extinction was one of the largest in Earth history and has been usually correlated to the emplacement of the Central Atlantic Magmatic Province (CAMP) at ca. 201 Mya (Whiteside et al., 2010; Blackburn et al., 2013; Davies et al., 2017). It has long been suggested (Colbert, 1958) that the emptying of ecospace caused by that extinction, especially of crocodile-line archosaurs, provided the opportunity for the first major radiation across all dinosaur groups (Olsen et al., 2002; Brusatte et al., 2008). In fact, a general increase in dinosaur diversity was recorded/estimated for the entire Late Triassic-Early Jurassic interval (Wang and Dodson, 2006; Brusatte et al., 2008; Sakamoto et al., 2016; Tennant et al., 2018). Yet, partially because of sampling biases (Barrett et al., 2009; Butler et al., 2011; Upchurch et al., 2011), the behaviour of diversity curves across the Triassic-Jurassic boundary is more dubious. Most authors identified a diversity rise, so that dinosaurs emerged from the extinction more diverse than they were before (Barrett et al., 2009; Butler et al., 2011; Irmis, 2011; Upchurch et al., 2011; Starrfelt and Liow, 2016). Instead, some studies found that, along with other groups, dinosaurs suffered the consequences of the mass extinction, reducing their raw diversity and diversification rates between the latest Triassic and the earliest Jurassic (Lloyd et al., 2008; Tennant et al., 2018).
In this study, we assess the impact of the Siberian Traps, Wrangellia, and CAMP volcanisms on the early evolution of terrestrial Pan-Aves. For that, we compiled a new set of phylogenetic and occurrence data of Triassic and Early Jurassic members of that group, which was used to estimate taxic (i.e., richness) and phylogenetic diversity, as well as diversification rates, through time. We also collected body size data to characterise patterns of body size change and calculate morphological evolution rates over the same time span. These analyses aimed to identify shifts in macroevolutionary patterns that may match the timing and intensity of the tree LIPs mentioned above. In doing so, we were able to more comprehensively characterise various aspects of early pan-avian evolution, especially those related to the rise of dinosaurs during the Late Triassic.
Materials and Methods
Supertree Construction and Time-Calibration
Some of the analyses employed here require phylogenetic information. Therefore, using Mesquite 3.61 (Maddison and Maddison, 2019), we manually assembled an informal supertree of Triassic to Early Jurassic (Tr-EJ) terrestrial Pan-Aves. Although our focus was on Late Triassic patterns, we also included Early Jurassic taxa in order to minimise a possible “edge effect” (i.e., spurious results at the edges of our interval of interest derived from poor sampling or methodological limitations). The pterosaurs were not included in the supertree, as we understand that they occupy an entirely distinct morphofunctional space (i.e., flying animals) from that of other early pan-avians, which would add confounding factors to our study. The supertree included as many nominal species of Tr-EJ terrestrial pan-avians as possible, using the literature and the Paleobiology Database (PBDB) as sources of information. We did not add proposed junior synonyms of already included species, as well as taxa with very dubious phylogenetic/taxonomic affinities, as the putative Middle Triassic dinosaur Nyasasaurus parringtoni and the putative Early Jurassic segnosaur Eshanosaurus deguchiianus. Even though we acknowledge that some of these taxa could have an influence on our results, we explicitly decided that their inclusion would be potentially more problematic, as we would have to add them to arbitrary positions in the tree.
The supertree also includes eight Tr-EJ specimens with phylogenetic positions within Pan-Aves drawn from the literature, but with no species-level assignation. Finally, given that the supertree would be further used as input data to estimate diversification rates, we attempted to account for possible cladogenetic events that occurred during the Tr-EJ, but were not represented in our supertree. For that, we created a version of the supertree added of terminals representing sister “ghost lineages” of branches with Tr-EJ species. The versions of the supertree with and without “ghost lineages” respectively include 187 and 164 terminals.
To account for the most notable diverging views of early pan-avian phylogeny, we built four alternative versions of the supertree (ST 1–4). Following several sources (e.g., Ezcurra, 2006; Irmis et al., 2007; Müler et al., 2018; Pacheco et al., 2019; Novas et al., 2021), ST 1 has silesaurids external to Dinosauria, theropods forming Saurischia with sauropodomorphs (rather than Ornithoscelida, with ornithischians), and herrerasaurs external to Eusaurischia (Figure 1A). The other versions of the supertree (Supplementary Figures S1–S3) differ from ST 1 in specific points: ST 2 has Theropoda and Ornithischia forming Ornithoscelida (Baron et al., 2017), ST 3 has silesaurids within Ornithischia (Langer and Ferigolo, 2013; Müller and Garcia, 2020), and ST 4 has sauropodomorphs at the earliest saurischian dichotomy, so that many Triassic taxa, including herrerasaurs, are placed along the theropod line (Sereno, 1990; Nesbitt et al., 2009). Although other phylogenetic arrangements for early dinosaurs were proposed in the literature, it was not feasible to accommodate them all here in further supertree versions. Except for the differences mentioned above, ST1–4 have all the same topological configuration, which was drawn from a vast array of sources (Supplementary Table S1). Accordingly, also taking into account the topologies with and without “ghost lineages,” eight different versions of the supertree were used in our study. Because pterosaurs were not included in our analyses, the recent proposal that lagerpetids form its sister-group (Ezcurra et al., 2021) does not alter the pan-avian topologies evaluated here.
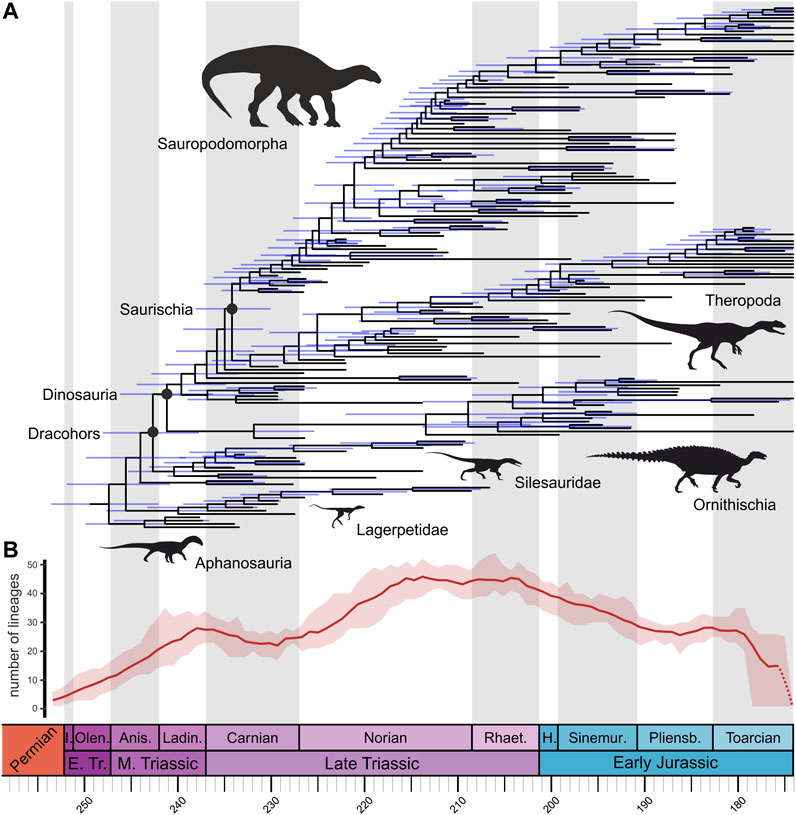
FIGURE 1. (A) Time-calibrated phylogeny (majority rule consensus tree) of Triassic to Early Jurassic pan-avians (excluding pterosaurs), obtained from Bayesian analysis using the fossilized birth–death model. Phylogenetic relationships as in our supertree ST 1 (silesaurids external to Dinosauria, theropods forming Saurischia with sauropodomorphs, and herrerasaurs external to Eusaurischia). Blue bars indicate 95% highest posterior density age ranges of nodes. (B) Through-time phylogenetic diversity (lineage-through-time) of terrestrial Pan-Aves. Dark red solid line represents mean values for the ten trees from topology ST 1 with “ghost lineages,” whereas light red shade represents maximum and minimum values for those same ten trees. Dashed red line represents the uncertainty of patterns through the Toarcian, from a possible “edge effect.” Timescale abbreviations: Anis. = Anisian; H. Hettangian; I. = Induan; Ladin. = Ladinian; Olen. = Olenekian; Pliens. = Pliensbachian; Rhaet. = Rhaetian; Sinemur. = Sinemurian.
The eight supertree versions were then time-calibrated using Bayesian inference under a fossilized birth-death (FBD) process (Stadler, 2010; Ronquist et al., 2012a; Heath et al., 2014). We used R (version 4.1; R Core Team, 2021) package paleotree (Bapst, 2012) to create a MrBayes command, with an “empty” morphological matrix, to perform Bayesian Markov chain Monte Carlo (MCMC) tip-dating analyses in MrBayes version 3.2.6 (Ronquist et al., 2012b). The supertree versions were used as topological constraints, with the addition of three non-pan-avian archosauromorphs (Ctenosauriscus koeneni, Jaxtasuchus salomoni, Euparkeria capensis) as successive outgroups to Pan-Aves, which were then removed before subsequent macroevolutionary analyses. A uniform prior was used for the root of all versions of the supertree, constrained between 264.28 and 247.2 Ma (Turner et al., 2017; Ezcurra and Butler, 2018). Uniform priors were also used for the tip ages, which were set based on occurrence date information. These were taken from the most recent literature, using radioisotopic ages when available and looser age intervals for taxa from stratigraphic units lacking absolute ages (Supplementary Table S2). A fixed age of 174.1 Ma was assigned to all “ghost lineages” treated as terminals.
For each of the eight supertree versions, we performed two MCMC runs of 20,000,000 generations, with four chains each and a burn-in factor of 30%. Convergence was assessed using potential scale reduction factors (values approaching 1.0) and average standard deviation of split frequencies (values below 0.01). For each version of the supertree, we saved ten trees randomly sampled from the posterior distribution for subsequent analyses, as well as the maximum clade credibility (MCC) tree.
Diversification Rates From Time-Calibrated Phylogenetic Trees
For estimating through-time net diversification rates, we implemented a piecewise-constant (episodic) fossilized-birth-death (EFBD) model (Magee and Höhna, 2021) in a Bayesian framework. The model EFBD is an extension of previous fossilized-birth-death models (Stadler, 2010; Gavryushkina et al., 2014; Heath et al., 2014), which uses Horseshoe Markov random field (HSMRF) prior distributions (Magee et al., 2020) to keep rates of speciation (λ), extinction (µ) and fossilization (ϕ) constant within time intervals, but allowing them vary across intervals. This model enables to estimate variation in net diversification rates (λ-μ) using phylogenies (with extant and/or extinct taxa) as input data (Magee and Höhna, 2021). For our EFBD analyses, we used ten randomly-sampled trees for each of the eight different time-calibrated topologies (four with and four without “ghost lineages”).
We used a Half-Cauchy distribution as prior for the global scale parameters of λ, μ, and ϕ. The global scale hyperpriors of the rates variation are dependent on the number of time bins used in the analyses. A time-interval scheme of approximately equal-length (ca. five million years) time bins was defined by subdividing longer Tr-EJ stages (i.e., Carnian, Norian, Sinemurian, Pliensbachian, and Toarcian), so that stages and time bins have matching boundaries. This resulted in sixteen time bins for the topologies with “ghost lineages” and fifteen for those without “ghost lineages” (given that the second group of trees had consistently younger root ages). For calculating hyperpriors, we used R function setMRFGlobalScaleHyperpriorNShifts() from package RevGadgets (Tribble et al., 2021).
Given that in the EFBD model the rate-changes are modelled backwards in time, it is usually necessary to estimate λ, μ, and ϕ at present. However, as we do not have extant taxa in our trees, this estimation used the most recent point in time of our study (i.e., end of the Early Jurassic), for each tree. This was done using empirical Bayes strategy, by setting a constant-rate fossilized-birth-death model and using their posterior distribution to determine the prior on the rates at the most recent point in time. For that, we adapted the RevBayes script available at https://revbayes.github.io/tutorials/divrate/efbdp_me.html and used the R function posteriorSamplesToParametricPrior() from RevGadgets to obtain the Gamma priors of each rate for all the 80 trees.
Another important aspect of the EFBD analyses is the sampling parameter (Φ0 or ρ; Magee et al., 2020), which is the probability of sampling extant species at the present. Again, as we do not have living species in our trees, we used the most recent point in time. Estimating Φ0 is challenging, given that there is no unambiguous way to infer dinosaur diversity during the Mesozoic (Benson, 2018). Therefore, we ran two sets of EFBD analyses, one with Φ0 set to 0.08, in which we assume that the sampled species in our tree represent 8% of the total dinosaur diversity during the latest Early Jurassic, and another with Φ0 set to 0.3, which assumes that we sampled 30% of the real diversity. Although these values are arbitrary, we believe this procedure allowed us to test if changes in this parameter significantly affected the overall patterns of though-time net diversification rates.
We performed sixteen sets of EFBD analyses in RevBayes v1.1.0 (Höhna et al., 2016), with eight topologies (four with “ghost lineages” and four without) and two different values of Φ0, resulting in 160 analyses in total. Each analysis comprised two MCMC runs of 200,000 iterations (each iteration consisted of 685 moves), sampling every 200 generations. Convergence was inspected using the software Tracer (Rambaut et al., 2018), by confirming that the effective sample sizes (ESS) of all parameters were above 200. After discarding the first 10% of samples as burn-in, we used R package RevGadgets (Tribble et al., 2021) to summarize the results of all sixteen sets of analyses and visualize them using rates-through-time (RTT) plots.
Diversification Rates From Occurrence Data
We also estimated through-time net diversification rates from fossil occurrence data, by using the hierarchical Bayesian framework implemented in PyRate v3.0 (Silvestro et al., 2014a; Silvestro et al., 2014b; Silvestro et al., 2019). PyRate jointly models the preservation and diversification processes, using a birth-death model to estimate speciation and extinction rates (λ and μ, respectively) from estimated lifespans of taxa (Silvestro et al., 2015).
We downloaded Tr-EJ occurrence data for three main groups (Aphanosauria, Lagerpetidae, and Dinosauromorpha) from the Paleobiology Database (PBDB) on 24 December 2021, under the following settings: taxon = Aphanosauria/Lagerpetidae/Dinosauromorpha, taxonomic resolution = species, preservation = regular taxa only, taxon status = all, identification = latest, time rule = major. The dataset was then curated, with the inclusion of thirteen occurrences (i.e., newly named species and unnamed specimens with phylogenetic information available that were included in our supertree) and the exclusion of fifteen occurrences (mainly ichnotaxa). The final occurrence dataset included 410 occurrences from 176 species (and seven unnamed specimens, which probably represent new taxa), 65% of which are singletons.
From this occurrence dataset, we followed recent recommendations within Černý et al. (2021) and created two types of datasets: one in which the age of every occurrence was independently drawn from the corresponding range and one “site-linked” dataset. In the “site-linked” dataset, a single age is drawn from the temporal range of every site/collection and assigned to all the occurrences from the same PBDB collection number. This simultaneously accounts for age uncertainty and for the fact that the ages of all fossils from the same site are approximately equal. We further accounted for occurrence age uncertainty by replicating ten times the procedures to create site-linked and site-unlinked occurrence datasets, resulting in twenty datasets, which served as input data for the PyRate analyses.
For the PyRate analyses performed in this study, we broke down the birth-death process into time intervals, using the same time bins used for the EFBD analyses (i.e., 16 time bins of approximately five million years, delimited by stratigraphic stages). This was done to ease comparisons with the results of the EFBD analyses and was achieved by using the -fixShift option within PyRate, to estimate λ and µ within the time intervals. To avoid overparameterization, this option assumes Half-Cauchy prior distributions for λ and µ between shifts, with a hyperpriors on the scale parameters (Silvestro et al., 2015).
Instead of using a single preservation model for our PyRate analyses, we compared the results of three different models. The default model is the non-homogeneous Poisson process of preservation (NHPP), in which preservation rates (q) change during the lifespan of each lineage, following a bell-shaped distribution (Silvestro et al., 2014a). We also used a homogeneous Poisson process (HPP), in which q is constant through time (Silvestro et al., 2015), and a time-variable Poisson process (TPP), which assumes that q is constant within time intervals, but can vary across them (Silvestro et al., 2019). For the TPP models, we used the same time bins of approximately five million years. Also, to incorporate rate heterogeneity across lineages, a Gamma model of rate heterogeneity with five categories was used.
We performed six sets of PyRate analyses, with three preservation models and two types of occurrence datasets (site-linked and site-unliked), resulting in 60 analyses in total. Each analysis consisted of 1,000,000 MCMC iterations, sampling every 1,000 iterations. Convergence was inspected using the software Tracer (Rambaut et al., 2018), by confirming that the effective sample sizes (ESS) of most parameters were above 200. We excluded the first 10% of the samples as burn-in and combined the posterior estimates of each set of analyses to visualize the results using RTT plots. PyRate analyses performed here used adapted versions of the codes made available by Černý et al. (2021).
Taxic Richness and Phylogenetic Diversity
We also quantified diversity of Tr-EJ terrestrial pan-avians using two additional metrics: raw taxic richness (or taxonomic diversity) and phylogenetic diversity (also known as lineage richness or lineage-through-time plots). To quantify taxic richness, we used the same occurrence data and time bins from the PyRate analyses and subdivided pan-avian taxa using R function taxicDivDisc() from package paleotree (Bapst, 2012). Given that previous works demonstrated that the geological record affects the observed diversity (Barrett et al., 2009; Butler et al., 2011; Irmis, 2011; Upchurch et al., 2011), we also quantified the number of PBDB collections as a proxy for fossil localities, in order to better understand possible biases in the estimated taxic richness. In comparison to rock (i.e., geologic) units, the number of collections is also affected by anthropogenic variables such as sampling effort, but both metrics are strongly correlated (Černý et al., 2021). We quantified the number of PBDB collections with aphanosaur, lagerpetid, and dinosauromorph body fossils, and also compared to those of continental origins with tetrapods in general. Finally, we also estimated phylogenetic diversity from the eight alternative topologies (four with “ghost lineages” and four without), using a set of ten trees randomly sampled from our time-calibration FBD analyses for each topology and the R function ltt95() from package phytools (Revell, 2012).
Body Size Data Collection and Rates of Morphological Evolution
We collected maximum femoral length from 161 species/specimens of Tr-EJ terrestrial pan-avians as proxy for total body size (Supplementary Table S3). Femoral length was selected because it has been demonstrated that this measurement scales isometrically with body length/mass during archosaur ontogeny (Anderson et al., 1985) and has therefore been vastly used in previous studies (e.g., Irmis 2011; Sookias et al., 2012a; Sookias et al., 2012b; Turner and Nesbitt, 2013; Sengupta et al., 2017; Pradelli et al., 2022). Approximately 75% of the femoral length data were made available by Pradelli et al. (2022), whereas the remaining data were collected from the literature. For consistency, we followed the protocol of Pradelli et al. (2022), using the largest available specimen for taxa with more than one preserved femur. For taxa lacking femora (or the complete bone), simple linear lengths of preserved skeletal parts were measured and used to estimate total femoral length from the closest taxon with both elements preserved. This resulted in ca. 39% of the femoral length dataset being estimated, either by us or Pradelli et al. (2022). All subsequent analyses and plots used log-transformed femoral length in millimetres (Benson et al., 2022). For analyses that require information from phylogenetic trees, we pruned the trees (derived from the original topologies) to keep only terminals for which we did have body size/femoral data.
Using the same sixteen time bins used for diversity/diversification analyses, we generated through-time plots of minimum, maximum, and mean pan-avian body size. Body size disparity was also estimated, using the standard deviation as a metric of disparity and calculating 95% confidence intervals from bootstrapped data (500 times) with R package dispRity (Guillerme, 2018). We also constructed four additional through-time plots that incorporated ancestral femoral length, which were estimated from the MCC trees of the four topologies with “ghost lineages” and using the R function fastAnc() from package phytools (Revell, 2012).
We also estimated morphological (=body size) evolutionary rates in a Bayesian framework using BayesTraits v3.0 (Pagel and Meade, 2006; Venditti et al., 2011; Baker et al., 2016; Meade and Pagel, 2017). We detected evolutionary rate shifts by using the variable rates model, which rescales branches that show trait variance incompatible with a homogenous (=Brownian motion) model (Baker et al., 2016). For ten trees of each of the eight original topologies, we run MCMC reversible-jump analyses for 2,000,000,000 generations, sampling parameters 80,000 and discarding the first 400,000,000 as burn-in. Using stepping-stone sampling (1,000 stones and 100,000 iterations per stone), we compared the fit of two models (homogeneous and heterogeneous rates) using Bayes factor, which revealed higher support for the heterogeneous/variable rates model. Convergence of MCMC runs was assessed with R package coda (Plummer et al., 2006), by confirming that the effective sample sizes (ESS) of all parameters were above 200. We then used the Variable Rates Post Processor (Baker et al., 2016) to extract values of rate through time (i.e., log-transformed relative evolutionary rate scalar) for each tree, divided by 90 equally spaced time bins of approximately one million years. We used an adapted version of the R code made available by Stubbs et al. (2021) to generate BayesTraits scripts for our analyses.
Results and Discussion
Overall Patterns of Diversity and Diversification Rates
Similar overall patterns of phylogenetic diversity are observed across curves obtained from the four alternative topologies used in this study (Figure 1B, Supplementary Figure S4). In contrast, more differences are observed when trees that incorporate “ghost lineages” are compared to those without them (Supplementary Figure S5), with the latter usually showing slightly delayed increases in diversity. Another major difference is that trees with “ghost lineages” show an increase in phylogenetic diversity towards the end of the Early Jurassic (i.e., during the Pliensbachian) which is not recovered from trees without “ghost lineages.”
Comparisons between raw taxic richness and phylogenetic diversity of Tr-EJ terrestrial pan-avians show marked differences in the timing and magnitude of most significant peaks. Whereas raw richness peaks during the Carnian (Figure 2A), the highest phylogenetic diversity values are usually observed in the Norian. Also, the second largest peak in taxic richness is seen in the Rhaetian. This is not reproduced in most of the phylogenetic diversity plots, for which the Rhaetian shows similar or lowers values to those of the Norian. These inconsistencies might be due to differences in datasets used to obtain both diversity metrics, given that we used occurrence data for quantifying raw richness and time-calibrated trees to estimate phylogenetic diversity. Yet, this might also result from real diversity hidden by ghost lineages, which cannot be captured by raw taxic richness. This is mostly demonstrated by the lineage-through-time plots constructed with the trees with explicitly included “ghost lineages,” in which some increases in phylogenetic diversity predate rises in taxic richness, such as those in the Ladinian vs. Carnian and in the Norian vs. Rhaetian.
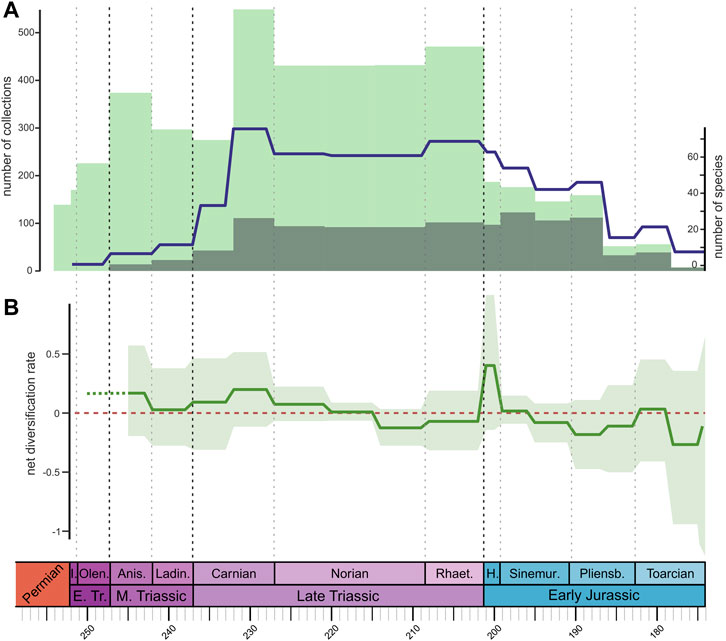
FIGURE 2. (A) Through-time taxic richness of Triassic to Early Jurassic terrestrial Pan-Aves (solid blue line). Light green bars represent the number of PBDB collections bearing terrestrial tetrapods, whereas dark green bars represent PBDB collections with Pan-Aves (excluding pterosaurs). (B) Net diversification rates estimated from occurrence data using PyRate. Solid green line represents mean values; light green shade represents maximum and minimum rate values considering all ten replicates of the dataset. Results for the time-variable Poisson process (TPP) preservation model, using the “site-unlinked” occurrence dataset. Timescale abbreviations: as in Figure 1.
In terms of diversification rates, EFBD results (Figure 3, Supplementary Figures S6–S21) show relatively similar patterns across all topologies, with or without “ghost lineages,” whereas changes in the value used for the sampling parameter (Φ0) seemed to only affect the rates for the last (i.e., most recent) time bin. PyRate results (Figure 2B, Supplementary Figures S22–S27 ) also show consistent patterns between site-linked and site-unliked analyses. In terms of preservation model, the TPP model received higher support and shows similar results to the HPP model (the second best supported), whereas the NHPP model yielded slightly lower rates in comparison to the other models (a pattern also observed by Černý et al., 2021). PyRate and EFBD results do share some similarities, such as below-zero net diversification rates during most of the Early Jurassic, but also exhibit significant differences. For example, EFBD results show much higher rates in the Middle Triassic than the PyRate results, whereas the latter display a peak in the Hettangian not seen in our EFBD results. These inconsistencies are likely due to the inherently different nature of the employed types of data (occurrence data vs. phylogenetic trees) and, consequently, of the two methods.
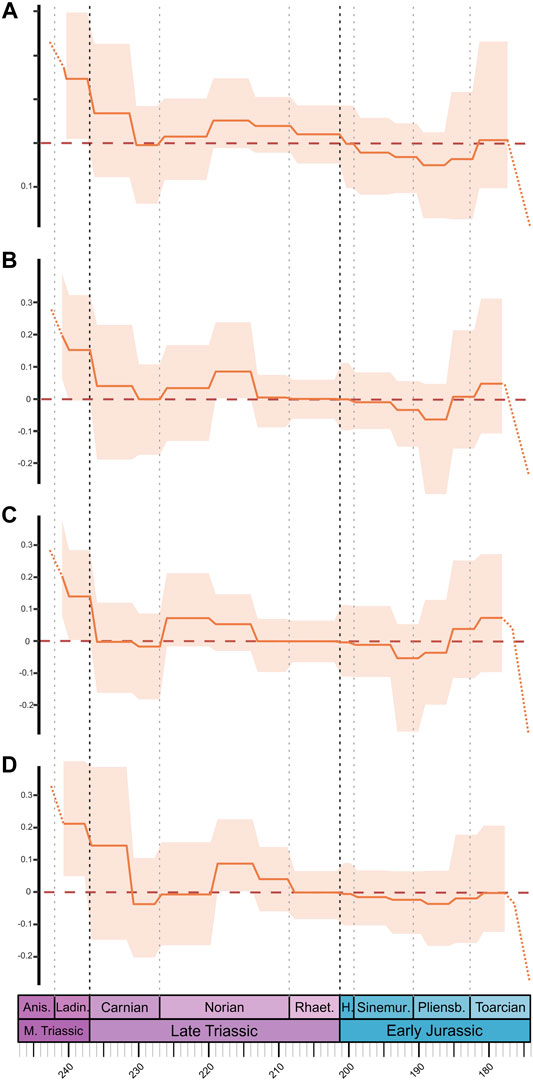
FIGURE 3. Net diversification rates of Triassic to Early Jurassic terrestrial Pan-Aves, estimated from phylogenetic trees using the episodic fossilized-birth-death (EFBD) model from RevBayes. Solid orange line represents the mean values (posterior estimates) across all ten trees, whereas light orange shade represents 95% credible intervals. Dashed orange line represents the uncertainty of patterns through the Toarcian, from a possible “edge effect.” Results shown for the four topologies with “ghost lineages” and sampling parameter (Φ0) of 0.08. Topologies (A) ST 1, (B) ST 2, (C) ST 3, and (D) ST 4. Timescale abbreviations: as in Figure 1.
In the following paragraphs, we further report and discuss these results in a chronological order, from the Middle Triassic to the Early Jurassic, also comparing them to previously published studies that focused on similar questions, e.g., Barrett et al. (2009), Butler et al. (2011), Irmis (2011), Upchurch et al. (2011), Starrfelt and Liow (2016), Tennant et al. (2018). It is important to stress again that our prime aim was to analyze macroevolutionary patterns within the time frame of the tree main Triassic LIPs. For that, in an attempt to prevent an “edge effect” of masquerading such patterns along the Triassic-Jurassic boundary, we extended our data sampling into the entire Early Jurassic. In doing so, we were able to more comprehensively evaluate the Triassic-Jurassic event, but we moved the potential “edge effect” to the Early-Middle Jurassic boundary. Hence, we suggest caution in interpreting the Early Jurassic patterns reported here, especially those near the end of that time interval.
Pan-Avian Diversity Patterns in the Middle Triassic
Taxic diversity or richness of Pan-Aves was relatively low in the Middle Triassic (Figure 2A). This is consistent with patterns of dinosauromorph taxic diversity (Irmis, 2011, Figure 3) and pan-avian (=avemetatarsalian) morphological disparity (Brusatte et al., 2008) previously reported for that time interval. Across the Middle-Late Triassic boundary, we see a higher increase in taxic richness than Irmis (2011) reported for dinosauromorphs. This likely results from a reduction of Ladinian richness values due to the recent dating of the Chanares Formation of Argentina as Carnian in age (Ezcurra et al., 2017), which could also explain the Ladinian to Carnian maintenance of species richness found by Irmis (2011, fig. 4), when taxic diversity is normalised by the number of stratigraphic units with dinosauromorphs records. This overall pattern of taxic richness is consistent with our PyRate results (i.e., diversification rates estimated from occurrence data), for which positive, but low rates are seen for the Ladinian (Figure 2B). However, in contrast to raw richness, PyRate results show relatively higher values for the Anisian, a pattern that might be explained by the inclusion of non-dinosaur early pan-avians in our analyses (e.g., aphanosaurs, silesaurids), which were accounted for the first time in quantitative studies investigating diversification patterns of the group.
The scenario changes when phylogenetic information is employed. In terms of phylogenetic diversity (i.e., accounting for “ghost-lineages”), relatively higher values are seen during the Middle Triassic, with a steady increase across the Anisian and Ladinian, peaking near the Middle-Late Triassic boundary (Figure 1B, Supplementary Figure S4). This matches overall patterns of dinosauromorph phylogenetic diversity found by Irmis (2011, fig. 3), but the new Carnian dating of the Chanares Formation mentioned above can explain our higher values for the Ladinian, compared to those found based on his strict temporally-calibrated phylogenies. Additionally, in our EFBD results (i.e., diversification rates estimated from time-calibrated phylogenetic trees), diversification rates are higher in the Middle Triassic than in any other time interval analysed here (Figure 3). Therefore, the overall patterns of diversity and diversification rates seem affected by the incorporation of phylogenetic information and, consequently, of divergence times (i.e., node ages) data. This is noticeable during the Middle Triassic, for which we see higher diversity and diversification rates when phylogenetic information is accounted for.
Given the meagre fossil record of Middle Triassic pan-avians, the analyses performed here are not suitable to elucidate much about patterns possibly influenced by the Permo-Triassic mass extinction. It may be asserted that pan-avians experienced important diversification events (Figures 2B, 3) and a sustained rise in diversity (especially in phylogenetic diversity; Figure 1B, Supplementary Figure S4) along the Middle Triassic. This was previously hinted by the record of some dinosauriform-dominated ichnofaunas that predate the Ladinian-Carnian boundary (Olsen et al., 1998; Carrano and Wilson, 2001; Marsicano et al., 2007; Farlow et al., 2014; Benton et al., 2018; Mancuso et al., 2020). Thus, the Middle Triassic seems to have witnessed important pulses of pan-avian diversification, but these probably were not sufficient to result in significant impacts in taxic richness (Figure 2A). Indeed, the body-fossil record of lineages may only consistently increase when these are already well established, what will commonly postdate increases in diversification rates. Also, given that rates are estimated comparatively to previous time intervals, when the rising lineages are naturally less diverse, diversification rates will tend to be relatively higher in older time bins.
One may question how much of the Middle Triassic patterns of pan-avian diversity is dictated by the rock record. Indeed, raw richness curves for the Triassic greatly mirror those depicting the number of fossil localities with records of the group (using PBDB collections as a proxy for localities; Figure 2A). Yet, it is also correct that, unlike later in the Triassic (ca. 25%), and surely in the Jurassic (ca. 70%), few Middle Triassic continental fossil sites with tetrapod remains (ca. 10%) have pan-avian records (Figure 2A), indicating that the Triassic expansion of the group is not merely a sampling artefact. These results for the Middle Triassic indicate that, even if somehow delayed, pan-avian rise was part of the faunal recovery that followed the Permo-Triassic mass extinction. Accordingly, there is evidence that some of the main early pan-avian increases in diversity (Figure 1B, Supplementary Figure S4) and diversification rates (Figures 2B, 3) preceded the Late Triassic.
Finally, N. parringtoni was not included in our analysis, but has been previously positioned as the sister-taxon to Dinosauria (Nesbitt et al., 2013), as well as within each of the three main dinosaur groups (Nesbitt et al., 2013; Baron et al., 2017). The inclusion of this taxon in the former position would probably not change much the results of the phylogeny-intermediated analyses presented here. On the contrary, the record of a Middle Triassic theropod, ornithischian, or sauropodomorph, as unlikely as it may be (Novas et al., 2021), would extend a number of ghost-lineages into that time interval, so that phylogenetic diversity and EFBD values in the Anisian-Ladinian would probably be much higher than estimated here (Figures 1, 3).
What Really Happened in the Carnian?
The Carnian was divided in two time bins in our analyses, with terrestrial pan-avian taxic richness rising at “Carnian 1” (in comparison to the Ladinian) and reaching its peak by “Carnian 2” (Figure 2A). The increase at “Carnian 1” happens with only minor changes in the number of PBDB collections for both continental Tetrapoda and terrestrial Pan-Aves, whereas that of “Carnian 2” is synchronous to equivalent rises (Figure 2A). A similar taxic richness increase was found by Irmis (2011, fig. 3) for dinosauromorphs in the Carnian (although not when normalized by the record of geologic units, see above). This is consistent with previously proposed scenarios, in which a higher Carnian diversity, recently termed “dinosaur diversification event” (Bernardi et al., 2018), matches the oldest uncontroversial dinosaur records (Ezcurra 2010). Such diversification event was suggested to be synchronous (Bernardi et al., 2018) or to slightly postdate (Benton et al., 2018) the CPE, the proposed age of which, at 234–232 Ma (Dal Corso et al., 2020; Mancuso et al., 2020), places the event at the end of our “Carnian 1” time bin. Yet, it is important to notice that the maximal duration of the CPA (2 Ma) is significantly shorter than the ca. 5 Ma time bins employed here. In fact, the effects of such a short event will possibly appear downweighed in the time-bin it belongs to, and variations within that time bin will be unaccounted for. In any case, a steady increase in diversification rates (from PyRate analyses) is seen for our two Carnian time bins (Figure 2B), with a Late Triassic peak at “Carnian 2,” showing that diversification rates estimated from occurrence data track the patterns of raw richness for this Stage. Yet, the increase in number of collections at “Carnian 2” cannot be ignored as a possible source of biases to these metrics.
Unlike taxonomic richness, phylogenetic diversity of terrestrial Pan-Aves in the Carnian is broadly similar to that seen in the Ladinian (Figure 1B, Supplementary Figure S4), although an increase trend is seen in the former Stage and the inverse is the case for the later, with a clear reduction from “Carnian 1” to “Carnian 2.” A decline/maintenance in phylogenetic diversity from the Ladinian to the Carnian was also reported by Irmis (2011) when the data are normalized by the number of dinosauromorphs-bearing geological units (the same pattern was found for taxic diversity). Our EFBD results (Figure 3) show lower diversification rates in the Carnian than in the Middle Triassic, broadly tracking the phylogenetic diversity curve (Figure 1B, Supplementary Figure S4). Even though the overall pattern remains the same, some differences are recognized in the EFBD results depending on the topology. For example, ST 3 topology (with silesaurids within Ornithischia) has comparatively lower Carnian rates, possibly due to an estimated Ladinian origin of Dinosauria, following the record of Middle Triassic ornithischians (Figure 3C). Likewise, ST 4 (with sauropodomorphs rising from the earliest saurischian dichotomy) shows notably higher rates for “Carnian 1,” which could be explained by the placement of several Carnian taxa within Theropoda, resulting in an estimated “Carnian 1” origin of Eusaurischia (Figure 3D). A similar explanation can be used to explain the slightly delayed increase in phylogenetic diversity seen for ST 4, which occurs only after the Ladinian-Carnian boundary, contrasting with the three other topologies (Supplementary Figure S4).
As also seen in the Middle Triassic, our results for the Carnian are influenced by the use of phylogenetic information (i.e., the incorporation of temporal information from the time-calibration of the trees). Depending on the approach used, the Carnian is a stage in which terrestrial pan-avian richness/diversification is either higher or lower than/equal to that of the Middle Triassic. This is vital to consider, because previous studies suggested that the CPE, at the end of “Carnian 1,” is linked to the “dinosaur diversification event,” which is usually given a Carnian age (Ezcurra 2010; Benton et al., 2018; Bernardi et al., 2018). Thus, both taxonomic richness and PyRate results, which lack phylogenetic data, corroborate the hypothesis that the Carnian was a period of major diversity shifts for pan-avians, with high diversification rates and significant increases of richness. On the contrary, phylogenetic diversity and diversification rates estimated from EFBD analyses indicate that the main diversification pulses and increases in species richness among terrestrial Pan-Aves happened before the Carnian, with terrestrial pan-avian faunas of this stage remaining at similar levels of richness and having lower diversification rates than in the Middle Triassic. In this case, CPE cannot be considered a driver of pan-avian diversification, although it can still be regarded as favouring the establishment of terrestrial pan-avian faunas that diversified previous to that. Indeed, the oldest fossil assemblages with an expressive pan-avian record are from the Carnian, which also witnessed the first records of the group in northern Pangaea. So, it is clear that the Carnian was a critical moment for the establishment of pan-avians. However, the incorporation of phylogenetic information suggests that it is more likely that the diversification and rise in richness leading to this scenario happened before, towards the end of the Middle Triassic.
The Long Norian and the Peculiar Rhaetian
The Norian was divided into three time bins in our analyses, with terrestrial pan-avians keeping a relatively high and constant taxic richness, although lower than that of “Carnian 2” (Figure 2A). Irmis (2011, fig. 3) also found an initial drop in taxic richness during the Norian, but followed by a rise in the second half of the Stage. Such an increase is also reported by some other studies focusing only on dinosaurs (e.g., Butler et al., 2011; Upchurch et al., 2011; Starrfelt and Liow, 2016). However, Irmis (2011) suggests that the Norian rise of dinosauromorph diversity is heavily influenced by the richer rock record of the Stage, as also noticed by other counts of raw richness (Barrett et al., 2009; Butler et al., 2011; Upchurch et al., 2011). Indeed, when normalized by dinosauromorph-bearing geological units (Irmis, 2011, fig. 4), results for that group are comparable to ours of taxic richness, with a decrease in the first half of the Norian and maintaining similar values in the second half. In fact, our taxic richness results for the Norian seem influenced by the rock records, as they strongly correlate with the number of PBDB collections (Figure 2A). Also, the relatively low richness during the Norian reported here can be explained by two extra factors: the division of the Stage in more time bins (generally lowering TR in each one of them) and the inclusion of non-dinosaur terrestrial Pan-Aves, which may not have increased diversity from Carnian to Norian as much as dinosaurs alone. In addition, our PyRate results are consistent with the taxic richness curve, with a decrease in net diversification rates throughout the Norian (Figure 2B), reaching sub-zero values “Norian 3.”
When phylogenetic data are accounted for, a different picture again emerges. The phylogenetic diversity of terrestrial Pan-Aves rises abruptly along the first two-thirds of the Norian, reaching the highest peak seen during the entire Tr-EJ time span, followed by a slight decrease in the last third of the Stage (Figure 1B, Supplementary Figure S4). This generally matches previous phylogeny-based estimates, which agree on a Norian rise of phylogenetic richness (Barrett et al., 2009; Irmis, 2011). Yet, when normalized by the rock record, Irmis (2011) found a reduction in dinosauromorph phylogenetic richness along that Stage, with an increase only for sauropodomorphs (Barrett et al., 2009). Our EFBD results (Figure 3) broadly match the phylogenetic diversity estimated for the Norian, with net diversification values mostly above zero and constantly higher than those of the Rhaetian and “Carnian 2.”
As also seen for older time bins, our phylogeny-dependent analyses account for ghost-lineages extending back in time towards the Norian, in this case from Rhaetian-Jurassic taxa, so that estimated richness and diversification rates for that Stage are lower when a taxic/occurrence approach is employed. Hence, we agree with prior suggestions that the high Norian raw richness found in some studies are biased by the availability of further sites/deposits of that age. Yet, the phylogenetic data cannot be totally ignored, and our results indicate that the Norian hosted a diversity of terrestrial Pan-Aves that is still to be fully accounted, possibly related to taxa that diversified along that Stage to stablish themselves— more conspicuously impacting taxic counts—only latter in time. A possible candidate group to fill that gap are the ornithischian dinosaurs that, depending on the chosen topology, bear ghost-lineages encompassing almost the entire Late Triassic.
The Norian is traditionally considered a key-period for dinosaur evolution, when the group attained higher faunal dominance (McPhee et al., 2017; Benton et al., 2018), larger sizes (Benson et al., 2014; Apaldetti et al., 2018; Pradelli et al., 2022), greater disparity (Brusatte et al., 2008; Apaldetti et al., 2021), and a broader geographical distribution (Kent and Clemmensen 2021), although some of these patterns are clearly clade- and region-specific (Whiteside et al., 2015). Indeed, the rise in terrestrial pan-avian body size (see below) and diversity seems biased towards sauropodomorphs. On the other hand, this group expanded their range to northern Pangaea in the Norian, together with other pan-avians, such as theropods and lagerpetids, although sauropodomorphs remain unrecorded in continental North America. This “northward dispersal” has been correlated with a greenhouse dip in atmospheric pCO2 at ca. 215–212 Ma, which attenuated climate barriers (Kent and Clemmensen, 2021). Its timing broadly coincides with our “Norian 3” time bin, which records similar values of diversity (considering both taxic and phylogenetic diversity) and lower diversification rates (from both PyRate and EFBD results) compared to previous Norian time bins. Hence, if these climate changes affected terrestrial pan-avian diversity at all it was towards a reduction of such metrics. In any case, even if our data does not indicate that an important rise in the diversity of terrestrial Pan-Aves occurred in the Norian, this has been recognized for sauropodomorphs (Barrett et al., 2009; Irmis, 2011; Mannion et al., 2011) and seems to be an unbiased pattern for this group in particular. As discussed by Apaldetti et al. (2021), the Norian rise of Sauropodomorpha may be associated with a reduction in the diversity (although not extinction) of other herbivorous groups, such as rhynchosaurs, traversodontid cynodonts, and dicynodonts (Benton et al., 2018).
Consistent with our results for terrestrial Pan-Aves (Figure 2A), a Rhaetian increase in dinosaur estimated diversity/richness was reported by Starrfelt and Liow (2016) and Tennant et al. (2018), although with broad confidence intervals in the former. Our division of the Norian in three time bins likely explains the low richness in each of them (see above), relative to the single Rhaetian time bin, given that the reverse—a richer Norian—has been more commonly reported (Barrett et al., 2009; Butler et al., 2011; Upchurch et al., 2011; Starrfelt and Liow, 2016). This was found by Irmis (2011) for dinosauromorphs as well, although taxic richness was slightly higher in the Rhaetian when normalized by the number of bearing stratigraphic units. On the contrary, Barrett et al. (2009) found taxic richness to remain stable across the Norian-Rhaetian boundary for theropods, and to drop for sauropodomorphs, when the rock record is accounted for. Matching our taxic richness results, our PyRate results show an increase in diversification rates over the Norian-Rhaetian boundary, but keeping sub-zero values (Figure 2B). Again, those values match a Rhaetian rise in PBDB collections, which might bear some influence on our results.
Lineage-through-time plots show that the Rhaetian follows trends already present by the end-Norian, with phylogenetic diversity either persisting to decrease or maintaining stable values (Figure 1B, Supplementary Figure S4). Irmis (2011) found dinosauromorph phylogenetic diversity to reduce in the Rhaetian, but to slightly increase when normalized by the number of stratigraphic units. Likewise, Barrett et al. (2009) found Rhaetian lineage richness to decrease for all major dinosaur groups. Somehow mirroring phylogenetic diversity, the near-zero diversification rates for the Rhaetian found by our EFBD results are either equal or lower than those of the end-Norian (Figure 3).
Our phylogeny-intermediated results (i.e., phylogenetic diversity and EFBD results) for the Rhaetian consistently reveal lower values (Figures 1B, 3), compared to those of the taxic/occurrence analyses (Figure 2). This matches higher values for the Norian, showing that the Rhaetian high taxic richness may be the result of a prior diversification event. Even if higher than in “Norian 3,” the sub-zero rates from occurrence data reveals no meaningful diversification in the Rhaetian. Hence, taken as a whole, our results seem to indicate that the Rhaetian has not witnessed any major diversification event for terrestrial Pan-Aves; what is mostly in agreement with previous studies, except for Starrfelt and Liow (2016) and Tennant et al. (2018).
Patterns Across the Triassic-Jurassic Boundary
Our results show that a drop in terrestrial Pan-Aves taxic richness takes place across the Triassic-Jurassic boundary, matching that of PBDB collections with records of the group, which is much weaker than that for continental tetrapods in general (Figure 2A). This agrees with the dinosaur richness estimates of Starrfelt and Liow (2016) and Tennant et al. (2018), but most prior studies inferred instead a rise in dinosauromorph/dinosaur taxic richness from the Rhaetian to the Hettangian (Barrett et al., 2009; Butler et al., 2011; Upchurch et al., 2011; Irmis, 2011; Starrfelt and Liow, 2016). Yet, Barrett et al. (2009) found that this is the case only for ornithischians, when data are normalised by the rock record. Our results show a similar pattern of decrease in phylogenetic diversity (Figure 1B, Supplementary Figure S4), but mostly following a reduction trend already present in the Rhaetian. Again, this differs from most previous estimates of lineage richness, which increases in the Hettangian for Dinosauromorpha (most results of Irmis, 2011), as well as for all major dinosaur groups (Barrett et al., 2009). Such differences may be explained by the increased sampling of our dataset, as well as by not accounting for the diversity of non-dinosaurian taxa, in the case of Barrett et al. (2009), and by the employed methods of time-calibration and normalisation, in the case of Irmis (2011).
Perhaps the most striking of our results is the Hettangian peak in diversification rates from occurrence data (PyRate results; Figure 2B). However, as discussed by Černý et al. (2021), some diversification shifts by PyRate might not be real, but artificially generated by high rates of fossil preservation instead of net diversification rates. Thus, this Hettangian peak could simply be the product of a preservational bias, possibly linked to the higher number of PBDB collections—used here as a proxy for fossil localities—in the Sinemurian (Figure 2A), which could have generated the earlier diversification peak recorded here. Indeed, when the EFBD model is instead used for estimating net diversification rates, the Hettangian exhibits near-zero values, equal or slight lower than those for the Rhaetian (Figure 3). Although using time bins not strictly comparable to ours, Lloyd et al. (2008) found much lower diversification rates towards the Early Jurassic than for most of the Late Triassic, unlike the results presented here (see next section).
In sum, except for the probably spurious PyRate result for the Hettangian, all the metrics used here inform that no increase in richness nor higher diversification rates are seen right after the Triassic-Jurassic boundary. These results differ from the general notion that dinosaurs further radiated following the end-Triassic extinction of several tetrapod groups (Olsen et al., 1987; Olsen et al., 2002). Our results may be simply an outcome of employing an updated dataset, compared to those of about one decade ago, as to better approach the results of more recent studies (Tennant et al., 2018). Yet, although analyses focusing on subgroups were not conducted here, a group-by-group look at Triassic-Jurassic pan-avian diversity patterns may provide important hints. Firstly, dinosaurs are the only terrestrial members of the group to enter the Jurassic, so that analyses focusing on this clade will necessarily produce relatively higher richness values for that Period, because they do not account for the Triassic record of other terrestrial pan-avians. As for the three major dinosaur groups, most prior studies (Barrett et al., 2009; Irmis, 2011; Upchurch et al., 2011; Starrfelt and Liow, 2016) found that ornithischians clearly increased richness across the boundary, whereas the contrary is the case for sauropodomorphs (Apaldetti et al., 2021), with theropods getting intermediate results. Hence, the fact that sauropodomorphs account for more than half of our sample across the Triassic-Jurassic boundary (Figure 1A) may explain why we retrieved lower Hettangian richness values.
Indeed, the end-Triassic extinction of pseudosuchian and therapsid groups most likely emptied ecospace for dinosaurs to expand into during the Jurassic. This is shown here by the major drop in continental PBDB collections with tetrapods, relative to those with terrestrial pan-avians (Figure 2A); meaning that the poorer record of Early Jurassic tetrapod-bearing sites did not affect much the taxic richness of terrestrial Pan-Aves, because the group became concomitantly more prevalent. Yet, our study indicates that the Early Jurassic rise of dinosaurs did not occur quickly and homogeneously for the entire group. Higher richness/diversification rates appear later in the Early Jurassic (see below), so that dinosaur upsurge after the extinction was more gradual than previously hinted. Nonetheless, theropods and especially ornithischians appear to have more rapidly expanded into ecospaces following the mass extinction. This may be because these groups had more equivalent ecological roles—i.e., small to medium herbivores and medium to large carnivores—to those of the extinct forms. Sauropodomorphs, on the other hand, were already quite dominant by the end of the Triassic, so that the extinction of other taxa seems to have not driven the group to major macroevolutionary shifts (Apaldetti et al., 2018; Apaldetti et al., 2021; Pol et al., 2020).
Early Jurassic Dinosaur Diversity
Although we are confident about the patterns described for the earliest Early Jurassic, those of later time bins should be taken with care due to possible “edge effect,” in particular those of the two Toarcian time bins. Taxic diversity generally tends to reduce along the Early Jurassic, although the strong drop within the Pliensbachian may be biased by fewer PBDB collections (Figure 2A). Minor instances of increase are seen in the first halves of both Pliensbachian and Toarcian (Figure 2A), whereas lineage-through-time plots record a rise near the boundary between the two stages (Figure 1B, Supplementary Figure S4), which is however not seen if “ghost lineages” are not included in the phylogenetic trees (Supplementary Figure S5). This matches the net diversification values from occurrence data (Figure 2B), which show overall negative rates along most of the Early Jurassic, with a small increase early in the Toarcian. The EFBD results show a similar pattern, with overall sub-zero diversification rates, but higher near the Pliensbachian-Toarcian boundary (Figure 3). The strong decreases of diversification rates estimated from the EFBD model seen in “Toarcian 2” are possibly an “edge effect” artefact driven from the difficulty of estimating realistic values of the sampling parameter (Φ0) for extinct-only datasets. In general, it seems that the extension of ghost-lineages of Tr-EJ taxa in the phylogeny-intermediated analyses pulls the early Toarcian increase in diversification and richness slightly backwards in time, but this has to be evaluated with care because of potential “edge effect” biases.
For both for taxic richness and phylogenetic diversity, Irmis (2011) found a marked Early Jurassic decrease, with a small rise either in the Pliensbachian (for phylogenetic diversity when the rock record is taken into account) or in the Toarcian; what is in general agreement with the results found here. On the contrary, other studies found an increase in taxic richness in the Sinemurian, followed by a general decrease, in cases with a small Toarcian rise (Butler et al., 2011; Upchurch et al., 2011; Starrfelt and Liow, 2016; Tennant et al., 2018). Barrett et al. (2009) found a general Early Jurassic reduction trend in richness for all the tree major dinosaur groups independently, with a small Pliensbachian increase of theropod and sauropodomorph phylogenetic diversity. Instead, Pol et al. (2020) found a marked decrease in sauropodomorph phylogenetic diversity in the Pliensbachian, followed by a rise along the Toarcian. Accordingly, the emerging pattern for both ours and previous results is that dinosaur richness starts relatively high in the Early Jurassic, but decreases afterwards, with a small rise around the Toarcian. That is an interesting scenario, indicating that dinosaur diversified and already experienced an augmented diversity by the end of the Early Jurassic, which will characterize younger stages of the Mesozoic (Wang and Dodson, 2006). Again, this differs from the results of Lloyd et al. (2008), which found dinosaur diversification rates to be generally lower towards the end of the Early Jurassic; although the selection of time bins makes those studies difficult to compare. Irmis (2011) considered the Early Jurassic drop in dinosaur diversity to result from sampling biases, but the decoupling between taxic richness patterns and the number of PBDB collections found here, except for the passage between “Pliensbachian 1” and “Pliensbachian 2” (Figure 2A), indicates otherwise.
Body-Size Changes Along the Early Evolution of Terrestrial Pan-Aves
The mean body size of terrestrial Pan-Aves shows no abrupt changes across the Tr-EJ; instead, a steady general increase trend is seen along that time interval, somewhat stronger in the Triassic than in the Jurassic (Figure 4A). Slightly more pronounced inflections are seen in the reduction from “Carnian 1” to “Carnian 2” and the increase from “Norian 2” to “Norian 3.” On the contrary, body size disparity shows a marked increase from “Carnian 1” to “Carnian 2” (Figure 4B), resulting from an increase in maximum size and, especially, a decrease in minimum size (Figure 4A). Indeed, relative to the small-to medium-sized Middle Triassic pan-avians, the Carnian witnessed a major rise in body size disparity within the group, with the appearance of tiny forms, like the ca. 10 cm long Kongonaphon kely (Kammerer et al., 2020), along with the first large-bodied dinosaurs, such as the up to 6 m long “Frenguellisaurus sanjuanensis” (Novas et al., 2021). For the rest of the Tr-EJ, body size disparity increases slightly at “Norian 3” and “Simemurian 1”—mainly due to increases in maximum size—and decreases near the Pliensbachian-Toarcian boundary—which is related to a reduction in minimum size.
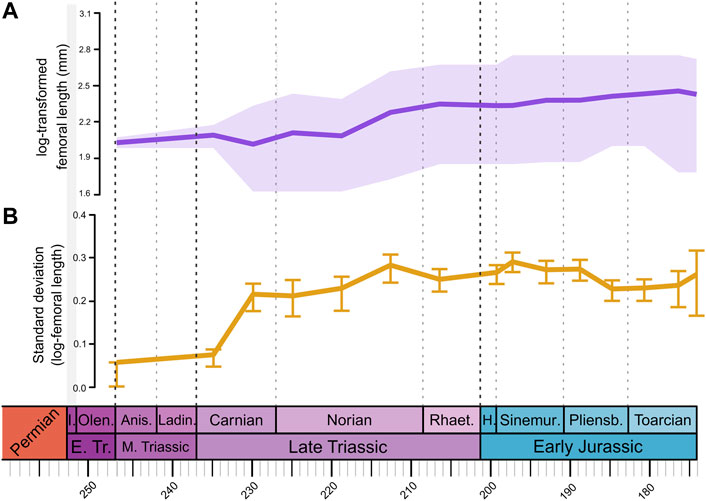
FIGURE 4. Body size patterns of Triassic to Early Jurassic terrestrial Pan-Aves. (A) Body size represented by log-transformed femoral length in millimeters. Solid purple line represents mean body size, light purple shade indicates maximum and minimum sizes. (B) Solid yellow line represents body size disparity, estimated by calculating the standard deviation for each time bin. Error bars estimated by bootstrapping the data 500 times. Timescale abbreviations: as in Figure 1.
When phylogenetic information is considered (i.e., through-time plots with ancestral body sizes; Supplementary Figure S28), the extension of ghost lineages significantly increases Middle Triassic size disparity, so that the “Carnian 2” increase is not so strong. Likewise, the extension of sauropodomorph, ornithischian, and theropod ghost lineages—respectively in ST2, ST3, and ST4 (Supplementary Figure S29)—increases the maximum size in “Carnian 1”, so that only for ST1 mean body size does not reduce along the Carnian (Supplementary Figure S28). Also, the “Norian 3” increase in mean size is less marked for ST2 and ST3 (Supplementary Figure S28), probably because maximum sizes are already higher in “Norian 2” for those topologies (Supplementary Figure S29). A small decrease in mean body size is seen across the Triassic-Jurassic boundary for all topologies, as well as for the results without ancestral states (Figure 4, Supplementary Figure S28). The “Norian 3” peak in body size disparity is generally less marked for all topologies, compared to when ancestral states are not estimated. On the other hand, the “Simemurian 1” peak is maintained, but reduced for ST3 (Supplementary Figure S28), probably because accounting for silesaurid sizes within the ornithischian lineage results in higher Hettangian disparity. Finally, the low Pliensbachian disparity seen in the results without ancestral body sizes is kept across all topologies when phylogenetic information is accounted for.
Pradelli et al. (2022) found a general reduction in body size of “non-Dinosauria Pan-Aves” from the Anisian to the Ladinian-Carnian. Because it excludes dinosaurs, these results are not strictly comparable to ours. Yet, that shift may be correlated with the slight reduction in mean body size we found for the whole Pan-Aves in “Carnian 2,” which is probably driven by the record of smaller-sized non-dinosaurian members of the group in that time bin (Figure 5A). Marked increases in both mean and maximum body size were identified in the Carnian for dinosauromorphs (Irmis, 2011) and ornithodirans (Turner and Nesbitt, 2013). We did recognize an equivalent maximum size increase around that time frame, mainly lead by the appearance of large herrerasaurs (Figures 4A, 5A), but because there is a concomitant decrease in minimum size, the mean body size shows no expressive changes. These shifts right follow the emplacement of the Wrangellia LIP and the correlated CPE, so that the environmental conditions following that event may have favoured the establishment of variable body sizes among terrestrial pan-avians.
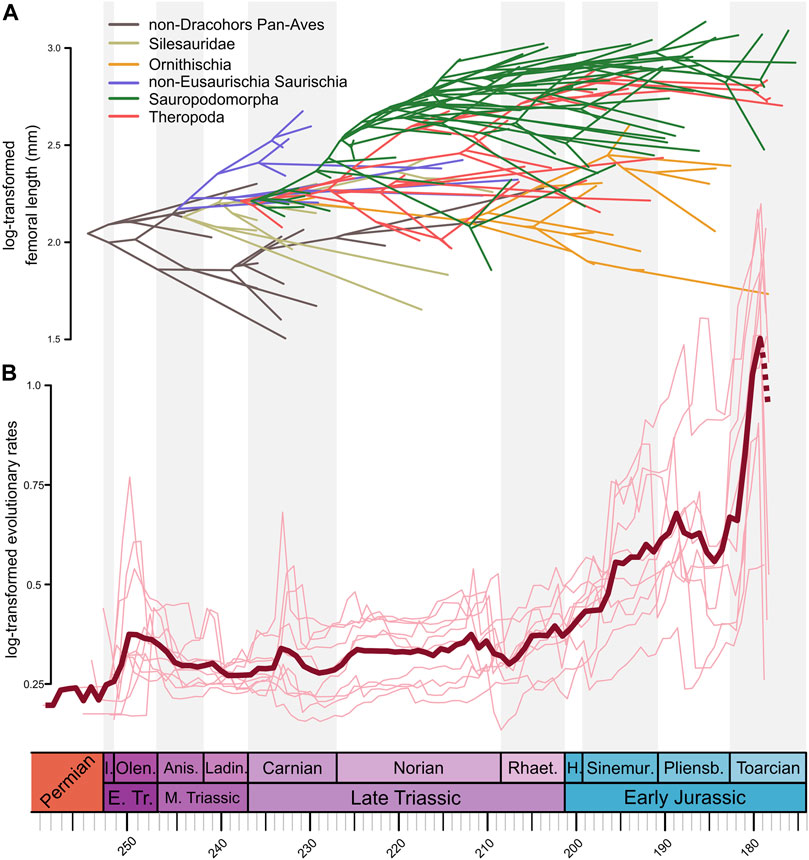
FIGURE 5. (A) Phenogram of Triassic to Early Jurassic Pan-Aves (excluding pterosaurs) with body size incorporated (i.e., log-transformed femoral length in millimeters). Phylogenetic relationships displayed as in our supertree ST 1 (silesaurids external to Dinosauria, theropods forming Saurischia with sauropodomorphs, and herrerasaurs external to Eusaurischia). (B) Through-time rates of body size evolution (log-transformed relative evolutionary rate scalar) of terrestrial Pan-Aves estimated using a heterogeneous rates (or variable rates) model in BayesTraits. Light red lines represent values for each of the ten trees from the ST 1 with “ghost lineages.” Dark red line represents mean rate values (mean scalar) from all ten trees. Dashed red line represents the uncertainty of patterns through the Toarcian from a possible “edge effect.” Timescale abbreviations: as in Figure 1.
Ornithodiran/dinosauromorph maximum and mean body size continue to increase after the Carnian. Yet, whereas previous estimates show changes to cluster in the first half of the Norian (Irmis, 2011; Turner and Nesbitt, 2013), we found stronger increases towards the end of that Stage. Either earlier or later in the Norian, that fluctuation is most probably driven by an increase in sauropodomorph body size, as previously recognized by several authors (Benson et al., 2014; Apaldetti et al., 2018; Apaldetti et al., 2021; Pol et al., 2020; Pradelli et al., 2022), but larger theropods also appear at that time (Figure 5A). The much stronger Late Triassic shifts in body size parameters, found by some previous studies (Carrano, 2006; Benson et al., 2014), usually towards higher disparity and larger body sizes, are likely related to their less comprehensive sampling, restricted to dinosaurs, and are not strictly comparable to our results for the entire realm of terrestrial Pan-Aves.
Olsen et al. (2002) proposed that the end-Triassic mass extinction (i.e., CAMP emplacement) led dinosaurs, particularly theropods, to attain larger sizes early in the Jurassic. This idea has been questioned by various authors (Irmis, 2011; Griffin, 2019; Griffin and Nesbitt, 2019; Spiekman et al., 2021), who claimed that large theropods were already present in the Triassic. Yet, because these were likely rare (Griffin, 2019) and still comparatively smaller than Early Jurassic taxa, studies keep finding a theropod size increase after the Triassic (Turner and Nesbitt, 2013); even if not statistically significant (e.g., Pradelli et al., 2022). This broadly agrees with our results (Figures 4A, 5A), which show slightly larger theropods early in the Jurassic. In addition, our results also agree with recent finds that reveal no sauropodomorph maximum size increase after end-Triassic extinction (Apaldetti et al., 2018; Apaldetti et al., 2021; Pol et al., 2020; Pradelli et al., 2022). At the same time however, our results did not reveal any influence of the minimal size increase of sauropodomorphs inferred for that boundary (Apaldetti et al., 2021). The lack of meaningful body size changes in terrestrial Pan-Aves across the Triassic-Jurassic boundary in our analyses (Figure 4, Supplementary Figure S28) also agrees with the results of Brusatte et al. (2008), which shows no significant shifts in pan-avian morphological disparity at the time. Finally, as our results seem strongly driven by patterns seen in sauropodomorphs, which form the bulk of the pan-avian records at the Triassic-Jurassic boundary, they do not strictly refute the idea that theropods increased their size after the mass extinction.
In agreement with some previous studies (Turner and Nesbitt, 2013; Benson et al., 2014), we recovered a very general trend towards larger terrestrial Pan-Aves along the Early Jurassic (Figure 4). More specifically, Irmis (2011) recognised an increase in mean body size during the Pliensbachian-Toarcian, inferred as mainly driven by a reduction in minimum size. A Pliensbachian-Toarcian increase in both mean and minimum body size was also recovered for sauropodomorphs by Pradelli et al. (2022), corroborating a study of Pol et al. (2020), which associated a severe minimum size reduction in those dinosaurs to climatic changes related to the emplacement of the large Gondwanan igneous provinces of Chon Aike and Karoo-Ferrar. Similar results were found here (although these results should be taken with care due to possible “edge effect”), with an increase in the minimum size and a decrease in size disparity of terrestrial Pan-Aves at “Pliensbachian 2” and “Toarcian 1” (Figure 4), likely reflecting sauropodomorph patterns and maybe driven by those environmental shifts. Meanwhile, a slight general body size decrease was recognised for tetanuran theropods along the Early Jurassic (Figure 5A, Supplementary Figure S28), as already inferred by other studies (Turner and Nesbitt, 2013; Benson et al., 2014; Pradelli et al., 2022).
Finally, we found relatively low rates of body size evolution for terrestrial Pan-Aves during the entire Triassic, markedly rising in the Early Jurassic (Figure 5B; Supplementary Figures S30–31). This is consistent with the results of Turner and Nesbitt (2013), in which higher rates are also seen during the Early Jurassic, whereas Benson et al. (2014) found low rates for the entire time interval sampled here. Yet, a more detailed reading of our results shows important variations along the Triassic. Initial high rates are seen in early in the Olenekian, possibly related to the occupation of ecospace after the Permo-Triassic extinction, followed by a steady decrease until a second rise in the Carnian. Rates get low again, but rise in a two-fold scheme in the early and late Norian, to fall again early in the Rhaetian, only to start rising towards the higher Jurassic rates late in that Stage. Turner and Nesbitt (2013) also found relatively higher rates in the Carnian and late Norian, depending on the employed calibration, somewhat mirroring the results found here. Further, the higher Carnian rates match the increases in taxic richness (Figure 2A), net diversification values from occurrence data (Figure 2B), and body size disparity (Figure 4B), which might be somehow correlated with the environmental changes linked to the CPE. The Norian shifts in body size rates are harder to compare to those of other diversity metrics, but higher phylogenetic diversity (Figure 1B) and size disparity (Figure 4B) have been recorded late in that Stage, fitting the environmental changes discussed by Kent and Clemmensen (2021). Finally, the general Rhaetian-Jurassic increase in body size rates broadly matches some other diversity metrics analysed here (Figures 1B, 2, 3, 4B), with a Toarcian rise preceded by a Pliesnbachian drop of possible environmental causes (Pol et al., 2020). Indeed, if not biased by “edge effect,” the high rates recorded in the Toarcian may be related to the appearance of the large-bodied eusauropods, which will dominate younger Jurassic ecosystems (Pol et al., 2020).
Conclusion
- The Early Triassic lacks body-fossil records of Pan-Aves, but a steady increase in the phylogenetic diversity of the group, along with high rates of body size evolution in the Olenekian, was estimated from phylogeny-based analyses and might fit as part of the biotic recovery from the Permo-Trassic extinction.
- Controversial records of aphanosaurs and silesaurids lead to a minor increase in taxic richness of terrestrial Pan-Aves in the Middle Triassic, along with no major changes in mean body size and body size disparity. Instead, phylogeny-based analyses reveal an increasing phylogenetic diversity, with high net diversification rates (estimated from EFBD), and decreasing rates of body size evolution.
- The Carnian witnessed major macroevolutionary shifts for terrestrial Pan-Aves, with significant increases in taxic richness and body size disparity, and high rates of body size evolution and net diversification (estimated from occurrence data). These patterns might have been driven by the environmental changes related to the CPE. On the other hand, both phylogenetic diversity and net diversification rates (estimated from EFBD) decreases along the Stage.
- Terrestrial Pan-Aves taxic richness remains stable along the Norian, slightly increasing in the Rhaetian. Instead, phylogenetic diversity steadily rises during the former Stage, reducing/stabilizing in the latter. Net diversification rates are higher in the Norian when estimated from EFBD, the opposite happening if based on occurrence data. Mean size and body size disparity steadily increase along the Norian-Rhaetian, but an indicial drop in body size evolutionary rates was estimated for the latter Stage.
- The Triassic-Jurassic boundary is not marked by any major macroevolutionary shift, with trends seen in the Rhaetian generally kept during the earliest Jurassic. The only exception is the high net diversification rates (estimated from occurrence data) in the Hettangian, which might be the by-product of preservational biases. Hence, although the end-Triassic mass extinction surely affected pan-avian evolution, its outcomes result more diffuse and not promptly seen across the boundary.
- Dinosaurs are the only terrestrial Pan-Aves recorded in the Early Jurassic, which starts with a sustained reduction in diversity, overall near-to- or sub-zero diversification rates, and stable body size disparity and mean size values. Further drops in taxic richness, net diversification rates, and body size disparity, as well as low rates of body size evolution, are seen near the Pliensbachian. This may be related to climatic changes akin to igneous activities in Gondwanan areas, whereas more recent patterns recorded here should be interpreted with caution, as possibly biased by an “edge effect.”
- Few major macroevolutionary shifts were consistently identified across all analysed parameters or methods employed, suggesting that the early diversification of terrestrial pan-avians during the Triassic and Early Jurassic was more nuanced and complex than anticipated.
Data Availability Statement
The original contributions presented in the study are included in the article/Supplementary Material. Additional supplementary can be found in a dedicated Zenodo repository (https://zenodo.org/record/6505159), doi: 10.5281/zenodo.6505159. This includes the datasets used in this study, together with scripts used to run macroevolutionary analyses (i.e., RevBayes, PyRate and BayesTraits) and the outputs of these analyses.
Author Contributions
MCL collected the data and PLG conducted analyses. Both authors contributed equally to the conceptualization and writing of the manuscript.
Funding
MCL was supported by Fundação de Amparo à Pesquisa do Estado de São Paulo (FAPESP grant number: 2020/07997-4). PLG was supported by the National Science Foundation (NSF DEB grant number: 1754596) and Coordenação de Aperfeiçoamento de Pessoal de Nivel Superior (CAPES grant number: 88887.583087/2020-00).
Conflict of Interest
The authors declare that the research was conducted in the absence of any commercial or financial relationships that could be construed as a potential conflict of interest.
Publisher’s Note
All claims expressed in this article are solely those of the authors and do not necessarily represent those of their affiliated organizations, or those of the publisher, the editors and the reviewers. Any product that may be evaluated in this article, or claim that may be made by its manufacturer, is not guaranteed or endorsed by the publisher.
Acknowledgments
We thank all contributors to the Paleobiology Database. This is Paleobiology Database official publication 428. We thank Sebastian Höhna, Tom Stubbs, Armin Elsler, and Andrew Meade for help with rates analyses software (RevBayes and BayesTraits). We further thank Černý et al. (2021) and Stubbs et al. (2021) for making detailed scripts accessible (for PyRate and BayesTraits analyses), as well as the RevBayes Team for making many tutorials available in their website (https://revbayes.github.io/tutorials/). We also thank Jacopo Dal Corso, Sara Callegaro, and Haijun Song for inviting us to contribute into this article collection, as well as Randall Irmis and two anonymous reviewers, whose constructive comments significantly improved our paper.
Supplementary Material
The Supplementary Material for this article can be found online at: https://www.frontiersin.org/articles/10.3389/feart.2022.899562/full#supplementary-material
References
Anderson, J. F., Hall‐Martin, A., and Russell, D. A. (1985). Long‐Bone Circumference and Weight in Mammals, Birds and Dinosaurs. J. Zoology 207, 53–61. doi:10.1111/j.1469-7998.1985.tb04915.x
Apaldetti, C., Martínez, R. N., Cerda, I. A., Pol, D., and Alcober, O. (2018). An Early Trend Towards Gigantism in Triassic Sauropodomorph Dinosaurs. Nat. Ecol. Evol. 2, 1227–1232. doi:10.1038/s41559-018-0599-y
Apaldetti, C., Pol, D., Ezcurra, M. D., and Martínez, R. N. (2021). Sauropodomorph Evolution Across the Triassic-Jurassic Boundary: Body Size, Locomotion, and Their Influence on Morphological Disparity. Sci. Rep. 11, 22534. doi:10.1038/s41598-021-01120-w
Baker, J., Meade, A., Pagel, M., and Venditti, C. (2016). Positive Phenotypic Selection Inferred from Phylogenies. Biol. J. Linn. Soc. 118, 95–115. doi:10.1111/bij.12649
Bapst, D. W. (2012). Paleotree : An R Package for Paleontological and Phylogenetic Analyses of Evolution. Methods Ecol. Evol. 3, 803–807. doi:10.1111/j.2041-210x.2012.00223.x
Baron, M. G., Norman, D. B., and Barrett, P. M. (2017). A New Hypothesis of Dinosaur Relationships and Early Dinosaur Evolution. Nature 543, 501–506. doi:10.1038/nature21700
Barrett, P. M., McGowan, A. J., and Page, V. (2009). Dinosaur Diversity and the Rock Record. Proc. R. Soc. B 276, 2667–2674. doi:10.1098/rspb.2009.0352
Benson, R. B. J., Campione, N. E., Carrano, M. T., Mannion, P. D., Sullivan, C., Upchurch, P., et al. (2014). Rates of Dinosaur Body Mass Evolution Indicate 170 Million Years of Sustained Ecological Innovation on the Avian Stem Lineage. PLoS Biol. 12, e1001853. doi:10.1371/journal.pbio.1001853
Benson, R. B. J. (2018). Dinosaur Macroevolution and Macroecology. Annu. Rev. Ecol. Evol. Syst. 49, 379–408. doi:10.1146/annurev-ecolsys-110617-062231
Benson, R. B. J., Godoy, P., Bronzati, M., Butler, R. J., and Gearty, W. (2022). Reconstructed Evolutionary Patterns for Crocodile-Line Archosaurs Demonstrate Impact of Failure to Log-Transform Body Size Data. Commun. Biol. 5, 171. doi:10.1038/s42003-022-03071-y
Benton, M. J., Briggs, D. E. G., Clack, J. A., Edwards, D., Galway-Witham, J., Stringer, C. B., et al. (2017). Russia-UK Collaboration in Paleontology: Past, Present, and Future. Paleontol. J. 51, 576–599. doi:10.1134/s0031030117060028
Bernardi, M., Gianolla, P., Petti, F. M., Mietto, P., and Benton, M. J. (2018). Dinosaur Diversification Linked with the Carnian Pluvial Episode. Nat. Commun. 9, 1499–1026. doi:10.1038/s41467-018-03996-1
Bernardi, M., Gianolla, P., Petti, F. M., Mietto, P., and Benton, M. J. (2018). Dinosaur Diversification Linked with the Carnian Pluvial Episode. Nat. Commun. 9, 1499. doi:10.1038/s41467-018-03996-1
Blackburn, T. J., Olsen, P. E., Bowring, S. A., McLean, N. M., Kent, D. V., Puffer, J., et al. (2013). Zircon U-Pb Geochronology Links the End-Triassic Extinction with the Central Atlantic Magmatic Province. Science 340, 941–945. doi:10.1126/science.1234204
Brusatte, S. L., Benton, M. J., Ruta, M., and Lloyd, G. T. (2008). The First 50 Myr of Dinosaur Evolution: Macroevolutionary Pattern and Morphological Disparity. Biol. Lett. 4, 733–736. doi:10.1098/rsbl.2008.0441
Brusatte, S. L., Niedźwiedzki, G., and Butler, R. J. (2011). Footprints Pull Origin and Diversification of Dinosaur Stem Lineage Deep into Early Triassic. Proc. R. Soc. B 278, 1107–1113. doi:10.1098/rspb.2010.1746
Burgess, S. D., Muirhead, J. D., and Bowring, S. A. (2017). Initial Pulse of Siberian Traps Sills as the Trigger of the End-Permian Mass Extinction. Nat. Commun. 8, 164. doi:10.1038/s41467-017-00083-9
Butler, R. J., Benson, R. B. J., Carrano, M. T., Mannion, P. D., and Upchurch, P. (2011). Sea Level, Dinosaur Diversity and Sampling Biases: Investigating the 'common Cause' Hypothesis in the Terrestrial Realm. Proc. R. Soc. B 278, 1165–1170. doi:10.1098/rspb.2010.1754
Carrano, M. (2006). “Body-size Evolution in the Dinosauria,” in Amniote Paleobiology: Perspectives on the Evolution of Mammals, Birds, and Reptiles. Editors M. T. Carrano, R. W. Blob, T. J. Gaudin, and J. R. Wible (Chicago, IL: University of Chicago Press), 225–268.
Carrano, M. T., and Wilson, J. A. (2001). Taxon Distributions and the Tetrapod Track Record. Paleobiology 27, 564–582. doi:10.1666/0094-8373(2001)027<0564:tdattt>2.0.co;2
Černý, D., Madzia, D., and Slater, G. J. (2021). Empirical and Methodological Challenges to the Model-Based Inference of Diversification Rates in Extinct Clades. Syst. Biol. 71, 153–171.
Chiari, Y., Cahais, V., Galtier, N., and Delsuc, F. (2012). Phylogenomic Analyses Support the Position of Turtles as the Sister Group of Birds and Crocodiles (Archosauria). BMC Biol. 10, 65. doi:10.1186/1741-7007-10-65
Clarke, J. A., Mindell, D. P., de Queiroz, K., Hanson, M., Norell, M. A., and Gauthier, J. A. (2020). “Aves C. Linnaeus 1758 [J. A. Clarke, D. P. Mindell, K. de Queiroz, M. Hanson, M. A. Norell, and J. A. Gauthier], Converted Clade Name,” in Phylonyms. Editors K. de Queiroz, P. D. Cantino, and J. A. Gauthier (Boca Raton, FL: CRC Press), 1247–1254.
Colbert, E. H. (1958). Tetrapod Extinctions at the End of the Triassic Period. Proc. Natl. Acad. Sci. U.S.A. 44, 973–977. doi:10.1073/pnas.44.9.973
Dal Corso, J., Bernardi, M., Sun, Y., Song, H., Seyfullah, L. J., Preto, N., et al. (2020). Extinction and Dawn of the Modern World in the Carnian (Late Triassic). Sci. Adv. 6, eaba0099. doi:10.1126/sciadv.aba0099
Davies, J. H. F. L., Marzoli, A., Bertrand, H., Youbi, N., Ernesto, M., and Schaltegger, U. (2017). End-Triassic Mass Extinction Started by Intrusive CAMP Activity. Nat. Commun. 8, 15596. doi:10.1038/ncomms15596
Desojo, J. B., Fiorelli, L. E., Ezcurra, M. D., Martinelli, A. G., Ramezani, J., Da Rosa, Á. A. S., et al. (2020). The Late Triassic Ischigualasto Formation at Cerro Las Lajas (La Rioja, Argentina): Fossil Tetrapods, High-Resolution Chronostratigraphy, and Faunal Correlations. Sci. Rep. 10, 12782. doi:10.1038/s41598-020-67854-1
Ezcurra, M. D. (2010). A New Early Dinosaur (Saurischia: Sauropodomorpha) from the Late Triassic of Argentina: A Reassessment of Dinosaur Origin and Phylogeny. J. Syst. Palaeontol. 8, 371–425. doi:10.1080/14772019.2010.484650
Ezcurra, M. D. (2006). A Review of the Systematic Position of the Dinosauriform Archosaur Eucoelophysis Baldwini from the Upper Triassic of New Mexico, USA. Geodiversitas 28, 649–684.
Ezcurra, M. D., Bandyopadhyay, S., and Gower, D. J. (2021). A New Erythrosuchid Archosauriform from the Middle Triassic Yerrapalli Formation of South-Central India. Ameghiniana 58, 132–168. doi:10.5710/amgh.18.01.2021.3416
Ezcurra, M. D., and Butler, R. J. (2018). The Rise of the Ruling Reptiles and Ecosystem Recovery from the Permo-Triassic Mass Extinction. Proc. R. Soc. B 285, 20180361. doi:10.1098/rspb.2018.0361
Ezcurra, M. D., Fiorelli, L. E., Martinelli, A. G., Rocher, S., von Baczko, M. B., Ezpeleta, M., et al. (2017). Deep Faunistic Turnovers Preceded the Rise of Dinosaurs in Southwestern Pangaea. Nat. Ecol. Evol. 1, 1477–1483. doi:10.1038/s41559-017-0305-5
Farlow, J. O., Schachner, E. R., Sarrazin, J. C., Klein, H., and Currie, P. J. (2014). Pedal Proportions of Poposaurus Gracilis: Convergence and Divergence in the Feet of Archosaurs. Anat. Rec. 297, 1022–1046. doi:10.1002/ar.22863
Field, D. J., Bercovici, A., Berv, J. S., Dunn, R., Fastovsky, D. E., Lyson, T. R., et al. (2018). Early Evolution of Modern Birds Structured by Global Forest Collapse at the End-Cretaceous Mass Extinction. Curr. Biol. 28, 1825–1831. doi:10.1016/j.cub.2018.04.062
Gavryushkina, A., Welch, D., Stadler, T., and Drummond, A. J. (2014). Bayesian Inference of Sampled Ancestor Trees for Epidemiology and Fossil Calibration. PLoS Comput. Biol. 10, e1003919. doi:10.1371/journal.pcbi.1003919
Griffin, C. T. (2019). Large Neotheropods from the Upper Triassic of North America and the Early Evolution of Large Theropod Body Sizes. J. Paleontology 93, 1010–1030.
Griffin, C. T., and Nesbitt, S. J. (2019). Does the Maximum Body Size of Theropods Increase across the Triassic-Jurassic Boundary? Integrating Ontogeny, Phylogeny, and Body Size. Anat. Rec. 303, 1158–1169. doi:10.1002/ar.24130
Guillerme, T. (2018). dispRity: A Modular R Package for Measuring Disparity. Methods Ecol. Evol. 9, 1755–1763. doi:10.1111/2041-210x.13022
Heath, T. A., Huelsenbeck, J. P., and Stadler, T. (2014). The Fossilized Birth-Death Process for Coherent Calibration of Divergence-Time Estimates. Proc. Natl. Acad. Sci. U. S. A. 111, E2957–E2966. doi:10.1073/pnas.1319091111
Höhna, S., Landis, M. J., Heath, T. A., Boussau, B., Lartillot, N., Moore, B. R., et al. (2016). RevBayes: Bayesian Phylogenetic Inference Using Graphical Models and an Interactive Model-Specification Language. Syst. Biol. 65, 726–736. doi:10.1093/sysbio/syw021
Irmis, R. B., Nesbitt, S. J., Padian, K., Smith, N. D., Turner, A. H., Woody, D., et al. (2007). A Late Triassic Dinosauromorph Assemblage from New Mexico and the Rise of Dinosaurs. Science 317 (5836), 358–361.
Irmis, R. B. (2011). Evaluating Hypotheses for the Early Diversification of Dinosaurs. Earth Environ. Sci. Trans. R. Soc. Edinb. 101, 397–426. doi:10.1017/s1755691011020068
Kammerer, C. F., Nesbitt, S. J., Flynn, J. J., Ranivoharimanana, L., and Wyss, A. R. (2020). A Tiny Ornithodiran Archosaur from the Triassic of Madagascar and the Role of Miniaturization in Dinosaur and Pterosaur Ancestry. Proc. Natl. Acad. Sci. U.S.A. 117, 17932–17936. doi:10.1073/pnas.1916631117
Kent, D. V., and Clemmensen, L. B. (2021). Northward Dispersal of Dinosaurs from Gondwana to Greenland at the Mid-Norian (215–212 Ma, Late Triassic) Dip in Atmospheric pCO2. Proc. Natl. Acad. Sci. U. S. A. 118, e2020778118. doi:10.1073/pnas.2020778118
Kuhl, H., Frankl-Vilches, C., Bakker, A., Mayr, G., Nikolaus, G., Boerno, S. T., et al. (2021). An Unbiased Molecular Approach Using 3′-UTRs Resolves the Avian Family-Level Tree of Life. Mol. Biol. Evol. 38, 108–127. doi:10.1093/molbev/msaa191
Langer, M. C., Ezcurra, M. D., Bittencourt, J. S., and Novas, F. E. (2010). The Origin and Early Evolution of Dinosaurs. Biol. Rev. 85, 55–110. doi:10.1111/j.1469-185x.2009.00094.x
Langer, M. C., and Ferigolo, J. (2013). The Late Triassic Dinosauromorph Sacisaurus Agudoensis (Caturrita Formation; Rio Grande Do Sul, Brazil): Anatomy and Affinities. Geol. Soc. Lond. Spec. Publ. 379, 353–392. doi:10.1144/sp379.16
Langer, M. C., Ramezani, J., and Da Rosa, Á. A. S. (2018). U-pb Age Constraints on Dinosaur Rise from South Brazil. Gondwana Res. 57, 133–140. doi:10.1016/j.gr.2018.01.005
Lee, M. S. Y., Cau, A., Naish, D., and Dyke, G. J. (2014). Morphological Clocks in Paleontology, and a Mid-Cretaceous Origin of Crown Aves. Syst. Biol. 63, 442–449. doi:10.1093/sysbio/syt110
Liu, J., Ramezani, J., Li, L., Shang, Q. H., Xu, G. H., Wang, Y. Y., et al. (2018). High-Precision Temporal Calibration of Middle Triassic Vertebrate Biostratigraphy: U-Pb Zircon Constraints for the Sinokannemeyeria Fauna and Yonghesuchus. Vertebr. Palasiat. 56, 16–24.
Lloyd, G. T., Davis, K. E., Pisani, D., Tarver, J. E., Ruta, M., Sakamoto, M., et al. (2008). Dinosaurs and the Cretaceous Terrestrial Revolution. Proc. R. Soc. B 275, 2483–2490. doi:10.1098/rspb.2008.0715
Maddison, W. P., and Maddison, D. R. (2019). Mesquite: A Modular System for Evolutionary Analysis. Version 3.61. Available at: http://www.mesquiteproject.org.
Magee, A. F., and Höhna, S. (2021). Impact of K-Pg Mass Extinction Event on Crocodylomorpha Inferred from Phylogeny of Extinct and Extant Taxa. bioRxiv, 426715. doi:10.1101/2021.01.14.426715
Magee, A. F., Höhna, S., Vasylyeva, T. I., Leaché, A. D., and Minin, V. N. (2020). Locally Adaptive Bayesian Birth-Death Model Successfully Detects Slow and Rapid Rate Shifts. PLoS Comput. Biol. 16, e1007999. doi:10.1371/journal.pcbi.1007999
Mancuso, A. C., Benavente, C. A., Irmis, R. B., and Mundil, R. (2020). Evidence for the Carnian Pluvial Episode in Gondwana: New Multiproxy Climate Records and Their Bearing on Early Dinosaur Diversification. Gondwana Res. 86, 104–125. doi:10.1016/j.gr.2020.05.009
Mannion, P. D., Upchurch, P., Carrano, M. T., and Barrett, P. M. (2011). Testing the Effect of the Rock Record on Diversity: A Multidisciplinary Approach to Elucidating the Generic Richness of Sauropodomorph Dinosaurs through Time. Biol. Rev. 86, 157–181. doi:10.1111/j.1469-185x.2010.00139.x
Marsicano, C. A., Domnanovich, N. S., and Mancuso, A. C. (2007). Dinosaur Origins: Evidence from the Footprint Record. Hist. Biol. 19, 83–91. doi:10.1080/08912960600866920
Marsicano, C. A., Irmis, R. B., Mancuso, A. C., Mundil, R., and Chemale, F. (2016). The Precise Temporal Calibration of Dinosaur Origins. Proc. Natl. Acad. Sci. U.S.A. 113, 509–513. doi:10.1073/pnas.1512541112
McPhee, B. W., Bordy, E. M., Sciscio, L., and Choiniere, J. N. (2017). The Sauropodomorph Biostratigraphy of the Elliot Formation of Southern Africa: Tracking the Evolution of Sauropodomorpha Across the Triassic–Jurassic Boundary. Acta Palaeontol. Pol. 62, 441–465. doi:10.4202/app.00377.2017
Meade, A., and Pagel, M. (2017). BayesTraits V3.0. Available at: http://www.evolution.reading.ac.uk/BayesTraitsV3/BayesTraitsV3.html.
Müler, R. T., Langer, M. C., Bronzati, M., Pacheco, C. P., Cabreira, S. F., and Dias-da-Silva, S. (2018). Early Evolution of Sauropodomorphs: Anatomy and Phylogenetic Relationships of a Remarkably Wellpreserved Dinosaur from the Upper Triassic of Southern Brazil. Zoological J. Linn. Soc. 184, 1187–1248.
Müller, R. T., and Garcia, M. S. (2020). A Paraphyletic ‘Silesauridae' as an Alternative Hypothesis for the Initial Radiation of Ornithischian Dinosaurs. Biol. Lett. 16, 20200417. doi:10.1098/rsbl.2020.0417
Nesbitt, S. J., Barrett, P. M., Werning, S., Sidor, C. A., and Charig, A. J. (2013). The Oldest Dinosaur? A Middle Triassic Dinosauriform from Tanzania. Biol. Lett. 9, 20120949. doi:10.1098/rsbl.2012.0949
Nesbitt, S. J., Sidor, C. A., Irmis, R. B., Angielczyk, K. D., Smith, R. M. H., and Tsuji, L. A. (2010). Ecologically Distinct Dinosaurian Sister Group Shows Early Diversification of Ornithodira. Nature 464, 95–98. doi:10.1038/nature08718
Nesbitt, S. J., Smith, N. D., Irmis, R. B., Turner, A. H., Downs, A., and Norell, M. A. (2009). A Complete Skeleton of a Late Triassic Saurischian and the Early Evolution of Dinosaurs. Science 326, 1530–1533. doi:10.1126/science.1180350
Novas, F. E., Agnolin, F. L., Ezcurra, M. D., Temp Müller, R., Martinelli, A. G., and Langer, M. C. (2021). Review of the Fossil Record of Early Dinosaurs from South America, and its Phylogenetic Implications. J. S. Am. Earth Sci. 110, 103341. doi:10.1016/j.jsames.2021.103341
Olsen, P. E., Kent, D. V., Sues, H.-D., Koeberl, C., Huber, H., Montanari, A., et al. (2002). Ascent of Dinosaurs Linked to an Iridium Anomaly at the Triassic-Jurassic Boundary. Science 296, 1305–1307. doi:10.1126/science.1065522
Olsen, P. E., Shubin, N. H., and Anders, M. H. (1987). New Early Jurassic Tetrapod Assemblages Constrain Triassic-Jurassic Tetrapod Extinction Event. Science 237, 1025–1029. doi:10.1126/science.3616622
Olsen, P. E., Smith, J. B., and McDonald, N. G. (1998). Type Material of the Type Species of the Classic Theropod Footprint generaEubrontes, Anchisauripus, and Grallator (Early Jurassic, Hartford and Deerfield Basins, Connecticut and Massachusetts, U.S.A.). J. Vertebrate Paleontology 18, 586–601. doi:10.1080/02724634.1998.10011086
Pacheco, C., Müller, R. T., Langer, M., Pretto, F. A., Kerber, L., and Dias da Silva, S. (2019). Gnathovorax Cabreirai: A New Early Dinosaur and the Origin and Initial Radiation of Predatory Dinosaurs. PeerJ 7, e7963. doi:10.7717/peerj.7963
Pagel, M., and Meade, A. (2006). Bayesian Analysis of Correlated Evolution of Discrete Characters by Reversible‐Jump Markov Chain Monte Carlo. Am. Nat. 167, 808–825. doi:10.1086/503444
Peecook, B. R., Sidor, C. A., Nesbitt, S. J., Smith, R. M. H., Steyer, J. S., and Angielczyk, K. D. (2013). A New Silesaurid from the Upper Ntawere Formation of Zambia (Middle Triassic) Demonstrates the Rapid Diversification of Silesauridae (Avemetatarsalia, Dinosauriformes). J. Vertebrate Paleontology 33, 1127–1137. doi:10.1080/02724634.2013.755991
Plummer, M., Best, N., Cowles, K., and Vines, K. (2006). CODA: Convergence Diagnosis and Output Analysis for MCMC. R. News 6, 7–11.
Pol, D., Ramezani, J., Gomez, K., Carballido, J. L., Carabajal, A. P., Rauhut, O. W. M., et al. (2020). Extinction of Herbivorous Dinosaurs Linked to Early Jurassic Global Warming Event. Proc. R. Soc. B 287, 20202310. doi:10.1098/rspb.2020.2310
Pradelli, L. A., Leardi, J. M., and Ezcurra, M. D. (2022). Body Size Disparity of the Archosauromorph Reptiles During the First 90 Million Years of Their Evolution. Ameghiniana 59, 47–77. doi:10.5710/amgh.16.09.2021.3441
Rambaut, A., Drummond, A. J., Xie, D., Baele, G., and Suchard, M. A. (2018). Posterior Summarization in Bayesian Phylogenetics Using Tracer 1.7. Syst. Biol. 67, 901–904. doi:10.1093/sysbio/syy032
Revell, L. J. (2012). Phytools: An R Package for Phylogenetic Comparative Biology (And Other Things). Methods Ecol. Evol. 2, 217–223.
Ronquist, F., Klopfstein, S., Vilhelmsen, L., Schulmeister, S., Murray, D. L., and Rasnitsyn, A. P. (2012a). A Total-Evidence Approach to Dating with Fossils, Applied to the Early Radiation of the Hymenoptera. Syst. Biol. 61, 973–999. doi:10.1093/sysbio/sys058
Ronquist, F., Teslenko, M., Van Der Mark, P., Ayres, D. L., Darling, A., Höhna, S., et al. (2012b). MrBayes 3.2: Efficient Bayesian Phylogenetic Inference and Model Choice across a Large Model Space. Syst. Biol. 61, 539–542. doi:10.1093/sysbio/sys029
Sakamoto, M., Benton, M. J., and Venditti, C. (2016). Dinosaurs in Decline Tens of Millions of Years Before Their Final Extinction. Proc. Natl. Acad. Sci. U.S.A. 113, 5036–5040. doi:10.1073/pnas.1521478113
Sengupta, S., Ezcurra, M. D., and Bandyopadhyay, S. (2017). A New Horned and Long-Necked Herbivorous Stem-Archosaur from the Middle Triassic of India. Sci. Rep. 7, 8366. doi:10.1038/s41598-017-08658-8
Silvestro, D., Cascales-Miñana, B., Bacon, C. D., and Antonelli, A. (2015). Revisiting the Origin and Diversification of Vascular Plants Through a Comprehensive Bayesian Analysis of the Fossil Record. New Phytol. 207, 425–436. doi:10.1111/nph.13247
Silvestro, D., Salamin, N., Antonelli, A., and Meyer, X. (2019). Improved Estimation of Macroevolutionary Rates from Fossil Data Using a Bayesian Framework. Paleobiology 45, 546–570.
Silvestro, D., Salamin, N., and Schnitzler, J. (2014b). PyRate: A New Program to Estimate Speciation and Extinction Rates from Incomplete Fossil Data. Methods Ecol. Evol. 5, 1126–1131.
Silvestro, D., Schnitzler, J., Liow, L. H., Antonelli, A., and Salamin, N. (2014a). Bayesian Estimation of Speciation and Extinction from Incomplete Fossil Occurrence Data. Syst. Biol. 63, 349–367. doi:10.1093/sysbio/syu006
Sookias, R. B., Butler, R. J., and Benson, R. B. (2012b). Rise of Dinosaurs Reveals Major Body-Size Transitions Are Driven by Passive Processes of Trait Evolution. Proc. Biol. Sci. 279, 2180–2187. doi:10.1098/rspb.2011.2441
Sookias, R. B., Benson, R. B. J., and Butler, R. J. (2012a). Biology, Not Environment, Drives Major Patterns in Maximum Tetrapod Body Size Through Time. Biol. Lett. 8, 674–677. doi:10.1098/rsbl.2012.0060
Spiekman, S. N. F., Ezcurra, M. D., Butler, R. J., Fraser, N. C., and Maidment, S. C. R. (2021). Pendraig Milnerae, a New Small-Sized Coelophysoid Theropod from the Late Triassic of Wales. R. Soc. open Sci. 8, 210915. doi:10.1098/rsos.210915
Stadler, T. (2010). Sampling-Through-Time in Birth-Death Trees. J. Theor. Biol. 267, 396–404. doi:10.1016/j.jtbi.2010.09.010
Starrfelt, J., and Liow, L. H. (2016). How Many Dinosaur Species Were There? Fossil Bias and True Richness Estimated Using a Poisson Sampling Model. Phil. Trans. R. Soc. B 371, 20150219. doi:10.1098/rstb.2015.0219
Stubbs, T. L., Pierce, S. E., Elsler, A., Anderson, P. S., Rayfield, E. J., and Benton, M. J. (2021). Ecological Opportunity and the Rise and Fall of Crocodylomorph Evolutionary Innovation. Proc. Royal Soc. B 288 (1947), 20210069.
Sun, Y., Joachimski, M. M., Wignall, P. B., Yan, C., Chen, Y., Jiang, H., et al. (2012). Lethally Hot Temperatures During the Early Triassic Greenhouse. Science 338, 366–370. doi:10.1126/science.1224126
Tennant, J. P., Chiarenza, A. A., and Baron, M. (2018). How Has Our Knowledge of Dinosaur Diversity Through Geologic Time Changed Through Research History? PeerJ 6, e4417. doi:10.7717/peerj.4417
Tribble, C. M., Freyman, W. A., Landis, M. J., Lim, J. Y., Barido‐Sottani, J., Kopperud, B. T., et al. (2021). RevGadgets: An R Package for Visualizing Bayesian Phylogenetic Analyses from RevBayes. Methods Ecol. Evol. 13, 314–323. doi:10.1111/2041-210x.13750
Turner, A. H., and Nesbitt, S. J. (2013). Body Size Evolution During the Triassic Archosauriform Radiation. Geol. Soc. Lond. Spec. Publ. 379, 573–597. doi:10.1144/sp379.15
Turner, A. H., Pritchard, A. C., and Matzke, N. J. (2017). Empirical and Bayesian Approaches to Fossil-Only Divergence Times: A Study Across Three Reptile Clades. PLoS One 12, e0169885. doi:10.1371/journal.pone.0169885
Upchurch, P., Mannion, P. D., Benson, R. B. J., Butler, R. J., and Carrano, M. T. (2011). “Geological and Anthropogenic Controls on the Sampling of the Terrestrial Fossil Record: A Case Study from the Dinosauria,” in Comparing the Geological and Fossil Records: Implications for Biodiversity Studies. Editors A. J. McGowan, and A. B. Smith (London: Geological Society of London), 209–240. doi:10.1144/sp358.14
Venditti, C., Meade, A., and Pagel, M. (2011). Multiple Routes to Mammalian Diversity. Nature 479, 393–396. doi:10.1038/nature10516
Wang, S. C., and Dodson, P. (2006). Estimating the Diversity of Dinosaurs. Proc. Natl. Acad. Sci. U.S.A. 103, 13601–13605. doi:10.1073/pnas.0606028103
Whiteside, J. H., Lindström, S., Irmis, R. B., Glasspool, I. J., Schaller, M. F., Dunlavey, M., et al. (2015). Extreme Ecosystem Instability Suppressed Tropical Dinosaur Dominance for 30 Million Years. Proc. Natl. Acad. Sci. U.S.A. 112, 7909–7913. doi:10.1073/pnas.1505252112
Keywords: Pan-Aves, dinosaurs, body size evolution, PyRate, taxic richness, phylogenetic diversity, fossilized-birth-death, variable rates model
Citation: Langer MC and Godoy PL (2022) So Volcanoes Created the Dinosaurs? A Quantitative Characterization of the Early Evolution of Terrestrial Pan-Aves. Front. Earth Sci. 10:899562. doi: 10.3389/feart.2022.899562
Received: 18 March 2022; Accepted: 09 May 2022;
Published: 02 June 2022.
Edited by:
Haijun Song, China University of Geosciences, ChinaReviewed by:
Michael D'Emic, Adelphi University, United StatesDavid Button, University of Bristol, United Kingdom
Randall Irmis, The University of Utah, United States
Copyright © 2022 Langer and Godoy. This is an open-access article distributed under the terms of the Creative Commons Attribution License (CC BY). The use, distribution or reproduction in other forums is permitted, provided the original author(s) and the copyright owner(s) are credited and that the original publication in this journal is cited, in accordance with accepted academic practice. No use, distribution or reproduction is permitted which does not comply with these terms.
*Correspondence: Max Cardoso Langer, bWNsYW5nZXJAZmZjbHJwLnVzcC5icg==
†These authors have contributed equally to this work