 Furong Tan
 Yang Li
 Zhiqing Xie3
94% of researchers rate our articles as excellent or good
Learn more about the work of our research integrity team to safeguard the quality of each article we publish.
Find out more
ORIGINAL RESEARCH article
Front. Earth Sci. , 25 May 2022
Sec. Geochemistry
Volume 10 - 2022 | https://doi.org/10.3389/feart.2022.898629
This article is part of the Research Topic New Advances in Light Oil/Condensate Geochemistry View all 8 articles
The discovery of gas hydrates in the Muli Depression has made the South Qilian Basin (SQB) a hotspot for oil and gas exploration. Although many studies have been carried out on the gas hydrates, the geochemical characteristics have rarely been reported, which can effectively indicate the genetic type, diffusion, biodegradation, and thermal maturity of natural gas. In this contribution, the molecular composition and carbon isotopes of alkane gases were collected from gas hydrates and free gases in drilled boreholes of the Muli Depression. The results show that the majority of natural gases are oil-type gases, with a little coal-type gases. The natural gases have undergone biodegradation, leading to a decrease in the propane content and an increase in the methane content, with a heavier carbon isotope of propane and a lighter carbon isotope of methane. Some of the natural gases have experienced diffusion, resulting in a decrease in the methane content and an increasing value of Δ(δ13C1-δ13C2). Furthermore, the wet gases from natural gases were derived from the cracking of kerogen and crude oil at the thermal maturity stage. The dry gases in small quantities were produced by biodegradation of the wet gases. We propose that the potential for light oil and condensate exists in the Jurassic Yaojie Formation. Our new findings on the geochemical characteristics of natural gases provide new constraints for the study of petroleum systems and deeply buried sediments in the SQB.
Geochemistry of natural gas, including the molecular components and stable carbon isotopes, changes greatly depending on the depositional environment of source rocks, the thermal evolution history of the sedimentary basin, and the diffusion and leakage of natural gas (Schoell, 1988; Prinzhofer and Huc, 1995; Lorant et al., 1998; Whiticar, 1999; Larter and di Primio, 2005; Boreham et al., 2008; Strąpoć et al., 2011; Chen et al., 2017; Milkov and Etiope, 2018; Liu et al., 2019), which can be used to evaluate the origin of natural gas, formation, accumulation, exploration potential, and secondary alteration effects.
During the past decade, a large number of oil and gas identifications (OGIs, such as natural gas, gas hydrate, and oil) have been discovered in the Jurassic strata of the Muli Depression in the South Qilian Basin (SQB) (Lu et al., 2013a; Lu et al., 2015; Cheng et al., 2016; Zhang et al., 2016). The OGIs indicate that the Muli Depression has good hydrocarbon geological conditions. A series of important achievements have been made in the study of gas hydrate components (Wang et al., 2009; Zhu et al., 2010; Cao et al., 2012), reservoir (Lu et al., 2010; Lu et al., 2013b; Lu et al., 2015), genetic type (Huang et al., 2016; Zuo et al., 2016; Dai et al., 2017; Tan et al., 2017; Tan et al., 2021; Zhang et al., 2018; Liu et al., 2019), seismic characteristics, and logging response. A consensus has been reached that the origin of alkane gases from gas hydrates in the Muli Depression is thermogenic (Wang et al., 2009; Lu et al., 2010; Lu et al., 2013b; Lu et al., 2015; Zhu et al., 2010; Cao et al., 2012; Huang et al., 2016; Zuo et al., 2016; Zhang et al., 2018). However, the thermal maturity and secondary alteration of gas hydrates have not been studied in detail, which in turn leads to a debate on the formation and enrichment model of natural gas in the Muli Depression.
In this contribution, we systematically analyzed the molecular and stable carbon isotopic composition of natural gas collected from newly drilled boreholes in the Muli Depression to identify the genetic type, thermal maturity, and secondary alteration (biodegradation and diffusion) of natural gases by the diagrams proposed by Chung et al. (1998), Milkov (2021), Prinzhofer and Huc (1995). In addition, the potential of primary light oil and condensate were discussed in the Jurassic strata of the Muli Depression. Our new findings not only lay a theoretical basis for exploring the relationship between natural gas and source rocks but also provide a new perspective on the enrichment and reservoir formation mechanism of Jurassic natural gas in the Muli Depression.
The SQB is located in the Qilian Orogenic Belt bounded by the Qaidam Basin to the south, the Tarim Basin to the northwest, and the West Qinling to the southeast (Figure 1A). It has experienced multistage evolution of the Pre-Carboniferous orogeny, the Carboniferous–Triassic deposition, and the Jurassic–Quaternary reformation (Huang, 1996). From Carboniferous to Middle Triassic, the SQB was an epicontinental sea that underwent two marine intrusion-recessionary cycles, forming widespread carbonate and sandstone sediments (Yin et al., 2008). In the Late Triassic, the basin received terrestrial deposition, and the depositional range significantly diminished from the Middle Triassic (Li et al., 2020; Xiao et al., 2021; Liu et al., 2022). Subsequently, the basin deposited only sporadically, and the Jurassic strata were deposited locally in the northern part of the basin.
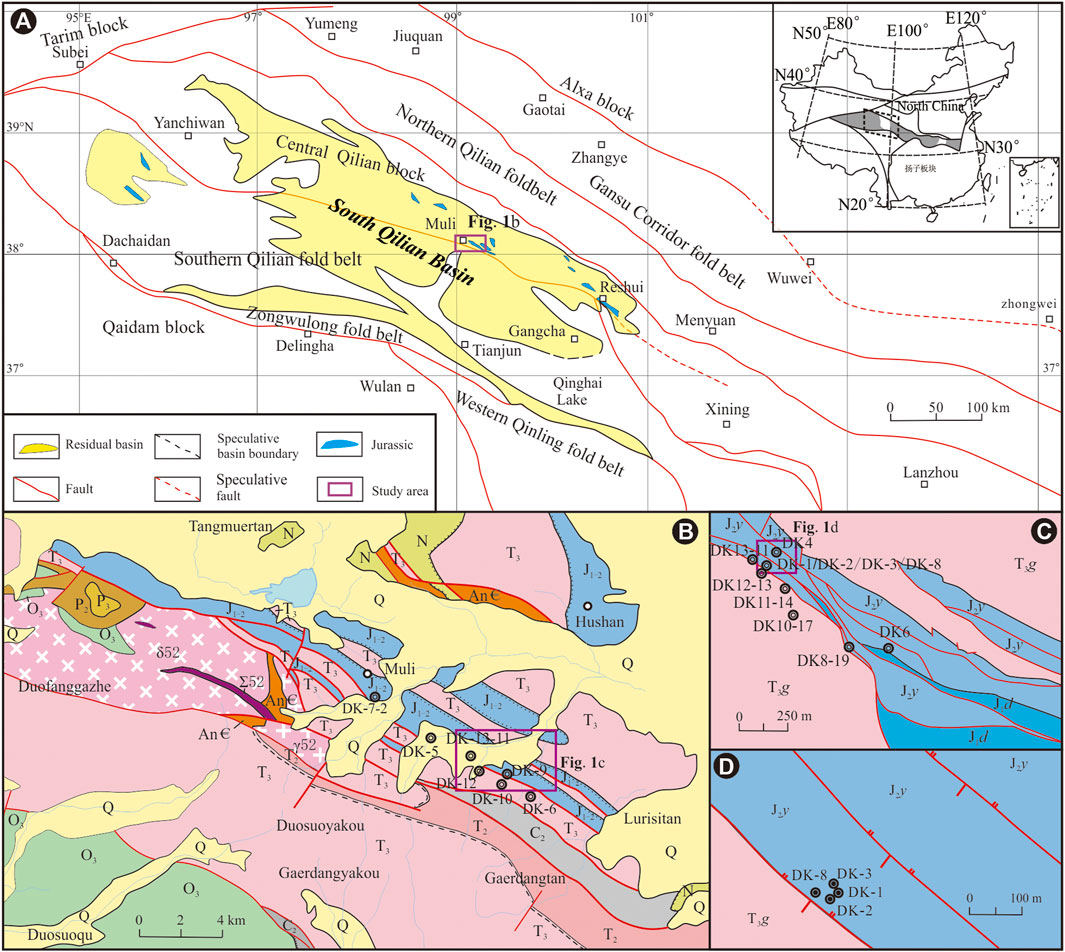
FIGURE 1. Simplified geological map with the distribution of natural gas boreholes in the Muli Depression of the South Qilian Basin.
The SQB can be subdivided into five depressions and six uplifts according to the tectonic unit. The Muli Depression is the most promising area for oil and gas in the SQB, with an area of ∼6,500 km2. The stratigraphy of the Muli Depression mainly comprises marine Carboniferous–Middle Triassic, terrestrial Upper Triassic, and Jurassic strata, with sediment thickness higher than 4,500 m. The Upper Triassic Galedesi Formation and the Jurassic Yaojie Formation are the most important sediments of the Muli Depression. The Galedesi Formation comprises fluvial, deltaic, and lacustrine and mainly develop dark-gray fine sandstones, siltstones, and mudstones, interspersed with thin coal seams (Fan et al., 2020). The lower part of the Yaojie Formation comprises fluvial-deltaic sediments and develops dark-gray and gray-black fine sandstones, siltstones, mudstones, and coal seams (Gong et al., 2014; Liu et al., 2020). The upper part of the Yaojie Formation consists of former deltaic-semi-deep lacustrine and develops dark-gray and gray–black siltstones, mudstones, and oil shales, interspersed with thin sandstones (Gong et al., 2014; Huo et al., 2020). The discovered natural gas, gas hydrate, coal bed methane, oil, and gas indications are mainly distributed in the Yaojie Formation.
The source rocks in the Muli Depression are mainly distributed in the Upper Triassic Galedesi Formation and the Middle Jurassic Yaojie Formation (Zou et al., 2016; Cheng et al., 2017). The TOC of the mudstones, carbonaceous mudstones, and coal seams in the Upper Triassic Galedesi Formation is greater than 1%. The average value of S2 is 3.76 mg/g, the average value of chloroform bitumen “A” is 0.89‰, and the organic matter consists of type III kerogen primarily, with a small amount of type II2 kerogen (Fan et al., 2020). The Ro values of kerogen show that the organic matter in the Galedesi Formation was formed at a mature to over-mature stage (Dai et al., 2017). The TOC of the source rocks from the Jurassic Yaojie Formation is greater than 2.0%; the S2 ranges from 0.42 mg/g to 202.12 mg/g, with an average value of 52.08 mg/g; and the average value of chloroform asphalt “A” is 5.66‰ (Fan et al., 2020). Types I, II, and III kerogen co-exist in Jurassic organic matter. The Ro values of kerogen range from 0.80% to 1.8%, showing that the source rocks of the Jurassic Yaojie Formation were formed at the mature to over-mature stage overall (Dai et al., 2017; Fan et al., 2020).
In September 2009, the China Geological Survey successfully obtained samples of gas hydrates in the Juhuqian Mining area of the Muli Depression (Zhu et al., 2010; Lu et al., 2010), which is another major breakthrough in China after the drilling of gas hydrates in the northern South China Sea in May 2007. Since then, many boreholes (DK-1 to DK-12, Figures 1B–D; 2) have been drilled, and samples of gas hydrates have been obtained in DK-1, DK-2, DK-3, DK-7, DK-8, DK-9, and DK-12 boreholes, and many OGIs have been observed (Lu et al., 2010; Tan et al., 2021). Gas hydrates and OGIs are mainly located in the Middle Jurassic Yaojie Formation, 130–500 m below the permafrost layer. The gas hydrates are hosted in the fractures and pores of siltstones, mudstones, and oil shales as thin layers, flakes, and agglomerates (Lu et al., 2013a; Cheng et al., 2017). Most of the OGIs are consistent with the depth and layer sections of the gas hydrates, indicating that OGIs are closely related to gas hydrates (Lu et al., 2013a; Cheng et al., 2017).
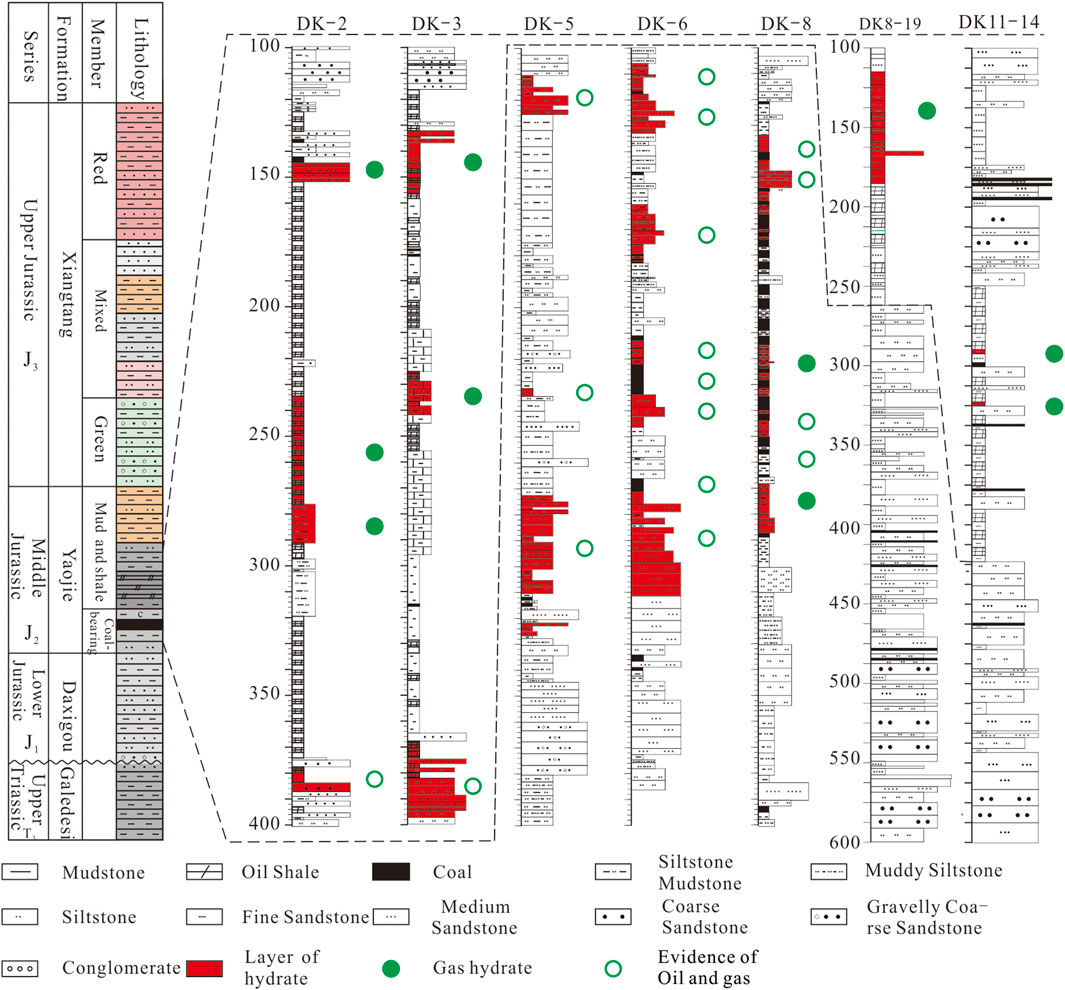
FIGURE 2. Distribution and stratification of gas hydrates in the Muli Depression.
Geochemical data on natural gases were collected from previous studies (Lu et al., 2010; Lu et al., 2015; Liu et al., 2012; He et al., 2015; Huang et al., 2016), and the natural gases were collected from coarse sandstones (n = 5), medium sandstones (n = 9), fine sandstones (n = 17), siltstones (n = 39), mudstones (n = 62), coal (n = 2), and oil shales (n = 53). A total of 190 molecular compositions and 174 methane, 77 ethane, and 43 propane carbon isotopes were collected from 11 boreholes. A large number of samples (n = 145) were free gases and desorbed gases from sandstones, mudstones, and shales. A few samples (n = 45) were collected from natural gases produced by gas hydrate decomposition. It is noteworthy that the free gases were obtained by different methods, such as drainage gas collection, mud degasification, and vacuum top-air method. In addition, the sub-surface depth of the gas samples varied from 55.3 to 487.3 m. Finally, we utilize molecular and isotopic gas data produced by two laboratories using various instruments, sample preparation techniques, standards, and practices regarding calibration and normalization of raw δ values over a period from 2009 to 2016. All of the carbon isotopes are within ±0.05‰ accuracy.
The molecular compositions from gas hydrates and free gases in the Muli Depression contain carbon dioxide, nitrogen, alkane gas (C1–C5), and heavy hydrocarbon gas. The carbon dioxide content ranges from 0.05% to 79.40%, with an average content of 5.62%. In DK1, DK2, DK3, DK8–19, and DK12–13, the CO2 content ranges from 2.16% to 6.28%, 0.11%–3.83%, 8.75%–16.03%, 0.73%–3.10%, and 0.12%–79.40%, respectively. Nitrogen was tested in some boreholes, and the content ranged from 0.23% to 76.76%, with an average of 7.62%. Alkane gas is the primary component of natural gas in all boreholes, and the content ranged from 16.50% to 99.90%, with an average of 90.80%. The drying coefficients of the alkane gas ranged from (C1/∑C1-5) 18.24%–99.84%, and most of the drying coefficients were concentrated in the range of 60%–99%, with an average of 82.58%. The samples where the drying coefficients of natural gas was greater than 95% account for approximately 40% and were mainly distributed in DK5, DK6, and DK8.
In DK8, the drying coefficient of alkane gas is more variable, ranging from 18.23% to 99.60%. In the rest of the boreholes, the drying coefficients were relatively concentrated between 60% and 98%. Ethane content ranged from 0.16% to 20.57% of alkane gas, primarily concentrating between 0.20% and 15%, with an average of 5.44%. Propane content ranged from 0.15% to 37.93%, primarily concentrating between 0.01% and 10%, with an average content of 6.70%. Butane (including n-butane and isobutane) content ranges from 0.01% to 29.57%, primarily concentrated between 0.01% and 10%, with an average 2.17%. The content of pentane (including n-pentane and isopentane) ranged from 0.01% to 15.81%, primarily concentrated between 0.01% and 5%, with an average of 0.88%. Overall, the results show a gradual decrease of each component with an increase in the carbon number in the majority of samples. Moreover, the molecular composition of some samples from DK1, DK2, DK3, DK8, DK8–19, DK10–17, DK11–14, DK12–13, and DK13–11 show the order of methane > ethane < propane.
The δ13C1 values of the alkane gas from gas hydrates and free gases range from -60.68‰ to -7.87‰, primarily in the range of-55‰ to -35‰; δ13C2 values range from -38.40‰ to -15.54‰, primarily in the range of -38‰ to -18‰, with an average value of -30.36‰; δ13C3 values range from -34.70% to -21.20‰, primarily in the range of -35‰ to -30‰, with an average value of -29.91‰; δ13nC4 values range from -32.10‰ to -26.40‰, primarily in the range of -31‰ to -28‰, with an average value of -31.94‰. The carbon isotope ranges of alkane gases decrease with increasing carbon number: 52.81, 22.86, 13.70, and 5.70‰ for methane, ethane, propane, and butane, respectively. Carbon isotopes of most alkane gases show reversal carbon isotope series between propane and butane (δ13C1<δ13C2<δ13C3>δ13C4), and only one sample shows reversal carbon isotope series between ethane and propane δ13C1<δ13C2>δ13C3 (Figure 3B).
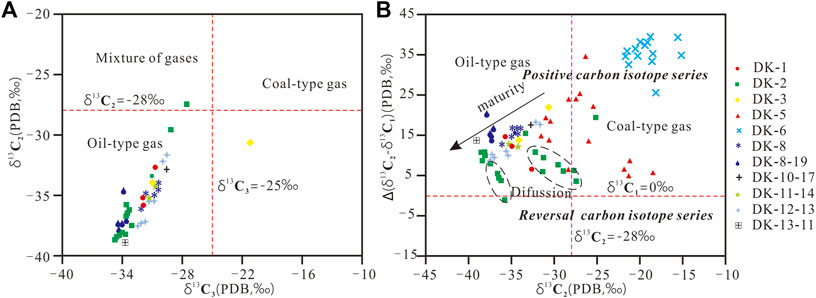
FIGURE 3. Relationship between δ13C2 vs. δ13C3 (A) and δ13C2 vs. Δ(δ13C2-δ13C1) (B) of alkane gas.
The genetic type of alkane gas can be identified by molecular composition and carbon isotope values (Pan et al., 2017; Wood and Hazra, 2017; Milkov and Etiope, 2018). Alkane gas can be classified into organic and inorganic types according to their generation mechanism. Organic alkane gas has positive carbon isotope series (δ13C1 < δ13C2 < δ13C3< δ13C4) or reversal carbon isotope series, while inorganic alkane gas usually has negative carbon isotope series (δ13C1 > δ13C2 > δ13C3> δ13C4) (Des Marais et al., 1981). Most of the alkane gases show reversal carbon isotopic series (δ13C1 < δ13C2 < δ13C3> δ13C4) in the Muli Depression, indicating that all alkane gases from the gas hydrates and free gases are of organic origin. In addition, δ13C1 values of the organic alkane gases were usually lighter than -30‰ (Dai and Qi, 1989). The δ13C1 values of most samples were lighter than -30‰ (Figures 4, 5), also indicating that the alkane gases from gas hydrates and free gases in the Muli Depression are organic in origin.
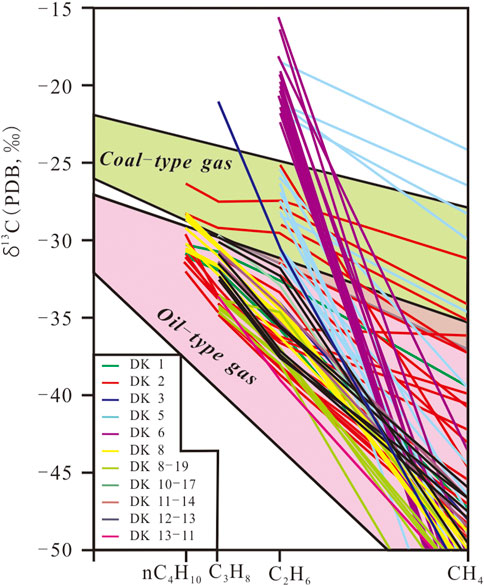
FIGURE 4. δ13Cn-1/n chart for identifying genetic types of natural gases.
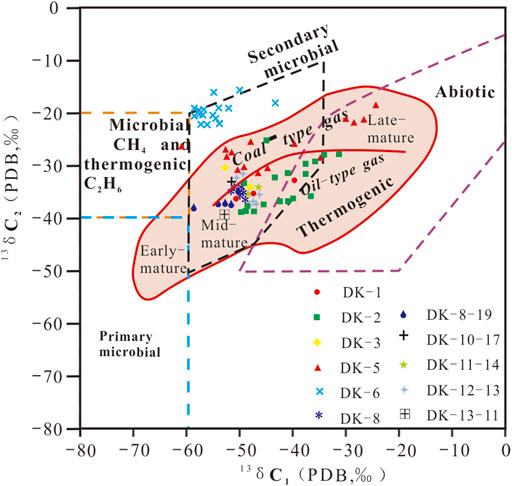
FIGURE 5. Genetic-type identification diagram of δ13C2 vs. δ13C1 for natural gases (After Milkov, 2021).
The diagram of δ13C1 vs. δ13C2 (Milkov, 2021) was used to distinguish thermogenic gas from microbial gas. Microbial gas mainly consists of methane depleted in δ13C (Whiticar, 1999; Strąpoć et al., 2011). On the contrary, the δ13C1 values of thermogenic gases are heavier than -50‰, except for the thermogenic gas that was generated during the very early mature stage, which may have δ13C1 values ranging from -55‰ to -73‰ (Milkov and Etiope, 2018). As shown in Figure 5, most of the alkane gases are distributed in the intersection of thermogenic gases and secondary biogenic gases. In addition, a small number of alkane gases from DK6 are distributed in the area of secondary biogenic gas (Figure 5), indicating that the natural gases in the Muli Depression are mainly thermogenic gases with biodegradation.
Thermogenic natural gas can be subdivided into coal-type gas and oil-type gas. In general, the δ13C value of coal-type gas is heavier than that of oil-type gas. The δ13C2 value can be used to distinguish coal-type gas from oil-type gas (Dai and Qi, 1989; Liu et al., 2019). The empirical value of -28‰ is usually the discriminant value (δ13C2 < -28‰ indicates oil-type gas, and δ13C2 > -28‰ indicates coal-type gas) (Dai and Qi, 1989; Liu et al., 2019). In the Δ(δ13C2–δ13C1) vs. δ13C2 diagram (Figure 3B), most of the natural gases show δ13C2 < -28‰, and a few samples show δ13C2 > -28‰ from DK5 and DK6, indicating that alkane gases are mainly oil-type gases, with a little coal-type gas in DK5 and DK6.
Carbon isotopes of ethane and propane are generally inherited from the original organic matter and can effectively identify coal-type gases and oil-type gases (Dai et al., 2005; Milkov, 2021). The δ13C2 and δ13C3 values of natural gases -28‰ and -25‰ are commonly used to distinguish between oil-type gases and coal-type gases, respectively (Liu et al., 2019). The carbon isotopes of ethane and propane from natural gases without secondary alteration are linearly correlated (Faber et al., 2015). The carbon isotopes of most alkane gases are linearly positively correlated between ethane and propane (Figure 3A), indicating no significant secondary alteration in ethane and propane of the natural gases. It is presumed that ethane and propane have the same origin. In addition, most samples fall into the oil-type gas area, and one sample from DK2 falls into the mixed gas area (Figure 3A), indicating that the natural gases are mainly oil-type gases. On the δ13Cn-1/n diagram (Figure 4), most samples fall into the oil-type gas area, with a few samples in the coal-type gas area, also suggesting that the natural gases are mainly oil-type gases with a few coal-type gases. Moreover, the methane carbon isotopes of other samples from the DK5 are located in the coal-type gas area, and the ethane carbon isotopes are located above the coal-formed gas (Figure 4), indicating a coal-type gas with high thermal maturity. The methane carbon isotopes of natural gases fall into the oil-type gas area, and the ethane carbon isotopes fall above the coal-type gas from the DK6 borehole, indicating that a secondary alteration occurred with these natural gases. Combining the results from Figure 3, we can infer that the natural gases in the Muli Depression are oil-type gases with a few coal-type gases. In the δ13C2 vs. δ13C1 diagram (Figure 5), most of the alkane gases are located in the oil-type gases, and other natural gases from DK5 are located in the coal-type gas area, with a few samples in the secondary biogenic gas area, indicating that the alkane gases are mainly the oil-type gases, with a small amount of coal-type gases and secondary biogenic gases.
Hydrocarbons have different resistance to microbial degradation, depending on the molecular structure. In general, n-alkanes are preferentially biodegraded, followed by branched alkanes and non-alkanes (Peters et al., 2005). The susceptibility of alkanes to biodegradation follows the order C3≈nC4>nC5>iC5 > iC4>> neoC5 (Boreham et al., 2001; Boreham et al., 2008; Meng et al., 2017). Ethane is difficult to biodegrade due to the lack of branched-chain carbon atoms in the structure. Methane is difficult to be oxidized anerobically by microorganisms, and bacterial oxidation leads to elevated methane content in natural gas (Head et al., 2003). Therefore, ratios of branched to straight-chain alkanes are used to identify biodegradation (Pallasser, 2000; Larter and di Primio, 2005). Biodegradation can lead to a deficit in propane content and δ13C1, with enrichment in methane content and δ13C3. The samples from DK5, DK6, and DK8 have very low C3/∑C1-3 ratios (mostly less than 0.1%) and a positive correlation between propane content and methane carbon isotopes (Figure 6), showing that biodegradation occurred in these natural gases. Only a small part of the natural gases shows a negative correlation between propane content and methane carbon isotopes, exhibiting an increase in thermal maturity. As shown in Figure 5, most of the samples are distributed at the intersection area of secondary microbial gases and thermogenic gases, with a few samples found entirely in the area of secondary microbial gases, further suggesting that biodegradation of natural gases has occurred in the Muli Depression.
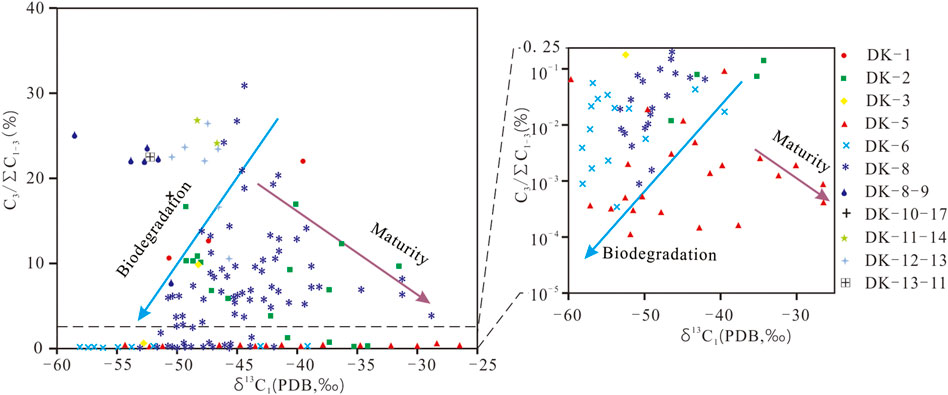
FIGURE 6. Diagrams of gas dryness (C1/∑C1–3) vs. δ13C1 of alkane gases.
Prinzhofer and Huc (1995) proposed a diagram of Δ(δ13C1-δ113C2) vs. Ln (C1/C2) to distinguish diffusion and biodegradation (Figure 7). The values of Δ(δ13C1-δ113C2) decrease, and the values of Ln (C1/C2) increase with biodegraded natural gases. In contrast, the values of Ln (C1/C2) and Δ(δ13C1-δ113C2) increase with thermal maturity for non-biodegraded natural gases. The values of Δ(δ13C1-δ113C2) are decreasing with the Ln (C1/C2) values from DK5, DK6, and DK8, showing a trend of biodegradation. Preferential degradation of n-butane leads to an increase in the iC4/nC4 ratio. In Figure 8, the iC4/nC4 ratios from a large portion of the natural gases are greater than 0.8, and iC4/n-C4 ratios increase as the carbon isotope of methane becomes lighter, which further confirms that biodegradation occurred in most natural gases. Therefore, pieces of evidence show that alkane gases in the Muli Depression underwent biodegradation.
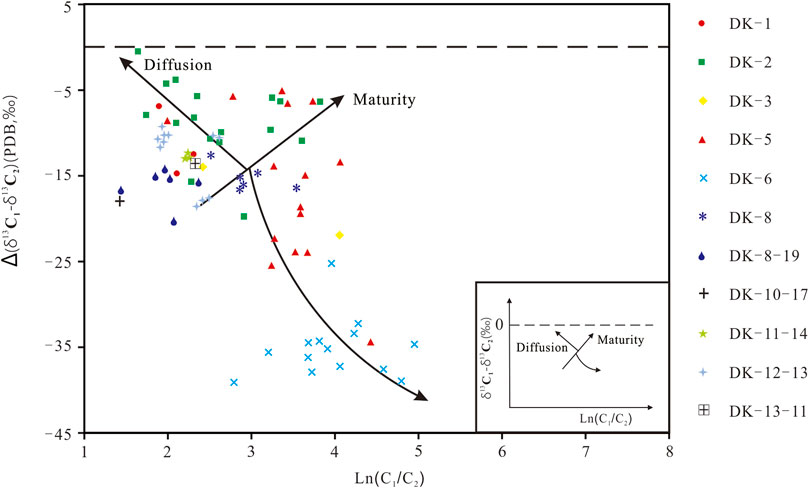
FIGURE 7. Discrimination diagram of alkane gas diffusion and biodegradation (After Prinzhofer and Huc, 1995).
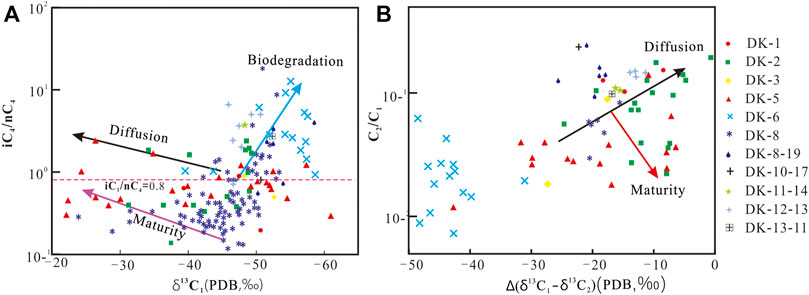
FIGURE 8. Diagrams of iC4/nC4 vs. δ13C1 (A) and C2/C1 vs. Δ(δ13C1-δ113C2) (B) for natural gases.
Expulsion of natural gases from source rocks leads to isotopic fractionation and changes in chemical composition, which is negligible for the study of genetic type and gas sources (Schoell, 1988; Lorant et al., 1998). Natural gas is characterized by small molecular size, light weight, and high diffusion coefficient, and the diffusivity of alkane gases decreases with increasing molecular weight, which follows the order of C1 > C2 > C3 (Krooss et al., 1986). The methane carbon isotopes of alkane gases with diffusion will become heavier and also show an increase in the C2/C1 ratio exponentially. In contrast, alkane gas without diffusion shows a decrease in the C2/C1 ratio and heavier carbon and hydrogen isotopes of methane (Zhang and Krooss, 2001; Liu et al., 2019).
The molecular composition responds significantly to the diffusion of natural gases. In general, the molecular composition of the gas without diffusion decreases with carbon number. With diffusion, the relative content of methane and ethane decreases and the relative content of propane increases. The molecular composition of some samples from DK1, DK2, DK3, DK8, DK8-19, DK10-17, DK11–14, DK12–13, and DK13–11shows an order of methane > ethane < propane. The order can be reasonably explained by the relative enrichment of propane due to diffusion.
The diffusion coefficients of iso-alkane are larger than those of n-alkanes with the same carbon number due to their low boiling points, high saturation vapor pressures, and smaller intermolecular forces (Ye, et al., 2017). Therefore, iC4 and iC5 have a more intense diffusion capacity than nC4 and nC5, respectively. The iC4/nC4 value may increase with diffusion. In Figure 8A, some ratios of iC4/nC4 are greater than 0.8, and iC4/nC4 ratios increase with a heavier methane carbon isotope, further indicating that diffusion has occurred. In contrast, iC4/nC4 ratios in DK8-19, 11–14, and 12–13 increase with a lighter methane carbon isotope (Figure 8A), showing biodegradation. It is contrary to the results reflected in Figure 8B. This may be due to the fact that biodegradation leads to a sharp, lighter carbon isotope of methane, while diffusion leads to only a slightly heavier carbon isotope of methane. Those natural gases that were both biodegraded and diffused also show the trends of biodegraded natural gas in iC4/nC4 ratios and methane carbon isotopes.
Prinzhofer and Huc (1995) established diffusion using the ratio of the C1/C2 and Δ(δ13C1-δ113C2) value. As shown in Figure 7, natural gas with diffusion shows a heavier carbon isotope of methane and a decrease in the C1/C2 ratio. Natural gas shows an increase in the C1/C2 ratio and a heavier Δ(δ13C1-δ13C2) with thermal maturity. In Figure 7, the negative correlation between the Ln (C1/C2) values and Δ(δ13C1-δ13C2) values in DK2, DK11–14, DK12–13, and DK13–11confirms that diffusion has occurred in these boreholes. With the diffusion of alkane gases, the ethane carbon isotope values increase with decreasing Δ(δ13C2-δ13C1) values (Liu et al., 2019). As shown in Figure 3B, the δ13C2 values increase with decreasing Δ(δ13C2-δ13C1) values of alkane gases from DK2 and DK5, further proving the presence of diffusion in these two boreholes. Therefore, multiple lines of evidence from molecular composition and carbon isotopes show that the diffusion of natural gases occurred in the Muli Depression.
The conventional theory considers two pathways for the generation of natural gas: natural gas generated directly by kerogen (primary cracking) and oil cracking (secondary cracking) (Tissot and Welte, 1984). Different genetic types and thermal maturity can produce different hydrocarbon generation pathways. The product of humic organic matter cracking is natural gas with small amounts of crude oil (Stahl and Carey, 1975; Lorant et al., 1998; Behar et al., 2008). Before generating liquid hydrocarbons as the primary product, the sapropelic organic matter can produce a small amount of natural gas by kerogen directly. Thus, sapropelic organic matter can produce oil-type gas through two primary pathways: direct cracking gas from kerogen and oil cracking gas from the thermal cracking of crude oil. For natural gas without biodegradation, the relative propane content and Δ(δ13C2-δ13C3) decrease with thermal maturity. Lorant et al. (1998) proposed the Δ(δ13C2-δ13C3) vs. C2/C3 diagram to distinguish primary cracking and secondary cracking (Figure 9). At lower thermal maturity (Ro<1.1%), the Δ(δ13C2-δ13C3) values of natural gas are heavier and the C2/C3 values are smaller, and a large number of wet gases are generated by direct degradation of kerogen. As the thermal maturity increases, the crude oil and wet gas are continuously cracked to generate dry gas. Biodegradation can lead to lighter Δ (δ13C2-δ13C3) and higher C2/C3 values, resulting in a higher thermal maturity inferred from the Δ(δ13C2-δ13C3) vs. C2/C3 diagram. Most of the natural gases fall into the area of primary cracking (Figure 9), indicating that natural gas is a product of kerogen cracking at most.
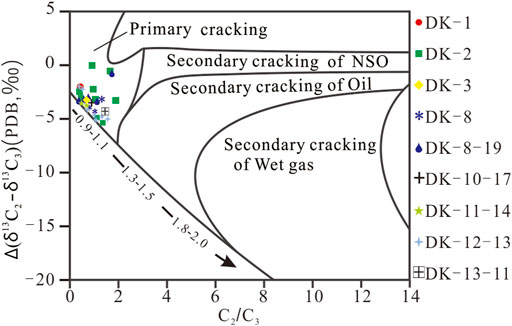
FIGURE 9. Diagram showing C2/C3 vs. δ13C2-δ13C3 for the identification of kerogen-cracking gas and oil cracking gas at different thermal evolution stages (Modified after Lorant et al., 1998). Note: NSO–nitrogen, sulfur, and oxygen compounds.
In Figures 6, 7, non-biodegraded gas was screened out, and the relationship (δ13C1 = 22.42lgRo-34.8 (Ro > 0.9)) between δ13C1 and thermal maturity of coal-type gas was used to calculate the Ro value (Liu and Xu, 1999). According to the calculations, thermal maturity of the coal-type gases in the Muli Depression can be classified into two intervals: 1) Ro values of natural gases in DK2 range from 0.9 to 1.2%, representative of the mature stage; 2) Ro values of natural gases in DK5 range from 1.2 to 1.75%, representative of the high mature stage. For oil-type gases without biodegradation, Ro values of the natural gases were calculated based on the relationship between the δ13C1 value and the Ro value of oil-type gases (δ13C1 = 15.8logRo-42.2) (Dai and Qi, 1989). The results show that Ro values of a large amount of samples range from 0.6 to 1.2%, which is consistent with the thermal maturity of coal-type gases in the DK2. The Ro values of the alkane gases from humic kerogen in DK5 and DK6 are higher than 1.2%. At this stage, the methane would derive from secondary cracking of wet gases.
In Figure 5, most of the natural gases are distributed in the area of the mature stage, with a small number of natural gases from DK5 in the area of the high mature stage. Considering the effect of biodegradation on the methane carbon isotopes of the natural gases from DK6, this would lead to a low assessment of its thermal maturity. The natural gases from DK6 are coal-type gases, and the ethane carbon isotopes are close to those from DK5, indicating that the natural gases from DK6 are also a product at the high maturity stage.
At the relatively low thermal maturity stage (Ro% < 1.3%), methane and carbon dioxide are generated from the degradation of kerogen, and more carbon dioxide is generated from humic kerogen than sapropelic kerogen (Figure 10). At this stage, crude oil is cracked, and the δ13C value of natural gas increases with thermal maturity. Carbon isotope values of methane are lighter than those of ethane (Clayton, 1998; Liu et al., 2018), and the natural gas is mostly wet gas (Wu et al., 2016). With the increase of thermal maturity (Ro% = 1.3–2.0%), the thermal decomposition of organic matter forms an amount of nitrogen, and liquid hydrocarbons begin to crack. Moreover, a large amount of oil-cracking gas becomes the main component of natural gas. Furthermore, the δ13C2 values of natural gas become lighter with thermal maturity (Clayton, 1998; Zumberge et al., 2012; Tilley and Muehlenbachs, 2013), and the carbon isotope reversal probably occurs (Zumberge et al., 2012; Tilley and Muehlenbachs, 2013), and the natural gas mostly is wet gas. With further increase in thermal maturity (RO% = 2.0–3.5%), the liquid hydrocarbons are almost completely cracked, and the wet gas starts to crack further, resulting in a partial or complete reversal trend of the carbon isotopes (δ13C1 > δ13C2). In this situation, the produced natural gas is dry gas.
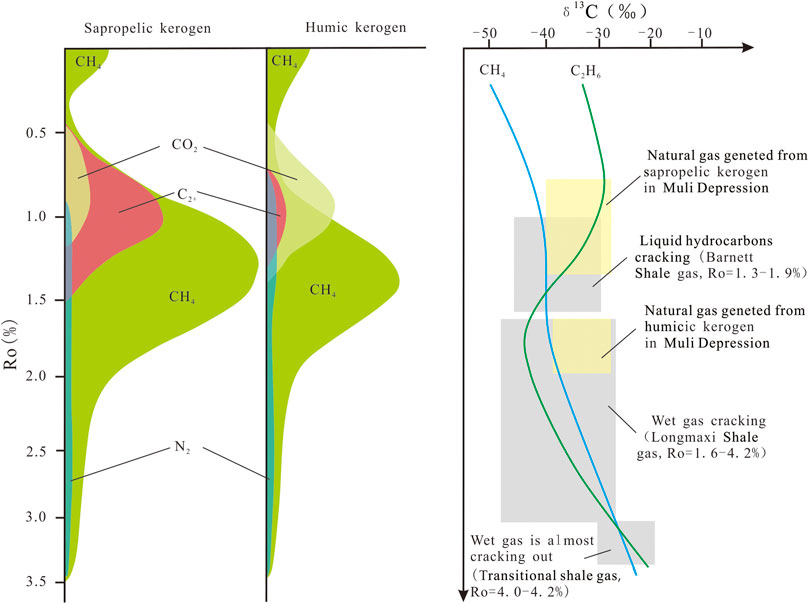
FIGURE 10. Sketch map of geochemical patterns for natural gases (After Clayton, 1998).
Most of the natural gases in the Muli Depression have the following characteristics: 1) they contain small amounts of carbon dioxide and nitrogen, and the alkane gas is wet gas; 2) the carbon isotope values of methane are lighter than those of ethane, and the ethane carbon isotope decreases with thermal maturity (Figure 3B); 3) the δ13C2 values range from -40‰ to -28‰, close to δ13C2 values of the mature to high-maturity stage. These pieces of evidence indicate that the natural gases are mainly derived from the sapropelic kerogen and crude oil cracking. The Ro values of coal-type gases in the Muli Depression exceed 1.3%, indicating an over-maturity stage. At this stage, the humic kerogen can generate a large amount of dry gases by secondary cracking of wet gases. Therefore, it is inferred that coal-type gas is the product of wet gas cracking gas. In summary, multiple lines of evidence suggest that the oil-type gas is the production of primary cracking gas and secondary cracking of oil at the thermal maturity stage by sapropelic kerogen, and the coal-type gas is the production of secondary cracking of wet gas generated by humic kerogen at the high maturity stage.
Prospects for light oil and condensate resources are governed by abundance, genetic type, maturity, and hydrocarbon expulsion efficiency of the organic matter (Peng and Jia, 2021). Generally, Type I and II kerogens can generate light oil and condensate gases at the high thermal maturity stage (Ro = 1.3–1.9%). Moreover, type I kerogen is more likely to form a condensate than type II kerogen because of its higher hydrocarbon expulsion efficiency. In addition, for the same genetic-type source rocks, samples with high organic carbon content also have higher hydrocarbon removal efficiency (Zhang et al., 2006). The oil and gas that have been discovered in the SQB indicate that the petroleum’s basic conditions for forming oil and gas reservoirs are in existence, providing petroleum systems for the generation of light oil and condensate. Moreover, the lacustrine mudstones and shales, widely developed in the Lower Jurassic period, are mostly type I and II kerogens with high organic matter abundance (TOC greater than 2.0%), also suggesting high generation potential and expulsion efficiency of hydrocarbon. Jurassic source rocks in the mature to over-mature stage have the thermal maturity to form light oil and condensate. As discussed previously, Jurassic natural gas is a predominantly oil-type gas of the mature to over-mature stage, which is consistent with the geological conditions for the generation of light oil and condensate. Therefore, the evidences from genetic types, thermal maturity, and OGIs related to natural gas show the existence of light oil and condensate in the Jurassic Yaojie Formation.
1) The natural gas in the Muli Depression of the SQB is mainly oil-type gas, with a small amount of coal-type gas.
2) The natural gases have undergone secondary alteration (biodegradation and diffusion). Biodegradation results in lighter carbon isotopes and a relative increase in the molecular content of methane in the alkane gases. The diffusion leads to heavier carbon isotopes and a relative decrease in the molecular content of methane.
3) Most of the natural gases were generated from sapropelic kerogen directly and crude oil cracking to wet gas, with a small number of natural gases from DK5 and DK6 derived from wet gas cracking gas.
4) Light oil and condensate may exist in the Jurassic strata of the Muli Depression.
The original contributions presented in the study are included in the article/Supplementary Material; further inquiries can be directed to the corresponding authors.
FT: data curation, validation, and writing—original draft. YL: conceptualization, supervision, funding acquisition, and writing—review and editing. ZX: investigation. XB: data curation. FD: formal analysis. SL: investigation. PL: data curation. JW: supervision, methodology, and writing—review and editing.
This research was financially supported by the National Natural Science Foundation of China (41702144; 42172230) and State Key Laboratory of Organic Geochemistry, GIGCAS (SKLOG-201908).
The authors declare that the research was conducted in the absence of any commercial or financial relationships that could be construed as a potential conflict of interest.
All claims expressed in this article are solely those of the authors and do not necessarily represent those of their affiliated organizations, or those of the publisher, the editors, and the reviewers. Any product that may be evaluated in this article, or claim that may be made by its manufacturer, is not guaranteed or endorsed by the publisher.
The authors are grateful to Editor Shuang Yu and three reviewers for constructive comments and suggestions.
Behar, F., Lorant, F., and Lewan, M. (2008). Role of NSO Compounds during Primary Cracking of a Type II Kerogen and a Type III Lignite. Org. Geochem. 39, 1–22. doi:10.1016/j.orggeochem.2007.10.007
Boreham, C. J., Edwards, D. S., Hope, J. M., Chen, J., and Hong, Z. (2008). Carbon and Hydrogen Isotopes of Neo-Pentane for Biodegraded Natural Gas Correlation. Org. Geochem. 39 (10), 1483–1486. doi:10.1016/j.orggeochem.2008.06.010
Boreham, C. J., Hope, J. M., and Hartung-Kagi, B. (2001). Understanding Source, Distribution and Preservation of Australian Natural Gas: a Geochemical Perspective. APPEA J. 41 (1), 523–547. doi:10.1071/aj00026
Cao, D. Y., Wang, D., Li, J., and Dou, X. Q. (2012). Gas Source Analysis of Natural Gas Hydrate of Muli Coalfield in Qilian Mountain Permafrost, Qinghai Province, China. J. China Coal Soc. 37 (8), 1365–1368. doi:10.13225/.cnki.jccs.2012.08.002
Chen, D., Pang, X., Yan, Q., Liu, Y., Mou, J., and Lv, C. (2017). Geochemical and Stable Carbon Isotope Composition Variations of Natural Gases in Tight Sandstones from the West Sichuan Basin, China. Geol. J. 52, 1020–1031. doi:10.1002/gj.2867
Cheng, Q. S., Gong, J. M., Zhang, M., Wang, W. C., Cheng, W. J., Jiang, Y. B., et al. (2016). Geochemical Characteristics of Hydrocarbon Source Rocks in the Qilian Mountain Permafrost and Gas Sources for Gas Hydrate. Mar. Geol. Quat. Geol. 36 (5), 139–147. doi:10.16562/j.cnki.0256-1492.2016.05.014
Cheng, B., Xu, J. B., Lu, Z. Q., Li, Y. H., Wang, W. C., Yang, S., et al. (2017). Hydrocarbon Source for Oil and Gas Indication Associated with Gas Hydrate and its Significance in the Qilian Mountain Permafrost, Qinghai, Northwest China. Mar. Petroleum Geol. 89, 202–215. doi:10.1016/j.marpetgeo.2017.02.019
Chung, H. M., Gormly, J. R., and Squires, R. M. (1988). Origin of Gaseous Hydrocarbons in Subsurface Environments: Theoretical Considerations of Carbon Isotope Distribution. Chem. Geol. 71, 97–103. doi:10.1016/0009-2541(88)90108-8
Clayton, J. L. (1998). Geochemistry of Coalbed Gas - A Review. Int. J. Coal Geol. 35, 159–173. doi:10.1016/s0166-5162(97)00017-7
Dai, J. X., and Qi, H. F. (1989). Relationship of δ13C-Ro of Coal-Formed Gas in China. China Sci. Bull. 34, 690–692. doi:10.1360/csb1989-34-9-690
Dai, J. X., Qin, S. F., Tao, S. Z., Zhu, G. Y., and Mi, J. K. (2005). Developing Trends of Natural Gas Industry and the Significant Progress on Natural Gas Geological Theories in China. Nat. Gas. Geosci. 16 (2), 127–142. doi:10.1371/journal.pone.0123968
Dai, J. X., Ni, Y. Y., Huang, S. P., Peng, W. L., Han, W. X., Gong, D. Y., et al. (2017). Genetic Types of Gas Hydrates in China. Petroleum Explor. Dev. 44 (6), 837–848. doi:10.1016/s1876-3804(17)30101-5
Des Marais, D. J., Donchin, J. H., Nehring, N. L., and Truesdell, A. H. (1981). Molecular Carbon Isotopic Evidence for the Origin of Geothermal Hydrocarbons. Nature 292, 826–828. doi:10.1038/292826a0
Faber, E., Schmidt, M., and Feyzullayev, A. A. (2015). Geochemical Hydrocarbon Exploration-Insights from Stable Isotope Models. Oil Gas. Eur. Mag. 2015 (2), 93–98.
Fan, D. W., Lu, Z. Q., Li, G. Z., and &Xiao, R. (2020). Organic Geochemical Characteristics of the Carboniferous-Jurassic Potential Source Rocks for Natural Gas Hydrates in the Muli Depression, Southern Qilian Basin. Oil Gas Geol. 41 (2), 348–358. doi:10.11743/ogg20200211
Gong, W. Q., Zhang, Y. S., Song, T. R., Zeng, Y. T., and Guo, S. B. (2014). The Evaluation of the Hydrocarbon Generation Potential of Source Rocks in Muli Depression of Southern Qilian Basin. Geol. China 41 (1), 215–221.
He, X. L., Liu, C. L., Meng, Q. G., Lu, Z. Q., Wen, H. J., Li, Y. H., et al. (2015). Gas Composition of Hydrate-Bearing Cores in Juhugeng Drilling Area in Qinghai and its Indicative Significance. Geoscience 29 (5), 1194–1200. (in Chinese with English abstract).
Head, I. M., Jones, D. M., and Larter, S. R. (2003). Biological Activity in the Deep Subsurface and the Origin of Heavy Oil. Nature 426, 344–352. doi:10.1038/nature02134
Huang, R. H. (1996). Geo-tectionic Evolution and its Characteristics in Qilianshan Region. Geotectionica Metallogenia 20 (2), 95–104.
Huang, X., Liu, H., Zhang, J. Z., Wang, P. K., Xiao, R., Pang, S. J., et al. (2016). Genetic Type and its Significance of Hydrocarbon Gases from Permafrost-Associated Gas Hydrate in Qilian Mountain. Chin. J. Geol. 51 (3), 934–945. doi:10.12017/dzkx.2016.039
Huo, T., Liu, S. M., Qi, W. Q., Zhu, K. J., Wang, J. X., and Tan, F. R. (2020). Geochemistry Characteristics and Indicative Significance of Rare Earth Elements in Coal from Juhugeng Coal District, the Muli Coalfield in Qinghai Province. Geol. Bull. China 39 (7), 995–1005.
Krooss, B. M., Leythaeuser, D., and Schaefer, R. G. (1986). Experimental Determination of Diffusion Parameters for Light Hydrocarbons in Water-Saturated Rocks: Some Selected Results. Org. Geochem. 10, 291–297. doi:10.1016/0146-6380(86)90030-6
Larter, S., and di Primio, R. (2005). Effects of Biodegradation on Oil and Gas Field PVT Properties and the Origin of Oil Rimmed Gas Accumulations. Org. Geochem. 36, 299–310. doi:10.1016/j.orggeochem.2004.07.015
Li, D., Chen, Y., Zhou, J., Kang, H., and Hou, K. (2020). Continuity of the Western Qinling and Qaidam‐Qilian Blocks: Evidence from Precambrian and Permian-Triassic Strata Around the Gonghe Basin Area, NW China. Geol. J. 55, 3601–3614. doi:10.1002/gj.3610
Liu, C. L., He, X. L., Meng, Q. G., Ye, Y. G., Zhu, Y. H., and Lu, Z. Q. (2012). Carbon and Hydrogen Isotopic Compositions Characteristics of the Released Gas from Natural Gas Hydrates in the Qilian Mountain Permafrost. Rock Mineral Analysis 31 (3), 489–494. doi:10.15898/j.cnki.11-2131/td.2012.03.003
Liu, Q., Wu, X., Wang, X., Jin, Z., Zhu, D., Meng, Q., et al. (2019). Carbon and Hydrogen Isotopes of Methane, Ethane, and Propane: a Review of Genetic Identification of Natural Gas. Earth-Science Rev. 190, 247–272. doi:10.1016/j.earscirev.2018.11.017
Liu, Y., Tang, X., Zhang, J., Mo, X., Huang, H., and Liu, Z. (2018). Geochemical Characteristics of the Extremely High Thermal Maturity Transitional Shale Gas in the Southern North China Basin (SNCB) and its Differences with Marine Shale Gas. Int. J. Coal Geol. 194, 33–44. doi:10.1016/j.coal.2018.05.005
Liu, S., Tang, S., Tan, F., Zhao, C., Li, Y., Wang, S., et al. (2020). Pore Structure Characteristics and Hydrocarbon Generation Potential of Middle Jurassic Lacustrine Source Rocks in the Yuka Depression, Qaidam Basin, NW China: Implications from Petrographic and Organic Geochemical Analyses. J. Nat. Gas Sci. Eng. 81, 103481. doi:10.1016/j.jngse.2020.103481
Liu, S. M., Liu, B. J., Tang, S. H., Zhao, C. L., Tan, F. R., Xi, Z. D., et al. (2022). Palaeoenvironmental and Tectonic Controls on Organic Matter Enrichment in the Middle Jurassic Dameigou Formation (Qaidam Basin, North China). Palaeogeogr. Palaeoclimatol. Palaeoecol. 585, 110747. doi:10.1016/j.palaeo.2021.110747
Liu, S. M., Tan, F. R., Huo, T., Tang, S. H., Zhao, W. X., and Chao, H. D. (2019). Origin of the Hydrate Bound Gases in the Juhugeng Sag, Muli Basin, Tibetan Plateau. Int. J. Coal Sci. Technol. 7 (9), 1–15. doi:10.1007/s40789-019-00283-2
Liu, W. H., and Xu, Y. C. (1999). A Two-Stage Modal of Carbon Isotope Fractionation in Coal Gas. Geochemica 28 (4), 359–366.
Lorant, F., Prinzhofer, A., Behar, F., and Huc, A.-Y. (1998). Carbon Isotopic and Molecular Constraints on the Formation and the Expulsion of Thermogenic Hydrocarbon Gases. Chem. Geol. 147, 249–264. doi:10.1016/s0009-2541(98)00017-5
Lu, Z., Zhu, Y. H., Zhang, Y. Q., Wen, H. J., Li, Y. H., Jia, Z. Y., et al. (2010). Study on Genesis of Gases from Gas Hydrate in the Qilian Mountain Permafrost, Qinghai. Geoscience 24 (3), 581–588. doi:10.1016/S1876-3804(11)60008-6
Lu, Z. Q., Zhu, Y. H., Liu, H., Zhang, Y. Q., Wang, P. K., and Huang, X. (2013a). Oil and Gas Indications at Gas Hydrate-Bearing Intervals in the Qilian Mountain Permafrost. Geoscience 27 (1), 231–238.
Lu, Z. Q., Zhu, Y. H., Zhang, Y. Q., Liu, H., and Wang, T. (2013b). Gas Source Conditions for Gas Hydrate in Qilian Mountain Permafrost of Qinghai and Their Implications. Mineral. Deposits 32 (5), 1035–1044. doi:10.16111/j.0258-7106.2013.05.015
Lu, Z., Rao, Z., He, J., Zhu, Y., Zhang, Y., Liu, H., et al. (2015). Geochemistry of Drill Core Headspace Gases and its Significance in Gas Hydrate Drilling in Qilian Mountain Permafrost. J. Asian Earth Sci. 98, 126–140. doi:10.1016/j.jseaes.2014.10.009
Meng, Q., Wang, X., Wang, X., Shi, B., Luo, X., Zhang, L., et al. (2017). Gas Geochemical Evidences for Biodegradation of Shale Gases in the Upper Triassic Yanchang Formation, Ordos Basin, China. Int. J. Coal Geol. 179, 139–152. doi:10.1016/j.coal.2017.05.018
Milkov, A. V., and Etiope, G. (2018). Revised Genetic Diagrams for Natural Gases Based on a Global Dataset of >20,000 Samples. Org. Geochem. 125, 109–120. doi:10.1016/j.orggeochem.2018.09.002
Milkov, A. V. (2021). New Approaches to Distinguish Shale-Sourced and Coal-Sourced Gases in Petroleum Systems. Org. Geochem. 158 (4), 1–14. doi:10.1016/j.orggeochem.2021.104271
Pallasser, R. J. (2000). Recognising Biodegradation in Gas/oil Accumulations through the δ 13 C Compositions of Gas Components. Org. Geochem. 31, 1363–1373. doi:10.1016/s0146-6380(00)00101-7
Pan, Y., Yu, B., Zhang, B., and Zhu, G. (2017). Origins and Differences in Condensate Gas Reservoirs between East and West of Tazhong Uplift in the Ordovician Tarim Basin, NW China. J. Earth Sci. 28 (2), 367–380. doi:10.1007/s12583-015-0582-3
Peng, P. A., and Jia, C. Z. (2021). Evolution of Deep Source Rock and Resource Potential of Primary Light Oil and Condensate. Acta Pet. Sin. 42 (12), 1543–1555.
Peters, K. E., Walters, C. C., and Moldowan, J. M. (2005). The Biomarker Guide. Cambridge University Press.
Prinzhofer, A. A., and Huc, A. Y. (1995). Genetic and Post-genetic Molecular and Isotopic Fractionations in Natural Gases. Chem. Geol. 126 (3-4), 281–290. doi:10.1016/0009-2541(95)00123-9
Schoell, M. (1988). Multiple Origins of Methane in the Earth. Chem. Geol. 71, 1–10. doi:10.1016/0009-2541(88)90101-5
Stahl, W. J., and Carey, B. D. (1975). Source-rock Identification by Isotope Analyses of Natural Gases from Fields in the Val Verde and Delaware Basins, West Texas. Chem. Geol. 16, 257–267. doi:10.1016/0009-2541(75)90065-0
Strąpoć, D., Mastalerz, M., Dawson, K., Macalady, J., Callaghan, A. V., Wawrik, B., et al. (2011). Biogeochemistry of Microbial Coal-Bed Methane. Annu. Rev. Earth Planet. Sci. 39 (39), 617–656. doi:10.1146/annurev-earth-040610-133343
Tan, F. R., Liu, S. M., Cui, W. X., Wan, Y. Q., Yang, C., Zhang, G. C., et al. (2017). Origin of Gas Hydrate in the Juhugeng Mining Area of Muli Coalfield. Acta Geol. Sin. 91 (5), 1158–1167. doi:10.1111/1755-6724.13435
Tan, F., Li, Y., Du, F., Liu, S., Cui, W., Liu, Z., et al. (2021). Origin of the Gas Hydrate and Free Gas in the Qilian Permafrost, Northwest China: Evidence from Molecular Composition and Carbon Isotopes. Acta Geol. Sin. ‐ Engl. Ed. 95 (2), 602–616. doi:10.1111/1755-6724.14650
Tilley, B., and Muehlenbachs, K. (2013). Isotope Reversals and Universal Stages and Trends of Gas Maturation in Sealed, Self-Contained Petroleum Systems. Chem. Geol. 339, 194–204. doi:10.1016/j.chemgeo.2012.08.002
Tissot, B. P., and Welte, D. H. (1984). Petroleum Formation and Occurrence. second ed.. Berlin, Heidelberg, New York, Tokyo: Springer-Verlag.
Wang, T., Liu, T., Shao, L. Y., Cao, D. Y., Guo, J. N., Liu, Y. F., et al. (2009). Characteristics and Origins of the Gas Hydrates in the Muli Coalfield of Qinghai. Coal Geol. Explor. 37 (6), 26–30. doi:10.3969/j.issn.1001-1986.2009.06.007
Whiticar, M. J. (1999). Carbon and Hydrogen Isotope Systematics of Bacterial Formation and Oxidation of Methane. Chem. Geol. 161 (1), 291–314. doi:10.1016/s0009-2541(99)00092-3
Wood, D. A., and Hazra, B. (2017). Characterization of Organic-Rich Shales for Petroleum Exploration & Exploitation: a Review-Part 2: Geochemistry, Thermal Maturity, Isotopes and Biomarkers. J. Earth Sci. 28 (5), 758–778. doi:10.1007/s12583-017-0733-9
Wu, W., Luo, C., Zhang, J., and Liu, W. P. (2016). Evolution Law and Genesis of Ethane Carbon Isotope of Oil Type Gas. Acta Pet. Sin. 37 (12), 1463–1471. doi:10.7623/syxb201612002
Xiao, A. C., Xiong Gy, Yu. L., Zhang, J. Y., Zhang, Y. X., Wu, L., Zhao, H. F., et al. (2021). Triassic Retroarc Foreland Basin in Southern Qilian Area: Evidence from Sedimentary Filling and Tectonics. Acta Petrol. Sin. 37 (8), 2385–2400. doi:10.18654/1000-0569/2021.08.08
Ye, S., Zhu, H., Li, R., Yang, Y., and Li, Q. (2017). Tracing Natural Gas Migration by Integrating Organic and Inorganic Geochemical Data: a Case Study of the Jurassic Gas Fields in Western Sichuan Basin, SW China. Petroleum Explor. Dev. 44 (4), 582–594. doi:10.1016/s1876-3804(17)30067-8
Yin, A., Dang, Y. Q., Wang, L. C., Jiang, W. M., Zhou, S. P., Chen, X. H., et al. (2008). Cenozoic Tectonic Evolution of Qaidam Basin and its Surrounding Regions (Part 1): the Southern Qilian Shan-nan Shan Thrust Belt and Northern Qaidam Basin. Geol. Soc. Am. Bull. 120 (7-8), 813–846. doi:10.1130/b26180.1
Zhang, T., and Krooss, B. M. (2001). Experimental Investigation on the Carbon Isotope Fractionation of Methane during Gas Migration by Diffusion through Sedimentary Rocks at Elevated Temperature and Pressure. Geochimica Cosmochimica Acta 65, 2723–2742. doi:10.1016/s0016-7037(01)00601-9
Zhang, W. Z., Yang, H., Li, J. F., and Ma, J. (2006). Effect of High-Class Source Rock of Chang 7 in Ordos Basin on Enrichment of Low Permeability Oil-Gas Accumulation-Hydrocarbon Generation and Expulsion Mechanism. Petroleum Explor. Dev. 33 (3), 289–293.
Zhang, M., Kong, T., and He, Y. (2016). Geochemical Characteristics of C5 -C7 Light Hydrocarbons in Gas Hydrates from the Permafrost Region of Qilian Mountains. Acta Geol. Sin. - Engl. Ed. 90 (6), 2283–2284. doi:10.1111/1755-6724.13047
Zhang, M., He, Y., Chen, Z. L., and Gong, J. M. (2018). Analysis Method and Geological Significance of C5-C7 Light Hydrocarbons in Natural Gas Hydrate in Permafrost, Qilian Mountains. Petroleum Geol. Exp. 40 (3), 418–423. doi:10.11781/sysydz201803418
Zhu, Y. H., Zhang, Y. Q., Wen, H. J., Lu, Z. Q., and Wang, P. K. (2010). Gas Hydrates in the Qilian Mountain Permafrost and Their Basic Characteristics. Acta Geosci. Sin. 31 (1), 7–16.
Zumberge, J., Ferworn, K., and Brown, S. (2012). Isotopic Reversal ('rollover') in Shale Gases Produced from the Mississippian Barnett and Fayetteville Formations. Mar. Petroleum Geol. 31 (1), 43–52. doi:10.1016/j.marpetgeo.2011.06.009
Keywords: South Qilian Basin, Muli Depression, natural gas, stable carbon isotopes, secondary alteration
Citation: Tan F, Li Y, Xie Z, Bian X, Du F, Liu S, Lu P and Wang J (2022) Geochemical Characteristics of the Jurassic Alkane Gas in the Muli Depression, South Qilian Basin: Implications for Potential of Light Oil and Condensate. Front. Earth Sci. 10:898629. doi: 10.3389/feart.2022.898629
Received: 17 March 2022; Accepted: 22 April 2022;
Published: 25 May 2022.
Edited by:
Shuang Yu, Guangzhou Institute of Geochemistry (CAS), ChinaReviewed by:
Zhaodong Xi, China University of Geosciences, ChinaCopyright © 2022 Tan, Li, Xie, Bian, Du, Liu, Lu and Wang. This is an open-access article distributed under the terms of the Creative Commons Attribution License (CC BY). The use, distribution or reproduction in other forums is permitted, provided the original author(s) and the copyright owner(s) are credited and that the original publication in this journal is cited, in accordance with accepted academic practice. No use, distribution or reproduction is permitted which does not comply with these terms.
*Correspondence: Yang Li, bGl5YW5neGJkeEAxNjMuY29t; Jingli Wang, d2FuZ2psQHN0dW1haWwubnd1LmVkdS5jbg==
Disclaimer: All claims expressed in this article are solely those of the authors and do not necessarily represent those of their affiliated organizations, or those of the publisher, the editors and the reviewers. Any product that may be evaluated in this article or claim that may be made by its manufacturer is not guaranteed or endorsed by the publisher.
Research integrity at Frontiers
Learn more about the work of our research integrity team to safeguard the quality of each article we publish.