
94% of researchers rate our articles as excellent or good
Learn more about the work of our research integrity team to safeguard the quality of each article we publish.
Find out more
ORIGINAL RESEARCH article
Front. Earth Sci. , 03 May 2022
Sec. Solid Earth Geophysics
Volume 10 - 2022 | https://doi.org/10.3389/feart.2022.898190
This article is part of the Research Topic High-pressure Physical Behavior of Minerals and Rocks: Mineralogy, Petrology and Geochemistry View all 16 articles
Since its formation, the Earth has cooled from molten magma to the present layered structure. The liquid and molten substance in the interior of the Earth continuously solidifies, radiating heat to the outer space and causing changes in the pressure and density inside the Earth. Constrained by the rigid lithosphere, the change in density decreases the pressure at the bottom of the crust, and thereby supports the rigid lithosphere. Under the effect of gravity, there is an increased interaction between tectonic plates, which leads to local stress accumulation. Eventually, this stress exceeds the strength of the rock and makes the mechanical structure of the crustal lithosphere unstable. This process is iterative, and the Earth continuously adjusts to new mechanical equilibria by releasing the accumulated stress through geological events such as earthquakes. In this study, using three sets of observations (Global Positioning System data, length of day data, and the latent heat of Earth solidification), we show that these observations are consistent with the aforementioned assumption that the solidification of liquid cause changes in density and volume in the Earth’s interior. Mechanical analyses indicate that liquid solidification in the interior of the Earth leads to decrease in the Earth’s volume. This increases the intensity of plate interactions, which leads to the movement of large plates, triggering geological events such as earthquakes. Thus, it is determined that liquid solidification in the Earth’s interior is the main source for the movement of plates.
The Earth has evolved from a molten state (magma ocean) to today’s layered structure via large-scale cooling and solidification (Elkins-Tanton, 2012). The cooling and solidification continue as the Earth keeps evolving and emitting energy (46 ± 3 TW, as estimated from the current global heat flow) (Lay et al., 2008). The difference between then and now is that the early magma ocean might have solidified faster. These contents of the Earth’s core go through molten-solid transitions at physical conditions (pressure and temperature) that change according to the thermodynamics and evolution of the Earth. Solidification is a universal and crucial phenomenon, and it leads to noticeable changes in density accompanied by heat release and volume contraction (Dziewonski and Anderson, 1981; Massonne et al., 2007; Sakamaki et al., 2010; Hirose et al., 2013). Global magmatism, reaching a rate of 25.8–33.6 km3 yr−1, is caused due to magma solidification at the shallow Earth (Wilson, 2007). At deep Earth, the inner core grows at a rate of 0.5–2.4 mm yr−1 due to crystallization of molten iron (Labrosse et al., 2001; Ohta et al., 2016; Bono et al., 2019). Released latent heat is a key heat source that influences the processes such as inner core growth and the geodynamo. Thus, solidification governs the thermodynamics of the Earth (Buffett et al., 1992; Buffett, 2000). The lithosphere, the topmost layer of the Earth, is a poor conductor of heat, and it is mechanically rigid and brittle (Shimada and Cho, 1990; Rychert and Shearer, 2009; Whittington et al., 2009). It operates like a ceramic outer shell, constraining the ductile mantle beneath it. The energy released by the solidification of melts in the Earth powers the dynamics of the Earth’s lithosphere and plate tectonics. The liquid–solid conversion in the Earth’s interior is a continuous process, and it leads to continuous heat dissipation to the outer space. Under the law of conservation of mass, the change in density due to solidification reflects a volume change, which eventually leads to the geometric variation of the Earth.
Modern space geodesy techniques have revealed that the Earth’s geometry is continuously changing and is not constant. Geodetic studies employing the data obtained from various techniques, such as Global Positioning System (GPS), Satellite Laser Ranging (SLR), Very Long Baseline Interferometry (VLBI), and Doppler Orbitography and Radiopositioning Integrated by Satellite (DORIS), suggest that the current rate of change of the Earth’s radius spans from −4.0 to 1.3 mm yr−1. Because of this, it is unclear whether the Earth is expanding or contracting and also difficult to determine the extent of the change (Huang et al., 2002; Sun et al., 2006; Wu et al., 2011; Zhu et al., 2013). The paleomagnetic data indicate that the radius of the ancient Earth was 0.99–1.12 times of that of the present radius in the late Paleozoic and early Mesozoic Era (Cox and Doell, 1961; Ward, 1963). Another evidence of the varying nature of the Earth’s geometry is the Earth’s rotation rate, which has been observed to fluctuate in the interdecadal and longer periods as recorded based on the values of length of day (LOD). The changes in LOD are associated with the change of the Earth’s moment of inertia and impacts of large earthquakes (Stephenson and Morrison, 1984; Chao and Gross, 1987; Holme and De Viron, 2013).
The liquid and molten substance inside the Earth continues to solidify with the latent heat release and volume and density changes. Heat radiates to the surface via conduction, convective, radiation, and so on, and the volume change macroscopically manifests as volume contraction of the Earth. The volume contraction causes the tectonic plates to squeeze together, making them move under the influence of gravity, which in turn leads to various geological events. The traditional plate motion driving force model (mantle convection, slab pull, and ridge push) (Forsyth and Uyeda, 1975; Bott, 1991; Bokelmann, 2002a; Bokelmann, 2002b; van Summeren et al., 2012) has some limitations, as it cannot reasonably explain the plate motion cycle (Sun, 2019). Herein, we propose that the solidification of the Earth drives the dynamics of the Earth’s crust and gives rise to the volume variation of the Earth, and this theory is verified via the analyses of GPS data, LOD observations, and global heat flow estimates.
The solidification of molten substance leads to changes in the internal volume, and it macroscopically manifests as the collapse of the Earth’s volume. If this happened, akin to a deflating balloon, the Earth’s radius would decrease, thereby decreasing the distance between the corresponding points on the Earth’s surface. When the Earth is considered a standard sphere, there is a definite relationship between the reduction of the Earth’s radius and any changes in distance between the two points on the surface, as shown in Figure 1.
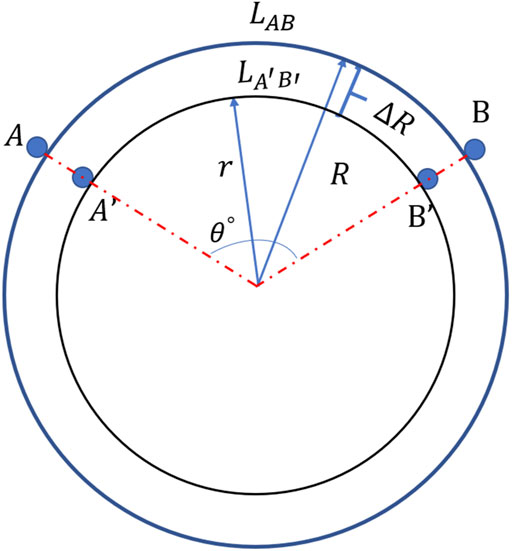
FIGURE 1. Simplified model of the Earth.
Herein, variations in the radius and volume of the Earth are derived from the GPS data of 2,674 ground-based receivers during 1995–2019. A detailed site information is presented in Figure 2. These GPS data, recorded by NASA and processed by the Jet Propulsion Laboratory, provide the time series of longitude, latitude, and altitude of the individual sites over time (Heflin, 1994). The relationship between the change in distance
where
where
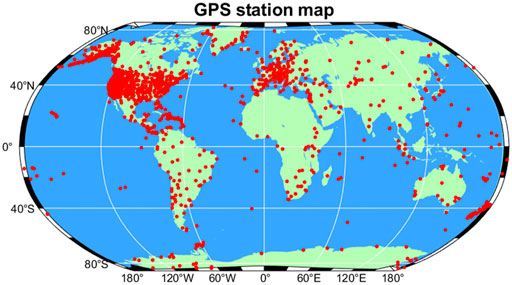
FIGURE 2. Locations of 2,764 GPS stations. The stations in North America (the United States) are relatively closer than the stations elsewhere in the world.
The data are processed by a self-written Python code. The arc length between any two stations on the Earth is calculated. Then, the relation between the annual radius change of the Earth and the change in the arc length between the two sites is given using Eq. 3:
where
During data processing, the data from sites whose observation time was less than 12 months for any year are omitted. To reduce errors caused by certain geological factors at close range, only those points are considered for which the distance is ≥100 km. For example, taking the calculation of 1995, we draw a diagram of one of the points (VILL) as shown in Figure 3. According to the longitude and latitude information of each station, the change of distance between the two sites with time is obtained, and the corresponding change in radius is determined. The average of the change in the Earth’s radius for 1995 is obtained by traversing the distances among all the points, and the value is −2.4 ± 0.27 mm.
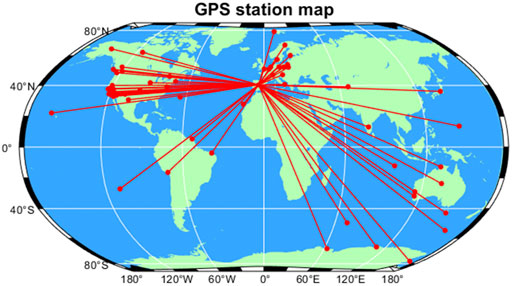
FIGURE 3. Diagram of the distance between VILL and the remaining points. The VILL site in 1995 is taken as an example. The red spot represents the location of each site, and the line segment represents the distance between the sites. The distance between the pairs of receivers at the beginning and the end of the year is calculated, and the change in this value is calculated. The average radius change in 1995 is −2.4 mm.
A total number of 14 million calculations are carried out for
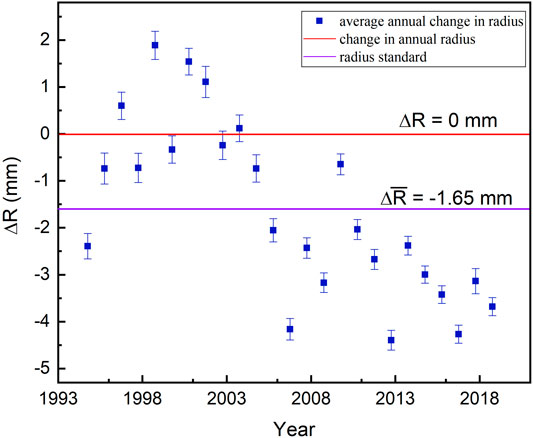
FIGURE 4. Annual average radius changes of the Earth from 1995 to 2019. Black circles: average change of Earth’s radius in that year; red and purple lines represent the annual average radius change (0 and −1.65 mm yr−1, respectively). 20 out of 25 results are negative.
The global heat flow is estimated to be 46 TW, and it mainly comprises radiogenic heat and heat from the core and mantle (Lay et al., 2008). The most accessible integrative energy for the planet is the total amount released at the surface. However, there may be uncertainties in the present-day energy budget. Specifically, there is considerable uncertainty in the radiogenic concentrations (Gessmann and Wood, 2002; Murthy et al., 2003) and the present-day mantle and core secular cooling rates (Lay et al., 2008; Herzberg et al., 2010). Although geoneutrino detectors promise new constraints in the near future (Araki et al., 2005; Dye, 2012), macroscopically, the Earth’s internal temperature distribution is constant, and secular cooling can be neglected over a short period of time. The results of Chang ’e-5 samples research showed that the characteristics of kreep-potassium enrichment in the basalt were formed in the late magmatic period, thus ruling out the main hypothesis that this moon mantle source region is rich in radioactive thermogenic elements (Hu et al., 2021; Li et al., 2021; Tian et al., 2021). The world’s uranium deposits do not overlap with the geothermal anomalies. This suggests that there is not a lot of radioactive material in the Earth’s crust. Thus, radioactive heat may not be a major source of heat loss on the Earth.
According to the thermal evolution of the Earth, the latent heat released from solidification of molten substance is considered an important heat source on the Earth. Herein, to simplify the calculation, the total energy budget of the Earth is assumed to comprise only latent and crustal radiogenic heat. The latent heat released from solidification of the Earth is calculated using Eq. 4:
where
where

TABLE 1. Values of the specific latent heat and densities of the melt and solid used for latent heat analysis (Ohtani and Maeda, 2001; Suzuki and Ohtani, 2003; Massonne et al., 2007; Sakamaki et al., 2009; Zhang et al., 2014; Zhang et al., 2020).
When
The variation of the Earth’s moment of inertia is calculated using the LOD data and angular momentum conservation. Based on occultation and solar and lunar eclipses, the long-term average change rate of LOD in the last 1,000 years is determined to be approximately −0.01
When the conservation of angular momentum is achieved, the variation in LOD manifests as the variation of the radius (Eq. 6):
where
where
where
where
where
where
The total moments of inertia of the Earth in the first and second states are quite similar due to minute changes in the radius, and thus,
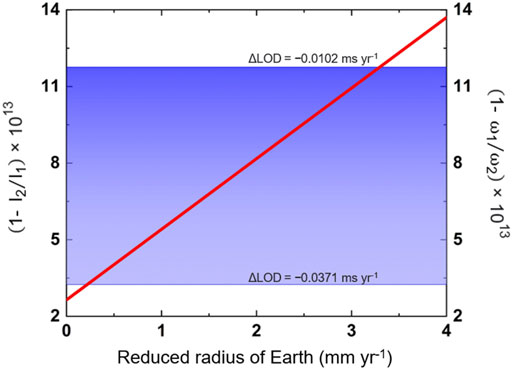
FIGURE 5. Changes in the moment of inertia of Earth as a function of reduced radius of the crust. Red line: change of the moment of inertia of Earth; blue shading: range of variation of the Earth’s angular velocity. Changes of the moment of inertia and angular velocity are extremely small, and thus, they are expressed as the vertical axis title. The subscripts 1 and 2 represent the states before and after the radius of the Earth has decreased, respectively.
The annual average volume variation of the Earth obtained from the analysis of GPS data, LOD observations, and global heat flux estimates are −841.60 km3 yr−1, −120.24 km3 yr−1, and −111 to −1,676 km3 yr−1, respectively, and these are in good agreement with each other. The values are on the same order of magnitude but with some differences, which can be attributed to the uncertainty of global heat flux estimates and the specific latent heat reported in previous studies. The density profile of the Earth and density of iron under high pressure and high temperature are also likely sources of uncertainty. Moreover, the GPS tracking stations are sparsely distributed in some regions, which could have led to the gaps in data. Nevertheless, these results are sufficient for validating the theory of solidification-driven dynamics of the Earth.
The molten substance in the Earth’s interior continues to solidify. When the volume change at the shallow Earth due to solidification accumulates, after a specific peak value is reached, the pressure changes because of which the rigid lithosphere become mechanically unstable and eventually fails, decreasing the Earth’s radius and volume. The volume shrinkage increases the influence of gravity on the crust, triggering a pressure drop at the bottom of the lithosphere and a large-scale fracture and dislocation of the overlying strata, which induces geological events such as earthquakes. This is similar to the elastic bucking load that an ordinary spherical shell model can bear under external pressure. The Earth’s crust is thus simplified by a spherical shell model, and the ultimate load of the spherical shell is calculated. For a spherical shell, the ultimate load is only 70% of the ideal case because of the accuracy, and the ultimate load
where
The results show that the limit load of the overlying crust is small and much less than the stress caused by self-weight (
where
where

FIGURE 6. The mechanical models of the Earth before and after solidification. Red shading: density of magma, a darker color implies greater density; FP denotes supporting the force of asthenosphere, and Farc denotes the circumferential force. (A) The mechanical structure of the overlying crust is balanced before solidification. (B) When the magma continues solidifying, it accumulates the weight of the overlying crust, and the mechanical structure of the overlying crust becomes unstable when its limit load is reached, causing collapse and rupture and triggering an earthquake.
Taking the hardest-hit area of Mw 8 earthquake as an example, the results show that the pressure change
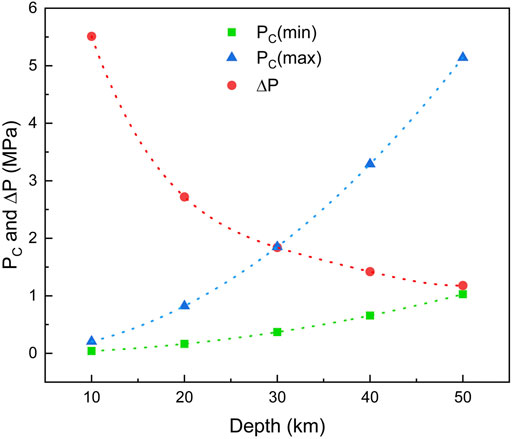
FIGURE 7. Relationship between the pressure change caused by the magma solidification and the ultimate load of the overlying crust. Pc(max) and Pc(min) are obtained from the average maximum and minimum Young’s moduli of the main components of the crust (basalt and granite), respectively (Schultz, 1993; Yang et al., 2019).
Based on the analysis of the GPS data, changes in the total volume and radius of the Earth are determined, and these changes demonstrate that the Earth is undergoing contraction at an average rate of 1.65 mm yr−1. The change in the radius causes changes in the moment of inertia of the Earth, which increases the Earth’s rotation speed. This can explain the physical phenomenon of the change in the Earth’s speed and the change in LOD. The change of the Earth’s radius is mainly attributed to the solidification of molten substance in the Earth’s interior, and this liquid–solid transformation is the main power source for geodynamics. The abovementioned phenomena and principles can be extended to other planets whose structures are similar to that of the Earth, that is, planets on which the liquid–solid transformation of the inner material is not yet complete.
The pressure-volume work (
Based on the previous discussion, earthquakes can be predicted based on the energy provided by solidification and the energy required for earthquakes. The expectation of energy of earthquakes from Mw
where
where
In conclusion, the Earth has been going through a nonlinear solidification process since the magma ocean stage, which has been accompanied by the release of latent heat and volume contraction. Our analyses based on the GPS data, LOD observations, and heat flux estimates demonstrate that the current rate of change of the Earth’s volume is −841 km3 yr−1. The decrease in the Earth’s internal volume reduces the pressure at the bottom of the crust and rock layers. Under the action of gravity, the interactions between the crustal plates intensify, which makes the mechanical structure unstable. Our mechanical model shows that the decrease of pressure (1.84–5.51 MPa) is greater than the ultimate load (0.37–1.85 MPa) that most of the Earth’s crust can bear. Therefore, volume shrinkage leads to stress buildup followed by mechanical failure, which manifests as earthquakes and powers the geodynamics of the crust. The findings of this study reveal the connection between the liquid–solid transformation inside the Earth and geodynamics and provides a new perspective for predicting earthquakes.
The original contributions presented in the study are included in the article/Supplementary Material, further inquiries can be directed to the corresponding author.
DH contributed to conception of the study; DH and XL designed the study; XL and MT collected the data and performed the analysis; XL wrote the first draft of the article; DH and XL revised the article. All authors contributed to manuscript revision, read, and approved the submitted version.
The authors declare that the research was conducted in the absence of any commercial or financial relationships that could be construed as a potential conflict of interest.
All claims expressed in this article are solely those of the authors and do not necessarily represent those of their affiliated organizations or those of the publisher, the editors, and the reviewers. Any product that may be evaluated in this article, or claim that may be made by its manufacturer, is not guaranteed or endorsed by the publisher.
The authors would like to thank all the reviewers who participated in the review, as well as MJEditor (www.mjeditor.com) for providing English editing services during the preparation of this manuscript.
Araki, T., Enomoto, S., Furuno, K., Gando, Y., Ichimura, K., Ikeda, H., et al. (2005). Experimental Investigation of Geologically Produced Antineutrinos with KamLAND. Nature 436 (7050), 499–503. doi:10.1038/nature03980
Båth, M. (1975). Seismicity of the Tanzania Region. Tectonophysics 27 (4), 353–379. doi:10.1016/0040-1951(75)90004-9
Bokelmann, G. H. R. (2002b). Convection-driven Motion of the North American Craton: Evidence from P-Wave Anisotropy. Geophys. J. Int. 148 (2), 278–287. doi:10.1046/j.1365-246X.2002.01614.x
Bokelmann, G. H. R. (2002a). Which Forces Drive North America? Geol 30 (11), 1027–1030. doi:10.1130/0091-7613(2002)030<1027:wfdna>2.0.co;2
Bono, R. K., Tarduno, J. A., Nimmo, F., and Cottrell, R. D. (2019). Young Inner Core Inferred from Ediacaran Ultra-low Geomagnetic Field Intensity. Nat. Geosci 12 (2), 143–147. doi:10.1038/s41561-018-0288-0
Bott, M. (1991). Ridge Push and Associated Plate interior Stress in normal and Hot Spot Regions. Tectonophysics 200 (1-3), 17–32. doi:10.1016/0040-1951(91)90003-B
Buffett, B. A. (2000). Earth's Core and the Geodynamo. Science 288 (5473), 2007–2012. doi:10.1126/science.288.5473.2007
Buffett, B. A., Huppert, H. E., Lister, J. R., and Woods, A. W. (1992). Analytical Model for Solidification of the Earth's Core. Nature 356 (6367), 329–331. doi:10.1038/356329a0
Chao, B. F., and Gross, R. S. (1987). Changes in the Earth's Rotation and Low-Degree Gravitational Field Induced by Earthquakes. Geophys. J. Int. 91 (3), 569–596. doi:10.1111/j.1365-246X.1987.tb01659.x
Cox, A., and Doell, R. R. (1961). Palæomagnetic Evidence Relevant to a Change in the Earth's Radius. Nature 189 (4758), 45–47. doi:10.1038/189045a0
Dye, S. (2012). Geoneutrinos and the Radioactive Power of the Earth. Rev. Geophys. 50 (3), 1–19. doi:10.1029/2012RG000400
Dziewonski, A. M., and Anderson, D. L. (1981). Preliminary Reference Earth Model. Phys. Earth Planet. Interiors 25 (4), 297–356. doi:10.1016/0031-9201(81)90046-7
Elkins-Tanton, L. T. (2012). Magma Oceans in the Inner Solar System. Annu. Rev. Earth Planet. Sci. 40, 113–139. doi:10.1146/annurev-earth-042711-105503
Forsyth, D., and Uyeda, S. (1975). On the Relative Importance of the Driving Forces of Plate Motion. Geophys. J. Int. 43 (1), 163–200. doi:10.1111/j.1365-246X.1975.tb00631.x
Gessmann, C., and Wood, B. (2002). Potassium in the Earth’s Core? Earth Planet. Sci. Lett. 200 (1-2), 63–78. doi:10.1016/S0012-821X(02)00593-9
Heflin, M. (1994). GNSS Time Series. Available: https://www.frontiersin.org/about/author-guidelines (Accessed May 20, 2021).
Herzberg, C., Condie, K., and Korenaga, J. (2010). Thermal History of the Earth and its Petrological Expression. Earth Planet. Sci. Lett. 292 (1-2), 79–88. doi:10.1016/j.epsl.2010.01.022
Hirose, K., Labrosse, S., and Hernlund, J. (2013). Composition and State of the Core. Annu. Rev. Earth Planet. Sci. 41, 657–691. doi:10.1146/annurev-earth-050212-124007
Holme, R., and De Viron, O. (2013). Characterization and Implications of Intradecadal Variations in Length of Day. Nature 499 (7457), 202–204. doi:10.1038/nature12282
Hu, S., He, H., Ji, J., Lin, Y., Hui, H., Anand, M., et al. (2021). A Dry Lunar Mantle Reservoir for Young Mare Basalts of Chang'e-5. Nature 600, 49–53. doi:10.1038/s41586-021-04107-9
Huang, L.-r., Ma, Z.-j., and Zhu, J.-x. (2002). The Newest Observational Evidence on Asymmetrical Deformation of the Earth. Acta Seimol. Sin. 15 (2), 210–213. doi:10.1007/s11589-002-0010-5
Hyndman, R. (1979). Poisson’s Ratio in the Oceanic Crusta Review. Developments in Geotectonics 15, 321–333. doi:10.1016/B978-0-444-41851-7.50022-4
Josiah, R. (2010). Distance Calculation Using Haversine Formula. Available: https://www.mathworks.com/matlabcentral/fileexchange/27785-distance-calculation-using-haversine-formula (Accessed August 18, 2021).
Kanamori, H. (1978). Quantification of Earthquakes. Nature 271 (5644), 411–414. doi:10.1038/271411a0
Labrosse, S., Poirier, J.-P., and Le Mouël, J.-L. (2001). The Age of the Inner Core. Earth Planet. Sci. Lett. 190 (3-4), 111–123. doi:10.1016/S0012-821X(01)00387-9
Lay, T., Hernlund, J., and Buffett, B. A. (2008). Core-mantle Boundary Heat Flow. Nat. Geosci 1 (1), 25–32. doi:10.1038/ngeo.2007.44
Li, Q.-L., Zhou, Q., Liu, Y., Xiao, Z., Lin, Y., Li, J.-H., et al. (2021). Two-billion-year-old Volcanism on the Moon from Chang'e-5 Basalts. Nature 600, 54–58. doi:10.1038/s41586-021-04100-2
Massonne, H., Willner, A., and Gerya, T. (2007). Densities of Metapelitic Rocks at High to Ultrahigh Pressure Conditions: What Are the Geodynamic Consequences? Earth Planet. Sci. Lett. 256 (1-2), 12–27. doi:10.1016/j.epsl.2007.01.013
Murthy, V. R., Van Westrenen, W., and Fei, Y. (2003). Experimental Evidence that Potassium Is a Substantial Radioactive Heat Source in Planetary Cores. Nature 423 (6936), 163–165. doi:10.1038/nature01560
O'Connell, R. J., and Dziewonski, A. M. (1976). Excitation of the Chandler Wobble by Large Earthquakes. Nature 262 (5566), 259–262. doi:10.1038/262259a0
Ohta, K., Kuwayama, Y., Hirose, K., Shimizu, K., and Ohishi, Y. (2016). Experimental Determination of the Electrical Resistivity of Iron at Earth's Core Conditions. Nature 534 (7605), 95–98. doi:10.1038/nature17957
Ohtani, E., and Maeda, M. (2001). Density of Basaltic Melt at High Pressure and Stability of the Melt at the Base of the Lower Mantle. Earth Planet. Sci. Lett. 193 (1-2), 69–75. doi:10.1016/S0012-821X(01)00505-2
Pan, B., and Cui, W. (2010). An Overview of Buckling and Ultimate Strength of Spherical Pressure hull under External Pressure. Mar. Structures 23 (3), 227–240. doi:10.1016/j.marstruc.2010.07.005
Rychert, C. A., and Shearer, P. M. (2009). A Global View of the Lithosphere-Asthenosphere Boundary. Science 324 (5926), 495–498. doi:10.1126/science.1169754
Sakamaki, T., Ohtani, E., Urakawa, S., Suzuki, A., and Katayama, Y. (2010). Density of Dry Peridotite Magma at High Pressure Using an X-ray Absorption Method. Am. Mineral. 95 (1), 144–147. doi:10.2138/am.2010.3143
Sakamaki, T., Ohtani, E., Urakawa, S., Suzuki, A., and Katayama, Y. (2009). Measurement of Hydrous Peridotite Magma Density at High Pressure Using the X-ray Absorption Method. Earth Planet. Sci. Lett. 287 (3-4), 293–297. doi:10.1016/j.epsl.2009.07.030
Schultz, R. A. (1993). Brittle Strength of Basaltic Rock Masses with Applications to Venus. J. Geophys. Res. 98 (E6), 10883–10895. doi:10.1029/93JE00691
Shimada, M., and Cho, A. (1990). Two Types of Brittle Fracture of Silicate Rocks under Confining Pressure and Their Implications in the Earth's Crust. Tectonophysics 175 (1-3), 221–235. doi:10.1016/0040-1951(90)90139-Y
Stacey, F. D., and Loper, D. E. (2007). A Revised Estimate of the Conductivity of Iron alloy at High Pressure and Implications for the Core Energy Balance. Phys. Earth Planet. Interiors 161 (1-2), 13–18. doi:10.1016/j.pepi.2006.12.001
Stephenson, F. R., and Morrison, L. V. (1984). Long-term Changes in the Rotation of the Earth : 700 B.C. To A.D. 1980. Phil. Trans. R. Soc. Lond. A. 313 (1524), 47–70. doi:10.1098/rsta.1984.0082
Sun, F.-P., Zhu, X.-H., Wang, R., and Li, J.-T. (2006). Detection of Changes of the Earth's Volume and Geometry by Using GPS and VLBI Data. Chin. J. Geophys. 49 (4), 900–906. doi:10.1002/cjg2.910
Sun, W. (2019). The Magma Engine and the Driving Force of Plate Tectonics. Chin. Sci. Bull. 64 (28-29), 2988–3006. doi:10.1360/n972019-00274
Suzuki, A., and Ohtani, E. (2003). Density of Peridotite Melts at High Pressure. Phys. Chem. Minerals 30 (8), 449–456. doi:10.1007/s00269-003-0322-6
Tian, H.-C., Wang, H., Chen, Y., Yang, W., Zhou, Q., Zhang, C., et al. (2021). Non-KREEP Origin for Chang'e-5 Basalts in the Procellarum KREEP Terrane. Nature 600, 59–63. doi:10.1038/s41586-021-04119-5
van Summeren, J., Conrad, C. P., and Lithgow-Bertelloni, C. (2012). The Importance of Slab Pull and a Global Asthenosphere to Plate Motions. Geochem. Geophys. Geosyst. 13 (2), a–n. doi:10.1029/2011GC003873
Wang, Q. (2009). Seismic Velocities, Anisotropy, Hysteresis and Poisson's Ratio of Ultrahigh Pressure (UHP) Metamorphic Rocks. Quebec: École Polytechnique de Montréal.
Ward, M. A. (1963). On Detecting Changes in the Earth's Radius. Geophys. J. Int. 8 (2), 217–225. doi:10.1111/j.1365-246X.1963.tb06285.x
Whittington, A. G., Hofmeister, A. M., and Nabelek, P. I. (2009). Temperature-dependent thermal Diffusivity of the Earth's Crust and Implications for Magmatism. Nature 458 (7236), 319–321. doi:10.1038/nature07818
Wilson, B. M. (2007). Igneous Petrogenesis a Global Tectonic Approach. Berlin: Springer Science & Business Media.
Wu, X., Collilieux, X., Altamimi, Z., Vermeersen, B. L. A., Gross, R. S., and Fukumori, I. (2011). Accuracy of the International Terrestrial Reference Frame Origin and Earth Expansion. Geophys. Res. Lett. 38 (13), a–n. doi:10.1029/2011GL047450
Yang, L., Feng, X., and Sun, Y. (2019). Predicting the Young's Modulus of Granites Using the Bayesian Model Selection Approach. Bull. Eng. Geol. Environ. 78 (5), 3413–3423. doi:10.1007/s10064-018-1326-2
Zandt, G., and Ammon, C. J. (1995). Continental Crust Composition Constrained by Measurements of Crustal Poisson's Ratio. Nature 374 (6518), 152–154. doi:10.1038/374152a0
Zhang, Y., Hou, M., Liu, G., Zhang, C., Prakapenka, V. B., Greenberg, E., et al. (2020). Reconciliation of Experiments and Theory on Transport Properties of Iron and the Geodynamo. Phys. Rev. Lett. 125 (7), 078501. doi:10.1103/PhysRevLett.125.078501
Zhang, Y., Sekine, T., He, H., Yu, Y., Liu, F., and Zhang, M. (2014). Shock Compression of Fe-Ni-Si System to 280 GPa: Implications for the Composition of the Earth's Outer Core. Geophys. Res. Lett. 41 (13), 4554–4559. doi:10.1002/2014GL060670
Keywords: liquid-solid transition, variation of Earth’s volume and radius, seismic mechanism, crustal ultimate load, geodynamics
Citation: Li X, Tao M and He D (2022) Geodynamics Based on Solidification of Liquid/Molten Substances in the Earth’s Interior. Front. Earth Sci. 10:898190. doi: 10.3389/feart.2022.898190
Received: 17 March 2022; Accepted: 04 April 2022;
Published: 03 May 2022.
Edited by:
Lidong Dai, Institute of Geochemistry (CAS), ChinaReviewed by:
Feiwu Zhang, Institute of Geochemistry (CAS), ChinaCopyright © 2022 Li, Tao and He. This is an open-access article distributed under the terms of the Creative Commons Attribution License (CC BY). The use, distribution or reproduction in other forums is permitted, provided the original author(s) and the copyright owner(s) are credited and that the original publication in this journal is cited, in accordance with accepted academic practice. No use, distribution or reproduction is permitted which does not comply with these terms.
*Correspondence: Duanwei He, ZHVhbndlaWhlQHNjdS5lZHUuY24=
Disclaimer: All claims expressed in this article are solely those of the authors and do not necessarily represent those of their affiliated organizations, or those of the publisher, the editors and the reviewers. Any product that may be evaluated in this article or claim that may be made by its manufacturer is not guaranteed or endorsed by the publisher.
Research integrity at Frontiers

Learn more about the work of our research integrity team to safeguard the quality of each article we publish.