 Fang Ma
 Ping Lü
 Min Cao
95% of researchers rate our articles as excellent or good
Learn more about the work of our research integrity team to safeguard the quality of each article we publish.
Find out more
ORIGINAL RESEARCH article
Front. Earth Sci. , 27 April 2022
Sec. Quaternary Science, Geomorphology and Paleoenvironment
Volume 10 - 2022 | https://doi.org/10.3389/feart.2022.897640
This article is part of the Research Topic Environmental Change in Drylands: Past, Present, Future View all 21 articles
Dunes composed of granular materials are present in deserts and other environments, such as subaqueous environments and environments on other planets, with very different time and length scales for their evolution. In arid regions, barchans (transverse dunes) develop under a unimodal wind regime, and are oriented perpendicular to the sand transport direction, whereas linear (longitudinal) dunes develop under a bimodal wind regime and are oriented parallel to the sand transport direction. However, field survey results cannot be explained solely by the wind because barchans and linear dunes can coexist under the same wind regime. Here, we investigated China’s Qaidam Basin, where barchans and linear dunes coexist. We measured dune morphology, analyzed wind data, and quantified the sand supply (equivalent sand thickness) to describe their development environment, and focused on the effect of sand supply to explore the combined effects of wind regime and sand supply on the coexistence of barchans and linear dunes. In our study area, barchans and linear dunes had low heights. The wind regime was narrowly bimodal, with low directional variability. The sand supply was limited (low equivalent sand thickness), but was greater for barchan chains than for barchans, and linear dunes had the smallest supply; the equivalent sand thickness in the linear dune areas was half that in barchan areas and one-quarter that in barchan chain areas. Except in the presence of topographical barriers and cohesive sediments, a unimodal or bimodal wind regime with an acute angle allows barchans and linear dunes to coexist under a low sand supply. The linear dunes and the barchans migrated along the resultant drift direction. Though we studied aeolian dunes, these findings will increase our understanding of these similar bedforms that develop in other planetary environments (e.g., Mars).
Dunes arise from the dynamic interactions between boundary-layer flows and the surface granular material. These processes occur on Earth, but have also been observed on several planets and moons, including Mars, Venus, and Titan (Lancaster, 2006; Lorenz and Zimbelman, 2014). In arid regions, subaqueous locations, and extraterrestrial environments, dunes develop with different temporal and spatial scales. The similar morphology on earth and Mars (C. Li et al., 2018; Parteli and Herrmann, 2007), the similar scaling laws followed by dunes (Claudin and Andreotti, 2006) and the fact that sand ripples and dunes can be explained by a unified model (Duran Vinent et al., 2019) suggest that the same mechanisms govern dune formation. Barchans and linear dunes are the most widely distributed and intensively studied dune types on earth. Barchans (transverse dunes) develop under a nearly unidirectional wind regime, with the dune’s orientation perpendicular to the resultant sand transport direction (α, which represents the angle between the dune’s orientation and the wind direction, is greater than 75°), whereas longitudinal dunes develop where the wind direction is bidirectional and moderately variable, with the dune’s orientation parallel to the resultant sand transport direction (the angle α is less than 15°) (Fryberger and Dean, 1979; Hunter et al., 1983; Lancaster, 1995; Livinstone and Warren, 1996; Wasson and Hyde, 1983; D. Zhang et al., 2010; Z. Zhang et al., 2015). Although there is good evidence for these descriptions, the differences suggest that barchans and linear dunes should not coexist in the same area. However, field surveys and remote sensing images show that linear dunes coexist with barchans in areas such as the Qaidam Basin (Figure 1), and this kind of aeolian geomorphology also occurs in the Taklimakan Desert, the Rub’Al-Khali Desert, and the Sahara Desert (Lü et al., 2018; Lü et al., 2017; Ma and Lü, 2019). The coexistence of different types of dune under the same wind environment seems to contradict our traditional understanding of dune formation, so it is difficult to explain this coexistence based solely on wind dynamics.
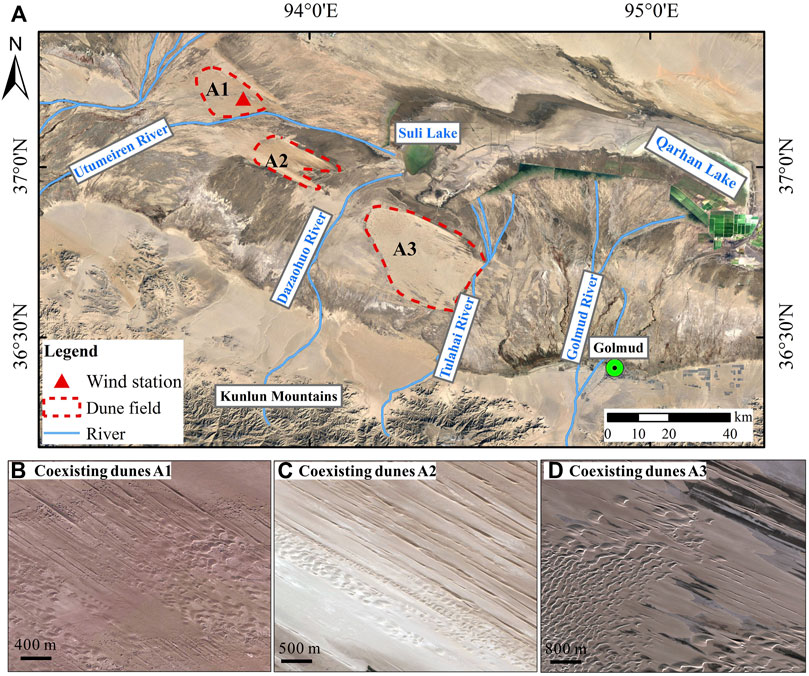
FIGURE 1. (A) Location of the study area and wind sampling station; (B–D) images of areas A1, A2, and A3 (respectively) where barchans and linear dunes coexist in the Qaidam Basin. Image source: Google Earth (https://earth.google.com/).
The wind, sand supply, and surface conditions are the main factors that control dune formation and evolution (Wasson and Hyde, 1983; Baas, 2007; Courrech du Pont et al., 2014; Lü et al., 2018). Many scholars have investigated this phenomenon from the perspective of surface conditions, such as sediment cohesion due to high total silt, clay, and salt contents (C. Li et al., 2019; Rubin and Hesp, 2009; Rubin and Rubin, 2013; Yu and Lai, 2014), the soil water conditions (C. Li et al., 2018), wind erosion of ridges (Zhou et al., 2012), the wind regime, and topography, particularly including surface barriers (Z. Zhang et al., 2017). However, the effect of sand supply on dune formation has often been ignored, so how this supply affects the coexistence of the two dune types is unclear. Some researchers have recognized that sand supply may affect the coexistence of barchans and linear dunes (C. Li et al., 2018; Z. Zhang et al., 2017), but this hypothesis has not been supported by quantitative research.
We designed the present study to provide a quantitative explanation for the coexistence of barchans and linear dunes in China’s Qaidam Basin. We measured dune morphology, and analyzed the wind regime using data measured at a wind station in areas A1 where the two dune types coexist, and quantified their sand supply using the equivalent sand thickness (EST) to investigate the effect of this variable on the coexistence of barchan and linear dunes. Our goals were to 1) obtain details of the dune morphology and wind regime, 2) quantify the sand supply for both dune types, and 3) analyze the combined effects of the wind regime and sand supply on the coexistence of barchans and linear dunes. Our results offer insights into the combined effect of several dune-forming factors related to the wind regime and sand supply. Even though we studied aeolian dunes, our findings will help us to understand similar bedforms that develop in other planetary environments (e.g., Mars).
The Qaidam Basin is located in the northeastern part of the Tibetan Plateau, at an average altitude of about 3,000 m. It is bounded by the Kunlun Mountains in the south and the Altyn Tagh and Qilian mountains in the north (J. Li et al., 2016). The climate in this region is a typical hyper-arid continental desert climate, with an annual precipitation less than 30 mm, and an evaporation rate greater than 3,000 mm, and desert covers 9 × 10³ km2 (Z. Zhang et al., 2017). The wind is mainly controlled by a meandering Westerly Jet Stream, and predominant wind is northwest wind.
The study area is located near the basin’s center, where isolated salt lakes are distributed near the dune fields and form extensive dry playas. The three dune areas (A1, A2, and A3) are divided by the Utumeiren River and Dazaohuo River, and Suli Lake is located north of A3. The primary dune types in the study area are barchans, barchan chains, and linear dunes, and the barchans and linear dunes coexist in three parts of the dune field (Figure 1B-D). The mean grain size for the barchans and linear dunes was 0.24 and 0.23 mm, respectively. The linear dunes in all three areas extend from west-northwest to east-southeast. They resemble an isosceles triangle in cross-section. Three spatial patterns of coexistence of barchans and linear dunes along the wind direction can be seen: barchans are distributed downwind of or inside the linear dune field (Figure 1B), parallel to the linear dunes (Figure 1C), or upwind of the linear dunes (Figure 1D).
Dune morphology was measured from Google Earth images with a spatial resolution of 3.8 m combined with field surveys. Dune morphological parameters were the crest-line length (LL), width (WL), height (HL), spacing (distance between the crest lines of consecutive dunes) and orientation (DL) of the linear dunes and the stoss slope length (SB), lee slope length (LB), width (WB), height (HB), spacing and orientation (DB) of the barchans (Figure 2). In total, we measured 17, 41, and 35 linear dunes in areas A1, A2, and A3, respectively, and 34, 98, and 86 barchans in areas A1, A2, and A3, respectively. In addition, we measured three barchans and a linear dune in A1 during our field survey using a three-dimensional laser scanner (VZ-2000, RIEGL, Horn, Austria) with a resolution of 8 mm. To verify the results, we compared the Google Earth measurements with the field survey results. Because of the lower resolution, the values measured from the Google Earth images were greater than those in the field survey. Therefore, we used the following correction coefficients to correct the Google Earth values: 0.79 for the crest-line length and width of the linear dunes, and 0.96 for the width, 0.72 for the stoss slope, and 0.94 for the lee slope of the barchans.
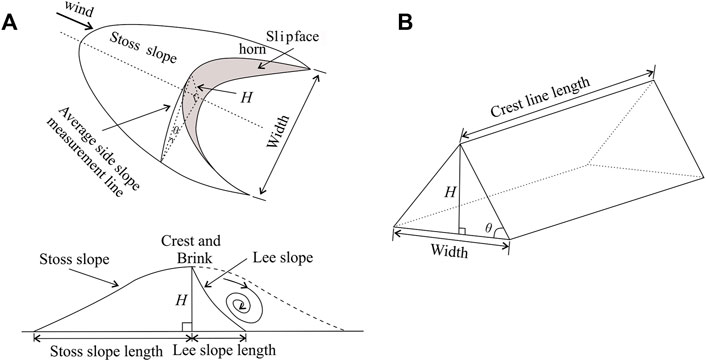
FIGURE 2. Schematic diagram of the (A) barchans and (B) linear dunes, and their major morphological parameters. H, height of the dune’s crest above the bed, θ, the average angle of one side slope of the dune with respect to the surface. Source: (A) modified after Hesp and Hastings (1998).
We calculated the dune height (H) using trigonometry based on the assumption that the dune’s cross-section was triangular:
where W is the dune’s width, and θ is the average angle of one side slope of the dune with respect to the surface, measured along the side slope measurement line, which was perpendicular to the central axis of the sand dune, and which runs from the dune crest to the inter-dunes area (Figure 2); we used θ = 11° for barchans (Hesp and Hastings, 1998), and θ = 15° for linear dunes (Lü et al., 2017; Lucas et al., 2015).
We measured the average dune height (Hmean) of two adjacent dunes and the spacing (λ, from crest to crest) based on 15 transacts for barchans (n = 85) and 25 transacts for linear dunes (n = 139). We used the average dune height and spacing for each transacts, and calculated the standard deviation (SD). We quantified the relationship between the height and spacing of the barchans and linear dunes using the Hmean of two adjacent dunes (Dong et al., 2009):
Wind is a key factor for dune formation, as it provides the energy for sand entrainment and transport and controls the direction of dune movement. Topography and surface characteristics affect the wind velocity. To measure wind velocity, we installed a two-dimensional supersonic anemometer (WindSonic, Gill, Lymington, Hampshire, United Kingdom) in dune area A1 (93°46′54.4″E, 37°12′0.80″N), with the wind speed sensor at a height of 2 m above the surface. Wind data was recorded at 1-min intervals from July 2017 to June 2018 using a CR300 datalogger (Campbell Scientific, Logan, UT, United States). The threshold wind speed for sediment transport in this study area was 6 m s−1 at a height of 10 m (Z. Zhang et al., 2017). We calculated the drift potential (DP), resultant drift potential (RDP), resultant drift direction (RDD), and directional variability (RDP/DP) using Fryberger and Dean’s method (1979). The equation is as follows:
where DP is the sand drift potential in vector units (VU); V is the measured wind velocity in knots at 10 m height; Vt is the threshold wind velocity in knots; t is the proportion of time during which wind velocity is greater than the threshold velocity. Although this method makes a number of interpretative simplifications and assumptions (Bullard, 1997), previous studies of the wind energy environments of global sand seas have demonstrated the value of these parameters. We extrapolated the wind velocity at a height of 10 m above the surface from the velocity at 2 m above the surface according to Dong et al., 2010. The equation is as follows:
where U2 is the wind velocity at 2 m height, and U10 is the wind velocity at 10 m (Z. Zhang et al., 2017).
Sand supply is clearly a vital factor for dune growth, and sediment thickness inside a dune field provides a good representation of the sand supply. The supply can be quantified using the equivalent sand thickness (EST) parameter, which is defined as the average sand thickness per unit area (Wasson and Hyde, 1983). We used the ALOS PALSAR Radiometric Terrain-Corrected (RTC) dataset with a 12.5-m horizontal resolution to calculate the equivalent sand thickness in the Qaidam Basin. The dataset can be downloaded from https://vertex.daac.asf.alaska.edu/. We used the method proposed by Bullard et al. (2011) to calculate equivalent sand thickness. First, we extracted each 1 kmⅹ1 km grid cell from the DEM, and defined it as a block. Next, based on the dune shapes and their orientations, we drew a 1-km transect in the DEM to define the profile for each dune in the block (Figure 3). The cross-sections of barchans are usually oriented perpendicular to the crest, whereas the cross-sections of linear dunes are orientated perpendicular to the dune’s long axis. Based on this method, A1 region was divided into 138 blocks, obtained 113 transects, and sampled a total of 312 dunes. A2 region was divided into 135 blocks, obtained 129 transects and sampled a total of 370 dunes. A3 region was divided into 450 blocks, obtained 450 transects, and sampled a total of 1171 dunes. We measured the dune height (H), cross-sectional area (CSA), and dune spacing (λ) for each individual dune in each block (Figure 3).
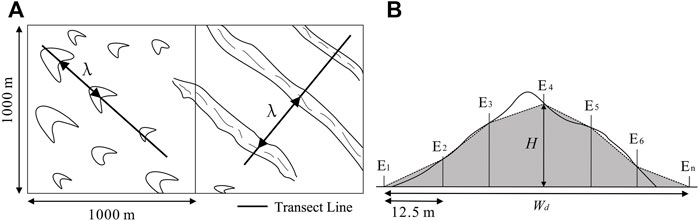
FIGURE 3. (A) Orientation of the two-dimensional transects for the two dune types (where λ represents the dune spacing between crests) and (B) the dune cross-sectional profile, indicating the distribution of the DEM elevation points. E1 to En represent sampling positions. H is the height of the dune’s crest and Wd is the distance between adjacent interdune areas. Source: adapted from Bullard et al. (2011).
Because the inter-dune elevation varies throughout a sand sea, we calculated the dune height (H) by subtracting the average elevation of the interdune areas between two adjacent dunes (E1 and En) relative to the maximum elevation (Emax):
Dune spacing was measured between the highest elevations (Emax) of adjacent dunes along a transect.
The cross-sectional area (CSA) for a single dune is calculated as follows:
where Wd is the distance between adjacent interdune elevations (E1 to En). The equivalent sand thickness (EST) is then calculated as follows:
where n is the number of individual dunes in the transect, and L is the length of the transect line in each block.
Table 1 summarizes the morphological parameters of the barchans and linear dunes in our study area. For the linear dunes, there was little difference in dune width among the three regions. The crestline was straight and its mean length ranged between 1.2 and 2.1 km, with an average width of about 32 m and a height of about 4 m. Controlled by the dominant northwest wind, the linear dune orientation was from the west-northwest and northwest towards the east-southeast and southeast. For the barchan dunes, the average dune height, length of the stoss slope, and length of the lee slope were much greater at A3 than at A1 and A2.
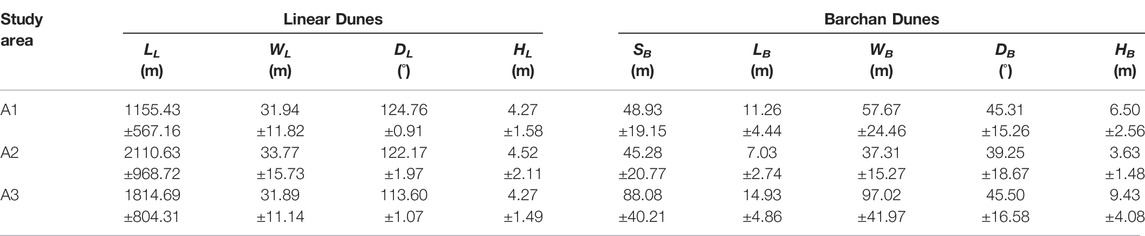
TABLE 1. The morphological characteristics of the linear and barchan dunes. Values are means ± SD (n = 17, 41, and 35 for linear dunes in areas A1, A2, and A3, respectively, and n = 34, 98, and 86 for barchan dunes in areas A1, A2, and A3, respectively; the morphological characteristics including crest-line length (LL), width (WL), height (HL), and orientation (DL) of the linear dunes and the stoss slope length (SB), lee slope length (LB), width (WB), orientation (DB), and height (HB) of the barchans).
The relationship between dune height and spacing reflects the dynamic processes that control dune formation, and the relationship was statistically significant for both dune types. The mean dune height was strongly and significantly positively correlated with spacing for barchans (Pearson’s r = 0.97, p < 0.01), whereas the correlation was significant and positive, but only moderately strong, for the linear dunes (r = 0.45, p < 0.05). Lancaster (1988) suggested that this relationship could be represented by a power function, so we used that equation form to model the relationship. Figure 4 shows the relationship between the mean dune height (Hmean) and spacing (λ) for the barchans and linear dunes, which can be expressed as follows for our study data:
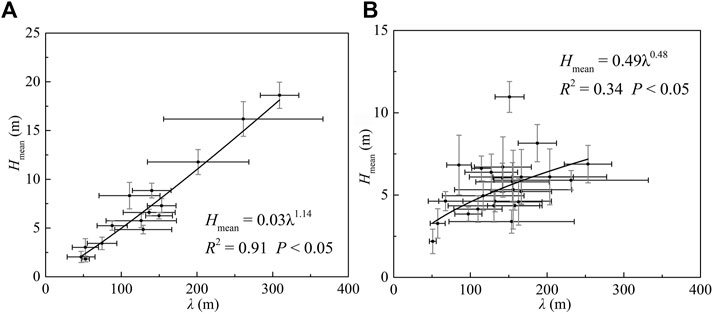
FIGURE 4. The relationships between average dune height (Hmean) of two adjacent dunes and the spacing between crests (λ) in the areas where (A) barchans and (B) linear dunes coexisted. Values are means ± SD.
The relationship was stronger for the barchans, as it explained 91% of the variation, versus only 34% for the linear dunes, and the exponent of 1.14 for barchans. However, although the function for linear dunes was statistically significant, there was considerable scatter in the data for the linear dunes and much of the variance (66%) was not explained. In addition, the exponent of 0.48 for the linear dunes was much smaller than Bullard results, which ranged from 0.683 to 0.913.
In the Qaidam Basin, the mean annual wind speed in the areas where linear dunes and barchans coexist is 3.96 ± 1.08 m s−1 (mean ± SD) at a height of 10 m, with the maximum monthly average wind speed of 5.26 m s−1 in summer and spring, followed by autumn and winter (2.36 m s−1), and the maximum wind speed ranged between 9.67 and 18.54 m s−1. Compared with other areas where these dune types coexist (Ma and Lü, 2019), the annual mean wind speed is greater than the value for the Taklimakan Desert (1.68 m s−1), and lower than those in the Rub’Al-Khali Desert and the Sahara Desert (4.31 and 4.55 m s−1, respectively).
The wind rose for sand-driving wind (i.e., wind faster than the particle entrainment threshold) clearly shows a primarily unimodal distribution, but with main and secondary wind directions (Z. Zhang et al., 2017). Figure 5A shows the wind rose for the threshold wind direction in the study area. The direction of the sand-driving wind is stable, with an obvious primary wind between west-northwest and northwest, with 61.7% of the sand-driving wind originating within this range. Winds from 270° to 337.5° represent 88.0% of the total winds. The Qaidam Basin desert shows little influence by the East Asian summer monsoon and is mainly controlled by a meandering Westerly Jet Stream (Yu and Lai, 2014), so the threshold wind direction is relatively unimodal.
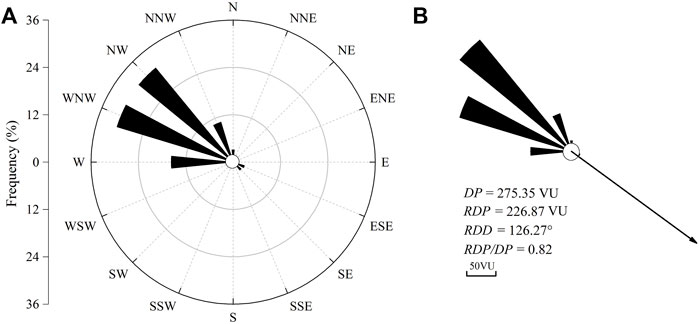
FIGURE 5. (A) Wind rose for the distribution of threshold wind directions (i.e., for winds strong enough to entrain sediment) and (B) the annual drift potential statistics in the areas where linear dunes and barchans coexisted. DP, drift potential (in vector units, VU); RDP, resultant drift potential (VU); RDD, resultant drift potential; RDP/DP, directional variability.
DP is the most important and frequently used index for judging wind energy, and this parameter can be combined with the evolution of aeolian geomorphology to provide a crucial reference standard for definition of the wind energy environment. It is widely used in the study of aeolian geomorphology (Lancaster, 1995; Pye and Tsoar, 1990; Z.; Zhang et al., 2017; Zu et al., 2008).
Figure 5B shows the annual DP in the areas where linear dunes and barchans coexist. In the study area, annual DP was 275.36 vector units (VU) and the RDP was 226.87 VU, which represents a medium wind energy environment according to classification from Fryberger and Dean (1979). The RDD was from northwest to southeast (126.27°). The linear dunes elongated roughly parallel to this direction (Table 1). The RDP/DP ratio (directional variability of the wind) is a major factor that affects the dune type, and increases gradually from barchans to star dunes (Fryberger and Dean, 1979; Hereher, 2018; Wasson and Hyde, 1983; Zu et al., 2008), the value of 0.82 for our study area represents low directional variability, which agrees with the wind rose (Figure 5A).
Figure 6 shows the seasonal variation of DP and the associated components of sand transport in the areas where linear dunes and barchans coexist. The largest DP was in the spring, followed by summer, and the smallest values were in autumn and winter. RDD ranged from 123.28° to 136.14°, which shows low variation, and was oriented in the same direction as the linear dunes and perpendicular to the wide axis of the barchans. Except for winter, which showed moderate variability (RDP/DP = 0.55), the sand transport direction was also stable, with low directional variability (RDP/DP values ranged from 0.83 to 0.85).
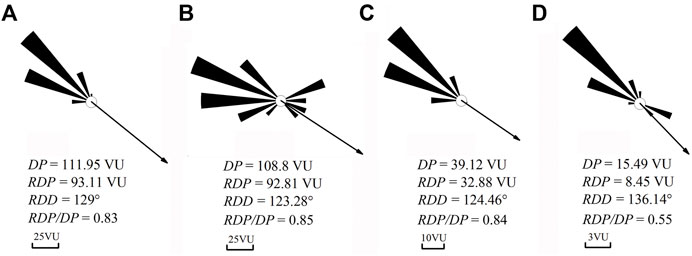
FIGURE 6. The seasonal variations of drift potential (DP) and associated parameters in the areas where linear dunes and barchans coexisted. (A) spring, (B) summer, (C) autumn, and (D) winter. RDP, resultant drift potential; RDD, resultant drift potential; RDP/DP, directional variability. Note that the scales differ among the graphs.
Dune development requires a sufficient sand supply. To explore the effects of sand supply on the coexistence of linear and barchan dunes, we used EST to assess the sand supply for both dune types.
Thus far, DEMs have been unable to estimate dune cross-sectional profiles as accurately as field surveys (Bullard et al., 2011; White et al., 2015). Prior to carrying out any data analysis with the ALOS PALSAR RTC data, we compared six dune cross-sectional profiles (three for barchans and three for linear dunes) created from the DEM with the corresponding profiles created from the field survey data. Figure 7 shows the resulting cross-sectional profiles for these dunes. The cross-sectional area (CSA) from the DEM was larger than that from the field surveys.
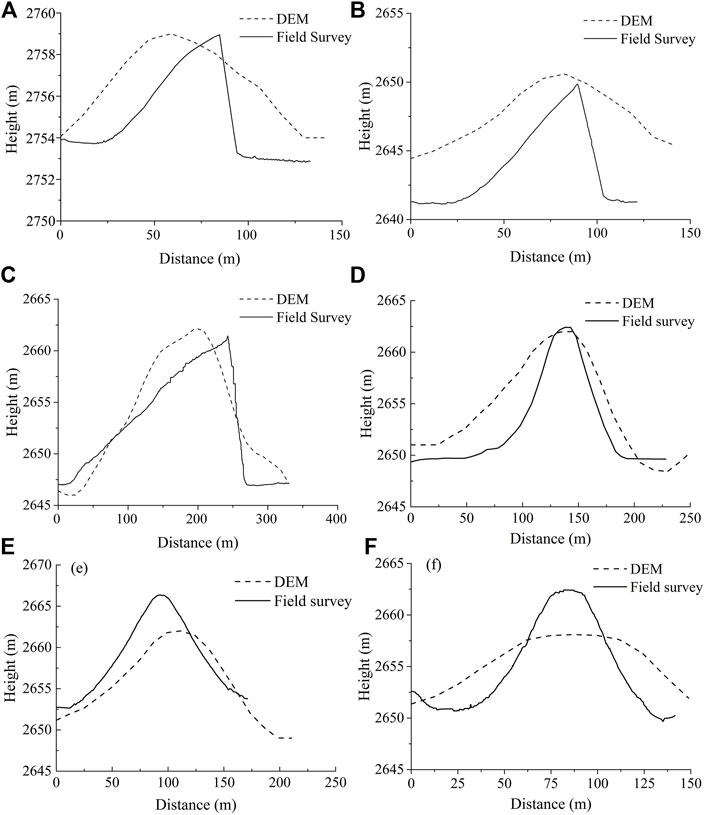
FIGURE 7. Comparison of dune profiles based on a digital elevation model (DEM) and field surveys for (A,B,C) three barchans and (D,E), and (F) three linear dunes. The barchan coordinates are 93°46′39.3″E and 37°14′10.8″N, and the linear dune coordinates are 93°46′55.99″E and 37°11′55.84″N.
Table 2 shows that the ratio of field-estimated CSA to the DEM-estimated CSA ranged from 0.49 to 0.88. We therefore used the arithmetic mean ratio of 0.74 for barchans and the arithmetic mean value of 0.78 for linear dunes to estimate CSA from the DEM data.
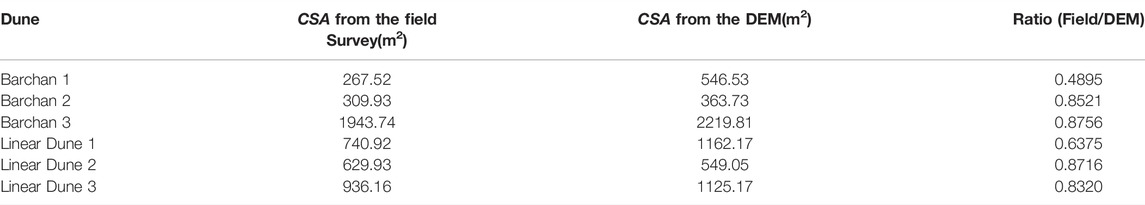
TABLE 2. Comparison of the digital elevation model (DEM) and field survey estimates of dune cross-sectional area (CSA) for the six dunes whose profiles are shown in Figure 7.
The relationship between dune height and CSA is a key parameter of Wasson and Hyde’s (1983) methodology for calculating EST from transect data (Bullard et al., 2011). Figure 8A shows the relationship between dune height and the adjusted CSA for the dunes in areas A1, A2, and A3, which can be expressed as:
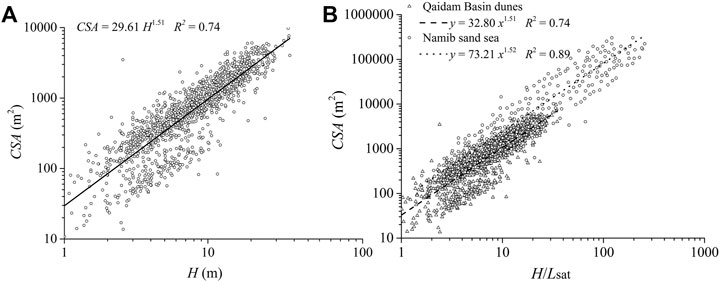
FIGURE 8. (A) Relationship between individual dune height (H) and individual cross-sectional area (CSA) for the dune field in the Qaidam Basin. (B) Relationship between the rescaled individual dune height (H/Lsat, where Lsat represents the saturated length) and the cross-sectional area (CSA) for the dune field. Data for the Namib sand sea were obtained from Bullard et al. (2011).
Bullard et al. (2011) researched the relationship between CSA and the height of individual dunes using ASTER GDEM data for the Namib Sand Sea, and found the following relationship:
We attempted to use the saturation length, to normalize the dune height and compare our results with those from the Namib Sand Sea:
where
Figure 9 shows the spatial patterns of the EST, height, and spacing for area A1 (Areas A2 and A3 are discussed in the following sections.) Barchans and barchan chains were mainly distributed north of the dry river bed, whereas linear dunes and barchans were mostly distributed south of the dry river bed, but barchans were also distributed inside the area of linear dunes in the south.
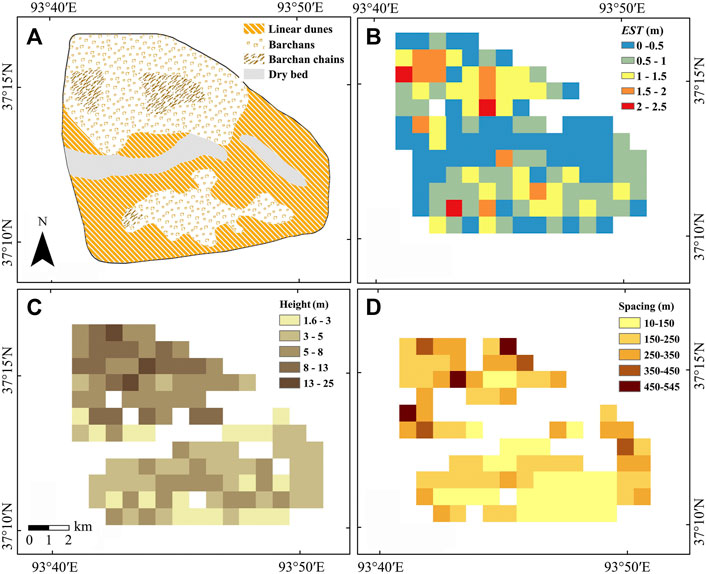
FIGURE 9. Maps of the (A) dune distribution, (B) equivalent sand thickness (EST), (C) dune crest height, and (D) crest to crest dune spacing for area A1 (Figure 1).
The spatial distribution of EST shows that the EST in this area was low, with values ranging from 0 to 2.5 m and averaging 0.75 m. From the spatial distribution of EST, the thickness was higher in the centers of the two areas with barchans than at their edges, and the EST of the barchan chains was larger than those of the barchans and linear dunes. EST was lowest in the linear dunes area, where the sand supply was lowest.
The mean dune height for the blocks ranged from 1.6 to 25.0 m and averaged 5.75 m, with dunes shorter than 10 m accounting for 85% of the total, and tall dunes were found mainly in the barchan chains. The spatial pattern shows that dune height was higher north of the dry river bed than in the south, and higher in the center of the two barchan areas than at the edges. Dune spacing is also an essential reflection of sediment supply (Dong et al., 2009; Dong et al., 2010; Hugenholtz and Barchyn, 2010). Dune spacing ranged from 10 to 545 m, and followed a pattern similar to that for the dune height; that is, the greater the dune height, the greater the dune spacing. North of the dry river bed, the dominant dune types were barchans and barchan chains, and the dunes were tall and relatively widely spaced; south of the dry river bed, short barchans and linear dunes with narrow dune spacing were dominant.
In this dune field, the primary dunes are linear dunes. Barchans are found only in two small areas in the northwestern part of this area, and are roughly parallel to the linear dunes, and some of these barchans are upwind of linear dunes. Figure 10 shows that the EST is quite low, with values ranging from 0.1 to 2.9 m and averaging 1.2 m; that is, the sand supply is low. The thickness decreases from the central desert towards the surrounding areas.
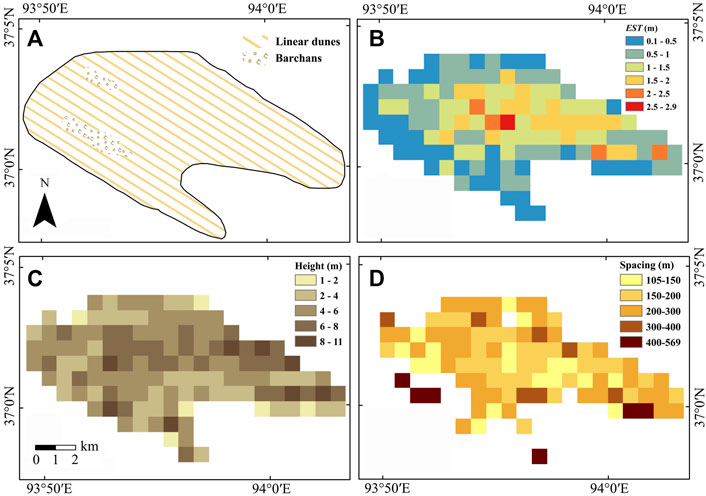
FIGURE 10. Maps of the (A) dune distribution, (B) equivalent sand thickness (EST), (C) dune crest height, and (D) crest to crest dune spacing for area A2 (Figure 1).
Dune height ranged from 1 to 11 m, and averaged 5.01 m. Dune spacing ranged from 105 to 569 m, with an average spacing of 201.61 m. The linear dunes distributed in the central desert area, had an average spacing of 225.78 m, versus 141.04 m for the barchans. There appeared to be no similarity between the maps of dune spacing and dune height.
Figure 11 shows that barchans, barchan chains, linear dunes, parabolic dunes, and shrub dunes coexist in this area. The barchan chains were distributed from northwest to southeast in the central part of the desert, surrounded by simple barchans. Linear dunes were located in the eastern part of the desert, and were distributed parallel to the barchans and barchan chains. In the southern and southeastern parts of the desert, extensive parabolic dunes and shrub dunes occur.
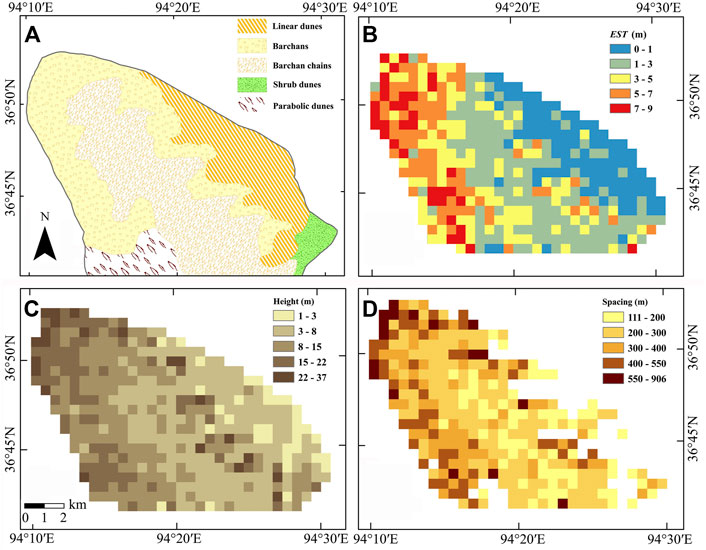
FIGURE 11. Maps of the (A) dune distribution, (B) equivalent sand thickness (EST), (C) dune crest height, and (D) crest to crest dune spacing for area A3 (Figure 1).
EST ranged from 0 to 9 m, averaged 3.6 m, and decreased gradually from northwest and west to east. Based on the prevailing wind directions (Figure 5) and the geomorphology, the main sources of regional sediments are probably sediments from the Dazaohuo River. EST was relatively large for the barchans and barchan chains, which means that the sand supply is relatively abundant. In contrast, EST for the linear dunes was much smaller, and ranged from 0 to 3 m.
Dune height in area A3 ranged from 1 to 37 m, with an average height of about 9.84 m. The mean dune height for the barchan chains (12.86 m) was higher than that of the barchans (10.28 m), and the linear dunes had the lowest mean height (4.78 m). Dune spacing ranged from 111 to 906 m, and avenged 316.9 m. The dune height and spacing appeared to follow spatial patterns similar to those for dune height; that is, dunes with greater height were more widely spaced.
Sand supply is also a crucial factor that determines which dune types will evolve. Table 3 shows that the three areas where linear dunes and barchans coexist have low EST, but that the different dune types had different sand supplies. Except for A2, where we did not find barchan chains, the EST was greater for barchan chains than for barchans, and linear dunes had the smallest EST in all three areas. From the barchans to the linear dunes, EST decreases greatly; that is, the sand supply decreases greatly. Generally speaking, the linear dunes appear to have developed under a low sediment supply. The sand supply in the linear dune area is extremely low, with an EST only half of the value for the barchans and one-quarter of the value for barchan chains. The distribution of EST for three areas (Figure 12) also shows that the EST of linear dunes with the lowest value compared with barchan dunes and barchan chains, and present concentrated distribution, the value less than 1.5 count for 75%.
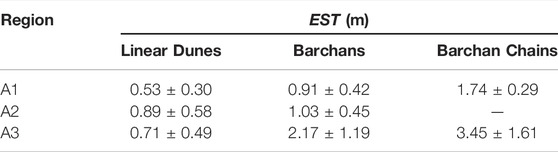
TABLE 3. The equivalent sand thickness (EST) for the different dune types.
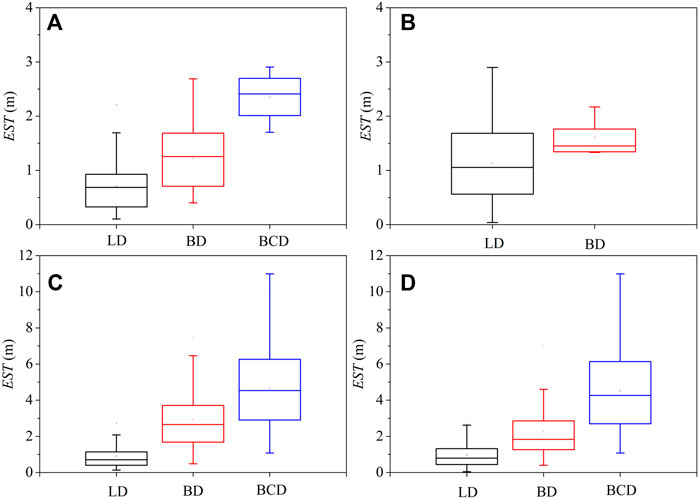
FIGURE 12. Distribution characteristics of EST for area A1 (A), A2 (B), A3 (C), and all three areas (D). LD, linear dunes; BD, barchan dunes; BCD, barchan chain dunes.
We designed the present study to provide a quantitative explanation for the coexistence of barchans and linear dunes in China’s Qaidam Basin. We measured dune morphology, and analyzed the wind regime using data provided by a wind station in areas where the two dune types coexist, and quantified their sand supply using EST to investigate the effect of this variable on coexistence of the barchan and linear dunes. Our ultimate goals were to characterize the development environment in areas where the dunes coexist, and quantify the sand supply using EST to explore how the wind regime and sand supply together affect coexistence of the barchans and linear dunes.
Dune morphology is shaped by the wind, sand supply, vegetation, topography, and other factors (J. Li et al., 2016). The primary dune types in our study area were barchans and linear dunes, scarcely compound dunes. Simple dune types suggest that there is no stable sand supply large enough to support dune growth and evolution to produce more complex dunes (Bullard et al., 2011; Kocurek et al., 1992). The dune heights of the barchans and linear dunes in our study area were relatively low, which might indicate that a low sand supply constrains dune growth. The relationship between height and spacing reflects the combined effects of the local wind conditions, richness of the sand supply, and dynamic processes (Baddock et al., 2007; Dong et al., 2009; Dong et al., 2010; Lancaster, 1995; Lü et al., 2017). Where the dune height increases faster than the dune spacing, this indicates a tendency for vertical growth of the dunes that is permitted by an abundant sand supply (Lancaster, 1988). The large exponent in the height–spacing relationship for barchans (1.14) may reflect an abundant sand supply, whereas the smaller exponent for linear dunes (0.48) may reflect limitation of the dune size by the low availability of sand. However, the goodness of fit for the height–spacing relationship for linear dunes was only 0.34. This support, but does not prove, our hypothesis that the sand supply was more limited for the linear dunes than for the barchans.
Wind regime is the primary factor that controls dune formation, as the wind drives sand transport and controls the direction of dune movement (Lancaster, 1995; Z. Zhang et al., 2017; Zu et al., 2008). Previous research shows that barchans develop under a unimodal wind regime, whereas linear dunes develop under a narrowly bimodal wind regime (Fryberger and Dean, 1979; Livinstone and Warren, 1996; Wasson and Hyde, 1983). Barchans and linear dunes can generally coexist when the divergence angle between the two wind directions approaches 90° (Gadal et al., 2019; Reffet et al., 2010). In the Qaidam Basin, the orientation of the linear dunes was parallel to the sand-driving wind direction, whereas the orientation of the barchans was almost perpendicular to the wind direction (Figure 13). The wind rose for sand-driving wind showed an obvious primary wind direction from the west-northwest (30.9%) and another from the northwest (30.8%), there is a narrowly bimodal wind regime with low directional variability (an overall mean RDP/DP value of 0.82 and RDD values of 123°–136°; Figure 6). The resultant drift direction in our areas were stable throughout the year. This wind regime always corresponding to barchans according to traditional theory, which indicate that sand availability or other factors might play a key role of the barchan and linear dunes coexist in the Qaidam basin desert.
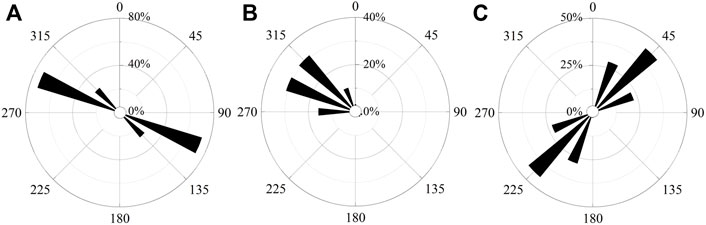
FIGURE 13. Probability distributions for the orientation of the (A) linear dunes, (B) sand-driving wind, and (C) barchans.
Sand supply is an essential factor for understanding the geomorphological characteristics of dunes, it is also inextricably bound up with concepts, such as sediment availability, EST, and sediment supply models (Hugenholtz and Barchyn, 2010). Combine with the wind regime, sand supply or sediment availability for transport control both the dune type and the dune orientation (Courrech du Pont et al., 2014; Gao et al., 2018; Gao et al., 2015; Lü et al., 2018). When the sand availability is stable, dunes grow in height and migrate to create an orientation that maximizes the components of transport that are normal (perpendicular) to the crest. In our study area, barchan chains developed in area where there is the largest equivalent sand thickness. When the sand supply is limited, barchans and linear dunes can coexist under a bidirectional wind (Gao et al., 2015; Lü et al., 2018). Our findings show that there are sediment-starved regions in our study area with low equivalent sand thickness. Limited sand supply controled barchan and linear dunes coexist. Besides this, our investigation shows that EST gradually decreased along the sequence from barchan chains to barchans and linear dunes (Table 3), and dunefields dominated by linear dunes occurred at the lowest EST values. We proposed that under unidirectional wind regime, barchan chains develped in the central of dune field with high sediment availability. With the decreased sand availability, linear dunes extend downwind from barchans originate possibly from their wake as sediment availability (EST) drops, and sand will accumulate in the lee of the localized sand source. Meanwhile, this linear dune stabilized by downwind accumulation of salts and mud, as explained by Rubin and Hesp (2009), allowing the dune itself to function as an obstacle that induces subsequent deposition farther downwind, and become aligned with the sand transport.
Although we did not study a wide range of conditions for dune fields where barchans and linear dunes coexist in other sand seas due to limited availability of high-resolution terrain data, our results suggest that a limited sand supply is an important factor responsible for the coexistence of these dunes.
In this study, we described the conditions under which barchans and linear dunes coexist in the Qaidam Basin, and explored the effects of wind regime and sand supply on dune formation and coexistence.
The morphology of the barchans and linear dunes revealed a relatively low mean dune height. The relationship between dune height and spacing was strong for barchans, but although the relationship was significant for the linear dunes, it was much weaker. The wind regime was narrowly bimodal, with low directional variability, and the threshold wind distribution showed obvious primary winds from the west-northwest (30.9%) and northwest (30.8%). This combination led to sand transport from northwest to southeast (RDD = 126°), and the linear dunes elongated and moved parallel to RDD. EST was greatest for the barchan chains, followed by the barchans, and both dune types had much larger EST than the linear dunes. In the linear dune fields, the sand supply was extremely low relative to the other dune fields, so sand will accumulate in the lee of the sand source. The linear dunes then develop by elongating at the downwind end and become aligned with the sand transport direction. In summary, under a unimodal wind regime or a bimodal wind regime with an acute angle between the dominant wind directions, coexistence of the two dune types appears to result from a deficient sand supply, although this may interact with the presence of topographical barriers or with the sand’s salt, silt, and clay contents, which affect the cohesiveness of the sand supply. These conditions cause the linear dunes to extend parallel to the RDD, whereas in adjacent areas with higher EST, there is enough sand for barchans to form and migrate parallel to the RDD.
The original contributions presented in the study are included in the article/Supplementary Material, further inquiries can be directed to the corresponding author.
LP and MF designed the research. MF carried out the field measurements, data analysis and wrote the manuscript. LP, MF and CM discussed the result.
This study was financially supported by the National Natural Science Foundation of China (41871011) and the Fundamental Research Funds for the Central Universities of China (2020TS101).
The authors declare that the research was conducted in the absence of any commercial or financial relationships that could be construed as a potential conflict of interest.
All claims expressed in this article are solely those of the authors and do not necessarily represent those of their affiliated organizations, or those of the publisher, the editors and the reviewers. Any product that may be evaluated in this article, or claim that may be made by its manufacturer, is not guaranteed or endorsed by the publisher.
Andreotti, B., Claudin, P., and Pouliquen, O. (2010). Measurements of the Aeolian Sand Transport Saturation Length. Geomorphology 123 (3-4), 343–348. doi:10.1016/j.geomorph.2010.08.002
Baas, A. C. W. (2007). Complex Systems in Aeolian Geomorphology. Geomorphology 91 (3-4), 311–331. doi:10.1016/j.geomorph.2007.04.012
Baddock, M. C., Livingstone, I., and Wiggs, G. F. S. (2007). The Geomorphological Significance of Airflow Patterns in Transverse Dune Interdunes. Geomorphology 87 (4), 322–336. doi:10.1016/j.geomorph.2006.10.006
Bullard, J. E. (1997). A Note on the Use of the "Fryberger Method" for Evaluating Potential Sand Transport by Wind. J. Sediment. Res. 67 (3), 499–501. doi:10.1306/D42685A9-2B26-11D7-8648000102C1865D
Bullard, J. E., White, K., and Livingstone, I. (2011). Morphometric Analysis of Aeolian Bedforms in the Namib Sand Sea Using ASTER Data. Earth Surf. Process. Landforms 36 (11), 1534–1549. doi:10.1002/esp.2189
Claudin, P., and Andreotti, B. (2006). A Scaling Law for Aeolian Dunes on Mars, Venus, Earth, and for Subaqueous Ripples. Earth Planet. Sci. Lett. 252 (1-2), 30–44. doi:10.1016/j.epsl.2006.09.004
Courrech du Pont, S., Narteau, C., and Gao, X. (2014). Two Modes for Dune Orientation. Geology 42 (9), 743–746. doi:10.1130/g35657.1
Dong, Z., Qian, G., Luo, W., Zhang, Z., Xiao, S., and Zhao, A. (2009). Geomorphological Hierarchies for Complex Mega-Dunes and Their Implications for Mega-Dune Evolution in the Badain Jaran Desert. Geomorphology 106 (3-4), 180–185. doi:10.1016/j.geomorph.2008.10.015
Dong, Z., Wei, Z., Qian, G., Zhang, Z., Luo, W., and Hu, G. (2010). "Raked" Linear Dunes in the Kumtagh Desert, China. Geomorphology 123 (1-2), 122–128. doi:10.1016/j.geomorph.2010.07.005
Duran Vinent, O., Andreotti, B., Claudin, P., and Winter, C. (2019). A Unified Model of Ripples and Dunes in Water and Planetary Environments. Nat. Geosci. 12 (5), 345–350. doi:10.1038/s41561-019-0336-4
Fryberger, S. G., and Dean, G. M. (1979). “Dune Forms and Wind Regime,” in A Study of Global Sand Seas. Editors E. D. McKee (Washington, DC: U.S. Government Printing Office)
Gadal, C., Narteau, C., Courrech du Pont, S., Rozier, O., and Claudin, P. (2019). Incipient Bedforms in a Bidirectional Wind Regime. J. Fluid Mech. 862, 490–516. doi:10.1017/jfm.2018.978
Gadal, C., Narteau, C., Ewing, R. C., Gunn, A., Jerolmack, D., Andreotti, B., et al. (2020). Spatial and Temporal Development of Incipient Dunes. Geophys. Res. Lett. 47 (16), e2020GL088919. doi:10.1029/2020gl088919
Gao, X., Gadal, C., Rozier, O., and Narteau, C. (2018). Morphodynamics of Barchan and Dome Dunes under Variable Wind Regimes. Geology 46 (9), 743–746. doi:10.1130/g45101.1
Gao, X., Narteau, C., Rozier, O., and du Pont, S. C. (2015). Phase Diagrams of Dune Shape and Orientation Depending on Sand Availability. Sci. Rep. 5, 14677. doi:10.1038/srep14677
Hereher, M. E. (2018). Geomorphology and Drift Potential of Major Aeolian Sand Deposits in Egypt. Geomorphology 304, 113–120. doi:10.1016/j.geomorph.2017.12.041
Hesp, P. A., and Hastings, K. (1998). Width, Height and Slope Relationships and Aerodynamic Maintenance of Barchans. Geomorphology 22 (1998), 193–204. doi:10.1016/S0169-555X(97)00070-6
Hugenholtz, C. H., and Barchyn, T. E. (2010). Spatial Analysis of Sand Dunes with a New Global Topographic Dataset: New Approaches and Opportunities. Earth Surf. Process. Landforms 35 (8), 986–992. doi:10.1002/esp.2013
Hunter, R. E., Richmond, B. M., and Rho Alpha, T. (1983). Storm-controlled Oblique Dunes of the Oregon Coast. Geol. Soc. America Bull. 94, 1450–1465. doi:10.1130/0016-7606(1983)94<1450:sodoto>2.0.co;2
Kocurek, G., Townsley, M., Yeh, E., Havholm, K. G., and Sweet, M. L. (1992). Dune and Dune-Field Development on Padre Island, Texas, with Implications for Interdune Deposition and Water-Table-Controlled Accumulation. Sepm Jsr 62 (4), 622–635. doi:10.1306/D4267974-2B26-11D7-8648000102C1865D
Lancaster, N. (1981). Grain Size Characteristics of Namib Desert Linear Dunes. Sedimentology 28, 115–122. doi:10.1111/j.1365-3091.1981.tb01668.x
Lancaster, N. (1988). Controls of Eolian Dune Size and Spacing. Geol 16 (11), 972–975. doi:10.1130/0091-7613(1988)016<0972:coedsa>2.3.co;2
Lancaster, N. (1995). Geomorphology of Desert Dunes. Routledge, London: Geomorphology of Desert Dunes.
Lancaster, N. (2006). Linear Dunes on Titan. Science 312 (5774), 702–703. doi:10.1126/science.1126292
Li, C., Dong, Z., Chen, G., Yang, J., Cui, X., and Li, J. (2018). Qaidam Basin as an Analog for Linear Dune Formation in Chasma Boreale, Mars: A Comparative Analysis. Geomorphology 322, 29–40. doi:10.1016/j.geomorph.2018.08.033
Li, C., Dong, Z., Yin, S., Chen, G., and Yang, J. (2019). Influence of Salinity and Moisture on the Threshold Shear Velocity of saline Sand in the Qarhan Desert, Qaidam Basin of China: A Wind Tunnel experiment. J. Arid Land 11, 674–684. doi:10.1007/s40333-019-0058-x
Li, J., Dong, Z., Qian, G., Zhang, Z., Luo, W., Lu, J., et al. (2016). Pattern Analysis of a Linear Dune Field on the Northern Margin of Qarhan Salt Lake, Northwestern China. J. Arid Land 8 (5), 670–680. doi:10.1007/s40333-016-0052-5
Livinstone, I., and Warren, A. (1996). Aeolian Geomorphology: An Introduction. England: Addison Wesley Longman
Lorenz, R. D., and Zimbelman, J. R. (2014). Dune Worlds: How Windblown Sand Shapes Planetary Landscapes. Heidelberg: Springer Science & Business Media.
Lü, P., Dong, Z., and Rozier, O. (2018). The Combined Effect of Sediment Availability and Wind Regime on the Morphology of Aeolian Sand Dunes. J. Geophys. Res. Earth Surf. 123, 2878–2886. doi:10.1029/2017JF004361
Lü, P., Narteau, C., Dong, Z., Rozier, O., and Courrech du Pont, S. (2017). Unravelling Raked Linear Dunes to Explain the Coexistence of Bedforms in Complex Dunefields. Nat. Commun. 8, 14239. doi:10.1038/ncomms14239
Lucas, A., Narteau, C., Rodriguez, S., Rozier, O., Callot, Y., Garcia, A., et al. (2015). Sediment Flux from the Morphodynamics of Elongating Linear Dunes. Geology 43 (11), 1027–1030. doi:10.1130/g37101.1
Ma, F., and Lü, P. (2019). Wind Regime in Coexisting Region of Barchan and Linear Dunes. J. Desert Res. 39 (3), 98–106. doi:10.7522/j.issn.1000-694X.2018.00072
Parteli, E. J. R., and Herrmann, H. J. (2007). Dune Formation on the Present Mars. Phys. Rev. E 76 (4 Pt 1), 041307. doi:10.1103/PhysRevE.76.041307
Reffet, E., Courrech du Pont, S., Hersen, P., and Douady, S. (2010). Formation and Stability of Transverse and Longitudinal Sand Dunes. Geology 38 (6), 491–494. doi:10.1130/g30894.1
Rubin, D. M., and Hesp, P. A. (2009). Multiple Origins of Linear Dunes on Earth and Titan. Nat. Geosci 2 (9), 653–658. doi:10.1038/ngeo610
Rubin, D. M., and Rubin, A. M. (2013). Origin and Lateral Migration of Linear Dunes in the Qaidam Basin of NW China Revealed by Dune Sediments, Internal Structures, and Optically Stimulated Luminescence Ages, with Implications for Linear Dunes on Titan: Discussion. Geol. Soc. America Bull. 125 (11-12), 1943–1946. doi:10.1130/b30780.1
Wasson, R. J., and Hyde, R. (1983). Factors Determining Desert Dune Type. Nature 304 (5924), 337–339. doi:10.1038/304337a0
White, K., Bullard, J., Livingstone, I., and Moran, L. (2015). A Morphometric Comparison of the Namib and Southwest Kalahari Dunefields Using ASTER GDEM Data. Aeolian Res. 19, 87–95. doi:10.1016/j.aeolia.2015.09.006
Yu, L., and Lai, Z. (2014). Holocene Climate Change Inferred from Stratigraphy and OSL Chronology of Aeolian Sediments in the Qaidam Basin, Northeastern Qinghai-Tibetan Plateau. Quat. Res. 81 (3), 488–499. doi:10.1016/j.yqres.2013.09.006
Zhang, D., Narteau, C., and Rozier, O. (2010). Morphodynamics of Barchan and Transverse Dunes Using a Cellular Automaton Model. J. Geophys. Res. 115 (F3041). doi:10.1029/2009jf001620
Zhang, Z., Dong, Z., and Li, C. (2015). Wind Regime and Sand Transport in China's Badain Jaran Desert. Aeolian Res. 17, 1–13. doi:10.1016/j.aeolia.2015.01.004
Zhang, Z., Dong, Z., Qian, G., Li, J., Luo, W., and Tyrrell, S. (2017). Formation and Development of Dunes in the Northern Qarhan Desert, central Qaidam Basin, China. Geol. J. 53, 1123–1134. doi:10.1002/gj.2947
Zhou, J., Zhu, Y., and Yuan, C. (2012). Origin and Lateral Migration of Linear Dunes in the Qaidam Basin of NW China Revealed by Dune Sediments, Internal Structures, and Optically Stimulated Luminescence Ages, with Implications for Linear Dunes on Titan. Geol. Soc. America Bull. 124 (7-8), 1147–1154. doi:10.1130/b30550.1
Keywords: equivalent sand thickness, sand supply, qaidam basin, linear dunes, barchan dunes, coexisting, wind regime
Citation: Ma F, Lü P and Cao M (2022) The Effects of Wind Regime and Sand Supply on the Coexistence of Barchans and Linear Dunes in China’s Qaidam Basin. Front. Earth Sci. 10:897640. doi: 10.3389/feart.2022.897640
Received: 16 March 2022; Accepted: 11 April 2022;
Published: 27 April 2022.
Edited by:
Zhuolun Li, Lanzhou University, ChinaReviewed by:
Kecun Zhang, Northwest Institute of Eco-Environment and Resources (CAS), ChinaCopyright © 2022 Ma, Lü and Cao. This is an open-access article distributed under the terms of the Creative Commons Attribution License (CC BY). The use, distribution or reproduction in other forums is permitted, provided the original author(s) and the copyright owner(s) are credited and that the original publication in this journal is cited, in accordance with accepted academic practice. No use, distribution or reproduction is permitted which does not comply with these terms.
*Correspondence: Ping Lü, bHZwaW5nQHNubnUuZWR1LmNu
Disclaimer: All claims expressed in this article are solely those of the authors and do not necessarily represent those of their affiliated organizations, or those of the publisher, the editors and the reviewers. Any product that may be evaluated in this article or claim that may be made by its manufacturer is not guaranteed or endorsed by the publisher.
Research integrity at Frontiers
Learn more about the work of our research integrity team to safeguard the quality of each article we publish.