 Xiangsheng Bao
 Tianyu Luo
 Huadong Li2
- 1School of Petroleum Engineering, Guangdong University of Petrochemical Technology, Maoming, China
- 2Research Institute of Petroleum Geophysical Exploration Technology, Sinopec, Nanjing, China
- 3National Engineering Laboratory for Offshore Oil Exploration, Beijing, China
It has been predicted that China has about 80 billion tons of oil equivalent of natural gas hydrate resources in its sea. China has conducted at least six drilling and two trial exploitations in the South China Sea, achieving good results. However, these achievements do not necessarily mean that the research area can support commercial exploitation. Only when the natural gas hydrate resources in the research area reach a certain scale will it be valuable for commercial exploitation. A reliable quantitative prediction method is necessary to clarify the scale of gas hydrate in the research area. However, the classical Wood method’s application to the prediction of suspended hydrate saturation in the Shenhu maritime area of China results in a large prediction error; the analysis shows that an unreliable measurement of reservoir parameters is the main reason for the large prediction error. In order to clarify the influence of reservoir parameters, this paper—by analyzing the measurement sources of the parameters of reservoir parameters, firstly indicates that the inaccurate measurement of three reservoir parameters—matrix composition, porosity, and density—is the main cause of prediction error. Then, using the design of different reservoir parameter measurement schemes to conduct comparative analysis, this paper points out that unreliable porosity and density measurement may lead to large prediction errors, while unreliable measurements of matrix composition have a relatively small impact on prediction accuracy. Further analysis shows that the absolute value of the prediction error caused by uncertainty in synthetic reservoir parameter measurement is sometimes larger than the sum of the absolute prediction error caused by the single parameter measurement uncertainty. In addressing the problem of large prediction errors caused by the inaccurate measurement of reservoir parameters, this paper proposes a hydrate saturation prediction method based on non-hydrate correction—called the “Wood-Bao method”. Simulation and actual data studies show that the prediction effect of this method is superior to that of the Wood method.
1 Introduction
Gas hydrate will be the best potential clean energy alternative to conventional oil and gas in the 21st century (Liang et al., 2009; Zou et al., 2014; Uma, 2016; Joshi et al., 2019). Due to its great resource potential, it has attracted a high level of attention from the United States, China, Canada, India, Japan, and other countries (Joshi et al., 2019; Ye et al., 2020). Japan conducted trial mining in its South China Sea Trough in 2013 (Zhou et al., 2014; Ye et al., 2020) and successfully extracted methane from submarine combustible ice, thus becoming the first country in the world to master submarine combustible ice mining technology. Natural gas hydrate resources are also abundant in China’s seas and are estimated to be about 80 billion tons oil equivalent (Guan, 2018). To promote commercial hydrate mining as soon as possible, China has carried out much exploration and trial mining work in its sea area. For example, over 2007–2021, Guangdong Marine Geological Survey conducted six drilling investigations on the eastern Pearl River Mouth Basin, the Xisha Sea Area, the Shenhu Sea Area, and other areas (Sha et al., 2015; Wei et al., 2018, Wei et al., 2019, Zhang et al., 2015; Huang et al., 2021), In 2017 and 2019, China conducted two successful mining trials of natural gas hydrate in the Shenhu area of the South China Sea. These projects have greatly accelerated the commercialization process of natural gas hydrate in China, which is of great significance in promoting green development and ensuring the energy security of China. However, the successful sampling and trial mining of hydrate does not mean that a region’s hydrate resources conform to the degree necessary for commercial mining. In order to achieve a level of commercial exploitation, the most important thing—in addition to the requirements of exploitation technology—is whether the area has enriched gas hydrate and that the degree of enrichment justifies commercial exploitation. At present, many methods are used to understand the degree of hydrate enrichment in sea areas. From the perspective of quantification, the methods used to characterize the degree of gas hydrate enrichment are qualitative prediction methods, semi-quantitative prediction methods, and quantitative prediction methods (Bao et al., 2018). For example, methods such as BSR (Su et al., 2013), amplitude blank band (Zeng and Yang, 2013), and speed abnormality (Zhang et al., 2014) are qualitative prediction methods. The BSR and hydrate stability zone identification method (Sean et al., 2014), the seismic attribute-based identification method (Zeng and Yang, 2013; Zhang et al., 2014), and the AVO attribute-based identification method (Yang et al., 2011) are semi-quantitative prediction methods (Bao et al., 2018). Hydrate saturation prediction methods based on the Timur equation, the Wood modified equation, the Gassmann equation, and the three Boit equations (Song et al., 2001; Lee and Waite, 2008) are quantitative prediction methods. Compared with qualitative and semi-quantitative prediction methods, quantitative prediction methods can more clearly indicate the enrichment of hydrate resources in a region. In conventional oil and gas exploration and development, as conditions permit, quantitative prediction methods are necessary to determine geological reserves in order to guide exploration and development deployment, and reduce the risks associated with exploration and development. Quantitative prediction methods should also be used to help determine geological reserves of hydrate before the commercial exploration and development of sea hydrate, clarifying the degree of hydrate enrichment in the study area. In a sea hydrate reservoir, hydrate is usually distributed in three microscopic modes: cementation, contact, and suspension (Priest et al., 2005; 2009; Best et al., 2013; Hu et al., 2014). Hu et al. ( 2014) used a high-resolution CT in situ detection device to conduct detailed research on the occurrence of hydrate at different saturations; they observed that, when the saturation is mainly between 20% and 50%, the hydrate in the pores exists in a suspension mode. For hydrate reservoirs in a suspension mode, Lee et al. (1993) and Song (2003) propose the Wood equation-based method (“Wood method” for short) as the most suitable method of predicting this type of hydrate saturation.
For the main hydrate layers in Well S in the Shenhu maritime area of China, the hydrate saturation (often called true saturation) calculated by the chloride ion method is 20% – 50% (Zhang et al., 2007). Based on the reservoir parameters obtained from the research results of Guo et al. (2011) and Chen et al. (2011), the Wood method was used to predict hydrate saturation in Well S. However, there was a large difference between the predicted results and the hydrate saturation calculated by the chloride ion method (Figure 1). Practical application analysis shows that the theory is not adaptable in practical application, making it necessary to analyze the reasons for the inadaptability of the theory in practical application and thus improving and devising a more practical prediction method of hydrate saturation. This paper addresses the problem of the poor effect of the Wood method in practical application and will thus thoroughly analyze the effect of reservoir parameter changes on hydrate saturation to form a practical hydrate saturation prediction method for sea suspension mode hydrate prediction.
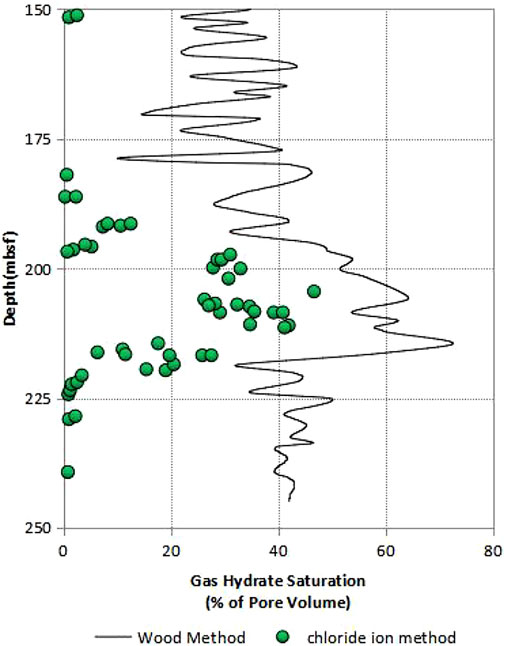
FIGURE 1. Comparison of natural gas hydrate saturation predicted by Wood method and that calculated by chloride ion method.
2 Methods
2.1 Analysis method of the influence of reservoir parameter change on hydrate saturation prediction
In 1941, Wood proposed the Wood equation for estimating p-wave velocity (Wood, 1941). The equation can be used to approximate the velocity of sediment in which particles exist in a suspended pattern in pores. The equation can be expressed by Formula 1:
where
Later, researchers constructed three-phase Wood equations including hydrate on the basis of two-phase Wood equations (Lee et al., 1996), which could be expressed by Formula 2
where
2.2 A method for hydrate saturation prediction based on pseudo-saturation correction of non-hydrate layer
Lee et al. (1996) also realized that, because reliable matrix velocity is difficult to accurately obtain in practice, the three-phase Wood equation has a low prediction accuracy in actual saturation prediction. To solve this problem, a new weighted equation (called the “Lee weighted equation”) is proposed, based on the combination of the three-phase Timur equation and three-phase Wood equation. However, this equation involves a weighted factor W and constant N; these two parameters are difficult to determine, making it difficult to generalize in practice.
Based on the analysis and research on the influence of reservoir parameter changes on hydrate saturation, this paper proposes a prediction method that is more easily generalizable and has high prediction accuracy. This method overcomes the difficulty in determining the weighting factor W and constant N of the Lee weighted equation. In using this method, it is necessary to ensure that there is a similar sedimentary layer without hydrate above the hydrate layer. The method can predict hydrate saturation through these five steps.
The first step is data preparation. The specific data include: ① the proportion of matrix minerals; ② elastic parameter data, such as volume modulus, shear modulus and density of sediment matrix minerals, volume modulus and density of seawater, volume modulus, and shear modulus and density of pure hydrate; ③ well data (which must be continuous and include the non-hydrate layer above the hydrate layer), such as the depth of the sediment, p-wave velocity, porosity, and density.
The second step is to calculate the pseudo-hydrate saturation of each depth of the non-hydrate layer. The saturation is calculated by using the three-phase Wood as shown in Formula 3:
where
The third step is to calculate the average pseudo-hydrate saturation of the non-hydrate layer. The average pseudo-hydrate saturation is represented by
The fourth step to calculate the hydrate saturation correction. The calculation of
The fifth step is to calculate the initial saturation of each depth point of hydrate layer. The saturation is also calculated by using Wood ternary equations, as shown in Formula 6:
where
The sixth step is to calculate the saturation of each depth point of the final hydrate layer. Assuming that the hydrate saturation at each depth is represented by
For ease of description, this method of predicting hydrate saturation is called the “Wood-Bao method”.
3 Results
3.1 Influence of reservoir parameter variation on hydrate saturation prediction
According to Formula 2, the reservoir parameters involved in the formula include velocity, density, porosity, and hydrate saturation. The velocity parameters include the velocity of hydrate sediments, seawater, pure hydrate, and matrix. The density parameters include the density of hydrate sediments, seawater, pure hydrate, and matrix. However, the velocity of hydrate-bearing sediments, seawater, and pure hydrate, as well as the density of seawater and pure hydrate, can be accurately obtained by certain methods. Therefore, this paper does not discuss the influence of these parameter changes on the prediction of hydrate saturation. The velocity and density of the matrix are determined by the matrix mineral composition. The measurement of the matrix mineral composition is mainly represented by the X-ray method (Guo et al., 2011); the reservoir porosity and the density of the hydrated layer can be determined in the laboratory and by logging (Guo et al., 2011; Guo et al., 2017). It is relatively difficult to accurately measure the composition of matrix, porosity, and the density of hydrate-bearing sediments, so this paper focuses on the prediction of hydrate saturation influenced by the variation of matrix composition, porosity, and the density of hydrate-bearing sediments.
The reservoir parameters used in the research are established by reference to the existing rock physics data and measurement data in the Shenhu sea area of China. It is assumed that the hydrate saturation and porosity of the reservoir are 45% and 40%, respectively. Regarding matrix composition, this paper is constructed on the basis of the research results of Guo et al. (2011), who observe that the minerals composed of sediments near the Shenhu hydrate layer mainly include quartz, feldspar, calcite, Muscovite, and clay minerals (Figure 2). It can also be seen from Figure 2 that the mineral composition of the non-hydrate layer above the hydrate is similar to that of the hydrate layer. Due to the lack of rock physics data for Muscovite minerals, Muscovite is not considered as a component of matrix in this study. Table 1 shows the composition of sediment matrix for comparison. In this paper, the matrix composition consists of four minerals, and the specific matrix composition and proportion are shown in Table 1. In this paper, the volume modulus, shear modulus and density parameters of matrix composition minerals, seawater, pure hydrate and other substances must be used; the specific data of these parameters are given in Table 2.
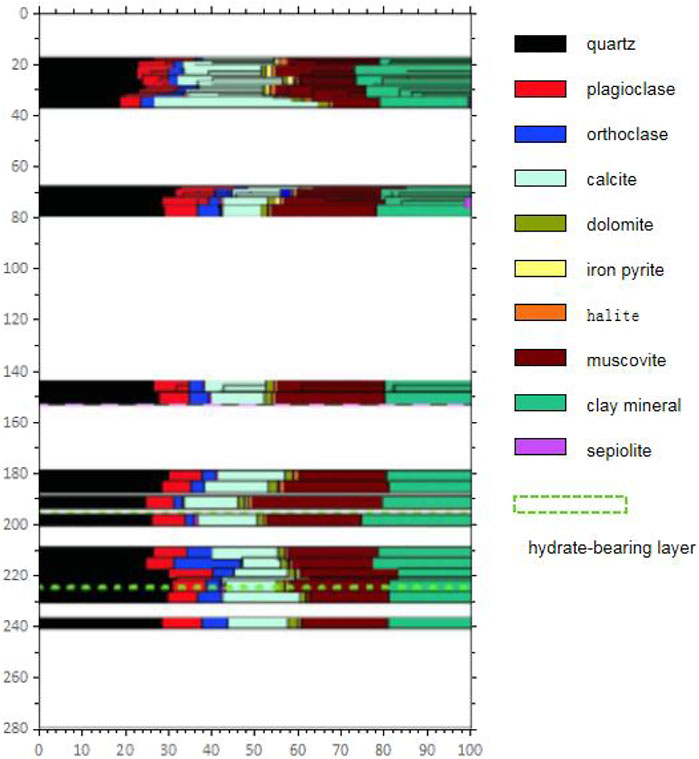
FIGURE 2. Vertical section change of sediment mineral composition and content.
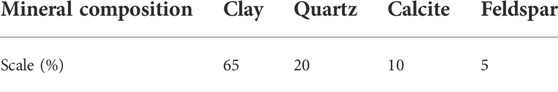
TABLE 1. The proportion of minerals that make up the sediment.

TABLE 2. Elastic parameters of substances (Song,et al., 2001; Guo et al., 2011).
The volume modulus K and shear modulus G of the matrix can be calculated according to the average formula of Hill (Helgerud et al., 1999), and the specific formula is shown in Eqs 8, 9:
where
The elastic parameters of the matrix and several essential substances are included in Table 2. Taking the data in Tables 1, 2 into Eqs 8, 9, the volume modulus K and shear modulus G of the matrix are approximated as 29.08 and 13.93 GPa, respectively. The P-wave velocity of the matrix can be calculated by Formula 10:
The density
where
The density of the matrix is 2.6135 g/cm3 according to Table 2 and Formula 11. According to Formula 10, the P-wave velocity of the matrix is approximately 4,270.27 m/s.
The P-wave velocity of seawater and pure methane hydrate can also be calculated using Formula 10. Entering the data in Table 2 into Formula 10, the velocities of seawater and pure methane hydrate are approximately 1,556.43 and 3,126.94 m/s, respectively. By putting the previously known data and the data provided in Table 2 into Formula 11, the density of hydrate-bearing sediment is 1.95714 g/cm3. In Formula 2, the velocity of hydrate sediment is 2054.55 m/s.
3.1.1 Effect of matrix composition variation on hydrate saturation prediction
It is assumed that there are four matrix composition measurement schemes, and the absolute error between matrix composition proportion of different schemes and Table 1 is controlled at [−10%, 10%]. The specific matrix composition proportion of each scheme is shown in Table 3. By substituting the data in Tables 2, 3 into Eqs 8–11, the corresponding volume modulus, shear modulus, and density and velocity of the matrix in each scheme can be calculated, as shown in Table 4. By substituting the data in Table 4 and other known reservoir parameters into Formula 2, the hydrate saturation corresponding to each scheme can be calculated (see Table 5).
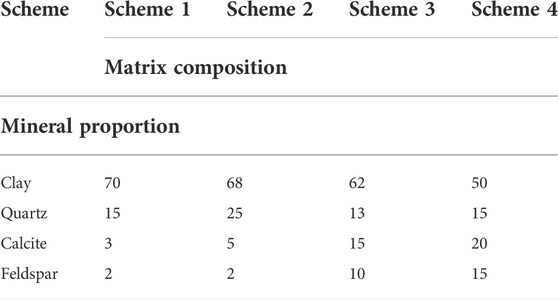
TABLE 3. The proportion of matrix composition minerals in different schemes.
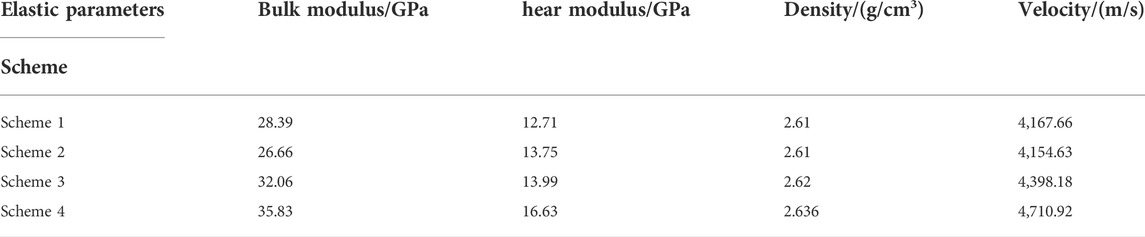
TABLE 4. Elastic parameters of matrices in different schemes.
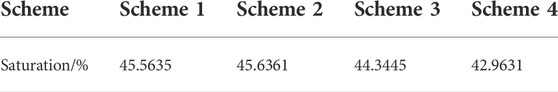
TABLE 5. Hydrate saturation prediction results for different protocols.
3.1.2 Effect of porosity variation on hydrate saturation prediction
Here, it is also assumed that there are four porosity measurement schemes; the absolute error of the porosity measured by different schemes is controlled at [−10%, 10%]. The specific porosity of each scheme is shown in Table 6. Based on the porosity data provided in Table 6 and other known reservoir parameters, the hydrate saturation for each scheme can be calculated using Formula 2 (see Table 6).
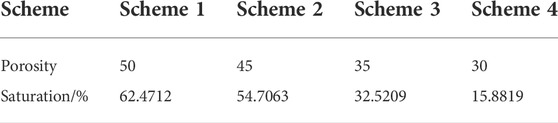
TABLE 6. Measured porosity and predicted saturation of different schemes.
3.1.3 Effect of density variation of hydrate-bearing layer on hydrate saturation prediction
It is also assumed that there are four density measurement schemes; the density measured by different schemes is controlled with the absolute error of Table 1 at [−0.2, 0.2]. The specific density of each scheme is shown in Table 7. Based on the density data provided in Table 7 and other known reservoir parameters, the corresponding hydrate saturation for each scheme can be calculated using Formula 2 (see Table 7).

TABLE 7. Measured density and predicted saturation of different schemes.
3.1.4 Effect of comprehensive reservoir parameter variation on hydrate saturation prediction
The measurement schemes of the comprehensive reservoir parameter variation are obtained by combining previous single parameter variation data. The specific matrix density, matrix velocity, porosity, and density of each scheme are shown in Table 8. Based on Table 8 and other known reservoir parameters, the corresponding hydrate saturation for each scheme is calculated using Formula 2 (see Table 8).
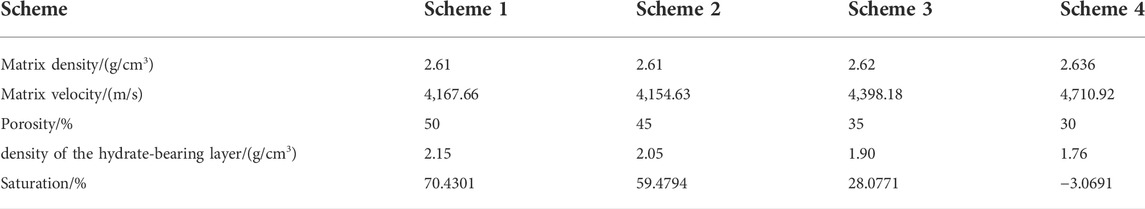
TABLE 8. Comprehensive reservoir parameters variation and predicted saturation of different schemes.
3.2 Prediction results of hydrate saturation based on the Wood-Bao method
3.2.1 Prediction comparison based on simulated data
Assuming that the original matrix of the sediments near the hydrate-bearing layer in the sea area is composed of clay and quartz, the actual proportions are 60% and 40%, respectively. Referring to the data provided in Table 2, the corresponding volume modulus, shear modulus, density and velocity of the matrix can be calculated according to Eqs 8–11, as shown in Table 9. Assuming that the porosity of the sediment near the original hydrate-bearing layer is 40%, and assuming that the original saturation in the hydrated-bearing layer is consistent at 50%, and for the non-hydrated layer above, also the mean. Taking the data in Table 2 into Formula 11, the density of hydrate-bearing sediments and non-hydrate layer sediments can be calculated, which are 1.9512 and 1.9776 g/cm3, respectively. According to Formula 2, the velocity of hydrate-bearing sediments and non-hydrate sediments can be calculated as 2,108.2 and 1711.71 m/s, respectively. It is assumed that, due to measurement error, the actual measured clay and quartz contents are 65% and 35%, respectively, the measured porosity is 36%, and the measured density of the hydrate-bearing layer and non-water layer decreases by 0.05. The matrix elastic parameters predicted based on the measured values are shown in Table 9. Based on the data in Table 9 and related data provided above, the hydrate saturation can be predicted to be 57.27% using Formula 2. If the Wood-Bao method is used to predict hydrate-bearing layer saturation, the pseudo-hydrate saturation of the non-hydrate layer can be obtained as 11.7024% first by calculation, and then the pseudo-saturation is deducted from the value obtained by the Wood method to obtain 45.57% of the hydrate saturation predicted by the Wood-Bao method.
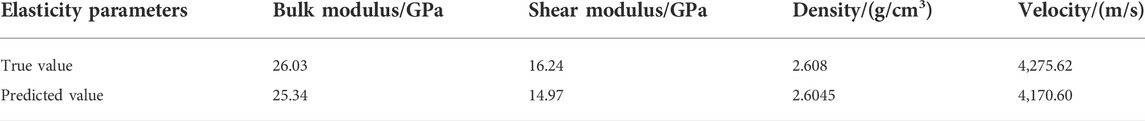
TABLE 9. Real and predicted values of the simulated matrix elasticity parameters.
3.2.2 Comparison of hydrate saturation prediction by different methods in Well S in the Shenhu sea area, China
The research area where Well S is located is located in the Shenhu sea area on the northern continental margin of the South China Sea (the red area in Figure 3) belongs structurally to the Baiyun Sag of the Pearl River Mouth Basin (Wu et al., 2009). From April to June 2007, the China Geological Survey (CGS) drilled hydrates in BSR-marked areas (red circle in Figure 4) and obtained logging data at each drilling location—Well S is one of the wells.
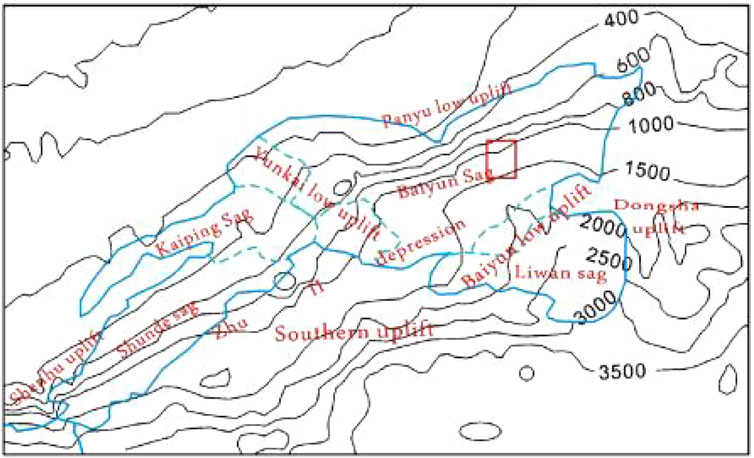
FIGURE 3. Structural location of the research area.
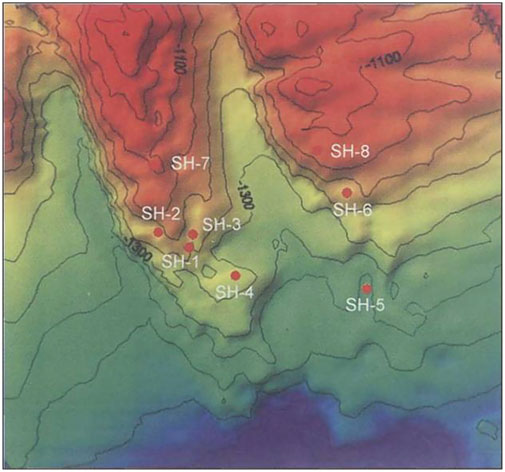
FIGURE 4. Topography of the hydrate sampling area in the Shenhu sea area of the northern South China Sea.
Figures 5, 6 show the variation of P-wave velocity and density with depth in Well S. In Figure 1, the green circle represents the hydrate saturation of Well S measured by the chloride ion method. It can be seen from Figure 1 that hydrate exists roughly 180–220 m below the seafloor of Well S, with hydrate especially abundant between 200 and 220 m. At this depth, the P-wave velocity increases significantly (as shown in Figure 5), reaching a maximum of 2,300 m/s.
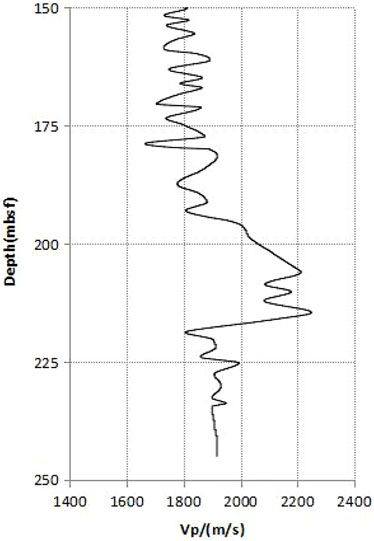
FIGURE 5. Variation of P-wave velocity with depth in Well S.
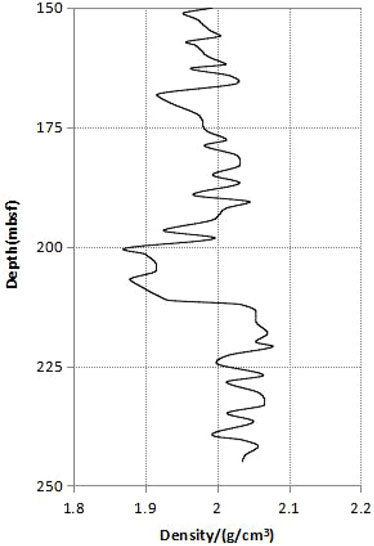
FIGURE 6. Variation of density with depth in Well S.
In addition to the P-wave velocity and density data, it is necessary to know the matrix composition and porosity near the hydrate layer in Well S, as well as some necessary elastic parameter data, so that the Wood and Wood-Bao methods can be used to predict the hydrate saturation in Well S. As for the matrix composition of this well, the aforementioned research results of Guo et al. (2011) are taken as the reference measurement values—that is, the matrix composition consists of clay, quartz, calcite, and feldspar, with their respective proportions being 65%, 20%, 10%, and 5%. Guo Yiqun et al. consider porosity at roughly 45% (Guo et al., 2011), which is used as the measuring porosity. Some necessary elastic parameter data are provided in Table 2. According to the second step of the Wood-Bao method, the pseudo-hydrate saturation of the non-hydrate layer above the hydrate layer needs to be calculated after data preparation. In this paper, the Wood method is used to obtain pseudo-hydrate saturation from the data from the 150–180 m non-hydrate layer above the hydrate layer. The pseudo-saturation range is [7%, 40%]. Based on the third step of Wood-Bao method, the pseudo-hydrate saturation of 150–180 m non-hydrate layer is averaged and the average pseudo-hydrate saturation is obtained, which is 26.37%. Based on the fourth step of the Wood-Bao method, it can be determined that the correction value
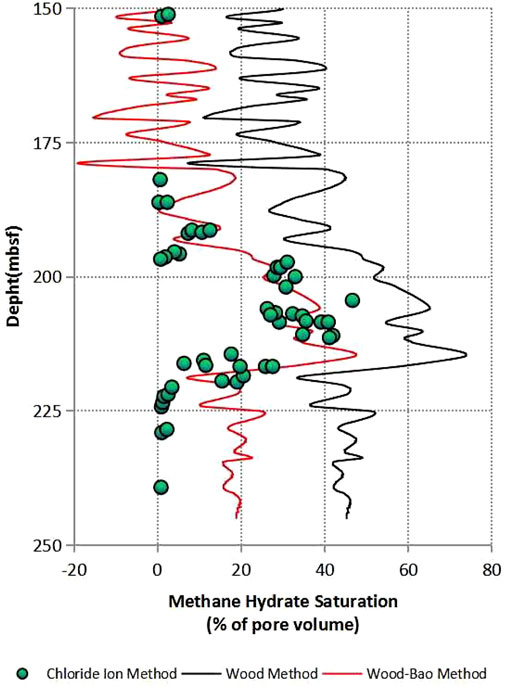
FIGURE 7. Comparison of hydrate saturations predicted by different methods.
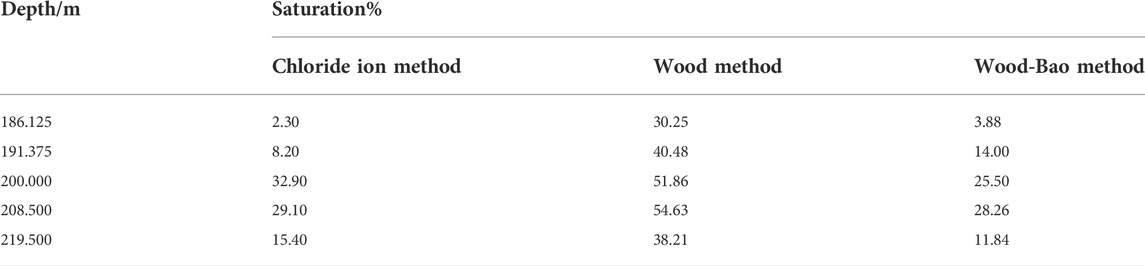
TABLE 10. Comparison of saturation obtained by three methods at different depth positions.
4 Discussion
4.1 Analysis of the effect of reservoir parameter variation on the Wood method to predict hydrate saturation
Based on the previously researched data of the effect of reservoir parameter variation on hydrate saturation prediction, this paper presents a comparison diagram of the effect of differing reservoir parameter variation on hydrate saturation prediction, as shown in Figure 8. In Figure 8, from left to right are the hydrate saturation prediction results for four categories—matrix composition, porosity, hydrate layer density, and integrated reservoir parameters—each category including the prediction results of the four schemes. Judging from Figure 8, both inaccurate matrix composition measurement, and porosity and hydrate layer density measurement will affect the accuracy of hydrate saturation prediction. The prediction of absolute error could be positive or negative, but almost close to the reservoir parameters variation. However, the prediction error from porosity variation is much larger than the matrix composition variation—for example, when the measurement porosity is 10% larger than the actual, it will result in a prediction error of nearly 17.45%, and when the measurement porosity is 10% smaller than the actual porosity, it will result in a prediction error of nearly −29.12%. The inaccurate measurement of density parameters will also result in a large prediction error. For example, when the density of the hydrate-bearing layer is 0.2 larger than the actual, the prediction error will reach about 9.48%; when the density of the hydrate-bearing layer is 0.2 smaller than the actual, the prediction error will reach about −11.84%. In addition, through the research of comprehensive reservoir parameter variation, it is found that the absolute error value caused by comprehensive reservoir parameter variation is sometimes greater than the sum of the absolute error value caused by single parameters. For example, in the fourth scheme of comprehensive reservoir parameter variation, the absolute error value caused by the Wood method is almost 48.07%. However, the sum of the absolute values of errors caused by the three single parameter variations is 42.99%.
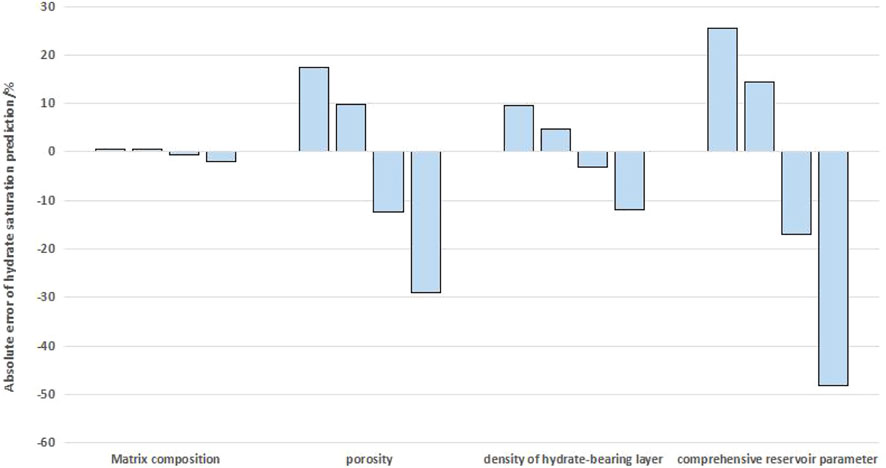
FIGURE 8. Effect of different reservoir parameters variation on the prediction accuracy of hydrate saturation.
4.2 Analysis of reservoir parameter variation on hydrate saturation predicted by the Wood-Bao method
Based on the application of simulation data and the actual data of Well S in the Shenhu sea area, China, the prediction accuracy of the Wood-Bao method is better than that of the Wood method. As can be seen from Figure 7 and Table 10, in hydrate layer depth range [180, 220 m], compared with the chloride method, the overall prediction result of the Wood method is too large, the average absolute error of chloride samples is more than 20%, some errors reaching more than 30%. However, the Wood-Bao method is close to the chloride ion method. The average absolute prediction error is only 7.4%, most of the absolute prediction errors are within 10%, and only a few exceed 10% but not more than 20%. This research shows that the Wood-Bao method for predicting hydrate saturation is much better than the Wood method for the suspension mode hydrate layer of the sea area.
5 Conclusion
(1) When the Wood method is used to predict the hydrate saturation of the sea suspension mode, reliable reservoir parameters are needed; however, the actual measured reservoir parameters are different from the actual value, which often leads to the large prediction error in the Wood method.
(2) When using the Wood method to predict hydrate saturation, a large prediction error can be generated when the absolute measurement error of the porosity parameter is 10%, and the matrix parameters measured with the absolute error of 10% have much less effect on the prediction results than the results of the same porosity parameters. The unreliable density measurement of the hydrate layer will also have a great impact on the prediction of hydrate saturation; when the absolute error of the hydrate layer density measurement reaches 0.2, the absolute value of the prediction error may reach more than 10%. When multiple reservoir parameters change simultaneously, the combined effect is sometimes greater than the sum of the absolute errors caused by a single parameter.
(3) The Wood-Bao method is a prediction method based on pseudo-hydrate saturation of the non-hydrate layer to correct the hydrate saturation of the hydrate layer. Numerical simulation and practical application show that this method has a better prediction effect than the Wood method.
(4) The Wood-Bao method also has disadvantages. In practice, it requires that the sediment composition and porosity in the hydrate layer are similar to the upper non-hydrate layer. If the difference is relatively large, the prediction will not be ideal.
Data availability statement
The original contributions presented in the study are included in the article/supplementary material, further inquiries can be directed to the corresponding author.
Author contributions
XB is mainly responsible for the paper organization and providing research ideas. TL is responsible for technical improvement and data processing. GC is responsible for the paper quality inspection. HL and JL participated in the analysis of simulated data and actual data. FM, ZC, and HC participated in the data processing and text correction of the paper.
Funding
The research is jointly supported by the Project of Introducing Top-notch Talents Urgently Needed in Guangdong Province’s Sail Plan for Talents Development (Nos. 916022 and 917003), Characteristic Innovation Project of Guangdong Provincial Department of Education (No. 2019KTSCX103), the Talent Introduction Project of the Guangdong University of Petrochemical Technology (No. 519013), and the Open Fund Project of Guangdong Research Center for Unconventional Energy Engineering Technology (No. GF2018A001).
Acknowledgments
I would like to express my heartfelt thanks to the organizations that have provided financial support for this research, including the Organization Department of Guangdong Province, the Science and Technology Department of Guangdong Province, Guangdong Provincial Department of Education, the Guangdong University of Petrochemical Technology and Guangdong Research Center for Unconventional Energy Engineering Technology.
Conflict of interest
The authors declare that the research was conducted in the absence of any commercial or financial relationships that could be construed as a potential conflict of interest.
Publisher’s note
All claims expressed in this article are solely those of the authors and do not necessarily represent those of their affiliated organizations, or those of the publisher, the editors and the reviewers. Any product that may be evaluated in this article, or claim that may be made by its manufacturer, is not guaranteed or endorsed by the publisher.
References
Bao, X. S., Zhou, H. Y., Li, L. X., et al. (2018). Status and prospect of seismic prediction technique of natural gas hydrate distribution in the sea. J. Guangdong Univ. Petrochem. Technol. 28 (4), 5–9.
Best, A. I., Priest, J. A., Clayton, C. R. I., and Rees, E. V. (2013). The effect of methane hydrate morphology and water saturation on seismic wave attenuation in sand under shallow sub-seafloor conditions. Earth Planet. Sci. Lett. 368, 78–87. doi:10.1016/j.epsl.2013.02.033
Chen, F., Zhou, Y., Su, X., Liu, G., Lu, H., and Wang, J. (2011). Gas hydrate saturation and its relation with grain size of the hydrate-bearing sediments in the Shenhu area of northern South China Sea. Mar. Geol. Quat. Geol. 31 (5), 95–100. doi:10.3724/sp.j.1140.2011.05095
Guan, P. (2018). China's sea area natural gas hydrate resources are about 80 billion tons of oil equivalent. Chengde: Chengde Evening News, 10–19.
Guo, Y. Q., Qiao, S. H., and Lv, W. J. (2011). Vertical distribution of gas hydrate in Shenhu area of the South China Sea based on acoustic velocity. Mar. Geol. Front. 27 (7), 7–12.
Guo, Y. Q., Yang, S. X., Liang, J. Q., and Lu, J. (2017). Characteristics of high gas hydrate distribution in the Shenhu area, northern slope of South China sea. Earth Sci. Front. 24, 1–8. doi:10.13745/j.esf.yx.2016-12-28
Helgerud, M. B., Dvorkin, J., Nur, A., Sakai, A., and Collett, T. (1999). Elastic-wave velocity in marine sediments with gas hydrates: Effective medium modeling. Geophys. Res. Lett. 26 (13), 2021–2024. doi:10.1029/1999gl900421
Huang, W., Zhang, W., Liang, J. Q., Shang, J., Meng, M., and Dan, C. (2021). Comparative study of gas hydrate accumulation system in the qiongdongnan basin of the South China sea and the ulleung basin of korea. J. China Univ. Min. Technol. 50 (2), 363–380.
Joshi, A. K., Sain, K., and Pandey, L. (2019). Gas hydrate saturation and reservoir characterization at sites NGHP-02-17 and NGHP-02-19, Krishna Godavari Basin, eastern margin of India. Mar. Pet. Geol. 108, 595–608. doi:10.1016/j.marpetgeo.2018.06.023
Lee, M. W., Hutchinson, D. R., Collett, T. S., and Dillon, W. P. (1996). Seismic velocities for hydrate-bearing sediments using weighted equation. J. Geophys. Res. 101 (B9), 20347–20358. doi:10.1029/96jb01886
Lee, M. W., Hutchinson, D. R., Dillon, W. P., Miller, J., Agena, W., and Swift, B. (1993). Method of estimating the amount of in situ gas hydrates in deep marine sediments. Mar. Pet. Geol. 10 (5), 493–506. doi:10.1016/0264-8172(93)90050-3
Lee, M. W., and Waite, W. F. (2008). Estimating pore-space gas hydrate saturations from well log acoustic data. Geochem. Geophys. Geosyst. 9 (7), 1–8. doi:10.1029/2008gc002081
Liang, D. Q., He, S., and Li, D. L. (2009). Effect of microwave on formation/decomposition of natural gas hydrate. Sci. Bull. (Beijing). 54 (6), 965–971. doi:10.1007/s11434-009-0116-4
Priest, J. A., Best, A. I., and Clayton, C. R. I. (2005). A laboratory investigation into the seismic velocities of methane gas hydrate-bearing sand. J. Geophys. Res. 110 (B4). doi:10.1029/2004JB003259
Priest, J. A., Rees, E., and Clayton, C. R. I. (2009). Influence of gas hydrate morphology on the seismic velocities of sands. J. Geophys. Res. 114 (B11), 1–13. doi:10.1029/2009JB006284
Sean, B., Tiago, M. A., and Gergory, F. M. (2014). Distribution of gas hydrates on continental margins by means of a mathematical envelope: A method applied to the interpretation of 3D seismic data. Geochem. Geophys. Geosyst. 15 (1), 52–68. doi:10.1002/2013gc004938
Sha, Z., Liang, J., Zhang, G., Yang, S., Lu, J., Zhang, Z., et al. (2015). A seepage gas hydrate system in northern South China Sea: Seismic and well log interpretations. Mar. Geol. 366, 69–78. doi:10.1016/j.margeo.2015.04.006
Song, H. B., Song, L. X., Wu, N. Y., and Hao, T. (2001). Geophysical research on marine gas hydrates(I);physical properties. Prog. Geophys. 16 (2), 118–126.
Su, P. B., Zeng, F. C., Sha, Z. B., and Shang, J. J. (2013). Occurrence of gas hydrate in some marine drilling areas. Mar. Geol. Front. 29 (12), 16–24.
Uma, S. (2016). Gas hydrate saturation from seismic data constrained by log data in the Krishna-Godavari Basin. J. Pet. Explor. Prod. Technol. 6, 13–23. doi:10.1007/s13202-015-0170-1
Wei, J., Fang, Y., Lu, H. L., Lu, H. F., Lu, J., Liang, J., et al. (2018). Distribution and characteristics of natural gas hydrates in the Shenhu sea area, South China sea. Mar. Petroleum Geol. 98, 622–628. doi:10.1016/j.marpetgeo.2018.07.028
Wei, J. G., Liang, J. Q., Lu, J. G., Zhang, W., and He, Y. (2019). Characteristics and dynamics of gas hydrate systems in the northwestern South China Sea - results of the fifth gas hydrate drilling expedition. Mar. Petroleum Geol. 110, 287–298. doi:10.1016/j.marpetgeo.2019.07.028
Wu, S. G., Dong, D. D., Yang, S. X., Zhang, G. X., and Sun, Y. B. (2009). Primary exploration into the formation of NGH system in fine-grained sediments on the northern continental slope of the South China sea. Chin. J. Geophys. 52 (7), 1849–1857.
Yang, R., Wu, N. Y., Lei, X. H., Liang, J. Q., and Sha, Z. B. (2011). Inversion of AVO properties in the northern South China Sea and its indication of natural gas hydrate. China Geophys. 963.
Ye, J. L., Qin, X. W., Xie, W. W., Lu, H. L., Ma, B. J., Qiu, H. J., et al. (2020). Main progress of the second gas hydrate trial production in the South China Sea. Geol. China 47 (3), 557–568.
Zeng, F. C., Yang, S. X., and Zhang, G. X. (2013). Strategy research on the exploration and development of Natural gas hydrate resources. Beijing: Geological publishing house.
Zhang, G., Liang, J., Lu, J. a., Yang, S., Zhang, M., Holland, M., et al. (2015). Geological features, controlling factors and potential prospects of the gas hydrate occurrence in the east part of the Pearl River Mouth Basin, South China Sea. Mar. Petroleum Geol. 67, 356–367. doi:10.1016/j.marpetgeo.2015.05.021
Zhang, G. X., Liang, J. Q., Zhang, M., and Xu, H. N. (2014). Joint seismic exploration of Marine natural gas hydrate. Beijing: Geological publishing house.
Zhang, H. Q., Yang, S. X., Wu, N. Y., Su, X., Holland, M., Schultheiss, P., et al. (2007). Successful and surprising results for China’s first gas hydrate drilling expedition. methane hydrate Newsl. Fire ice 7 (3), 6–9.
Zhou, S. W., Chen, W., and Li, Q. P. (2014). The green solid fluidization development principle of natural gas hydrate stored in shallow layers of deep water. China Offshore Oil&Gas 26 (05), 1–7.
Keywords: natural gas hydrate, commercial exploitation, suspended hydrate, Wood method, Wood-Bao method
Citation: Bao X, Luo T, Li H, Li J, Chen G, Mi F, Cai Z and Chen H (2022) Research on a hydrate saturation prediction method based on an analysis of factors that influence the prediction accuracy of sea area hydrate saturation. Front. Earth Sci. 10:896354. doi: 10.3389/feart.2022.896354
Received: 16 March 2022; Accepted: 06 July 2022;
Published: 26 August 2022.
Edited by:
Giovanni Martinelli, National Institute of Geophysics and Volcanology, ItalyReviewed by:
Qianyong Liang, Guangzhou Marine Geological Survey, ChinaWenjia Ou, China University of Geosciences Wuhan, China
Copyright © 2022 Bao, Luo, Li, Li, Chen, Mi, Cai and Chen. This is an open-access article distributed under the terms of the Creative Commons Attribution License (CC BY). The use, distribution or reproduction in other forums is permitted, provided the original author(s) and the copyright owner(s) are credited and that the original publication in this journal is cited, in accordance with accepted academic practice. No use, distribution or reproduction is permitted which does not comply with these terms.
*Correspondence: Tianyu Luo, MTc4MTkxODY5MjhAMTM5LmNvbQ==