 Weixue Zhang
 Jixin Huang3*
- 1School of Geosciences, Yangtze University, Jingzhou, China
- 2Key Laboratory of Exploration Technologies for Oil and Gas Resources, Yangtze University, Jingzhou, China
- 3Research Institute of Petroleum Exploration and Development, Beijing, China
This paper presents a detailed description of the sedimentary characteristics and architecture model of the tidal-dominated estuary reservoir in the Lower Cretaceous McMurray formation. Based on a thorough study of the core data, 13 lithofacies were recognized. The lithofacies associations were divided into nine types of architecture elements, that is channel, salt marsh, fluvial point bar, tidal point bar, mud flat, mixed flat, sand flat, tidal bar and offshore. Through the combination of high resolution seismic data and well data, the architecture model was established. The boundary surfaces of each architecture elements are depicted and the logging characteristics is concluded. The cross-section is constructed to reveal the superimposition model of different architectural elements with the seismic profiles. The plane and vertical distribution of architectural elements are revealed and the sedimentary model is constructed. In the longitudinal section of estuary, the architecture elements is fluvial deposits (channel, fluvial point bar, and salt marsh), tidal flat (mud flat, mixed flat, and sand flat), tidal bar, tidal flat and offshore from land to sea. In the cross section, tidal bar, sand flat, mixed flat, mud flat, tidal point bar and salt marsh are distributed successively from the center to the sides. Tidal bars and sand flats are the best reservoirs in terms of physical properties. We focus on the analysis of their architecture and summarize their stacking patterns. We propose tidal bars as compounds are lateral accretion. Tidal bar has high-angle continued lateral accretion, with a dip angle of 6–12°. Sand flat also has lateral-migrated characteristics, but their dip angle is 2–6° which is smaller than tidal bars. As a result, the dimension and stack of a single tidal bar and sand flat are quantified. The tidal bar was lateral stacking or vertical stacking with lateral-migrated or forward-migrated sand flat and existed vertical and lateral erosion-filling phenomenon. Tidal bars have width of 100–550 m and length of 800–2,400 m, and sand flats are 300–2,500 m long. Tidal bars and sand flats made up the best reservoirs. The study provides some insights for future research of estuarine sedimentary patterns and reservoir architecture.
1 Introduction
Estuary deposit is one of the most significant coastal products, which is closely associated with human activities and petroleum exploration. This results in extensive attention to estuary deposits here, recently (Crerar and Arnott, 2007; Rahnama et al., 2013; Cheng et al., 2020; Wang L. et al., 2021). The oil sands in the estuary have been a subject of continued research, especially on their formative mechanism and sedimentary characteristics. Boggs (2012) studied the geomorphologic, hydrodynamic and depositional characteristics of the estuarine system and analyzed the depositional characteristics of the tidal flat. The formation of estuary is mainly controlled by rate in sea-level fluctuations, bedrock morphology and sediment supply (Tessier et al., 2012). The frequent fluctuation of sea level leads to incised valley reservoirs in estuaries where tidal bars are developed. Tidal bars are one of the important architecture elements of estuaries. Fenies and Tastet (1998) indicated that sand bars developed in estuaries were composed of different types of S-shaped sand units. Olariu et al. (2012) proposed that tidal bars generated lateral-accretion architecture and their long axis almost parallel both to tide current direction and to the strike of the lateral-accretion master surfaces. Tang et al. (2019) established the spatial distribution of the paleo-estuarine tidal bar for the first time, which can assist future research in analyzing the architecture of stacked fluvial and estuarine deposits. The development of different parts of sand flat varies greatly, and the superposition pattern with tidal bar also affects the petroleum production. They are less well preserved underground, making it difficult to anatomize their architecture. The internal architecture of tidal bars has been studied previously, but the superposition patterns between tidal bars and sand flats need further research.
Reservoir architectural element analysis has been further researched, especially in fluvial-delta environments (Feng et al., 2019; Wang et al., 2020a; Wang et al., 2022a; Wang et al., 2022b). Allen (1983) and Miall (1985), Miall (1988) proposed the analysis method to recognize architectural elements by distinct lithologic characteristics and architecture boundaries, which is widely applied in fluvial-delta field studies (Wang et al., 2020b; Wang X. et al., 2021). However, the estuary reservoir was strongly reworked by the interaction of river and tidal flow. This bi-directional current in an estuary reservoir promote gradually-transited lithologic characteristics among different architecture elements. As a result, it is difficult to identify architectural boundaries of architectural elements in the estuarine reservoir by the typical analysis method. At present, the estuarine architecture remains to be further studied. Sufficient and high-quality data ensure that we can identify the boundary of the architectural element.
In this paper, we integrate lithologic interpretations from core data and high-resolution seismic interpretations to recognize detail characterize the architecture of estuarine reservoir, taking McMurray Formation in Athabasca Block, Albert Basin as a case study. The aims of this paper include that: 1) recognizing architecture elements and their corresponding lithofacies in the estuarine reservoir; 2) revealing lateral and vertical architectural patterns within the tidal bar and sand flat compounds. Finally, we attempt to establish an architectural model of estuarine reservoir. The results of this paper will provide some insights for inter-well prediction during reservoir exploration and development.
2 Geological Setting
The Alberta Basin is an NW-SE foreland basin between the Canadian Shield and the Rocky Mountains, which covers an area of more than 140,000 km2 (Hein et al., 2008). The study area is located in the Athabasca block of the Alberta Basin in northeastern Alberta (Figure 1A). The enrichment of Athabasca’s oil sands resulted from Rocky Mountain orogeny, which began in the Jurassic when the Eastern Pacific plate pushed under the North American continental plate. Most of the bitumen in the Athabasca oil sands is located in the McMurray Formation of the Lower Cretaceous Mannville Group, which unconformably overlies the Middle to Upper Devonian carbonate of the Beaverhill Lake, Woodbend, Winterburn, and Wabamun Groups (Hauck et al., 2017). The Devonian carbonate is low in the north and high in the south (Figure 1B), which affects the differentiation of the sediments of the McMurray Formation.
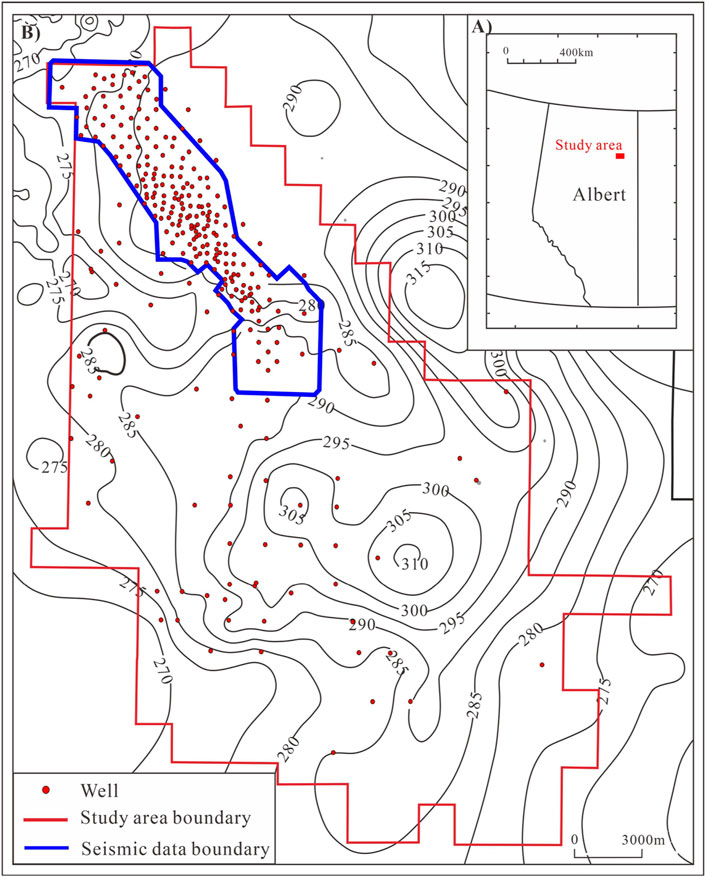
FIGURE 1. (A) Location map of the study area; (B) The study area regional paleozoic structure map. The seismic data is located in dense well pattern area.
According to the lithological characteristics, Carrigy (1959) divided the McMurray Formation into three members: Lower McMurray, Middle McMurray, and Upper McMurray from bottom to top. The Upper and Middle McMurray deposition was stable, and the Lower McMurray was generally absent. The sandstone of the Middle McMurray Formation filled in a super large incised valley on the interface of the second-order sequence. At the same time, affected by the dual action of rivers and oceans, reservoirs had complex internal structures and superposition patterns, which greatly affected the distribution of oil and water and the development of oil sands in steam assisted gravity drainage (SAGD). It is urgent to carry out fine reservoir architecture analysis to provide a geological guarantee for the efficient development of oil sands.
The McMurray Formation is a third-order sequence, and only transgressive system tract and highstand system tract were developed in the study area (Hein and Cotterill, 2006), corresponding to the Middle McMurray Formation and Upper McMurray Formation. Frequent vertical erosion and filling deposition occurred with long-term transgression and multiple short and medium-term transgression-transgression (Westerhold et al., 2005). Four base levels up-and-down cycles occurred in the Middle and Upper McMurray Formation, which resulted in four unconformity surfaces and corresponding incision-filling deposition (Barton and Seibel, 2016). It affected the distribution of deposits, especially tidal bars in Upper McMurray.
According to the lithology and logging data, the McMurray Formation of the target interval was divided into five layers: Middle-McMurray, McMurray-U2, McMurray_U1-2, McMurray_U1-1 and McMurray-TOP from bottom to top. However, affected by differences in physical properties and depositional processes, McMurray-U2, McMurray_U1-2 and McMurray_U1-1 were important reservoirs, so we mainly focused on the three layers in this architecture study.
3 Data and Methods
The study area covers 1,360 km2, with more than 30 km2 of 3D seismic data in the dense well area, including logging data from 281 conventional wells, core data from 168 coring wells, and grain size data from 67 wells. The area with seismic data is the main sedimentary area and the focus of our research. In combination with abundant core data, logging data and high-resolution seismic data, we paid attention to reservoir architecture identification and internal structure analysis of the estuary, established reservoir architecture models of estuary in the study area, analyzed the scale of reservoir architecture, and provided a reference for efficient development of oil sands.
Based on cores data and laboratory data, we analyze core color sedimentary structures, sorting, grain size and bioturbation to identify the boundary of the architectural elements. According to the analysis results, we classify the types of lithofacies, lithofacies association and architecture elements. The lithofacies were identified and the architectural elements were defined.
We used high-quality seismic data to determine the relationship between time and depth through time-depth calibration. Architecture anatomy was performed using calibrated seismic profiles. Three profiles with seismic data in dense well pattern area were selected for architecture analysis. By analyzing seismic reflection characteristics and the combination of layer correlation, lithofacies types and combinations, architecture elements are determined, the internal architecture and contact relationships between tidal bar and sand flat are defined, and the architecture scales are determined. According to the distribution of lithofacies association, the horizontal facies map is analyzed and the horizontal distribution model was determined. The evolution of sedimentary architecture elements was analyzed.
4 Facies Analysis Results
4.1 Lithofacies Identification
Phillips (2011) identified 18 facies and 5 sedimentary facies associations with a detailed scheme, but it didn’t classify the fluvial deposits in detail. While Tang et al. (2019) identified 13 facies and 4 facies association, the tidal flat was not classified in detail in the scheme. This study classified 14 lithofacies types and 9 lithofacies associations (Table 1) after the above two classification schemes (Figure 2). We classified fluvial deposits into channel, fluvial point bar and salt marsh, and tidal flat into sand, mixed, and mud flat.
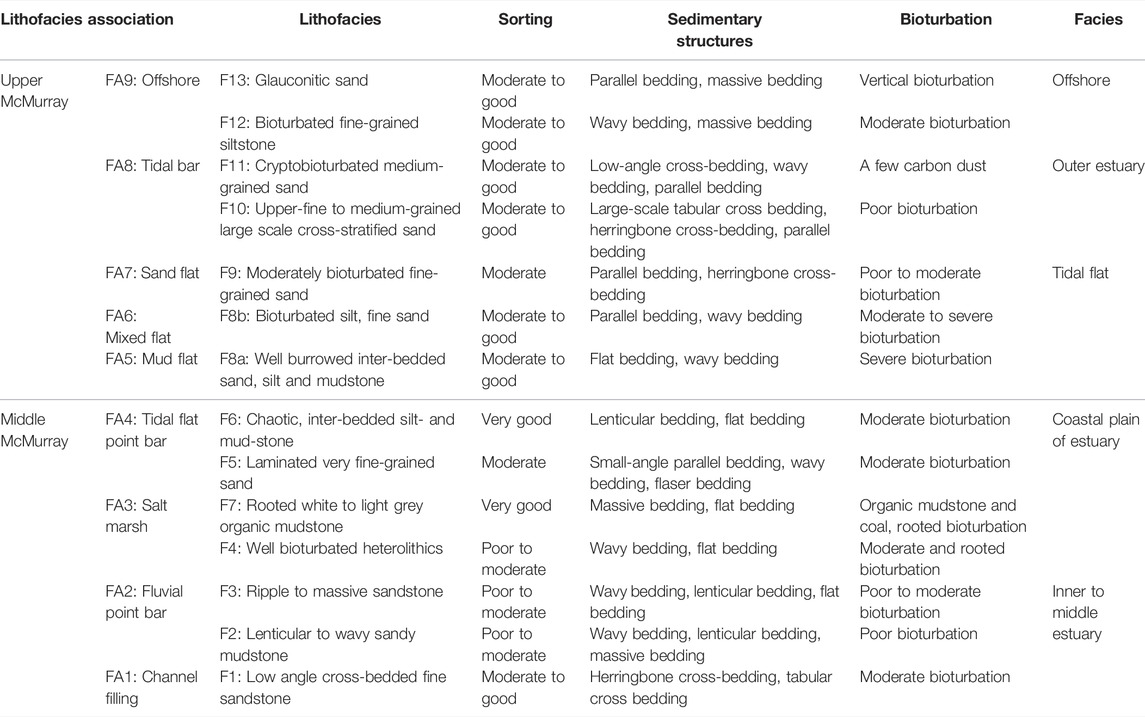
TABLE 1. Lithofacies classification scheme for the interval of interest in the study area of the Athabasca block.
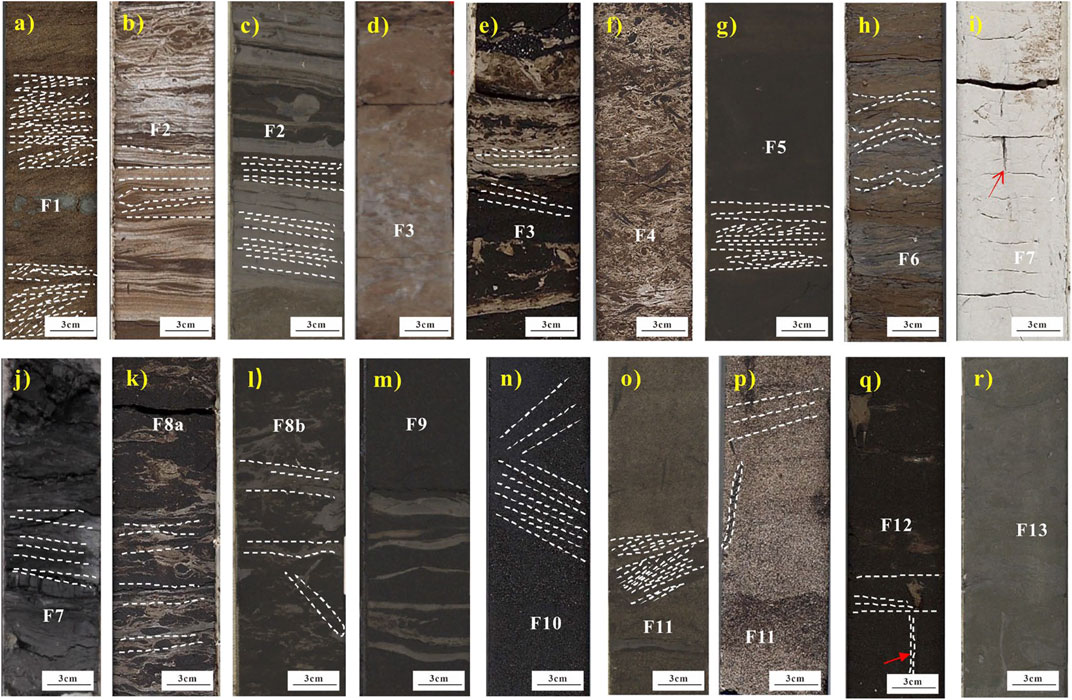
FIGURE 2. Lithofacies core data of F1-F13. (A) 120,809,114, depth 183.9 m; (B) 101,508,813, depth 181.8 m; (C) 1,030,088,130, depth 184.5 m; (D) 121,209,014, depth 198 m; (E) 122608814, depth 184.6 m; (F) 151908813, depth 192 m; (G) 071908913, depth 211.5 m; (H) 071908913, depth 213 m; (I) 161109014W400, depth 201.2 m; (J) 121209014, depth 202.7 m; (p) 160109014, depth 188.4 m. (K) 160,109,014, depth 209.9 m. (L) 103,208,913, depth 206.5 m; (M) 071,908,913, depth 199.9 m; (N) 160,109,014, depth 194.2 m; (O) 071,908,913, depth 181 m; (Q) 022,709,014, depth 172.4 m; (R) 071,908,913, depth 193.7 m.
4.1.1 F1: Low Angle Cross-Bedded Fine Sandstone
There are typical phenomena such as herringbone cross-bedding and tabular cross-bedding. It was dominated severe bioturbation; mud interlayers were rarely seen, and clasts and pebbles were occasionally seen at the bottom. The bottom had scoured surface.
4.1.2 F2: Lenticular to Wavy Sandy Mudstone
The interbedded sand-mudstone was typical of lenticular to wavy sand-mudstone. It has wavy and lenticular bedding, uneven lithology distribution, and collapsed mud conglomerate. There were ichnological characteristics.
4.1.3 F3: Ripple to Massive Sandstone
F3 developed wavy and lenticular bedding. It is often associated with F2, but showed varying bioturbation intensity and proportions of sandstone, silt, and mudstone.
4.1.4 F4: Well Bioturbated Heterolithics
The lithofacies ranged in proportions of sand, silt, and mud, but were typically mud-dominated. Successions illustrated decimeter to meter scale fining- and muddier-upward trends. Highly bioturbated heterolithic media characterized it.
4.1.5 F5: Laminated Very Fine-Grained Sand
The lithofacies were dominated by small-angle parallel bedding and wavy bedding, followed by flaser bedding, with sporadic heterogeneous distribution. Bioturbation intensity ranges from weak to moderate. The sandstone was moderately sorted and the bitumen saturation was low. There were ichnological characteristics.
4.1.6 F6: Chaotic, Inter-Bedded Silt- and Mud-Stone
Plant root traces and bioturbation were found. Many bioturbations led to modification and destruction of original sedimentary structures. Light grey silt mud, silt, and light brown fine-grained sandstone were presented in varying proportions. Poor oil saturation.
4.1.7 F7: Rooted White to Light Grey Organic Mudstone
Massive Bedding: One was gray to light gray mudstone (Figure 2I), which had no biological disturbance, and the permeability of sediments was poor at a distance from the river channel; another was the thinly interbedded deposition composed of dark gray organic mud and coal. F7 is a back-marsh deposit reflecting a high water level in the supratidal zone and vertical accretion at the distal end of an active channel.
4.1.8 F8a: Well Burrowed Inter-Bedded Sand, Silt and Mudstone
Wavy bedding was observed, and strong bioturbation destroyed the interbedded structure of mud and sand. There were coal lines, less bioturbation, higher clay content and silty. There were different proportions of bioturbation interbedded sand, silt and mudstone, sporadic distribution of shell fragments, small bivalves, scattered organic debris and coal debris.
4.1.9 F8b: Bioturbated Silt, Fine Sand
There were parallel bedding and wave bedding. High mud content and mud is mainly disturbed by biological vigorous, vertical and high angle drilling developed. Ichnology was more developed and diverse. The distribution of bioturbation was regular, heterogeneous to homogeneous. The development of shale laceration reflected the strong hydrodynamic conditions.
4.1.10 F9: Moderately Bioturbated Fine-Grained Sand
It was black fine-grained sandstone with parallel bedding and herringbone cross-bedding, and inclined muddy interlayer existed. Bioturbation was sporadic and heterogeneous, and it showed an upward trend.
4.1.11 F10: Upper-Fine to Medium-Grained Large Scale Cross-Stratified Sand
The lithofacies was a tidal bar deposit on the edge of the estuary, with large-scale tabular cross-bedding and herringbone cross-bedding, reflecting the high-energy depositional environment. The lithology was very fine sand-medium sand. Bioturbation is sporadically distributed, with little disturbance.
4.1.12 F11: Cryptobioturbated Medium-Grained Sand
The lithology was fine and medium-grained sandstone, trough cross to low angle cross sandstone with low oil saturation. Interpreted as the crest of a shallow sea or the shore surface (Phillips, 2011). More specifically, the lithofacies was interpreted as highly energetic deposition with a mix of wave and tidal processes.
4.1.13 F12: Bioturbated Fine-Grained Siltstone
This lithofacies was interpreted as shallow fully marine proximal lower shoreface deposition during fair-weather conditions. It was characterized by bioturbation, good sorting, fine sandstone to siltstone, and poor oil saturation. It reflected the sediments when seawater deepened during transgression. The mudstone at the top had lenticular bedding and tabular cross-bedding.
4.1.14 F13: Glauconitic Sand
In this lithofacies, apparent glauconitic sand could be seen, which had a high degree of biological transformation and was easy to homogeneous with sandstone. The lithofacies was visible throughout the top of the McMurray Formation.
4.2 Lithofacies Associations
Different periods of lithofacies associations form architecture elements. Lithofacies associations of architecture elements were identified by comparing the core characteristics of the cored wells. There are nine kinds of architecture elements. Then the relationship of logging data and architecture elements (Figure 3) were summarized.
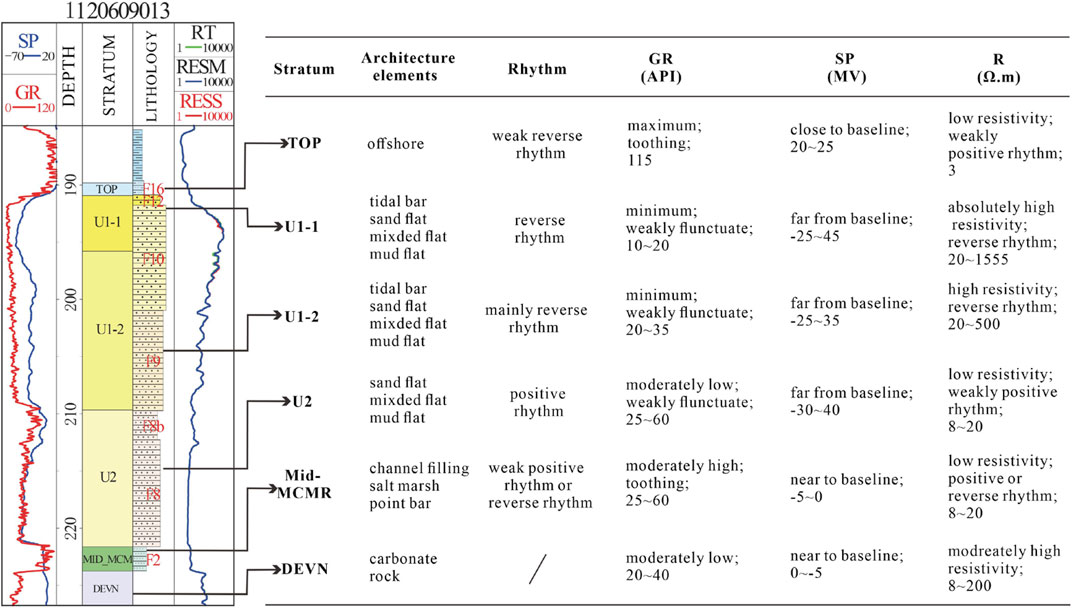
FIGURE 3. The relationship of logging data and architecture elements.
The Gr is maxium in offshore. Tidal bar and sand flat have low Gr with reverse rhythm, while the Gr of mixed flat and mud flat present weak positive rhythm. The sediment of fluvial facies showed high Gr indicating shale index. It shows that tidal bar and sand flat are high-quality reservoirs.
F1 is a sandy channel filling deposition (FA1). Affected by the tide, the hydrodynamic force was weakened, the deposited fine sand was violently disturbed with low mud content.
F2 and F3 were fluvial point bar deposition (FA2) that were typically characterized by inclined and heterogeneous stratification, and they were formed in an environment with great changes in water flow (Thomas et al., 1987).
F5 and F6 were tidal point bar deposition (FA3), including tideway, tidal creek, which were deposited in contact with salt marsh. Fluvial point bar is river deposits, and tidal point bar is tidal deposits.
F4 and F7 were salt marsh (FA4), which were the sedimentary products of Middle-McMurray. The presence of plant root traces and the lumpy and brittle coal seams suggested that sediments were continuously deposited and vertically accreted in a humid, low-energy salt marsh environment.
F8a was mud flat (FA5), and F8b was mixed flat (FA6). F8a and F8b developed in association and assemblages. The difference lies in the amount of mud content. They were formed in a tidal environment with alternating hydrodynamic strength and weakness, and their formation process was mainly affected by tidal activity.
F9 was sand flat deposition (FA7), mainly parallel bedding. FA7 was a sandy deposit under a high-energy hydrodynamic environment under the action of high-speed tidal currents. They were the lateral-migrated bar deposits at the edge of shallow bays dominated by tides.
F10-F12 were tidal bar (FA8). It was upward-coarsening and was interpreted to be a “tidal bar” (Mutti 1985). Tidal bars should be generated lateral accretion deposits, not the forward-accretion coset, which vertical succession was typically about 5 m thick (Dalrymple and Choi, 2007).
F13 was distal offshore deposition (FA9) in a mixed tide- and wave-influenced setting dominated by fair-weather deposition with remnant distal tempestites above storm wave base. Glauconite deposits are widespread on present-day continental shelves (Odin, 1985). Thus, the presence of glauconite indicates open marine, very slow sedimentation.
Tidal flats (mud flats, mixed flats, and sand flats) and tidal bars were very developed in the reservoir, among which tidal bars and sand flats were high-quality reservoirs, mainly developed in the upper member of the McMurray Formation.
5 Architecture Analysis Results
5.1 Profile Characteristics of Architecture Elements
According to Miall’s architecture surface division scheme (1985, 1988), we defined third and fourth order surfaces in seismic profiles (Figure 4A). The third-order surface was the accretion surface of the same lithofacies association, both sides of the surface had the same lithofacies association; The third-order surface represents the deposition of the same facies association in different periods. The fourth-order surface was the top surface and bottom surface of the architecture elements, such as surfaces of tidal bars and point bars.
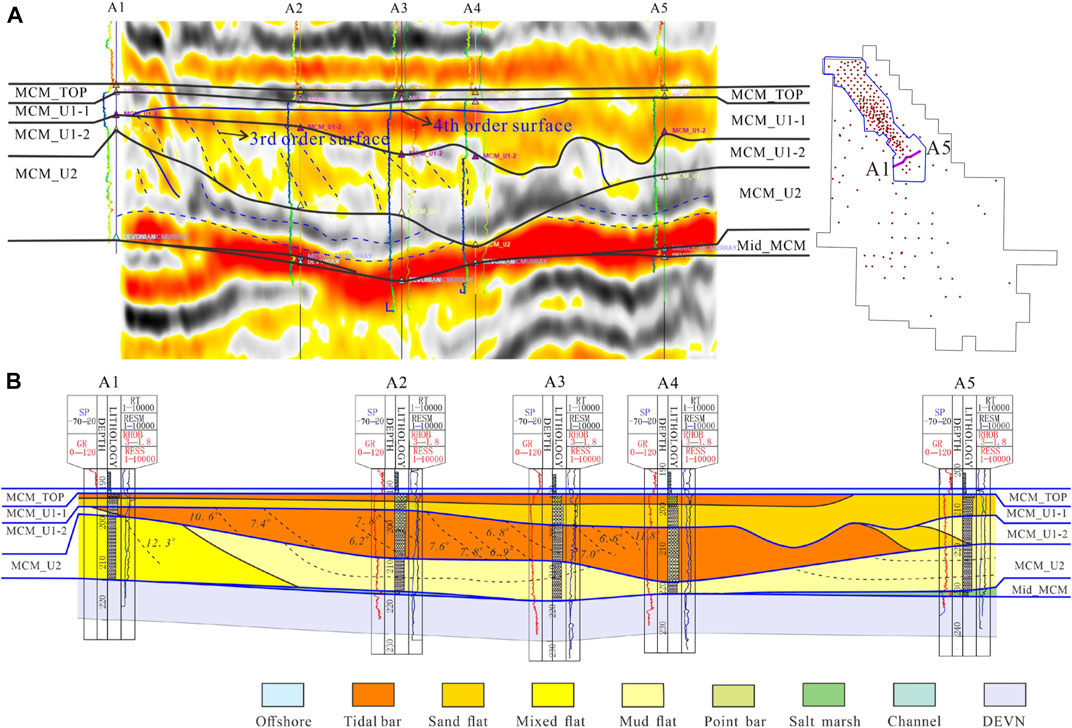
FIGURE 4. (A) The left one is 2D seismic profile of the cross-section in the vertical provenance direction, the Gr curve on the right side of the logging curve, and the RESS curve on the left side. The right one is the location of the profile. (B) Architecture element analysis of the connected well profile in the direction of cutting provenance direction.
Seismic reflection characteristics can be a good indicator of the periods or boundaries of architecture elements. Inclined reflections from seismic profiles reflects the inside periods or boundaries of architecture elements. The periods or boundary surfaces can be recognized when combined with lithofacies and logging data.
It can be seen that the Mid-McMurray was severely eroded through the analysis of the cross-section in the direction of vertical provenance (Figure 4). In U2, there was lateral accretion in mixed flat and vertical accretion in mud flat. The mud flat and the mixed flat were in lateral splicing contact, and they were erosion-filling deposits. In U1-2, the inclined reflection structure of the architecture elements can be seen from Well A1 to Well A4 (Figure 4A), it was a tidal bar compound lateral accretion structure. There were architecture elements boundaries between Well A4 and Well A5, it changed from tidal bar to sand flat and then to mud flat. In U1-1, apparent boundaries of architecture elements can be find. Still, it is not apparent about their internal structure. The sand flat covered the bottom of U1-1, and the tidal bar covered the top of U1-1 from Well A1 to Well A4, and it mainly was vertical accretion due to the environment of deep water.
The direction of vertical provenance was closer to the marine, the fluvial incised degree was smaller than the section of A1–A5. So the Middle McMurray Formation survived between wells B1 and B5 (Figure 5). Tidal flat was mainly deposited in U2. In the seismic slice interpretation of U1-2, there was a very obvious lateral-migrated feature inside the architecture elements between wells B2–B7. The logging curve was reverse rhythm, which means it was a compound tidal bar. In U1-1, tidal bars covered the top of sand flats.
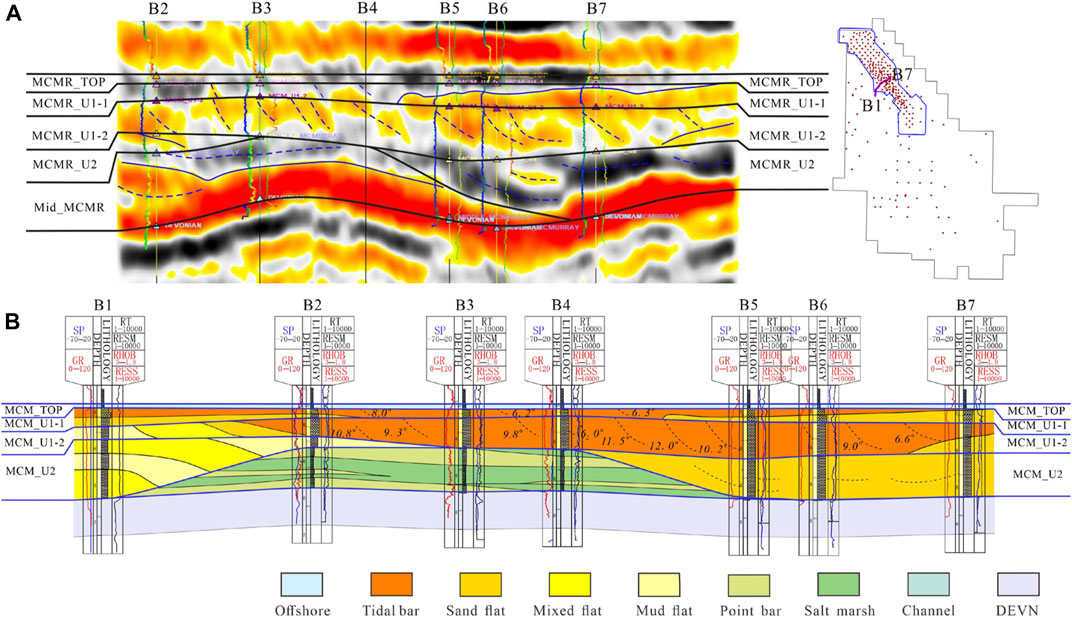
FIGURE 5. (A) The left one is 2D seismic profile of the cross-section in the vertical provenance direction, the Gr curve on the right side of the logging curve, and the RESS curve on the left side. The right one is the location of the profile. (B) Architecture element analysis of the connected well profile in the direction of cutting provenance direction.
In the cross-section along the provenance direction (Figure 6), the Middle McMurray was eroded by fluvial incision, and the sediments remained incomplete. In U2, the sand flat and the mud flat deposited laterally, and we can see the boundary of architecture elements between wells C6 and C7 (Figure 6A). Sand flats were lateral-migrated, and it was lateral splicing with mud flat. The mixed flats would be destroyed by storms or enhanced tidal hydrodynamic. The tidal bar in U1-2 contacted with the sand flat laterally spliced. According to the seismic interpretation, the internal structure of tidal bars was lateral accretion, and the sand flat was the forward accretion. In U1-1, tidal bar and sand flat contact deposition can also be observed.
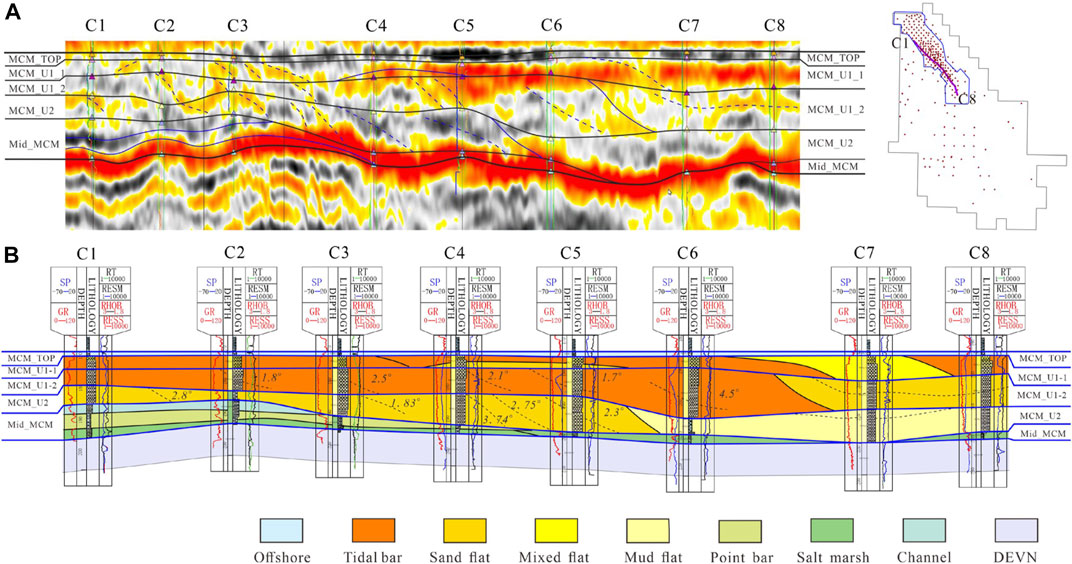
FIGURE 6. (A) The left one is 2D seismic profile of the cross-section in the provenance direction, the Gr curve on the right side of the logging curve, and the RESS curve on the left side. The right one is the location of the profile. (B) Architecture element analysis of the connected well profile in the direction of vertical provenance direction.
Middle McMurray deposits are fluvial (channel, salt marsh, and fluvial point bar) and tide way deposits (tidal point bar, salt marsh). U2 is mainly tidal flat deposits, U1-2 and U1-1 mainly occurred tidal flat and tidal bar deposits. The evolution sequence of the study was estuarine coastal plain-inner estuary, inner-middle estuary and outer estuary.
5.2 Horizontal Characteristics of Architecture Elements
The McMurray Formation mainly developed the system of tidal bar and tidal flat (Figure 7). The main tidal bar is disturbed in the main axis of incised valley, with a length of about 14 km and a width of about 4 km, and are composed of multiple lateral accretions of different periods. There are many tidal bars in the north landward, which are smaller and more unstable because the river current here is still relatively strong, coupled with the compound action of the bi-direction tidal current, the transformation is relatively strong, and their distribution direction is related to divergent tide currents’ distribution directions. The sand flats is distributed on the edge of tidal bars and have lateral accrertion with inclined mud interlayers. Due to the limited data conditions, only the dense well pattern area with high resolution data is divided into the sedimentary periods of the architecture elements in the north side. From the land to the sea, the muddy interlayer decreases land then increases, indicating that the hydrodynamic force increases first and then weakens. It mainly because the superposition of tide and river current when occurs ebb tide. Mixed flats deposite on the outside of sand flat, with more mud interlayer and bioturbation. Mud flat has higher mud content and stronger bioturbation.
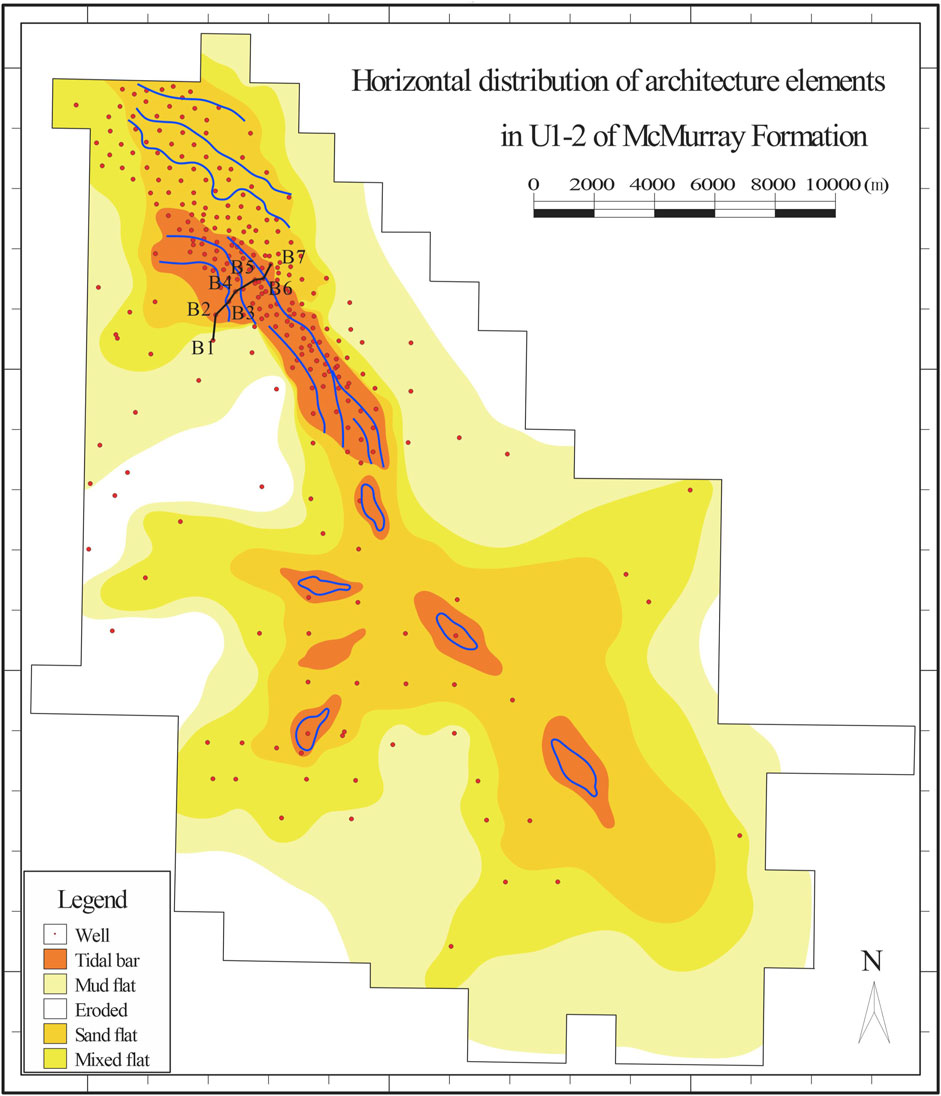
FIGURE 7. Map view of the architecture pattern in U1-2 of McMurray Formation. The blue dotted line in tidal bars represented the periods of tidal bars, indicating that the large-scaled tidal bar compounds consisted of lateral accretion.
Architecture elements can be analyzed by combining horizontal map and profile. Architecture elements in section of B1–B7 change from mud flat, mixed flat, to sand flat, tidal bar, and then to sand flat (Figure 7), which is consistent with the interpretation of profile’s architecture elements (Figure 5). The architecture elements are lateral stacking.
The eroded zone in U1-2 of McMurray Formation (Figure 7) is a succession deposit that occurred after the early deposition of the Upper McMurray. Long-term transgression results in the sedimentary system’s landward retrogradation, but residual areas may still remain caused by short-term retrogradation to preserve.
5.3 The Architecture Patterns Between Tidal bar and Sand Flat
The seismic profile summarized the superposition pattern between the lateral-migrated tidal bar and sand flat. There were four superposition patterns (Figure 8) between tidal bar and sand flat. The tidal bar was lateral stacking with lateral-migrated sand flat (NO-T1) or forward-migrated sand flat (NO-T2). These two patterns often occurred in U1-2 normally. The following two patterns often occurred in U1-1. The tidal bar was vertical stacking with lateral- migrated sand flat (NO-T3) or forward-migrated sand flat (NO-L1).
1) NO-T1: Tidal bar is vertical stacking on the lateral-acctrtion sand flat, and its internal structure characteristics are not obvious due to the limitation of seismic data resolution. However, the hydrodynamic force is weak at this time because the sea level has risen to a relatively height, and the edge of tidal bar may be with a small dip angle or a foreset accretion. The sand flat has a lateral accretion architecture and a small lateral dip angle, indicating a strong hydrodynamic environment. As a result, sea level is rising.
2) LO-T2: Tidal bar is also vertical stacking on sand flat, but the sand flat is forward-accretion. At the bottom, the sand flat deposited incised valleys with lateral accretion. The sand flat at the top is in vertical stacking with tidal bar, and its bottom shape is flat with vertical accretion. It suggests weakened hydrodynamic forces and rising sea levels.
3) LO-T3: Tidal bar and sand flat are in lateral stacking, which are lateral accretion. The dip angle of tidal bar is larger than sand flat. The shape of the tidal bar is like a channel influenced by an incised valley, reflecting a short-term of regression. The incised valley was filled by the tidal bar subsequently indicates the occurrence of transgression. The clay content is less than sand flat. Erosion and filling may exist in tidal bar and sand flat, indicating a strong hydrodynamic environment.
4) LO-L1: Lateral stacking between lateral accretion tidal bar and forward accretion sand flat. The lateral structure of tidal bars caused by high energy hydrodynamics, which is the superposition of tidal energy and river energy. Forward accretion sand flats are generally affected by one kind of current energy or weak superimposed current energy.
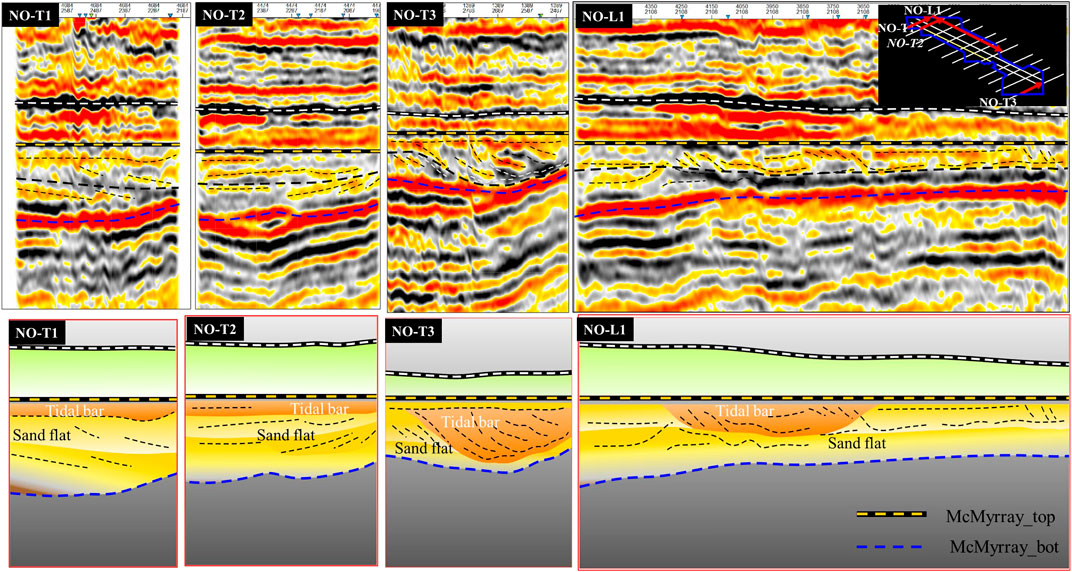
FIGURE 8. The superposition patterns between tidal bar and sand flat. The superposition patterns are based on profiles of seismic interpretations.
5.4 The Scale of Architecture Elements
Through the analysis of seismic slices and architecture elements (Figure 6), the Middle McMurray had residual thickness between Well B1 and Well B5 and the distance was approximately 2,600 m. The residual thickness between Well B2 and Well B4 was relatively large, and the width is about 1,000 m; the internal stratum was flat and developed, mainly vertical accretion, and point bars with small incision and filling. The U2 sublayer is incised and filled, with a lateral sand flat in the east and a tidal flat in the west; the U1-2 layer had noticeable incision filling characteristics, mainly mixed flat outside the river valley, and tidal bar in the river valley. The strong seismic reflection structure (Figure 6) can be seen from Well B2 to Well B7 as a lateral accumulation structure. The scales of lateral accretion bodies vary greatly, ranging from 160 m to more than 360 m in width, and dip angles range from 9 to 12°. U1-1 is dominated by tidal bars that became thicker from the south to the north, showing an obvious facies transition along the source; the lateral deposition angle is 6–8°. Corresponding to dip angles of lateral accretion, the mud interlayers into tidal bars and sand flat also has high dip angles that should be noticed because they can negatively influence reservoir quality. Using the same method, the seismic slices of four sections and the elements scale of connected well facies were analyzed, and the scale data of sand flats (Table 2) and the scale data of tidal bars (Table 3) were obtained.
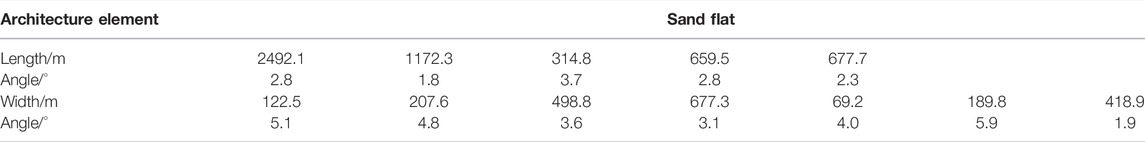
TABLE 2. The table of sand flat scale data.
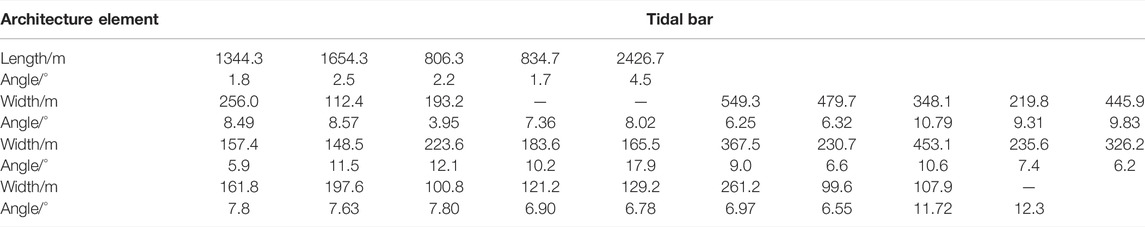
TABLE 3. The table of tidal bar scale data.
According to Table 1, the lateral angle of sand flats is 1.8–5.9°, the length is about 314.8–2,492.1 m, and the width is about 69.2–498.8 m. The lateral angle of the tidal bar is 1.7–12.3° from Table 2, the length is about 834.7–2,426.7 m, and the width is about 99.6–549.3 m. Compared to the modern estuary tidal bar (Figure 11A), the scale is reasonable. Sand flats generally have a smaller lateral angle than tidal bars.
6 Characteristics of Architecture Elements Evolution
It is common to analyze the sedimentary evolution of transverse and longitudinal sections and plane maps. This paper analyzes the sedimentary evolution of architecture elements through the fence diagram of transverse and longitudinal sections.
From the 3D fence diagram (Figure 9), the McMurray formation was deposited in the Devonian carbonate basement. There were regional unconformities in the carbonate basement, and the ancient geomorphology is rugged. Paleo-valleys developed where the early deposition of the Middle McMurray Formation took place. In Middle McMurray, mainly salt marsh and point bar deposited, channel deposits can also found accidentally. In Upper McMurray, tidal flats and tidal bars deposited and the distribution range of tidal flat and tidal bar system became more extensive and moved to the southeast direction during the evolution process, indicating that the marine area expanded during this period. The superposition pattern of tidal bar and sand flat changes from lateral stacking to vertical stacking. The lateral-migrated tidal bar and sand flat direction is consistent with the direction of ebb tide in the longitudinal profile, indicating that the ebb tide mainly controls the formation of tidal bar. The tidal flat system filled in U1-2; the tidal flat and tidal bar existed in U1-2 and U1-1. Two periods of large composited tidal bars appeared in the seaward northwest, and in U1-1 moved seaward compared with the earlier one in U1-2. The small tidal bars spread landward and divergent flows controlled the spread direction. The spread area of the later layer in U1-1 was wider than the early layer in U1-2, which means the marine area expanded during this period. It can confirmed the deposits developed all over the study area in U1-1. So the sedimentary system evolved landward in total. At the top of McMurray, offshore deposited all over the area, indicating open marine. It was an evolution from estuarine coastal plain to inner-middle estuary, and last to outer estuary. The sedimentary evolution of architecture elements was mainly retrogradation with rising sea levels. The sedimentary system moved to the landward.
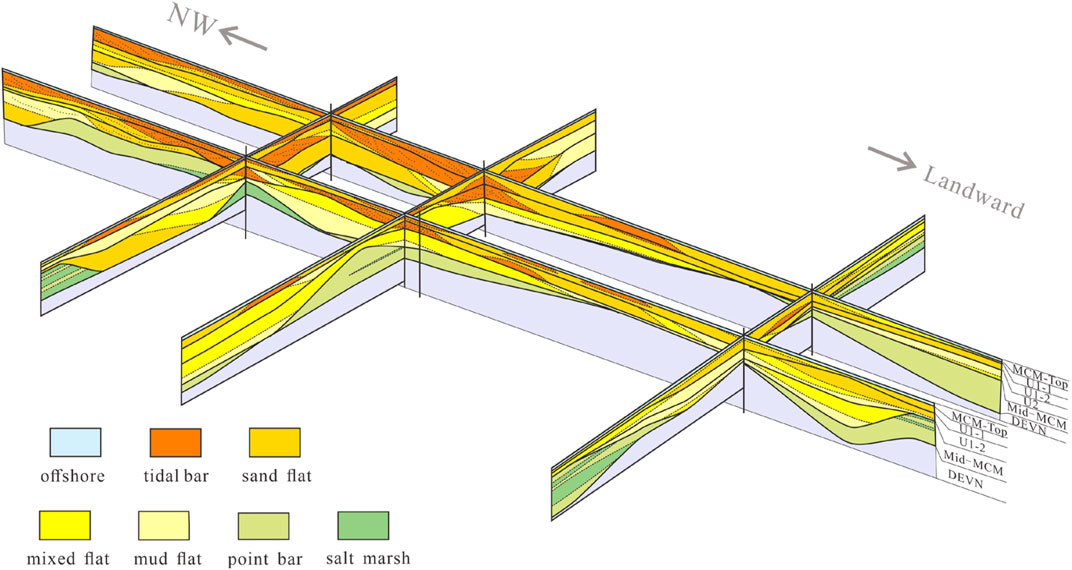
FIGURE 9. 3D fence diagram of architectural elements. A large lateral-migrated tidal bar was deposited in the northwest seaward; occasional erosion and filling in the southeast landward existed. The Middle McMurray wasn’t our main study layer, we simplified its architecture elements: points bar including tidal point bar and fluvial point bar, salt marsh including salt marsh and channel.
7 Discussion
An estuary is a transgressive coastal environment at the mouth of a river that receives sediment from both fluvial and oceanic sources. Tidal bar is one of the important parts of the estuary. Lateral accretion seems to be a key process of sediment accretion (Billy et al., 2012). We believe that sand flat also has the characteristics of lateral-migrated deposition. Modern estuarine sediments can provide evidence for lateral-migrated tidal bars.
The middle and late Holocene Columbia River was described as an estuary (Jay and Smith, 1990; Baker et al., 2010), and it was a marine transition that is located in North America. Columbia River Estuary is dominated by flood-tidal function, and its sedimentary system is affected by plate tectonics and sea level. Columbia River Estuary is deposited in the bedrock valley, and the valley has been filled with Pleistocene and Holocene fluvial and estuarine sediments (Sherwood and Creager, 1990). The Columbia River estuarine sedimentary environment is very similar to our study area, which is essential for interpreting the subsurface architecture of the McMurray Formation. A satellite image of the modern deposition of the Columbia Estuary (Figure 10A) shows the development of multiple tidal bars at the mouth of the estuary and a large lateral-migrated tidal bar at the outer estuary. As shown in Figure 10B, the large tidal bar is elongated and consists of multiple lateral accretion bodies in different directions that agree with our opinion. But it is difficult for sand flats to prove for sand flat generally locate underwater, and theoretically, we think there is lateral accretion inside sand flats.
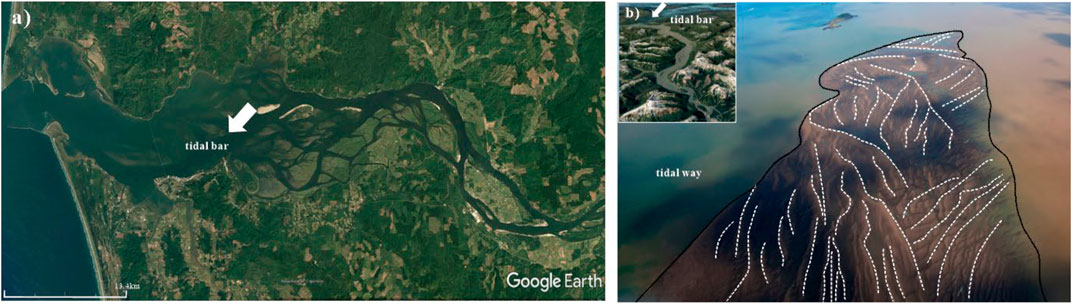
FIGURE 10. (A) Google Earth satellite image of a modern tide-controlled estuarine sedimentary system (Columbia River Estuary); (B) The low tide level at the Columbia River mouth is a large composited tidal bar.
According to the horizontal distribution characteristics and the patterns of modern deposition, the horizontal distribution model of the architecture elements was presented (Figure 11). The channel and point bar was upstream of the estuary, and salt marsh deposited on the sides of the fluvial. There was also salt marsh on the sides of tidal flat. Tidal currents came into being tideway and encircled with salt marsh. Near the mouth of the estuary, influenced by hydrodynamic force from fluvial and tidal, the sediments were reformed strongly, and only small tidal bars were left. The hydrodynamic force became weak in the seaward and tidal currents transported marine sands into there, for which the sediments more easily remained and a large tidal bar deposited. In this situation, high angle continuous lateral accretions in different directions formed together as a giant tidal bar. It is a tidal-dominated estuary system around tidal bars, and deposited in a sand flat, mixed flat and mud flat sequence from tidal bar and coastal plain.
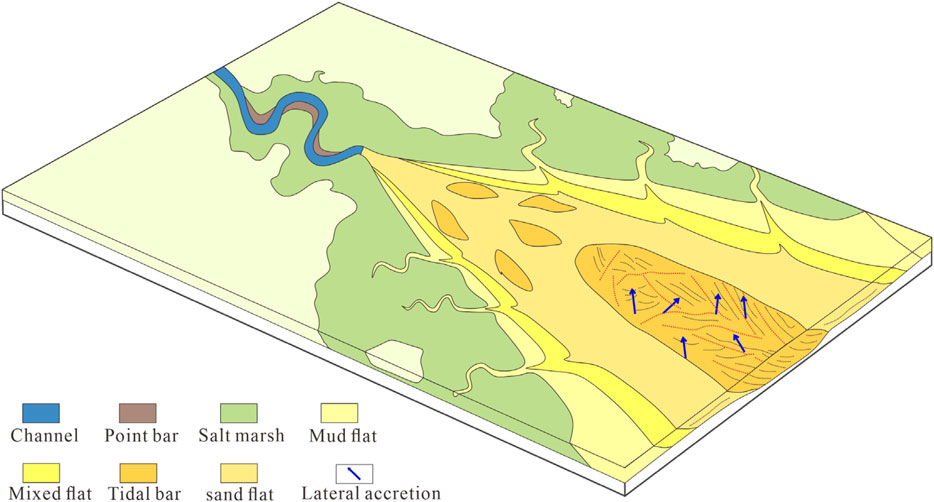
FIGURE 11. The horizontal distribution pattern of the architecture.
The formative process of the tidal bars is fascinating and worthy to study. Inside the estuary, it is mainly controlled by the ebb tide, allowing the river to superimpose itself on the tide. But how do tidal flows affect the buildup still needs to make a deep study. Also, the sea level fluctuated frequently, and it considerably affected the stratigraphic framework; starting with the sea level cycle can be a good method to study the evolution of the estuary.
8 Conclusion
This paper provides a detailed description of the McMurray Formation in the study area using the core data, logging data and seismic characteristics. We demonstrate that 14 kinds of lithofacies and 9 kinds of architecture elements. The nine types of architecture elements are channel, salt marsh, fluvial point bar, tidal point bar, mud flat, mixed flat, sand flat, tidal bar, and offshore deposits. In vertical view, fluvial point bar, tidal point bar, salt marsh and channel were in the Middle McMurray Formation; tidal bar and tidal flat (sand flat, mixed flat, and mud flat) deposited in Upper McMurray Formation, and their distribution range widened from bottom to top; later, the offshore covered the top of McMurray. It was a process from estuarine coastal plain to inner-middle estuary, then to outer estuary. The sedimentary system moved in the landward, corresponding to increased sea level. In map view, fluvial point bars and salt marsh are developed on sides of the channel. And tidal flat, tidal bar, tidal flat and offshore are developed in the seward of the channel. Salt marshes are distributed along estuarine coastal plain connecting with tidal point bar, which spreads outside the tidal flat.
Tidal bar and sand flat have low Gr with reverse rhythm shows that tidal bar and sand flat are high-quality reservoirs. Sand flats and tidal bars have four types of superposition patterns. The tidal bar in dense well pattern was lateral stacking or vertical stacking with lateral-migrated or forward-migrated sand flat. Lateral stacking often occurred in U1-2 and vertical stacking often occurred in U1-1. The tidal bars of the main sedimentary area were wide-band with typical high-angle continuous lateral accretion located in the incised valley of the main tide. Fluvial currents hardly influence it. It is a large complex with a lateral angle of 6–12°, a width of 100–550 m, and a length of 800–2,400 m. The landward tidal bars reformed by powerful bi-directional currents, resulting in smaller scale than compounds seaward. Sand flats often superimposed with mixed flats. Erosion and filling occasionally occured inside sand flat. The lateral angle of sand flat is 2–6°, and the length is about 300–2,500 m.
The McMurray formation deposited in unconformities of Devonian carbonate basement. Its sediments gradually transitioned from fluvial to tidal sediments. In Upper McMurray, tidal flats and tidal bars became more extensive and moved to the northwest direction in the process of evolution, indicating that the marine area expanded.
Data Availability Statement
The original contributions presented in the study are included in the article/Supplementary Material, further inquiries can be directed to the corresponding authors.
Author Contributions
Conception and design of study by WF and YY. Data supported by JH. Analysis and interpretation of data by WF, WZ, LW, and HS. Drafting the manuscript by WZ. Manuscript revision comments from YY and WF.
Funding
This study was financially supported by the National Natural Science Foundation of China (Grant Nos 42130813 and 41872138).
Conflict of Interest
The authors declare that the research was conducted in the absence of any commercial or financial relationships that could be construed as a potential conflict of interest.
Publisher’s Note
All claims expressed in this article are solely those of the authors and do not necessarily represent those of their affiliated organizations, or those of the publisher, the editors and the reviewers. Any product that may be evaluated in this article, or claim that may be made by its manufacturer, is not guaranteed or endorsed by the publisher.
References
Allen, J. R. L. (1983). Studies in Fluviatile Sedimentation: Bars, Bar-Complexes and Sandstone Sheets (Low-Sinuosity Braided Streams) in the Brownstones (L. Devonian), Welsh Borders. Sediment. Geol. 33 (4), 237–293. doi:10.1016/0037-0738(83)90076-3
Baker, D., Peterson, C., Hemphill-Haley, E., and Twichell, D. (2010). Latest Pleistocene and Holocene (2-16ka) Sedimentation in the Columbia River Estuary, Oregon, USA. Mar. Geol. 273 (1-4), 83–95. doi:10.1016/j.margeo.2010.02.005
Barton, M. D., and Seibel, C. (2016). The Architecture and Variability of Valley-Fill Deposits within the Cretaceous McMurray Formation, Shell Albian Sands Lease, Northeast Alberta. Bull. Can. Pet. Geol. 64 (2), 166–198. doi:10.2113/gscpgbull.64.2.166
Billy, J., Chaumillon, E., Féniès, H., and Poirier, C. (2012). Tidal and Fluvial Controls on the Morphological Evolution of a Lobate Estuarine Tidal Bar: The Plassac Tidal Bar in the Gironde Estuary (France). Geomorphology 169-170, 86–97. doi:10.1016/j.geomorph.2012.04.015
Boggs, S. (2012). Marginal Marine Environments. Principles of Sedimentology and Stratigraphy, ed. C. Dudonis (New Jersey, FL: Prentice-Hall Press), 246–279.
Carrigy, M. A. (1959). Geology of the McMurray Formation: General Geology of the McMurray AreaResearch Council of Alberta, Geological Division.
Cheng, L., Yin, Y., Wang, H., Feng, W., Wang, L., Liu, Z., et al. (2020). Analysis of the Internal Architectural Elements of Tidal-Influenced Meandering Fluvial Deposits Using Well Logging and Seismic Data: The Study of the Athabasca Oil Sands, Alberta, Canada. Interpretation 8 (3), SM103–SM114. doi:10.1190/INT-2019-0170.1
Crerar, E. E., and Arnott, R. W. C. (2007). Facies Distribution and Stratigraphic Architecture of the Lower Cretaceous McMurray Formation, Lewis Property, Northeastern Alberta. Bull. Can. Pet. Geol. 55 (2), 99–124. doi:10.2113/gscpgbull.55.2.99
Dalrymple, R. W., and Choi, K. (2007). Morphologic and Facies Trends through the Fluvial-Marine Transition in Tide-Dominated Depositional Systems: A Schematic Framework for Environmental and Sequence-Stratigraphic Interpretation. Earth-Sci. Rev. 81 (3-4), 135–174. doi:10.1016/j.earscirev.2006.10.002
Feng, W., Yin, Y., Zhang, C., Duan, T., Zhang, W., Hou, G., et al. (2019). A Training Image Optimal Selecting Method Based on Composite Correlation Coefficient Ranking for Multiple-point Geostatistics. J. Pet. Sci. Eng. 179, 292–311. doi:10.1016/j.petrol.2019.04.046
Fenies, H., and Tastet, J. P. (1998). Facies and Architecture of an Estuarine Tidal Bar (The Trompeloup Bar, Gironde Estuary, Sw france). Mar. Geol. 150, 149–169. doi:10.1016/S0025-3227(98)00059-0
Hauck, T. E., Peterson, J. T., Hathway, B., Grobe, M., MacCormack, K., and Cotterill, D. (2017). New Insights from Regional-Scale Mapping and Modelling of the Paleozoic Succession in Northeast Alberta: Paleogeography, Evaporite Dissolution, and Controls on Cretaceous Depositional Patterns on the Sub-Cretaceous Unconformity. Bull. Can. Pet. Geol. 65 (1), 87–114. doi:10.2113/gscpgbull.65.1.87
Hein, F. J., and Cotterill, D. K. (2006). The Athabasca Oil Sands - A Regional Geological Perspective, Fort McMurray Area, Alberta, Canada. Nat. Resour. Res. 15 (2), 85–102. doi:10.1007/s11053-006-9015-4
Hein, F. J., Marsh, R. A., and Boddy, M. J. (2008). Overview of the Oil Sands and Carbonate Bitumen of Alberta: Regional Geologic Framework and Influence of Salt-Dissolution Effects. Heavy oil and bitumen in foreland basins, eds J. Suter, D. Leckie, and S. Larter (Banff, AB: American Association of Petroleum Geologists), 5.
Jay, D. A., and Smith, J. D. (1990). Circulation, Density Distribution and Neap-Spring Transitions in the Columbia River Estuary. Prog. Oceanogr. 25 (1-4), 81–112. doi:10.1016/0079-6611(90)90004-L
Miall, A. D. (1988). Architectural Elements and Bounding Surfaces in Fluvial Deposits: Anatomy of the Kayenta Formation (Lower Jurassic), Southwest Colorado. Sediment. Geol. 55 (3-4), 233–262. doi:10.1016/0037-0738(88)90133-9
Miall, A. D. (1985). Architectural-Element Analysis: A New Method of Facies Analysis Applied to Fluvial Deposits. Earth-Sci. Rev. 22 (4), 261–308. doi:10.1016/0012-8252(85)90001-7
Mutti, E. (1985). Turbidite Systems and Their Relations to Depositional Sequences. Provenance of Arenites. Dordrecht: Springer, 65–93. doi:10.1007/978-94-017-2809-6_4
Odin, G. S. (1985). Significance of green particles (glaucony, berthierine, chlorite) in arenites. in Provenance of Arenites: NATO-Advanced Study Institute Series C: Mathematical and physical sciences, ed. G. G. Zuffa (Dordrecht, FL: D. Reidel Publishing), 279–307
Olariu, C., Steel, R. J., Dalrymple, R. W., and Gingras, M. K. (2012). Tidal Dunes versus Tidal Bars: The Sedimentological and Architectural Characteristics of Compound Dunes in a Tidal Seaway, the Lower Baronia Sandstone (Lower Eocene), Ager Basin, Spain. Sediment. Geol. 279, 134–155. doi:10.1016/j.sedgeo.2012.07.018
Phillips, J. (2011). Sedimentology, Ichnology, and Development of a Sub-regional Depositional and Stratigraphic Framework for the McMurray-Wabiskaw Succession in the MacKay River Area, Northeastern Alberta. Master's Thesis. Alberta: University of Alberta
Rahnama, F., Marsh, R. A., and Philp, L. (2013). The Alberta Oil Sands: Reserves and Long-Term Supply Outlook," in Heavy-Oil and Oil-Sand Petroleum Systems in Alberta and Beyond, eds F. J. Hein, D. Leckie, S. Larter, and J. R. Suter (Tulsa, OK: American Association of Petroleum Geologists), 133–144
Sherwood, C. R., and Creager, J. S. (1990). Sedimentary Geology of the Columbia River Estuary. Prog. Oceanogr. 25 (1-4), 15–79. doi:10.1016/0079-6611(90)90003-K
Tang, M., Zhang, K., Huang, J., and Lu, S. (2019). Facies and the Architecture of Estuarine Tidal Bar in the Lower Cretaceous Mcmurray Formation, Central Athabasca Oil Sands, Alberta, Canada. Energies 12 (9), 1769. doi:10.3390/en12091769
Tessier, B., Billeaud, I., Sorrel, P., Delsinne, N., and Lesueur, P. (2012). Infilling Stratigraphy of Macrotidal Tide-Dominated Estuaries. Controlling Mechanisms: Sea-Level Fluctuations, Bedrock Morphology, Sediment Supply and Climate Changes (The Examples of the Seine Estuary and the Mont-Saint-Michel Bay, English Channel, NW France). Sediment. Geol. 279, 62–73. doi:10.1016/j.sedgeo.2011.02.003
Thomas, R. G., Smith, D. G., Wood, J. M., Visser, J., Anne, E., and Koster, H. (1987). Inclined Heterolithic Stratification—Terminology, Description, Interpretation and Significance. Sediment. Geol. 53 (1-2), 123–179. doi:10.1016/S0037-0738(87)80006-4
Wang, L., Yin, Y., Wang, H., Zhang, C., Feng, W., Liu, Z., et al. (2021). A Method of Reconstructing 3D Model from 2D Geological Cross-Section Based on Self-Adaptive Spatial Sampling: A Case Study of Cretaceous McMurray Reservoirs in a Block of Canada. Pet. Explor. Dev. 48 (2), 407–420. doi:10.1016/S1876-3804(21)60032-0
Wang, X., Hou, J., Li, S., Dou, L., Song, S., Kang, Q., et al. (2020a). Insight into the Nanoscale Pore Structure of Organic-Rich Shales in the Bakken Formation, USA. J. Pet. Sci. Eng. 191, 107182. doi:10.1016/j.petrol.2020.107182
Wang, X., Liu, Y., Hou, J., Li, S., Kang, Q., Sun, S., et al. (2020b). The Relationship between Synsedimentary Fault Activity and Reservoir Quality - A Case Study of the Ek1 Formation in the Wang Guantun Area, China. Interpretation 8, sm15–sm24. doi:10.1190/INT-2019-0131.1
Wang, X., Yu, S., Li, S., and Zhang, N. (2022b). Two Parameter Optimization Methods of Multi-Point Geostatistics. J. Pet. Sci. Eng. 208, 109724. doi:10.1016/j.petrol.2021.109724
Wang, X., Zhang, F., Li, S., Dou, L., Liu, Y., Ren, X., et al. (2021). The Architectural Surfaces Characteristics of Sandy Braided River Reservoirs, Case Study in Gudong Oil Field, China. Geofluids 2021, 1–12. doi:10.1155/2021/8821711
Wang, X., Zhou, X., Li, S., Zhang, N., Ji, L., and Lu, H. (2022a). Mechanism Study of Hydrocarbon Differential Distribution Controlled by the Activity of Growing Faults in Faulted Basins: Case Study of Paleogene in the Wang Guantun Area, Bohai Bay Basin, China. Lithosphere 2021 (Special 4), 7115985. doi:10.2113/2022/7115985
Westerhold, T., Bickert, T., and Röhl, U. (2005). Middle to Late Miocene Oxygen Isotope Stratigraphy of ODP Site 1085 (SE Atlantic): New Constrains on Miocene Climate Variability and Sea-Level Fluctuations. Palaeogeogr. Palaeoclimatol. Palaeoecol. 217 (3-4), 205–222. doi:10.1016/j.palaeo.2004.12.001
Keywords: tide-dominated estuary, McMurray Formation, architecture elements, tidal bar, sand flat, lateral accretion
Citation: Zhang W, Huang J, Feng W, Wang L, Shang H and Yin Y (2022) Reservoir Architecture in Tide-Dominated Estuary: A Case Study of McMurray Formation Oil Sand Reservoir in the Athabasca Block, Canada. Front. Earth Sci. 10:894059. doi: 10.3389/feart.2022.894059
Received: 11 March 2022; Accepted: 10 May 2022;
Published: 30 May 2022.
Edited by:
Chen Zhang, Chengdu University of Technology, ChinaReviewed by:
Yuming Liu, China University of Petroleum, ChinaXiaoming Zhao, Southwest Petroleum University, China
Copyright © 2022 Zhang, Huang, Feng, Wang, Shang and Yin. This is an open-access article distributed under the terms of the Creative Commons Attribution License (CC BY). The use, distribution or reproduction in other forums is permitted, provided the original author(s) and the copyright owner(s) are credited and that the original publication in this journal is cited, in accordance with accepted academic practice. No use, distribution or reproduction is permitted which does not comply with these terms.
*Correspondence: Jixin Huang, MTA1MjE3NjMyQHFxLmNvbQ==; Yanshu Yin, eXlzQHlhbmdldHpldS5lZHUuY24=