 Rujun Wang
 Chengze Zhang
95% of researchers rate our articles as excellent or good
Learn more about the work of our research integrity team to safeguard the quality of each article we publish.
Find out more
ORIGINAL RESEARCH article
Front. Earth Sci. , 04 May 2022
Sec. Structural Geology and Tectonics
Volume 10 - 2022 | https://doi.org/10.3389/feart.2022.893701
This article is part of the Research Topic Advances in the Study of Natural Fractures in Deep and Unconventional Reservoirs View all 29 articles
To study the microscopic seepage mechanism of gas and water in fractured sandstone gas reservoirs of low porosity, this kind of reservoir in the Keshen gas field, Kuqa depression of Tarim basin in China, was taken as an example. Based on rock samples and microscopic visualization technology, nuclear magnetic resonance experiments of saturated water–gas drive and CT scanning experiments of saturated gas–water drive were conducted. The seepage mechanism of water invasion during the gas development were simulated. Subsequently, the distribution of irreducible water saturation and the influence factors on the efficiency of drive were analyzed. The results show that the distribution of gas and water is mainly related to structures of matrix pores, fracture development pattern, and density. The main factors resulting into good reservoirs include large matrix pores and high angle fractures, low irreducible water saturation, and high separation between gas and water. The efficiency of water drive is positively correlated with fracture porosity and dip angle. High angle fractures can effectively improve the seepage capability and then increase the efficiency of water drive. Besides, the great proportion of large pore size in matrix, high fracture dip, porosity, and density can also improve the efficiency of water drive. Therefore, for the development of fractured sandstone gas reservoirs of low porosity, the study of matrix pores and fractures is quite important since it can provide guidance for the efficient deployment of wells. The increase of fracture density is significant by large-scale sand fracturing in order to improve the efficiency of water drive. It is necessary to strictly control the gas production rate of the gas reservoir and delay the water invasion rate as far as possible. In case of serious waterlogging, shut-in all wells in gas reservoirs is a choice to strengthen the gas–water imbibition between fractures and matrix, which can improve the recovery of the gas reservoir.
With the exploitation of shallow-middle oil and gas resources, ultra-deep oil and gas have gradually become the focus and hotspot in exploration and development of oil and gas (Wang et al., 2018). In China, more and more exploration breakthroughs of oil and gas in deep reservoirs have appeared, such as the middle-deep carbonate reservoirs in the Sichuan Basin (Sun et al., 2013; Zeng et al., 2016), and the deep clastic reservoirs in the Kuqa depression of the Tarim basin (Wei et al., 2018). Dabei, Keshen, and Bozi gas fields in the Kuqa depression have been discovered successively. The proven reserves and gas production in fractured sandstones of low porosity in the Kuqa depression of the Tarim basin show a trend of rapid growth. At present, the proven geological reserves exceed one trillion cubic meters and the natural gas production capacity exceeds 15 billion cubic meters. Gas in deep reservoirs has become the main field for increasing natural gas storage and production in Tarim Oilfield, China.
Due to strong tectonic compression, the Keshen gas field mainly developed high and steep subsalt structures (Zeng et al., 2017; Wang et al., 2019; Li et al., 2020). The structural style and fracture system are complex. Multi-order and multi-stage fractures developed, which makes reservoirs strong heterogeneity (Gong et al., 2019a; Gong et al., 2019b; Wang et al., 2020; Wang et al., 2022). The distribution of edge and bottom water is ubiquitous, and the gas–water relationship is complex (Lai et al., 2017; Zhao et al., 2018; Zhang et al., 2021). The complex percolation system is composed of micro-fractures, matrix pores, and artificial fractures (Yao et al., 2014). It seriously restricts the accumulation process, which controls the distribution of gas and water, and has a profound impact on the overall development effect of gas reservoirs (Dong et al., 2018). A large number of examples show that (1) gas wells at the edge of gas reservoirs will produce water after producing about 1–2 years, and (2) gas wells at the middle and high structural area of gas reservoirs will produce water to some extent after producing about 4–5 years. After a period of production with water, the productivity plummets precipitously (Hu et al., 2016). The remaining gas in the matrix is sealed by formation water, and the development efficiency and recovery of gas reservoirs are seriously influenced. Due to complex seepage channels in the gas reservoirs, the gas–water relationship, the distribution of irreducible water saturation, and the influencing factors of the efficiency of gas drive are ambiguous. These seriously affect the development efficiency. It is urgent to study the distribution law of gas and water. During the development of sandstone gas reservoirs of low porosity, a large amount of the remaining gas in the matrix is blocked by formation water as a result of water drive. This seriously restricts the recovery of gas reservoirs. It is necessary to implement the seepage mechanism research under the condition of water drive so as to provide a solid theoretical basis for the realization of increasing gas storage and production in the Keshen gas field (Li et al., 2017; Zhao et al., 2017; Wang et al., 2019). Based on the reservoir characteristics, gas–water distribution, and dynamic characteristics of the Keshen gas field in the Kuqa depression, rock samples were used to carry out the nuclear magnetic resonance (NMR) experiment of saturated water–gas drive and the CT scanning experiment of saturated gas–water drive. By using a centrifuge, NMR scanner, and micron CT scanner, the changes of structures of pore throat, fluid saturation, and drive efficiency of matrix and fractures in the process of drive were observed. Then, the microscopic seepage mechanism of the fractured sandstones reservoir of low porosity was studied. The technical countermeasures for efficient development of such gas reservoirs are put forward, which can provide guidance for efficient development and increase of oil recovery of ultra-deep gas field groups in the Kuqa depression, Tarim basin.
The Kuqa depression is located in the Tarim basin in northwest China. It is a foreland basin developed in the basin-mountain deformation system of the Tarim basin in the southern Tianshan mountain (Zeng et al., 2002; Zeng, 2004). Since the late Permian, Kuqa depression experienced Yan Shan movement and Himalayan movement. There are four evolution stages, namely the stages of foreland basin, depression basin, deflection basin, and intracontinental foreland basin. Subsequently, “four zones and two depressions” formed: northern monocline belt, Kelasu structural belt, Yiqikelike structural belt, southern uplift, Yangxia sag, and Baicheng sag (Lai et al., 2014).
As shown in Figure 1, the target area Keshen gas field is located in the Keshen zone of the Kelasu structural belt (Wang et al., 2018), which lies in the northeast of the Kuqa depression. In the past two decades, deep and ultra-deep gas fields have been discovered in the Kelasu structural belt, such as Kela, Keshen, Dabei, and Bozi, which are arranged in the east-west direction.
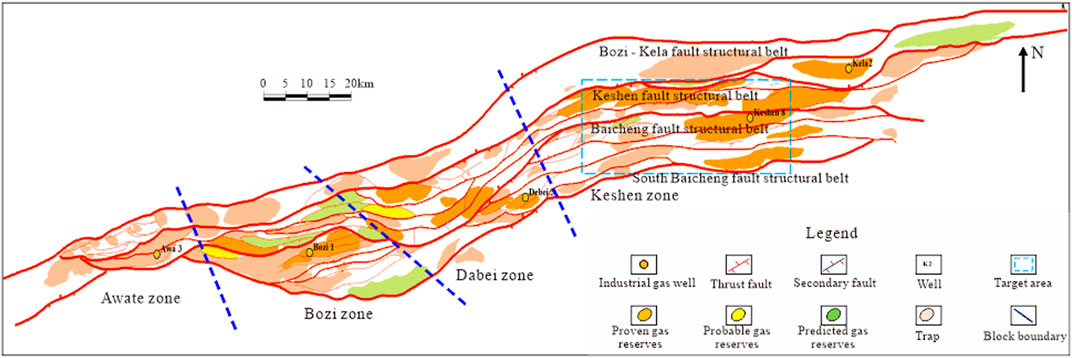
FIGURE 1. Location of the target area Keshen gas field.
A large number of anticlinal and fault-anticlinal structural trap gas reservoirs are developed in the Keshen zone, with nearly one trillion cubic meters of geological reserves. Such gas reservoirs are stored in the formation of 6,500–8,000 m, with high formation pressure (100–135 MPa) and rich formation water. The reservoir thickness is huge (300–320 m).
The main gas-producing formation of the Keshen gas field is Cretaceous Bashijiqike Formation (K1bs) (Figure 2). It can be divided into K1bs1, K1bs2, and K1bs3. K1bs1 is affected by tectonic uplift and suffered from different degrees of denudation (Yang et al., 2021). K1bs1 and K1bs2 are braided river delta deposits, and K1bs3 is fan delta deposits. The formation thickness of K1bs is stable as a whole, and K1bs has good transverse continuity. In K1bs, there are thin interlayers of poor continuity. Distributary channel microfacies and mouth bar microfacies are important effective reservoirs (Xu et al., 2021).
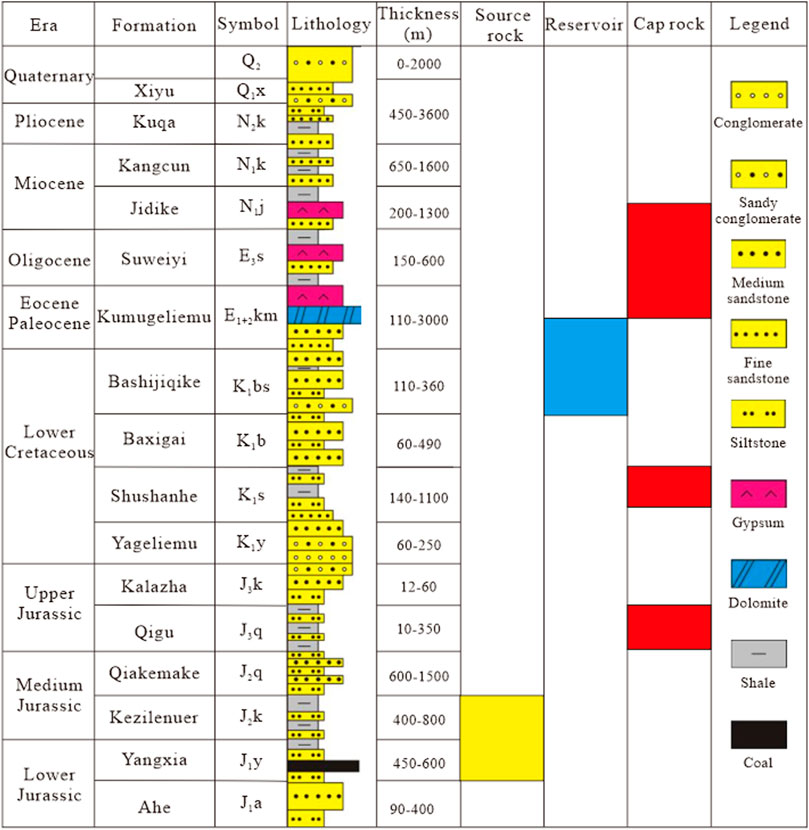
FIGURE 2. Stratigraphic column of the Keshen gas field (Lai et al., 2017).
K1bs is mainly composed of medium- and fine-grained feldspar lithic sandstones and lithic feldspar sandstones. The common authigenic minerals include authigenic quartz, authigenic feldspar, dolomite, and carbon (Figure 3A). The matrix porosity mainly ranges from 2% to 6%, with an average of 4.2%. The matrix permeability ranges from 0.01 to 0.10 mD, with an average of 0.075 mD. Reservoir space is mainly composed of intergranular dissolution pores and intragranular dissolution pores. There are also a few microfractures (Figures 3A,D). Fine mesopores, micropores, and microthroats are mainly developed in the matrix. The pore diameter ranges from 1 to 56.6 μm, and the throat ranges from 400 to 500 nm (Figure 3B). All these indicate that the target reservoir is a typical deep-ultra-deep fractured sandstones reservoir of low porosity. Outcrops, cores, and thin sections show that the gas reservoir has developed multi-stage and multi-scale fractures (Zhang et al., 2014; Feng et al., 2021; Liu et al., 2021), which are mainly semi-filled to unfilled high-angle fractures. The fracture aperture ranges from 0.5 to 4 mm (Figures 3C,D).
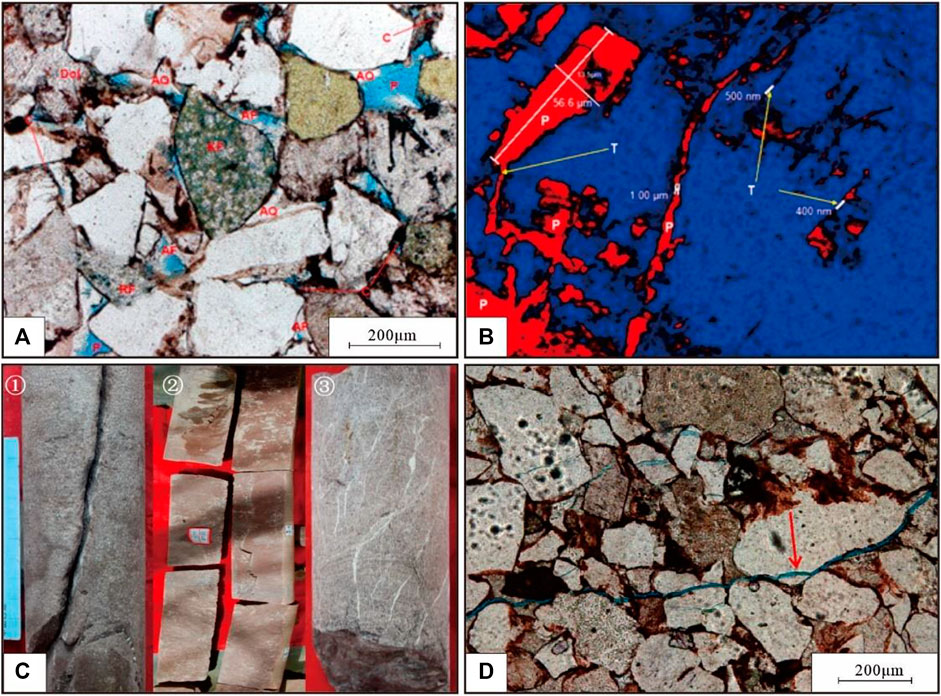
FIGURE 3. Fracture characteristics of ultra-deep reservoirs in the Keshen gas field. Notes: (A) Well K2, 6,723.86 m, the reservoir space is enlarged by intergranular dissolution. Autogenic quartz, AQ; Clay minerals, C; Porosity, P; Dolomite, Dol; K-feldspar, KF; Autogenic feldspar, AF; (B) Well K2, 6,706.5 m, Laser confocal, pore diameter 1–56.6 μm, throat 400–500 nm. Throat, T; (C) Core with fractures, ① Well K8, 7,368–7,368.5 m, high angle fracture half-filled, with fracture aperture 0. 5∼2 mm; ② Well K13, 7,639.5–7,640.4 m, open vertical split longitudinal fracture; ③ Well K2, 6,991.2–6,991.4 m, tensile fractures, half-filled to fully filled by calcite, fracture aperture 1∼4 mm; (D) Well K24, 6,506.24 m, fracture often cuts through grains, fracture width 10–50 μm.
The distribution of gas and water in the Keshen gas field is complex. It can be divided into two categories: (1) The first type is gas–water abnormity caused by buoyancy. The leakage of drilling fluid leakage phenomenon is common in the drilling process. Gas is stored in the high part of the structure. Hence, pure gas is mainly produced in high structural parts. (2) The other type has the characteristic that high parts of the structure store water. This kind of distribution is usually located in the relatively high part of the structure. During the drilling process, there is little or no leakage. Salt frost can rarely be observed in rock cores. Typically, this type corresponds to the water layer or gas–water layer.
The ultra-deep gas reservoirs in the target area are quite tight with the matrix of low porosity and well-developed fracture system. There are obvious differences in dynamic characteristics between ultra-deep gas reservoirs and conventional sandstone gas reservoirs of low porosity, fractured gas reservoirs (Zhao et al., 2017). After gas well reservoir reconstruction, the production of single well is high and stable, in which the open flow rate is generally more than one million square meters. The interference test and test pressure of gas well show that the plane interference signal of gas reservoir is obvious, and the overall connectivity of gas reservoir is good. Once the gas well produces water, the pressure of oil tube and production will decrease greatly. Taking well K1 as an example, this well is located in a high structural position. The oil test shows a high yield of gas which is pure gas. After production, the pressure of oil tube and production are relatively stable. In 2013, the water content used to gradually rise. Due to the continuous increase of bottomhole flow resistance, the pressure of oil tube and gas production decreased significantly. In 2015, after fractures were nearly filled with formation water, the pressure of oil tube of the gas well decreased in a cliff style, and gas was hardly produced (Figure 4). Current studies show that water invasion of this kind of gas reservoir is mainly along the fracture system, which is highly destructive and harmful to gas reservoirs.
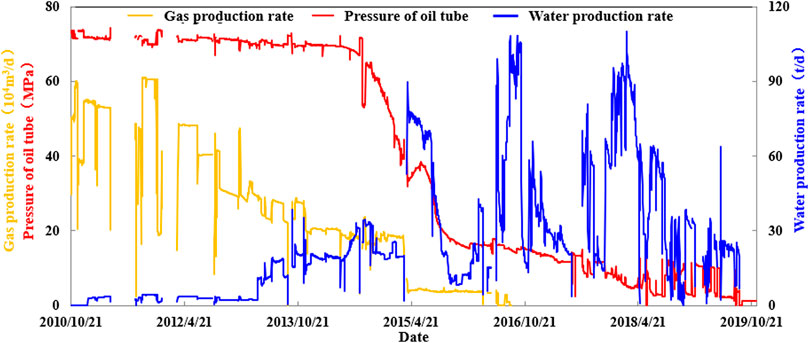
FIGURE 4. Fracture characteristics of ultra-deep reservoirs in the Keshen gas field.
The experimental instruments include an urc-628ultra centrifuge, an Oxford GeoSpec2 NMR scanner, and a micron CT-nano-voxel 3502E scanner. Samples for experiments are plunger-shaped rocks drilled from cores obtained from actual gas wells in the Keshen gas field. The sample length ranges from 3.12 to 3.85 cm, and the diameter is 2.48 cm. The porosity ranges from 4.70 to 8.1%, with an average porosity of 6.20%. The permeability ranges from 0.038 to 0.097 mD, with an average permeability of 0.076 mD. Six samples without fracture with different physical properties were selected, which is named as #64, #9, #19, #21, #51, and #3. Centrifugation tests at different speeds and NMR scanning were carried out at first. After the scanning, artificial fractures were made on the six samples. The fracture type of Sample #64, Sample #19, and Sample #51 is high angle longitudinal through fracture (HLF), the fracture type of Sample #3 is cross through fracture (TF), and the fracture type of Sample #9 and Sample #21 is high angle conjugate through fracture (HCF). Centrifugation and NMR tests were also carried out after cracking. The basic information before and after cracking was shown in Table 1.
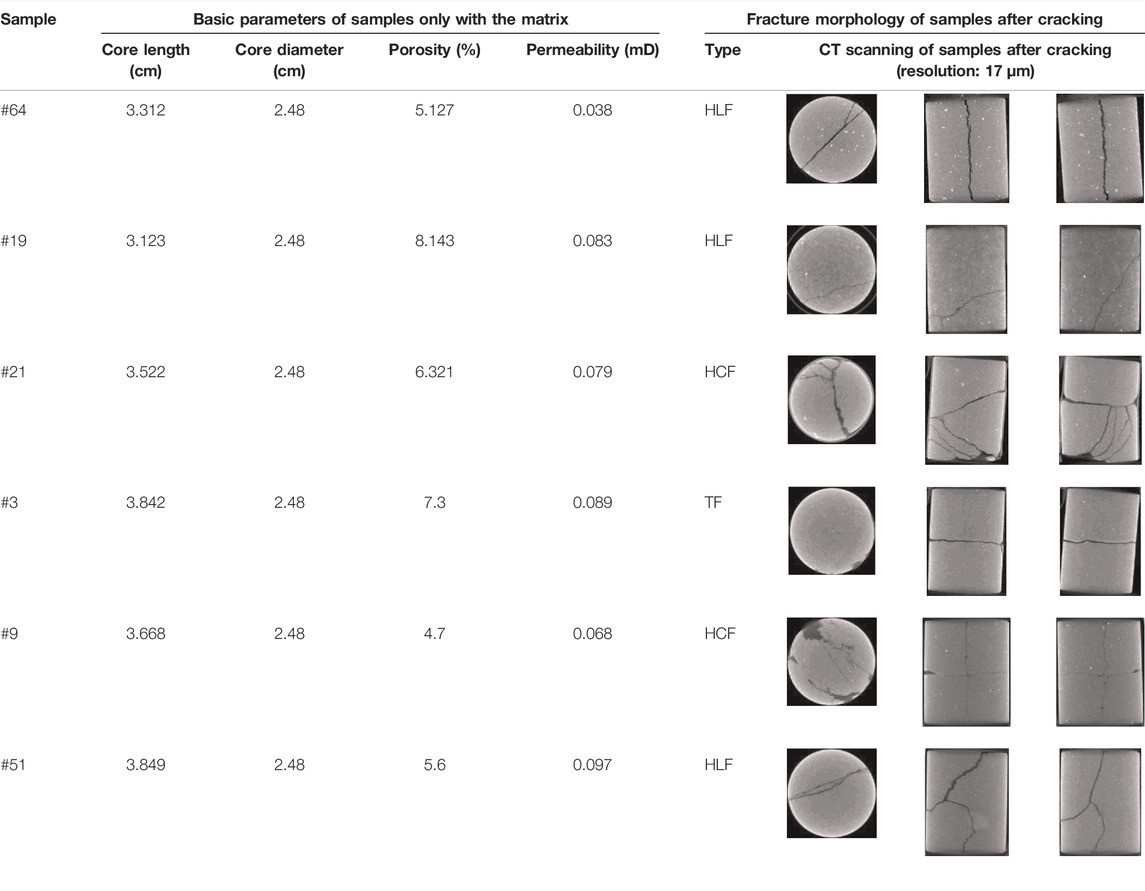
TABLE 1. Basic information of samples in the NMR experiment of saturated water–gas drive.
1) NMR Experiments of Saturated Water–Gas Drive
For fractured sandstone gas reservoirs of low porosity in the Keshen gas field, parts of the gas reservoirs in the process of development exist the complex distribution of gas–water. Structures of matrix pores and the fracture network system are the main factors on the distribution of gas and water. When the fault-fracture network is generally developed, a normal distribution of gas and water will be formed. When the fault-fracture network is not developed or only locally developed, water will be generated in the high part of the structure. The distribution of gas–water without fracture network and gas–water with local fracture network will be formed. Therefore, centrifugal experiments and NMR scanning of cores before and after cracking were carried out to study the seepage mechanism in the NMR experiment of saturated water–gas drive so as to quantitatively reveal the influence of different structures of pores and the fracture network system on the distribution of gas–water. The experimental steps mainly include the following: (1) The matrix plunger core was vacuumized and saturated with water before NMR scanning. (2) Centrifugation experiments at different speeds (1,500, 3,000, 5,000, 7,000, 9,000, 10,500, and 12000 r/min, respectively) were implemented, and NMR scanning was performed after each centrifugation. (3) The pore diameter distribution and capillary pressure curve of the samples were calculated by using the T2 spectrum of each NMR scanning. The gas drive parameters such as irreducible water saturation and efficiency of gas drive were evaluated. In this paper, the efficiency of gas drive is equal to the movable water saturation obtained by multiple centrifugations during the process of sample from the saturated water state to saturated irreducible water state. It can be defined as
(4) The six plunger cores only with matrix were made fractures. Then, the oil was washed and dried, and the first ∼ third steps of the experimental steps were repeated.
2) CT Scanning Experiments of Saturated Gas–Water Drive
In the fractured sandstone gas reservoirs of low porosity of the Keshen gas field, the water at the edge and bottom rushes forward rapidly along the fractures during water invasion. This results in premature water appearance of the gas well, and the pressure of oil tube and gas production decline rapidly after water appearance. Generally, the production with water takes 1–2 years, then the well is flooded and shut down, and a large amount of remaining gas is still stored in the matrix. At present, the water invasion mechanism of fractured sandstone gas reservoir of low porosity is mainly based on the laboratory physical simulation experiment and numerical model simulation. There are few seepage experiments of gas–water drive under microscopic conditions. There is no research on fluid distribution, imbibition, and influencing factors of the efficiency of gas–water drive under different fracture morphologies. Based on the CT scanning experiment of saturated gas–water drive, the seepage mechanism in water and gas of fractured sandstone gas reservoir of low porosity in the process of development was studied. Subsequently, quantitative characterizations of fluid distribution, imbibition, and drive efficiency between the matrix and fracture under different fracture morphologies were analyzed quantitatively.
Due to certain movable water in the cores after centrifugation, the state of saturated irreducible water is necessary before the CT scanning experiment of saturated gas–water drive. The movable water was removed by gas purging. The specific operation steps are as follows: (1) The core was weighed, and then the core was placed in the gripper. The confining pressure was set to 15 MPa, the temperature was set to 90°C, and the pressure at the inlet was adjusted to 10 MPa. Methane was injected from top to bottom, and the remaining water in the core was driven for 1 h to make the core reach to the state of saturated gas. (2) CT scanning was carried out on the core to obtain the distribution of pores and fractures under irreducible water condition. The core after gas drive was weighed. According to the difference of core quality, core appearance volume and porosity were interpreted by NMR and pore volume before and after the formation of irreducible water. The irreducible water saturation was calculated (Table 2).
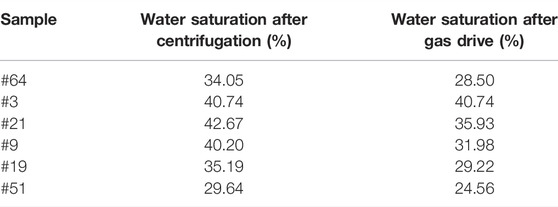
TABLE 2. Irreducible water saturation of samples after cracking.
After gas purging, the water saturation of the core decreases to a certain extent, but about 30% of the water in the fracture pores is still unwashed, forming irreducible water.
The CT scanning experiment of saturated gas–water drive was carried out after the above experiment. The experimental device is shown in Figure 5. The specific experimental steps are as follows: (1) The core was put into the gripper. The confining pressure was set to 15 MPa, the outlet pressure was set to 12 MPa, and the temperature was set to 90°C. (2) Aqueous solution with developer was injected from bottom to top, and the injection speed of water drive was set to 0.005 ml/min. (3) CT scanning of the upper and lower sections of the core with a precision of 16 microns was performed before water injection. (4) Sample #64 was flooded, and the water injection volume was measured at the inlet of the core. 0.15 PV, 0.3 PV, 0.5 PV, 0.75 PV, 1 PV, and 2 PV pore volume water (accumulative volume) were injected. Subsequently, Sample #3, Sample #21, Sample #9, Sample #19, and Sample #51 were flooded successively. 0.15 PV, 0.3 PV, 0.5 PV, and 1 PV pore volume water were injected respectively. After each injection, the upper and lower sections of the core were scanned. The upper and lower sections of the core were scanned after standing for 12 h, and then the next volume multiple was injected. (5) The water injection nodes of each sample were different. For Sample #51, the next volume multiple was directly injected instead of standing after CT scanning each time.
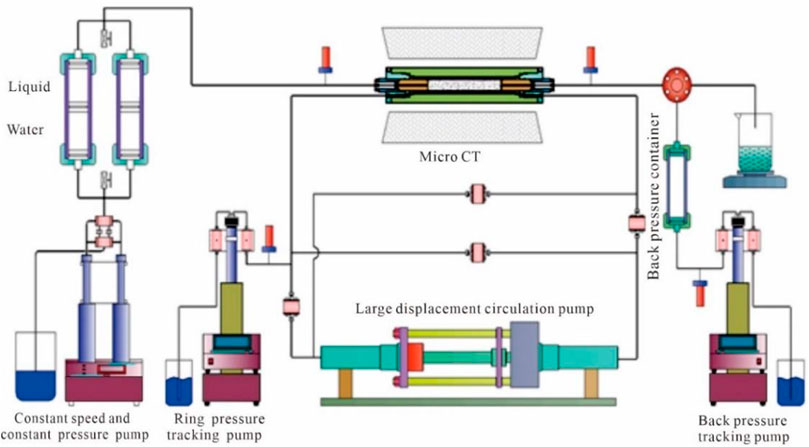
FIGURE 5. Image of the drive cooperative micron CT scanning device.
The technology of NMR is widely used in characterizing the structures of original pores. It is often used to construct “pseudo capillary pressure curve” and transform “pore diameter distribution curve” (Li al., 2005). Structures of original pores control the distribution of fluid in rock pores. The T2 spectrum of NMR reflects the distribution of pore volume by using the proportion of fluid filling in different pores. Different relaxation times (maximum relaxation time, peak relaxation time, minimum relaxation time, etc.) in the T2 spectrum of NMR correspond to different pore diameters. According to the correlation between logging data of NMR and mercury injection experimental data in the research area, the T2 spectrum of NMR was converted into “pseudo-capillary pressure curve.” Based on the corresponding relationship between the capillary pressure curve and core aperture, the pseudo-capillary pressure curve was used to measure the diameter distribution of core pores (Bai et al., 2016).
The porosity component is the percentage of the corresponding amplitude value of each relaxation time and the total amplitude value in the original amplitude T2 spectrum. The original amplitude T2 spectrum of NMR of Sample #21 at different speeds before and after cracking is converted into the T2 spectrum of the porosity component (Figure 6). The following characteristics can be obtained: (1) With the increase of centrifugal speed, the maximum relaxation time, peak relaxation time, and maximum porosity components of the sample before and after cracking are decreased. It can be inferred that with the increase of centrifugal speed, the content of movable water in the sample gradually decreases. When the centrifugal speed reaches to 10500 and 12000 r/min, their T2 spectrum is similar. It is indicated that the content of movable water is little and only irreducible water is left. (2) At the same centrifugal speed, the maximum relaxation time and the peak relaxation time of the sample increase after cracking. It is inferred that the pore diameter can be increased by cracking.

FIGURE 6. T2 spectrum of NMR Sample #21. Note: (A) Sample #21 only with matrix and (B) Sample #21 after cracking; “SC”, saturation component; “CC”, centrifugal component.
By comparing the T2 spectrum of NMR of different samples before and after cracking, it is qualitatively shown that the T2 spectrum of NMR reflects the structures of pores. It provides a basis for the quantitative analysis of pore diameter changes of samples before and after cracking (Dong et al., 2020).
According to the results of NMR, the distribution and variation of pore diameter before and after samples’ cracking can be inferred (Table 3). It can be seen that the percentage of pore diameter which is less than 20 nm ranges from 47.41% to 69.19%, with an average of 57.87%, that is, more than half is less than 20 nm. The percentage of pore diameter greater than 1000 nm ranges from 3.21% to 18.26%, with an average of 8.62%. Pores with pore diameter greater than 1000 nm are less than 10%. It is indicated that there are very many micro-pores at the nanometer level, while the proportion of large pores is very small, and cores is tight.
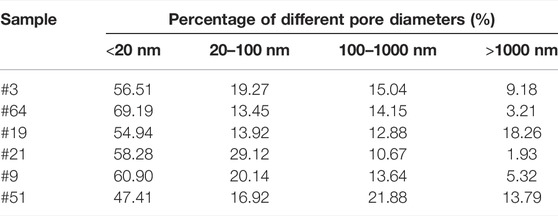
TABLE 3. Statistics on the percentage of different pore diameter distribution before cracking.
The pore diameter distribution of six samples was statistically measured by NMR (Table 4). It can be seen that the percentage of pore diameter distribution which is less than 20 nm ranges from 23.94% to 68.01%, with an average of 38.05%, that is, more than 1/3 of pore diameter is less than 20 nm. The percentage of pore diameter larger than 1000 nm ranges from 9.63% to 35.05%, with an average of 22.06%; it is indicated that a certain proportion of nano-sized micro-pores still exists after cracking and a certain number of large pores are also produced.
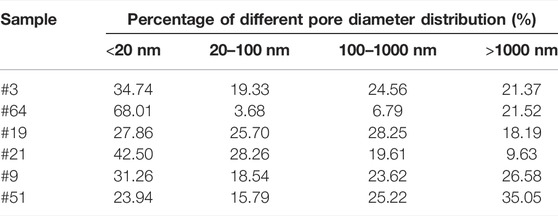
TABLE 4. Statistics on the percentage of different pore diameter distribution after cracking.
By comparing pore diameter distribution before and after cracking (Figures 7, 8), it can be seen that after cracking, the percentage of large pores increases. From the overall view of six samples, the percentage of pore diameter which is less than 20 nm decreases by 19.82%, that of pore diameter between 20 and 100 nm decreases by 0.25%, that of pore diameter between 100 and 1000 nm increases by 6.63%, and that of pore diameter more than 1000 nm increases by 13.44%.
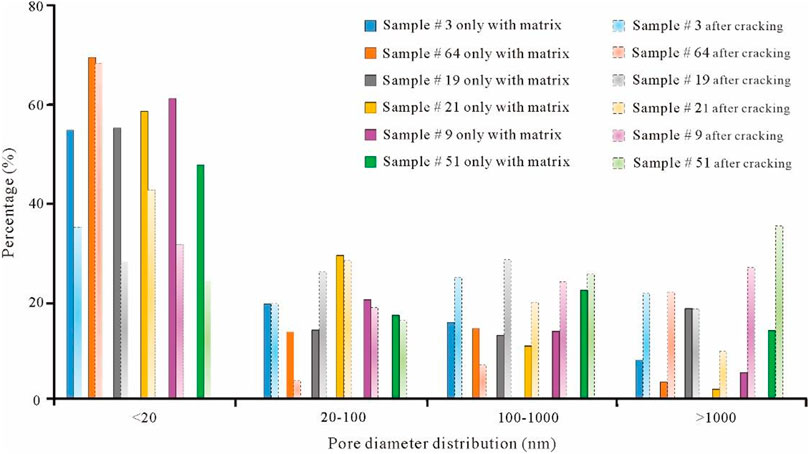
FIGURE 7. Percentage histogram of pore diameters of cores before and after cracking.
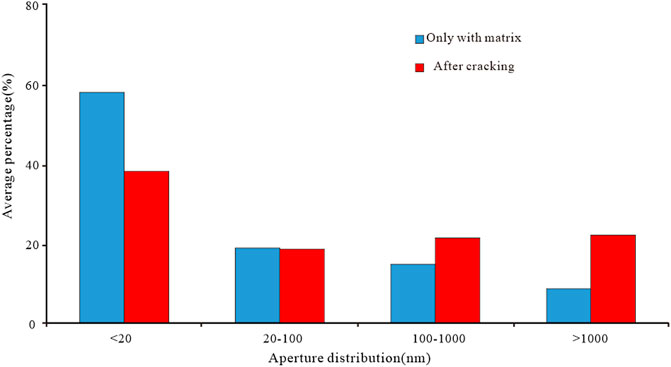
FIGURE 8. Histogram of the average percentage of pore diameter distribution before and after cracking.
For samples only with matrix, even if speed reaches to 12000 r/min, more than 50% of the water still cannot be effectively separated, forming high irreducible water saturation. Water in the larger pores has been driven themselves at the early stage of centrifugation, and the porosity interpreted by NMR decreases by about 42% during the whole process. For samples after cracking, porosity increases significantly. When speed reaches to 12000 r/min, irreducible water saturation is about 35% (Figure 9). During the whole process, the porosity interpreted by NMR decreases by about 65% (Figure 10). There is still water in tight micro-pores that has not been effectively driven, but fractures can effectively communicate the tight structure to a certain extent and improve drive efficiency.
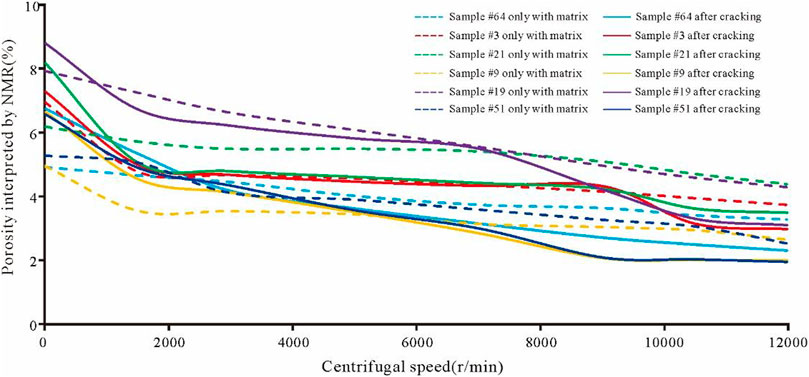
FIGURE 9. Relationship between centrifugal speeds and porosity interpreted by NMR before and after cracking.
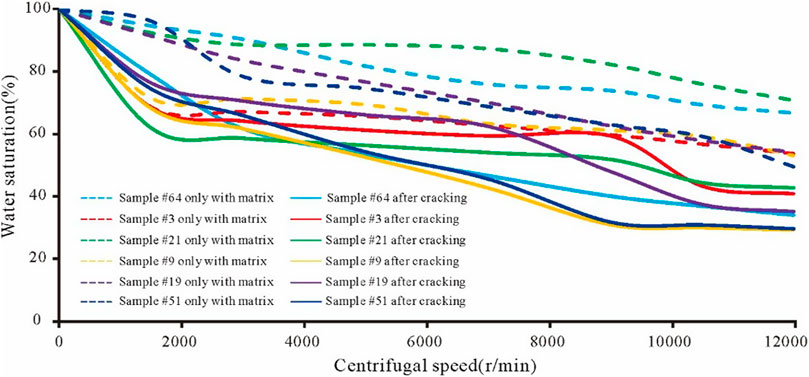
FIGURE 10. Relationship between centrifugal speeds and water saturation before and after cracking.
/Gas, water, and rock skeleton are segmented by reconstruction, filtering, and noise reduction of CT scan images (blue represents water, red represents gas, and gray represents the rock skeleton). Due to resolution limits of CT scanning, the internal pores of the matrix cannot be identified. The blue and red areas are fractures, and the gray is matrix (Table 5). CT scanning charts of different drive stages show the following characteristics: (1) For HLF and HCF, water will invade fractures when the water injection volume is 0.15 PV. With the continuous water injection, fractures are slowly filled with water, and when the water injection volume is 1 PV, fractures are basically filled. In the stabilization stage after each water injection, due to the imbibition exchange between water in the fracture and gas in the matrix under the action of capillary force, water enters the matrix. Meanwhile, water in fractures decreases and the gas increases. (2) For TF, there is no water in the fracture when the water injection volume is 0.15 PV and subsequent stabilization stage. It can be indicated that the water drive front has not reached to the fracture, and water can be observed in the fracture only when water injection volumes reach to 0.3 PV. (3) For Sample #51, continuous water injection without stabilization is carried out. Water enters the fracture rapidly at the beginning of water injection. With the increase of water injection volumes, water gradually fills fracture.
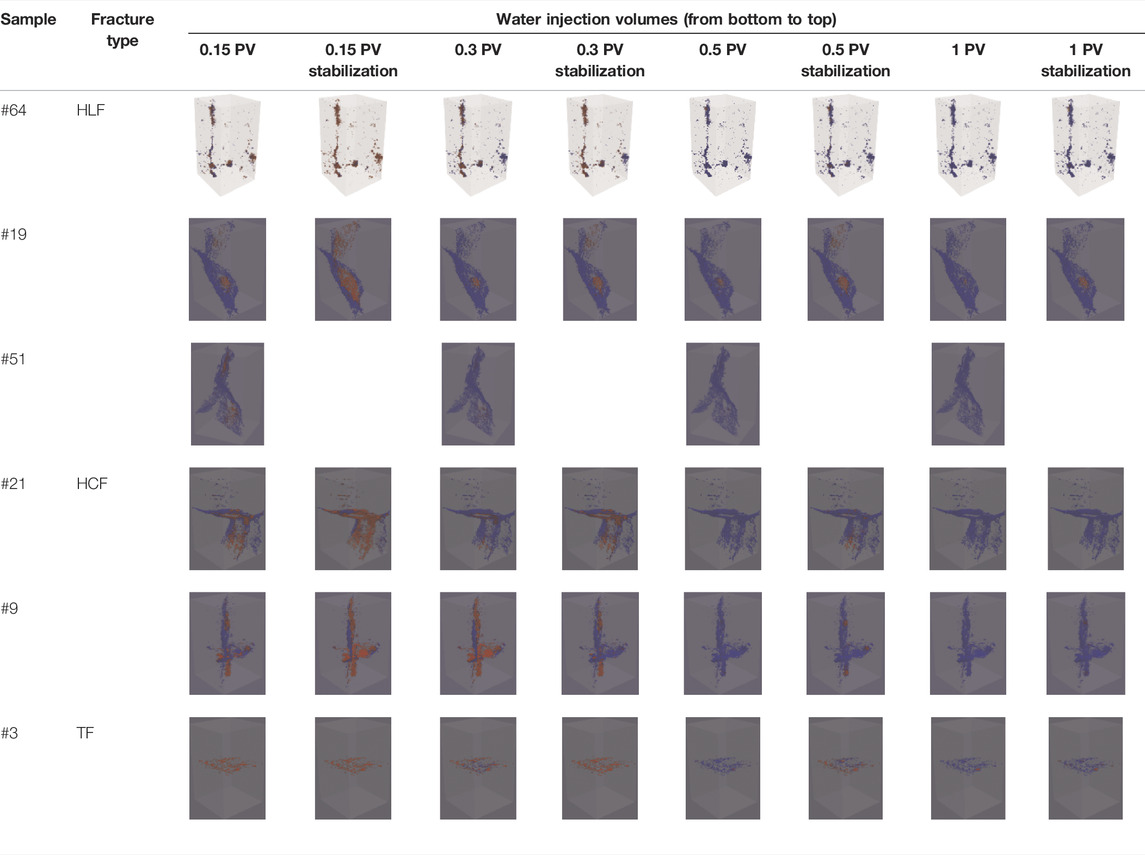
TABLE 5. Statistics on the percentage of different pore diameter distribution before cracking.
Due to resolution limits of CT scanning, the matrix pore is not observed. What CT can observe is the water in the fractures. According to the statistics of water content in fractures (Figure 11), water mainly enters fractures during water injection, accounting for more than 90%. During the stabilization process, water in fractures enters matrix pores through capillary force. After the water injection volume reaches to 0.15 PV, water absorption in the matrix pores is up to 32.71%. With continuous water injection, the amount of water entering the matrix gradually decreases. When the water injection volume is 0.75 PV, water saturation exceeds 90%, and the water absorption of matrix pores drops to 5.51%. Injected water mainly flows out of the core outlet through fractures, and the volume of water entering the matrix is very limited after continuous water injection.
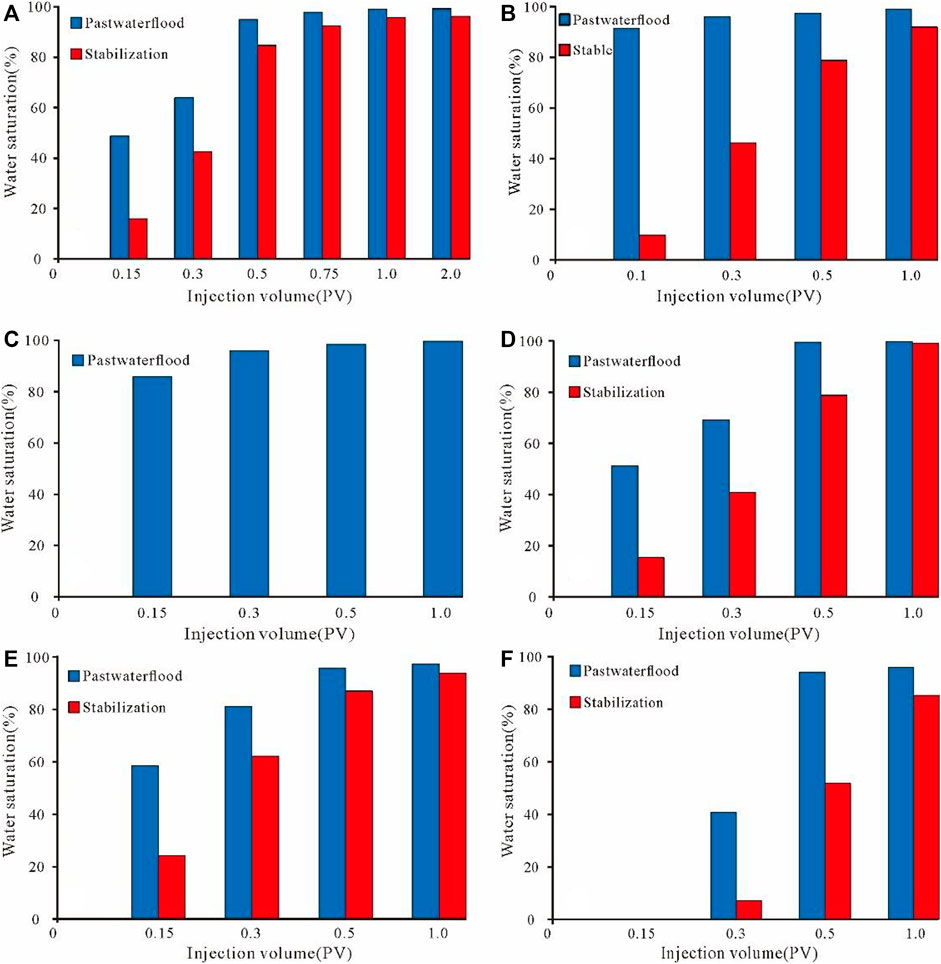
FIGURE 11. Water injection volume and water saturation for different samples. Note: (A) Sample #64 (HLF), (B) Sample #19 (HLF), (C) Sample #51 (HLF), (D) Sample #21 (HCF), (E) Sample #9 (HCF), and (F) Sample #3 (TF).
Based on the comprehensive comparison of water saturation changes in different fracture types, the following understanding can be obtained: (1) For HLF, at the beginning of water injection, water will preferentially enter the fracture channel. With continuous water injection, fracture is gradually filled with water. For a core without effective longitudinal penetration by HLF, the arrival of water drive front is later. (2) The stabilization process after water injection is a process in which water in the fracture enters the matrix through imbibition. With continuous water injection, the amount of water entering the matrix through imbibition gradually decreases. (3) On the whole, more than 90% of the volume of fractures will be filled with water at the time when the water injection volume is 0.5 PV, and then there are no obvious changes in water saturation of fractures after further injection. Therefore, the stage where the water injection volume is less than 0.5 PV is water drive gas (Figure 11).
As the relationship between the efficiency of gas drive and the percentage of matrix pore diameter in Figure 12, (1) for the matrix pore diameter less than 20 nm or between 20 and 100 nm, the efficiency of gas drive is negatively correlated with the percentage of matrix pore diameter; and (2) for matrix pore diameter between 100 and 1000 nm or more than 1000 nm, they have positive correlation. In other words, the efficiency of water drive increases as the percentage of pore diameter less than 100 nm decreases and the percentage of pore diameter greater than 100 nm increases. And the positive correlation between the efficiency of gas drive and the percentage of pore diameter greater than 1000 nm is the most obvious.
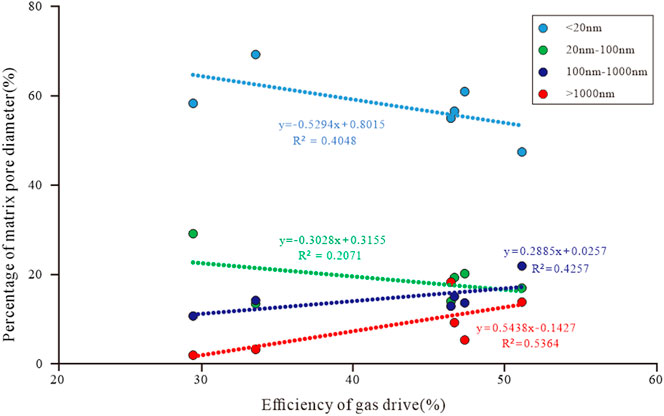
FIGURE 12. Efficiency of gas drive and percentage of matrix pore diameter.
For the relationship between the porosity and efficiency of gas drive, whatever the cores only with matrix or after cracking, the correlation between the matrix porosity and efficiency of gas drive is ambiguous (Figure 13). However, the fracture porosity is positively correlated with the improvement of the efficiency of gas drive (Figure 14).
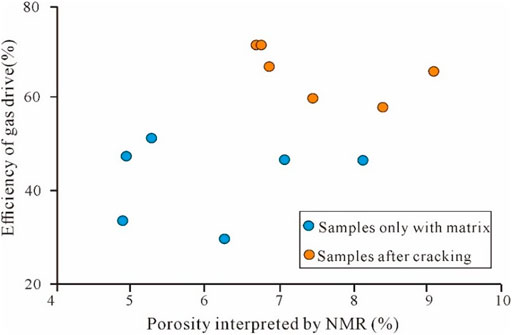
FIGURE 13. Scatter plot of porosity interpreted by NMR and efficiency of gas drive.
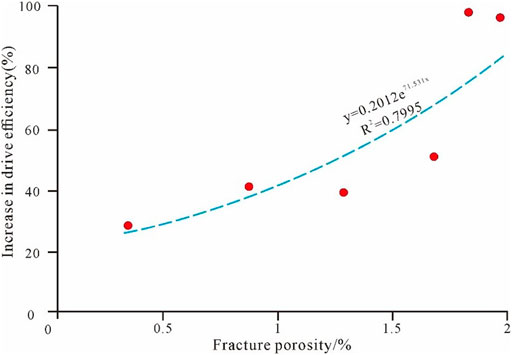
FIGURE 14. Relationship of increase in the efficiency of gas drive and fracture porosity.
Based on the relationship between the morphology and size (Table 1) and efficiency of gas drive (Table 6), it can be found that the effect of TF on improving the efficiency of gas drive is the weakest. Because it cannot effectively communicate with the channel of gas flow. HCF can significantly improve the efficiency of gas drive. For Sample #21, even if the longitudinal fracture does not run through effectively, the improvement in the efficiency of gas drive is very large. Compared with Sample # 21 and Sample # 9, there are more longitudinal fractures at the inlet end of Sample # 21. Gas enters Sample #21 by more channels at the beginning of the drive and has a better effect on water drive. HLF can effectively dredging natural gas flow and has a significant effect on improving the efficiency of gas drive. The channels of gas drive in Sample #19 and Sample #51 are made up of multiple fractures, and the volume of fractures is small. Therefore, the improvement in the efficiency of gas drive by fractures is limited. Meanwhile, the width of fracture in the inlet is significantly smaller than that of the exit for Sample #51, while Sample #19 is the opposite. Therefore, for Sample #19, even though the volume of fracture is obviously smaller, HLF has a better improvement effect on the efficiency of gas drive.
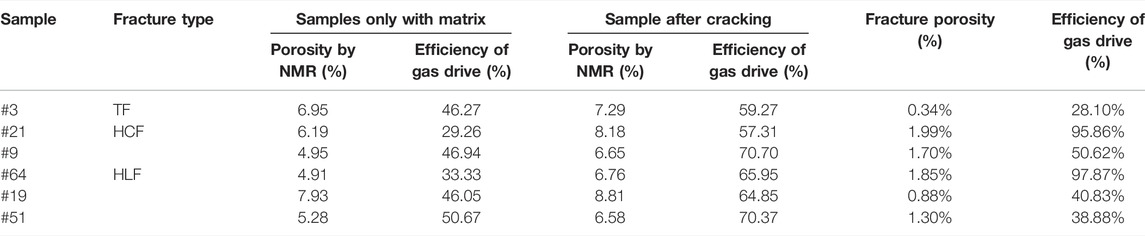
TABLE 6. Relationship between the fracture porosity and efficiency of the gas drive of samples only with matrix and samples after cracking.
In general, HLF and HCF have a better effect on improving efficiency of gas drive. The simpler fracture morphology, or the more HLF close to the producing end, and the larger fracture width can better increase the efficiency of gas drive. TF has the worst effect on improving the efficiency of gas drive.
The decrease of water in fractures in the process of water injection and stabilization can be considered as water entering matrix pores through imbibition. By calculating the water content of fractures scanned after drive and that scanned after static, the difference is the water content entering matrix. The efficiency of water drive was defined as the ratio of the amount of water in the fractures and matrix pores to the pore volume occupied by gas before water injection. The efficiency of water drive of each sample was obtained (Figure 15).
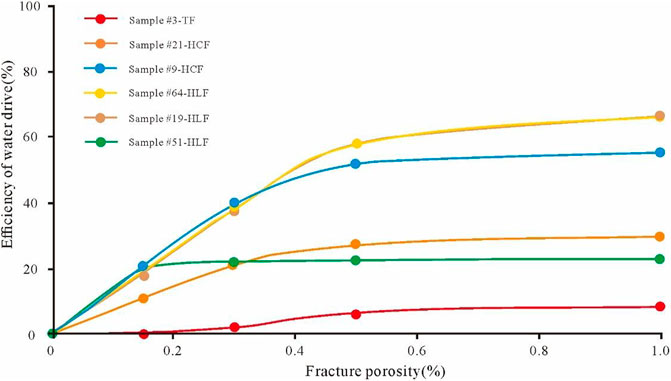
FIGURE 15. Curve of the efficiency of water drive.
The following conclusions can be drawn from Figure 15: (1) Before the water injection volume reached to 0.3 PV, the efficiency of water drive increased linearly with continuous water injection. When the water injection volume was 0.5 PV, the efficiency of water drive had a turning point. The growth slowed and the efficiency of continuous water injection were inapparent with the continuous water injection. That is, water drive is the main stage before water injection reaches to 0.5 PV. (2) The efficiency of water drive of Sample #21 and Sample #9 with HCF and Sample #64 with HLF is higher than 50%. The efficiency of water drive of Sample #19 and Sample #51 with HLF is between 20 and 30%. The efficiency of water drive of Sample #3 with TF is less than 10%. In general, HCF is the most favorable for water drive, followed by HLF, and TF is the worst. (3) Because Sample #51 was not left standing after water injection, there was no imbibition of capillary force in matrix pores. Water in the fracture was saturated soon, and the efficiency of water drive was low and increased little.
The samples before and after water drive were weighed, and the difference was the amount of water entering the core. The efficiency of water drive could be calculated according to the irreducible water saturation and core porosity (Table 7 and Figure 16). A comprehensive comparison was made between the efficiency of water drive by CT and efficiency of water drive by experiment. It can be seen from Figure 16 that: (1) the efficiency of water drive calculated by CT is very close to that calculated by experiment. It is indicated that the method of calculating efficiency by observing and measuring changes of water content in fractures at different water drive stages is effective. (2) For samples with TF, water entered the matrix first at the initial stage of water injection. The water drive front can reach the fracture only after the matrix reached to a certain water saturation. However, water in the matrix cannot be effectively observed due to the low resolution. Hence, the efficiency of water drive calculated by CT is much lower than the efficiency calculated by experiment.
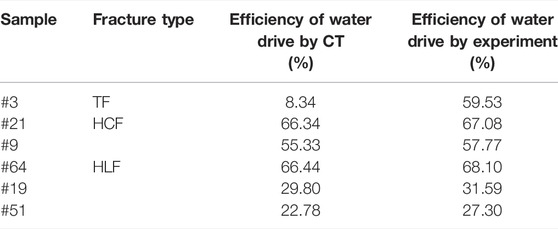
TABLE 7. Statistics on the efficiency of water drive calculated by CT or experiment.
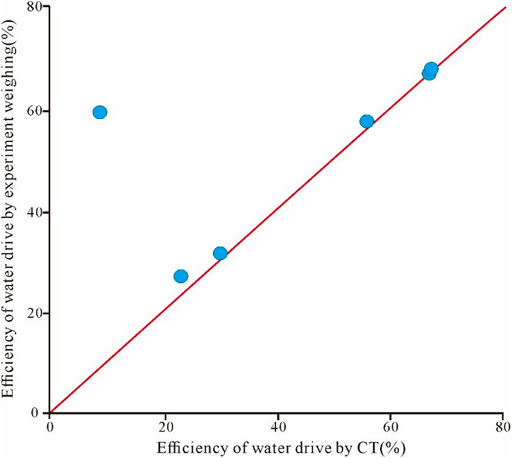
FIGURE 16. Cross plot of the efficiency of water drive by CT and experiment.
Contributions on drive efficiency by fractures or matrix are shown in Table 8 and Figure 17. Due to Sample #51 without the stabilization process after water injection, the contribution on drive efficiency by the matrix was unable to be calculated by the difference of water content in fractures before and after water injection. Two conclusions can be drawn: (1) The efficiency of water drive is positively correlated with fracture porosity. (2) For samples with fracture porosity higher than 1%, the efficiency of water drive contributed by the fracture is significantly higher than that by the matrix. For samples with fracture porosity less than 1%, the efficiency of water drive contributed by the fracture is equal or less than that by the matrix. Therefore, for reservoirs with small fracture porosity, the efficiency of water drive contributed by the matrix can be improved by prolonging the closure time of borehole after waterlogging.
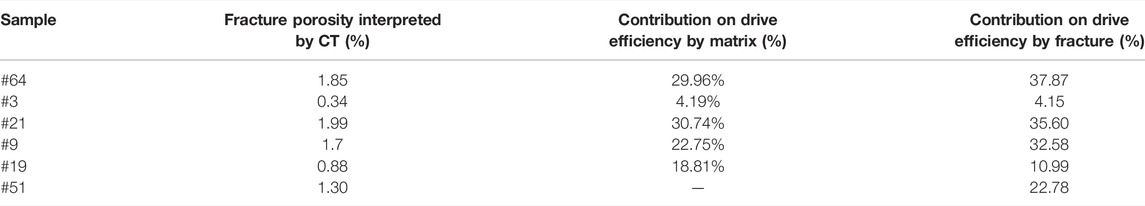
TABLE 8. Contributions on drive efficiency by the fracture or matrix.
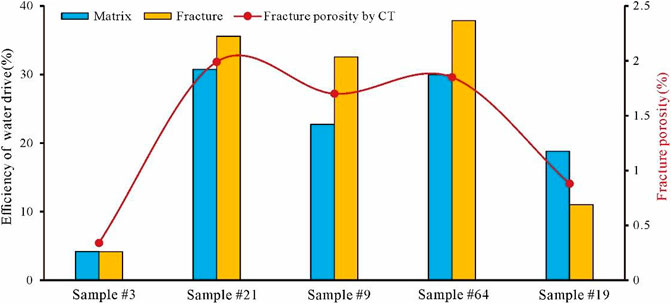
FIGURE 17. Fracture porosity by CT and contribution of the drive efficiency by the matrix and fracture.
1) For fractured sandstone gas reservoirs of low porosity, the distribution of gas and water is mainly related to structures of matrix pores, fracture development pattern, and density. More large matrix pores and high angle fractures are beneficial to the differentiation of gas and water and then increase the efficiency of gas drive. Therefore, the study of matrix pores and fractures is quite important since it can provide guidance for the efficient deployment of wells.
2) The efficiency of water drive is related to fracture porosity and dip angle of fractures. High angle fractures can effectively increase the seepage capability, which subsequently improve the efficiency of water drive. Hence, in the development process of gas wells, large-scale sand fracturing will be a preferred choice because large-scale sand fracturing can increase the fractures’ density around wells and between wells so as to improve the efficiency of water drive.
3) The efficiency of water drive increases linearly with the increase of water injection volume. After a period of water injection, the increase will slow and disappear. With a period of stabilization, the imbibition between the matrix and fractures will fully work and then increase the efficiency of water drive. Therefore, in practice, it is necessary to strictly control the gas producing rate of gas reservoirs and delay the water invasion rate as far as possible. Under the situation of serious water invasion in gas reservoirs, it can be considered to shut in all wells to strengthen the gas–water imbibition between fractures and the matrix, which can improve the recovery of gas reservoirs.
The original contributions presented in the study are included in the article/Supplementary Material, further inquiries can be directed to the corresponding author.
Conceptualization, RW and CZ; methodology, DC; software, FY; validation, DC, FY and ML; formal analysis, ML; investigation, HL; resources, RW; data curation, CZ; writing—original draft preparation, DC, FY; writing—review and editing, HL; visualization, HL; supervision, HL; project administration, RW; funding acquisition, RW. All authors have read and agreed to the published version of the manuscript.
This research was funded by Major national science and technology projects, grant number 2016ZX05051, and the China Petroleum Science and technology major key project, grant number 2018E-18.
Author RW was employed by PetroChina Tarim Oilfield Company.
The remaining authors declare that the research was conducted in the absence of any commercial or financial relationships that could be construed as a potential conflict of interest.
All claims expressed in this article are solely those of the authors and do not necessarily represent those of their affiliated organizations, or those of the publisher, the editors, and the reviewers. Any product that may be evaluated in this article, or claim that may be made by its manufacturer, is not guaranteed or endorsed by the publisher.
AF, autogenic feldspar; AQ, autogenic quartz; C, clay minerals; CC, centrifugal component; Dol, dolomite; HLF, high angle longitudinal through fracture; HCF, high angle conjugate through fracture; KF, potassium feldspar; NMR, nuclear magnetic resonance; P, porosity; SC, saturation component; T, throat; TF, transverse through fracture.
Bai, S., Cheng, D., Wan, J., Yang, L., Peng, H., Guo, X., et al. (2016). QuantitativeCharacterization of Sandstone NMR T2 Spectrum. Acta Petrolei Sinica 37 (3), 382–391+414. (in Chinese with English abstract).
Dong, S., Zeng, L., Lyu, W., Xia, D., Liu, G., Wu, Y., et al. (2020). Fracture Identificationand Evaluation Using Conventional Logs in Tight Sandstones: A Case Study in the OrdosBasin, China. Energ. Geosci. 1 (3-4), 115–123. (in Chinese with English abstract). doi:10.1016/j.engeos.2020.06.003
Dong, Y., Lu, X., Fan, J., and Zhuo, Q. (2018). Fracture Characteristics and Their Influence on Gas Seepage in Tight Gas Reservoirs in the Kelasu Thrust Belt (Kuqa Depression, NW China). Energies 11 (10), 2808. doi:10.3390/en11102808
Feng, J., Qu, J., Zhang, P., and Qin, F. (2021). Development Characteristics and Quantitative Prediction of Multiperiod Fractures in Superdeep Thrust-fold Belt. Lithosphere 2021, 1–28. doi:10.2113/2021/8895823
Gong, L., Fu, X., Wang, Z., Gao, S., Jabbari, H., Yue, W., et al. (2019a). A New Approach for Characterization and Prediction of Natural Fracture Occurrence in Tight Oil Sandstones with Intense Anisotropy. Bulletin 103 (6), 1383–1400. doi:10.1306/12131818054
Gong, L., Su, X., Gao, S., Fu, X., Jabbari, H., Wang, X., et al. (2019b). Characteristics and Formation Mechanism of Natural Fractures in the Tight Gas Sandstones of Jiulongshan Gas Field, China. J. Pet. Sci. Eng. 175, 1112–1121. doi:10.1016/j.petrol.2019.01.021
He, Y., Mao, Z., Xiao, L., and Ren, X. (2005). An Improved Method of Using NMR T2 Distribution to Evaluate Pore Size Distribution. Chin. J. Geophys. 48 (2), 373 378. (in Chinese with English abstract). doi:10.1002/cjg2.704
Hu, Y., Li, X., Wan, Y., Jiao, C., Xu, X., Guo, C., et al. (2016). The Experimental Study of Water Invasion Mechanism in Fracture and The Influence on the Development of Gas Reservoir. Nat. Gas Geosci. 27 (5), 910–917. doi:10.11764/ji.ssn.1672G1926.2016.05.0910
Lai, J., Wang, G., Chai, Y., Xin, Y., Wu, Q., Zhang, X., et al. (2017). Deep Burial Diagenesis and Reservoir Quality Evolution of High-Temperature, High-Pressure Sandstones:Examples from Lower Cretaceous Bashijiqike Formation in Keshen Area, Kuqa Depression, Tarim Basin of China. AAPG Bull. 101 (6), 829–862. doi:10.1306/08231614008
Lai, J., Wang, G., Xin, Y., Zhou, L., Xiao, C., Han, C., et al. (2014). Diagenetic Facies Analysis of Tight Sandstone Gas Reservoir of Bashijiqike Formation in Kuqa Depression. Nat. Gas Geosci. 25 (7), 1019–1032. (in Chinese with English abstract).
Li, J., Zhang, Y., Wang, H., and Wang, D. (2020). Three-Dimensional Discrete Element Numerical Simulation of Paleogene Salt Structures in the Western Kuqa Foreland Thrust Belt. Pet. Exploration Develop. 47 (1), 68–79. (in Chinese with English abstract). doi:10.1016/s1876-3804(20)60006-4
Li, Y., Hou, G., Hari, K. R., Neng, Y., Lei, G., Tang, Y., et al. (2017). The Model of Fracture Development in the Faulted Folds: The Role of Folding and Faulting. Mar. Petrol. Geol. 89, 243. doi:10.1016/j.marpetgeo.2017.05.025
Liu, G., Zeng, L., Zhu, R., Gong, L., Ostadhassan, M., and Mao, Z. (2021). Effective Fractures and Their Contribution to the Reservoirs in Deep Tight Sandstones in the Kuqa Depression, Tarim Basin, China. Mar. Pet. Geology. 124, 104824. doi:10.1016/j.marpetgeo.2020.104824
Sun, L., Zhou, C., Zhu, R., Zhang, Y., Zhang, S., Zhang, B., et al. (2013). Formation, Distribution and Potential of Deep Hydrocarbon Resources in China. Pet. Exploration Develop. 40 (6), 641–649. (in Chinese with English abstract). doi:10.1016/s1876-3804(13)60093-2
Wang, K., Zhang, R., Fang, X., Wang, J., and Zhang, T. (2018). Characteristics and Property Modeling of Ultra-deep Fractured-Porous Tight Sandstone Reservoir: A Case Study on the Keshen 8 Gas Reservoir in Kuqa Depression. China Pet. Exploration 23 (6), 88–96. (inChinese with English abstract). doi:10.3969/j.issn.1672-7703.2018.06.010
Wang, X., Liu, Y., Hou, J., Li, S., Kang, Q., Sun, S., et al. (2020). The Relationship between Synsedimentary Fault Activity and Reservoir Quality — A Case Study of the Ek1 Formation in the Wang Guantun Area, China. Interpretation 8, sm15–sm24. doi:10.1190/int-2019-0131.1
Wang, X., Zhou, X., Li, S., Zhang, N., Ji, L., and Lu, H. (2022). Mechanism Study of Hydrocarbon Differential Distribution Controlled by the Activity of Growing Faults in Faulted Basins: Case Study of Paleogene in the Wang Guantun Area, Bohai Bay Basin, China, Lithosphere 2021, 7115985. doi:10.2113/2022/7115985
Wang, Z., Lv, X., Li, Y., Qian, W., Hu, S., Zhou, X., et al. (2019). Open Shear Fractures at Depth in Anticlines: Insights from the Kuqa Foreland Thrust Belt, Tarim Basin. Int. J. Earth Sci. (Geol Rundsch) 108 (7), 2233–2245. doi:10.1007/s00531-019-01758-y
Wei, G., Li, J., She, Y., Zhang, G., Shao, J., Yang, J., et al. (2018). Distribution Laws of Large Gas Fields and Further Exploration Orientation and Targets in China. Natur. Gas. Ind. 38 (4), 12–25. (in Chinese with English abstract). doi:10.1016/j.ngib.2018.04.014
Xu, X., Zhang, L., Ye, M., Zhang, L., Xiu, J., Zeng, Z., et al. (2021). Different Diagenesis of Deep Sandstone Reservoir and its Relationship with Reservoir Property: Case Study of Jurassic in Zhengshacun Area, Central Junggar Basin. Nat. Gas Geosci. 32 (7), 1022–1036. (in Chinese with English abstract). doi:10.11764/j.issn.1672-1926.2021.02.011
Yang, H., Li, Y., Tang, Y., Lei, G., Zhou, P., Zhou, L., et al. (2021). Accumulation Conditions, Key Exploration and Development Technologies for Keshen Gas Field in Tarim Basin. Acta Petrolei Sinica 42 (3), 399–414. (in Chinese with English abstract). doi:10.7623/syxb202103012
Yao, J., Deng, X., Zhao, Y., Han, T., Chu, M., and Pang, J. (2014). Characteristics of Tight Oil inTriassic Yanchang Formation, Ordos Basin. Jianghan Pet. Sci. Technol. 40 (2), 151–158. (in Chinese with English abstract).
Zeng, L. (2004). Characteristics and Petroleum Geological Significance of Himalayan Orogeny in Kuqa Foreland Basin. Oil Gas Geology. 25 (2), 175–179. (in Chinese with English abstract). doi:10.3321/j.issn:0253-9985.2004.02.010
Zeng, L., Zhou, T., and Lyu, X. (2002). Influence of Himalayan Orogeny on Oil & Gas Forming in Kuqa Depression, Tarim Basin. Earth Science-Journal China Univ. Geosciences 27 (7), 741–744. (in Chinese with English abstract). doi:10.3321/j.issn:1000-2383.2002.06.015
Zeng, L., Zhu, R., Gao, Z., Gong, L., and Liu, G. (2016). Structural Diagenesis and its Petroleum Geological Significance. Pet. Sci. Bull. 1 (2), 191–197. (in Chinese with English abstract). doi:10.3969/j.issn.2096-1693.2016.02.015
Zeng, Q., Zeng, T., Ouyang, Y., Dai, C., and Song, Y. (2017). Subsalt High Steep Structure Imaging Technique: A Case Study of Keshen Area in Kuqa Depression, Tarim Basin, Nw China. Pet. Exploration Develop. 44 (6), 923–931. doi:10.1016/s1876-3804(17)30104-0
Zhang, H., Zhang, R., Yang, H., Shou, J., Wang, J., Liu, C., et al. (2014). Characterization and Evaluation of Ultra-deep Fracture-Pore Tight Sandstone Reservoirs: A Case Study of Cretaceous Bashijiqike Formation in Kelasu Tectonic Zone in Kuqa Foreland Basin, Tarim, Nw China. Pet. Exploration Develop. 41 (2), 175–184. doi:10.1016/s1876-3804(14)60020-3
Zhang, R., Wang, K., Zeng, Q., Yu, C., and Wang, J. (2021). Effectiveness and Petroleum Geological Significance of Tectonic Fractures in the Ultra-deep Zone of the Kuqa Foreland Thrust Belt: A Case Study of the Cretaceous Bashijiqike Formation in the Keshen Gas Field. Petrol. Sci. 18, 728–741. doi:10.1007/s12182-021-00567-w
Zhao, J., Liu, J., Zhang, Q., and Qu, X. (2017). Overview of Geophysical Exploration Methods and Technical of Tight Sandstone Gas Reservoirs. Prog. Geophys. 32 (2), 840–848. (in Chinese with English abstract). doi:10.6038/pg20170253
Zhao, L., Zhang, T., Yang, X., Guo, X., and Rao, H. (2018). Gas-Water Distribution Characteristics and Formation Mechanics in Deep Tight Sandstone Gas Reservoirs of KeshenBlock, Kuqa Depression, Tarim Basin. Nat. Gas Geosci. 29 (4), 500–509. (in Chinese with English abstract). doi:10.11764/j.issn.1672-1926.2018.03.003
Keywords: Tarim basin, Kuqa depression, low porosity sandstones, microscopic drive, seepage mechanism
Citation: Wang R, Zhang C, Chen D, Yang F, Li H and Li M (2022) Microscopic Seepage Mechanism of Gas and Water in Ultra-Deep Fractured Sandstone Gas Reservoirs of Low Porosity: A Case Study of Keshen Gas Field in Kuqa Depression of Tarim Basin, China. Front. Earth Sci. 10:893701. doi: 10.3389/feart.2022.893701
Received: 10 March 2022; Accepted: 31 March 2022;
Published: 04 May 2022.
Edited by:
Lei Gong, Northeast Petroleum University, ChinaReviewed by:
Shaoqun Dong, China University of Petroleum, Beijing, ChinaCopyright © 2022 Wang, Zhang, Chen, Yang, Li and Li. This is an open-access article distributed under the terms of the Creative Commons Attribution License (CC BY). The use, distribution or reproduction in other forums is permitted, provided the original author(s) and the copyright owner(s) are credited and that the original publication in this journal is cited, in accordance with accepted academic practice. No use, distribution or reproduction is permitted which does not comply with these terms.
*Correspondence: Rujun Wang, d2FuZ3JqX3RsbUAxNjMuY29t
Disclaimer: All claims expressed in this article are solely those of the authors and do not necessarily represent those of their affiliated organizations, or those of the publisher, the editors and the reviewers. Any product that may be evaluated in this article or claim that may be made by its manufacturer is not guaranteed or endorsed by the publisher.
Research integrity at Frontiers
Learn more about the work of our research integrity team to safeguard the quality of each article we publish.