- 1State Key Laboratory of Geohazard Prevention and Geoenvironment Protection, Chengdu University of Technology, Chengdu, China
- 2Sichuan Road and Bridge (Group) Co., Ltd., Chengdu, China
Under low confinement axial compression, the failure of brittle rock is mainly caused by tensile fracture. Many scholars adopt the sliding crack as an idealized model to present the intrinsic mechanism of the tensile failure but due to the complex configuration of sliding crack, its stress intensity factor (SIF) calculation has always been a difficult problem. In this study, an improved model of sliding crack is proposed; in the context of linear elastic fracture mechanics (LEFM) and weight function method, the expression of stress intensity factor (SIF) has been derived. The propagation manners of sliding crack under axial loading and lateral unloading conditions have been further analyzed. The extended finite element method (XFEM) is employed to verify the correctness of the theoretical SIF formulation and its inferences. The formula of SIF shows that a sliding crack is highly sensitive to the change of the lateral stress, which theoretically explains compressive failure characteristics of brittle rock as follows: 1) under the condition of axial compression, increasing the lateral stress has a very strong no-linear impact on the strength of brittle rock; 2) under the condition of lateral unloading, the destruction of rock is more abrupt and ferocious than that of the loading case. In order to confirm that micro-fractures in rocks are notably influenced by confining pressure, as the former theoretical fracture analysis predicted, the tri-axial compression test combined with the acoustic emission monitoring technique has been conducted on basalt samples. According to the acoustic waveform parameter method, it shows that increasing the confining pressure will greatly reduce the proportion of tension-type fractures, which indirectly proves the correctness of the sliding crack hypothesis and fracture analysis.
1 Introduction
It is well known that the destruction mechanism of most materials under compressive stress is shearing failure; however, for brittle rocks, tensile fracture (i.e., splitting, spalling) is a common failure pattern, even in prevailing overall compressive stresses (Nemat-Nasser and Horii, 1982; Renshaw and Schulson, 2001; Wong and Baud, 2012; Huang et al., 2019). The tensile cracks caused by compressive load make the rocks exhibit a variety of complex and nonlinear behaviors, which has been intensively studied by scholars of rock mechanics (Horii and Nemat-Nasser, 1985; Zuo et al., 2008; Wang et al., 2012; Clayton and Knap, 2014).
The traditional mechanics of homogeneous materials cannot explain how tensile cracks emerge in an overall compressive environment, so the mesoscopic structure needs to be taken into consideration (Yuan and Harrison, 2006). The rock material contains a plenty of mesoscopic defects, such as cracks, cavities, soft or hard inclusions, and material crystal boundaries Figure 1 (Jing, 2003; Read, 2004; Cui et al., 2021). When the rock body is subjected to far-field compressive stress, the defects would cause local distortion to the stress field and tensile stress concentration. As load increases, tensile fractures emerge in succession, then crack growth and coalescence would lead to instability and final failure of the rock body in consequence (Dragon et al., 2000).
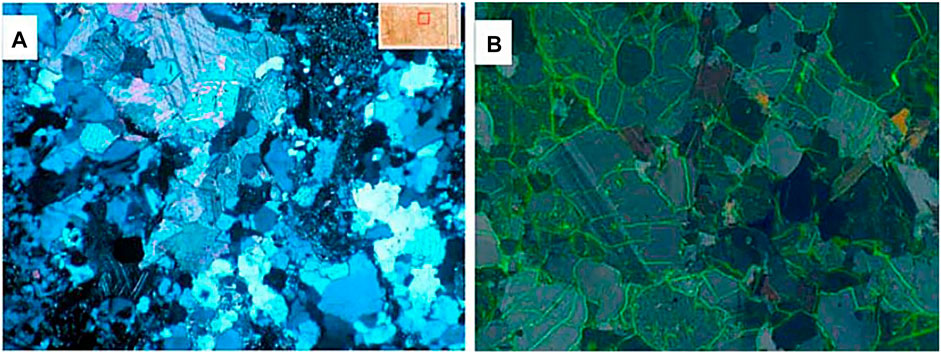
FIGURE 1. Example of the meso-structures observed in polarized light thin section. (A) Diorite and (B) granite (Lan et al., 2010).
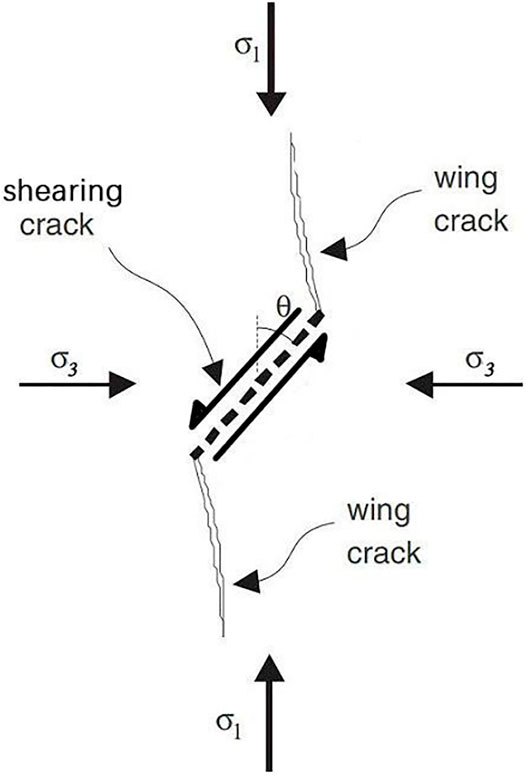
Although the geometrical shapes of defects in rocks are various, the main fracture mechanism could be summarized as a tensile crack caused by insufficient shearing resistance of defects (Olsson and Peng, 1976; Wong, 1982). Therefore, many scholars adopt sliding crack as an idealized model to describe the compressive tensile fracture. The sliding crack model is first proposed by Brace and Bombolakis, (1963), and great progress has been made later (Ashby and Hallan, 1986; Nemat-Nasser and Obata, 1988; Renshaw and Schulson, 2001). The sliding crack starts from a pre-existing inclined crack subjected to shear force. Due to insufficient shearing resistance of the inclined crack, tensile cracks nucleation on the two ends of the pre-existing sliding crack, and these tension cracks then continue to grow in a stable manner with increasing axial compression curving toward the direction of maximum principal stress (Nemat-Nasser and Horii, 1982), as shown in Figure 2. The newly formed tensile cracks are called wing cracks.
For low-porosity brittle rocks, the sliding crack model is proved capable of explaining general rock mechanical behavior observed both in the laboratory and on the field (Basista and Gross, 1998; Eberhardt et al., 1999; Shao and Rudnicki, 2000).
1) Strong influence of confining pressures on the strength and failure modes;
2) Non-linearity in the stress–strain relation and degradation of the elastic constants;
3) Volumetric dilatancy after complete unloading due to opening of tensile cracks;
4) Hysteresis loops observed in the stress–strain curves in cyclic load;
5) Load-induced anisotropy ensuing from a directional process of micro-crack evolution;
6) Pronounced permanent lateral strain after complete unloading; little permanent strain in the direction of maximum compression;
7) Strongly path-dependent stress–strain relations.
Since the sliding crack model has a significant theoretical value in brittle material mechanics, efforts have been taken for decades to investigate its fracture process by theoretical analysis, model experimental illustration, and numerical simulation.
Bieniawski (1967) discussed the fracture process of brittle fracture of rock theoretically, and experimental verification has been conducted on the mechanism for rock tested under compressive stress conditions. Nemat-nasser and Horii (1982) analyzed the sliding crack model by LEFM and a series of qualitative experiments have been performed on thin plates of Columbia Resin CR 39, and analytical results have been accepted. Janeiro and Einstein, (2010) experimentally studied the cracking behavior of brittle heterogeneous materials. Without restraint, uniaxial compression tests are conducted on prismatic gypsum specimens containing one or two pre-cracks. Kari Kolari (2017) studied the 3D sliding crack model subject to uniaxial compressive and tensile loading, with crack opening displacements derived from Castigliano’s second theorem, and completely agreed with the results of numerical simulations. Xun et al.,(2020) used the XFEM with the non-local stress field calculation to simulate the crack initiation and propagation of sliding cracks.
The concept of the stress intensity factor (SIF) is the central idea of fracture analysis, but due to the complex morphology of the sliding crack model, SIF cannot be derived directly. Therefore, the sliding crack is usually modeled as an equivalent straight crack, in which the wedging force on the pre-crack area opens the crack. The first model was proposed by Fairhurst and Cook (1966). Later, more and more equivalent crack models for SIF of sliding crack are proposed, and some of these models are summarized as follows:
Steif (1984) assumed that the wing cracks were straight, and the influence of the initial crack on the growth of wing cracks could be represented by a wedging slip displacement. Horii and Nemat-Nasser (1986) developed a single rectilinear crack inclined to the direction of the maximum stress and concluded that the rectilinear crack is driven by a pair of point forces collinear with the direction of the initial crack. Ashby and Hallam (1986) assumed that wing cracks had a fixed orientation, parallel to the major principal stress, and crack extension was driven by the normal and shear stresses along with the initial crack faces. Kemeny and Cook (1987) proposed a model in which a symmetrically opposite center force drove a crack oriented in the maximum stress direction. Lehner and Kachanov (2001) suggested that the wing crack could be represented by both wedge displacement-driven and stress-driven systems and then proposed a SIF model by equating the wedge displacement and acting stress effects in driving the wing crack growth.
Among the SIF solutions obtained from these simplified models, some lack accuracy because the models are too simplified, some are only capable of uniaxial loading, and some are too complicated to explain the physical meaning clearly.
In the present research study, the equivalent crack model of sliding crack has been improved. In this model, the fracture-driving force on the shear crack is no longer simplified to a point force, and the distributed stress on the wing cracks is also taken into consideration, so the model has higher accuracy and is suitable for various stress states and stress paths. By using the weight function, a more accurate SIF formulation is obtained based on the improved crack model, and the nonlinear fracture characteristics of sliding crack are discussed. According to the SIF formulation, the length of wing cracks under axial loading and lateral unloading are analyzed, which has explained the non-linearity of lateral stress on rock strength and the rock’s sensitivity to lateral stress changes. Finally, the tri-axial compression tests are carried out on Emei basalt, and the waveform parameter method is used to classify the mode (shearing or tensile) of micro-fracture events. The test results have verified the inferences of fracture analysis and indirectly proved that the sliding crack is the main fracture mechanism behind the deformation and failure of brittle rock.
2 Fracture Analysis on Sliding Crack
Linear elastic fracture mechanics (LEFM) originated from the elastic solutions of straight cracks, it is difficult to deal with kinked and curved cracks. Therefore, an equivalent straight crack model has been established, with the configuration and fracture mode similar to that of sliding crack. In this way, an approximate expression of SIF is derived.
2.1 Modified Sliding Crack Model
Consider that an infinite body is deformed by a plane strain subjected to uniform compressive stress at infinity, maximum principal stress σ1 is aligned to the Cartesian coordinate axis y, and minimum principal stress σ3 is aligned to axis x. The body contains a pre-existing shearing crack PP′, and two symmetry wing cracks initiate at its tips and propagate in a slightly curved path toward the direction of the maximum compressive stress, as shown in Figure 3A. The length of PP′ is 2a, at an angle of θ (termed as crack angle) with respect to axis y. The matrix is assumed to be isotropic and linear elastic with Young’s modulus E and Poisson’s ratio v. The shearing crack PP’ is tightly closed, and the friction resistance between the crack surfaces obeys Coulomb’s law.
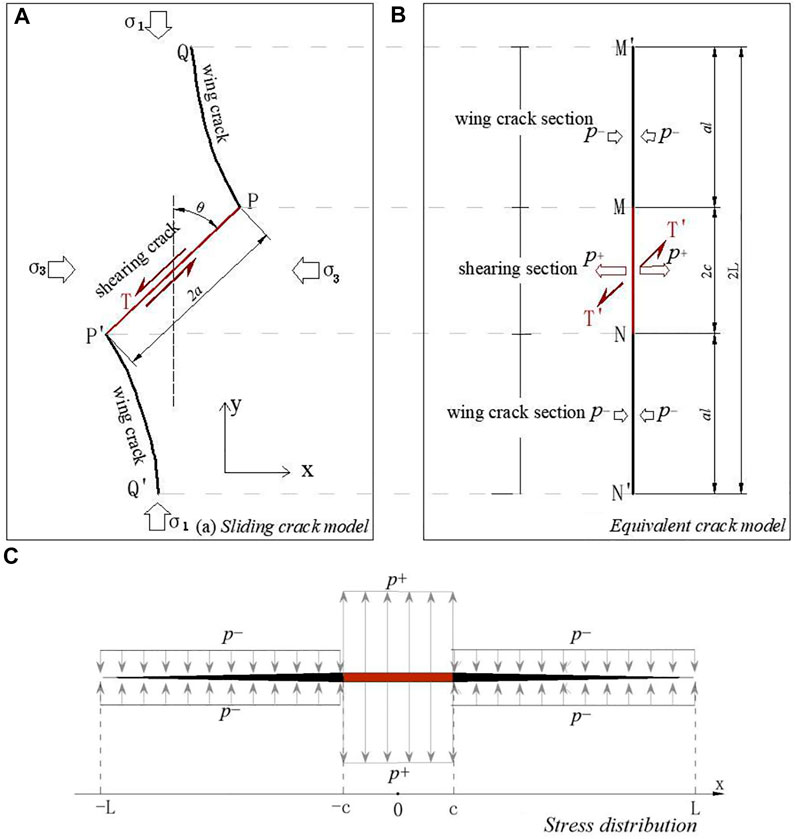
FIGURE 3. Analytical model of a sliding crack. (A) Sliding crack model and (B) equivalent crack model. (C) Stress distribution on the equivalent crack model.
2.1.1 Driving Force and Fracture Initiation Criteria
As axial load increases or lateral confinement decreases, the shearing stress σt acting on the shearing crack (PP′) increases. When the friction resistance τf of shearing crack is surpassed by σt, stress concentrated at the crack tips plays the role of compensating the absence of friction resistance. Since shearing cracks are pre-existing and there is no cohesion on crack surfaces, Coulomb’s law is used to describe the shear resistance of shearing cracks. The difference between σt and τf is the fracture driving force T, which leads to nucleation and growth of wing cracks.
where
μf is the fiction coefficient of the crack surfaces.
Before initiation of wing-cracks, the crack (PP′) is a typical model II fracture, according to the basic solutions of LEFM. The fracture initiation criterion is:
where
After substituting Equation 1 for Equation 2, a new equation is obtained as follows:
As shown previously, the fracture initiation criterion is a linear function of principal stress.
2.1.2 Equivalent Straight Crack and Force
Wing cracks are tension cracks propagating in a stable manner, gradually turning their direction to the direction of max-principal stress. To make the kinked and curved crack tractable, it is decided to simplify the sliding crack into an equivalent straight crack, which is the projection of the sliding crack to axial y, as shown in Figure 3B. With the total length of the equivalent crack is 2L, the shearing crack section is 2c, and the wing crack section is Lw, c and Lw can be expressed as follows:
where a is the half-length of pre-existing crack, and l is the dimensionless length of wing crack (in the following study, l is more often used to represent wing crack length rather than Lw itself.).
The fracture driving force T is to PP′ and T′ is to MN. In order to ensure that the load condition is basically equivalent to the sliding crack model, T′ and T are in the same directions, and the resultant forces are identical, the relationship between T′ and T satisfy is verified as follows:
For linear elastic materials, individual components of stress, strain, and displacement are additive. Based on the superposition concept, it is applicable to replace stress on the boundary with traction force on the crack faces. In addition, wing cracks are tensile cracks, and only normal traction force that causes mode I fracture needs to be taken into consideration. It is seen from the equivalent model that there are two main forces affecting the extension of wing cracks.
1) Crack-opening force: the component of T′ perpendicular to the crack on shearing crack (MN), noted by p+.
2) Crack closure force: the traction force on wing cracks (MM′ and NN′), approximate to σ3, noted by p−.
2.2 SIF and Its Nonlinear Features
2.2.1 Analytical Formulation of SIF
As set forth, an equivalent straight crack model is proposed by projecting a sliding crack to axis y, and the forces (p+ and p−) that cause crack propagation are obtained. Now, SIF could be figured out by a LEFM technique known as the weight function. The weight function is a SIF calculation method proposed by Buckner (1970) and Rice (1972) based on Green’s formula, by which many SIF problems under complex load conditions could be solved.
For the convenience of description, a local coordinate system of the equivalent crack is established, as shown in Figure 3C. Axis x is parallel to the crack line, and the coordinate origin is located at the center of the crack. In this coordinate system, the force on the crack could be represented by the sectional function p (x).
According to weight function method, the SIF of a straight line crack is given by the following equation:
where, w(x) is the weight function, representing the SIF caused by an unit load on Point x.
Substituting Eqs 8, 10 for Eq. 9, the following equation is obtained:
By integrating the aforementioned equations and making an arrangement again, the equation of SIF is obtained as follows:
where
It is known from Equation 11 that KI is influenced by n, and n is a function of variable l. Therefore, the value of SIF is decided by l when σ1 and σ3 are determined.
2.2.2 Nonlinear Features of SIF to l
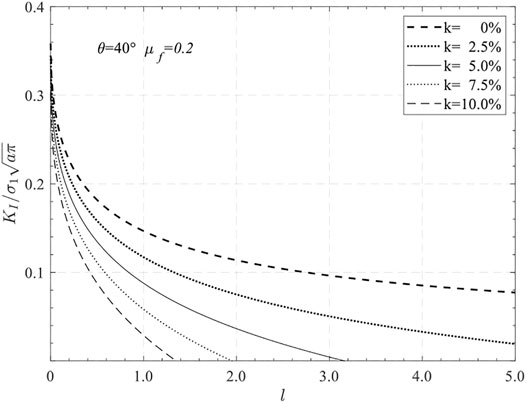
According to Equation 11, the relationship between KI and l is complex, and the curve graph of KI varying with l is shown in Figure 4.
By comparing the curve lines of SIF and l, two main conclusions are drawn as follows:
1) Wing cracks are highly stable. KI and l are negatively correlated, and the stress intensity factor decreases rapidly with the increase of crack length (especially at the beginning of crack extension), which means the larger the σ3, the faster the dropping rate of KI. Due to the stability of wing cracks, a larger external force is required to make the cracks go on expanding, which indirectly provides a fracture mechanical basis for the stable crack propagation stage of the rock deformation theory.
2) Minimum principal stress has a strong controlling effect on long wing cracks. When the wing crack is short, the SIF of the corresponding σ3 changes little; when the crack is long, the SIF of the corresponding σ3 changes a lot. Therefore, when σ3 is high, it is hard to form long wing cracks. This is why tensile micro-fractures are suppressed in the high confining pressure compression test of brittle rock. Compared with tensile failure, σ3 has a relatively small effect on shear cracks. If confining pressure increases, the rock failure shifts to the shearing mode.
2.2.3 Influence Coefficients of σ1 and σ3
The shearing mode (taking the classical Mohr–Coulomb theory as an example) is controlled by the shearing force, and the magnitude of the shearing force is independent of the length of the shearing zone. So, based on the shearing hypothesis, the deformation and failure of the rock are in a linear relationship with respect to σ1 and σ3. However, the sliding crack model is controlled by the SIF, and the effects of σ1 and σ3 on the SIF vary with the wing crack growth (l); thus, based on the sliding crack hypothesis, the deformation failure of the rock is of a strong non-linear feature.
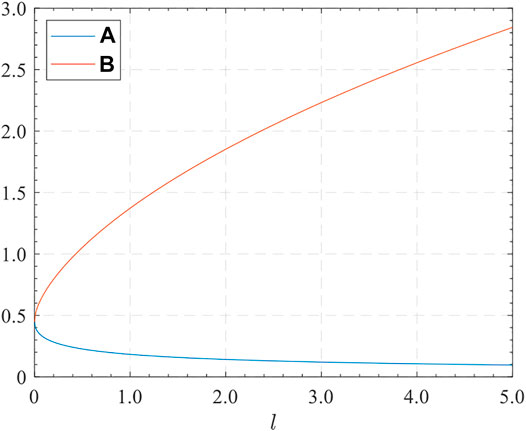
In order to discuss the contributions of σ1 and σ3 to the SIF, Eq. 13 is obtained as follows:
From Figure 5, it is known that A gradually descends with the increase of l, meanwhile B ascends rapidly. It indicates that the crack-opening effect of σ1 gradually decreases with the wing crack growth, while the crack closure effect of σ3 increases. It also suggests that σ3 has a strong controlling effect on long wing cracks.
Nonlinear characteristics of A and B could be explained as follows: since σ1 is only included in p+, which only acts on the middle of the crack (shearing section), the effect of σ1 on the crack tip is weakened, while the action range between σ1 and crack tip gets large with crack extension. However, σ3 acts on the entire wing cracks; it is obvious that as the crack extends, more traction forces will be incurred to the crack, so a greater stress concentration effect is developed as expected.
3 XFEM Fracture Simulation
In order to verify the correctness of the SIF theoretical formula (Eq. 12), the propagation process of a single crack in a plane subject to compressive loading is simulated by an extended finite element method (XFEM).
3.1 XFEM Fracture Model
Geometric model. As shown in Figure 6, a closed inclined crack (θ = 45° and 2a = 10 mm) is set in the middle of the rectangular plane. In order to weaken the boundary effect, the size of the rectangular plane (120 × 200 mm) is much larger than that of the crack length.
Material model and parameter. 1) XFEM element: the XFEM element material obeys the linear elastic law (elastic modulus E; Poisson ratio v) before yielding. The maximum principal stress criterion (yielding strength σy) is selected as the yield criterion. After yielding, the XFEM element obeys the linear damage law based on fracture energy. When the specified fracture energy is reached (normal fracture energy γn or tangential fracture energy γt), the XFEM element separates from each other and re-combine into a crack. 2) Contact model of the closed crack surfaces: the normal contact relation of the crack surfaces is rigid, and the tangential contact behavior obeys coulomb’s law of fiction, in which the shear strength is proportional to the normal stress. The material parameters are shown in Table 1.
Loading method. Four sets of loading tests with different lateral confinement pressures (0, 5, 10, and 20 MPa) and the axial loading are limited by displacement. In addition, in order to simulate a rigid closed shearing crack, the normal displacement of the shearing crack is fixed, so that it can only slip in the tangential direction.
3.2 Fracture Propagation and SIF
The fracture propagation process and the maximum principal stress contour are shown in Figure 7. At the beginning of crack extension, the angle between the wing crack and the pre-crack is about 70° (Figure 7A). As the wing crack expands, the crack bends and gradually approaches the direction of the maximum principal stress (Figure 7D). The crack trajectory is completely consistent with the theoretical 2D sliding crack model. The dynamic fracture process of a sliding crack could be well simulated by XFEM.
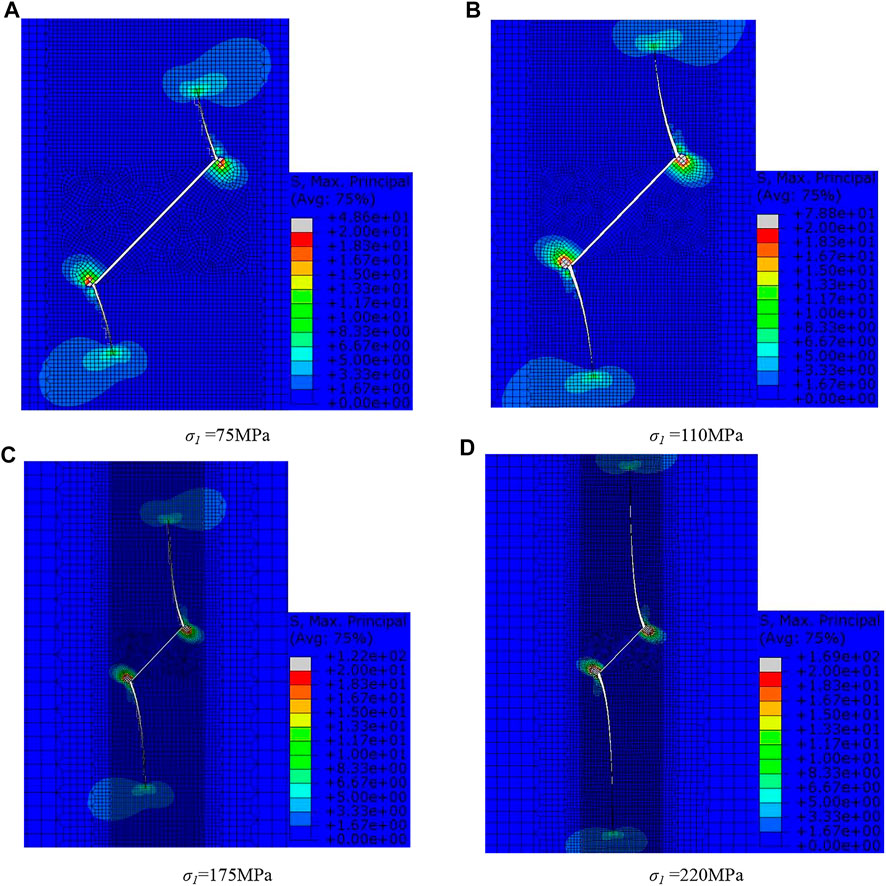
FIGURE 7. Maximum principal stress and crack propagation of the XFEM model. (A) σ1 = 75 MPa, (B) σ1 = 110 MPa, (C) σ1 = 175 MPa, and (D) σ1 = 220 MPa.
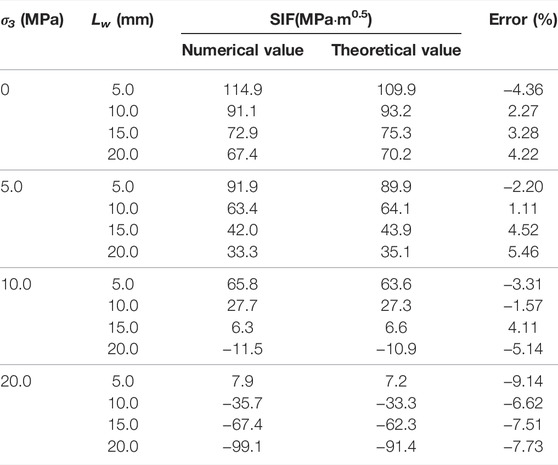
Although the XFEM could be used to simulate the natural propagation path of the crack, it cannot obtain the SIF directly at the crack tip. Therefore, in this study, the coordinates of the crack trajectory are obtained by the XFEM, based on which a static crack model is established, so the SIF can be calculated by the traditional contour integral method. In this way, it could be guaranteed that the crack numerical model is identical to the real crack path, and thus a more accurate SIF of sliding crack could be obtained. SIF values corresponding to different crack lengths are listed in Table 2, the axial stress σ1 = 200MPa, and lateral stress σ3 = 0, 5.0, 10.0, and 20.0 MPa.
The differences between the theoretical results (Eq. 11) and the numerical simulation results are controlled within 5.0%, which indicates that both the equivalent model (Figure 5) and calculating method are reasonable. However, if the wing crack length is long, the theoretical result tends to be larger. The larger the confining pressure, the larger the error. Therefore, the theoretical formula is suitable for the case in which the confining pressure is small and the wing cracks are relatively short.
4 Length of Wing Crack
4.1 Implicit Function of l (σ1, σ3)
Previously, the nonlinear features of SIF varying with l had been analyzed, but in a practical situation, the crack propagates when the SIF reaches the fracture toughness of the material under the effect of external force and the length of the crack is limited by the far-field stress (σ1, σ3); therefore, the way that l varies with stress is practically more important. By replacing KI with KIC (fracture toughness of mode I) in Eq. 13, the functional relationship between l and principal stresses (σ1 and σ3) is obtained.
The function l (σ1, σ3) cannot be written out in an explicit form, but it can be plotted numerically as follows:
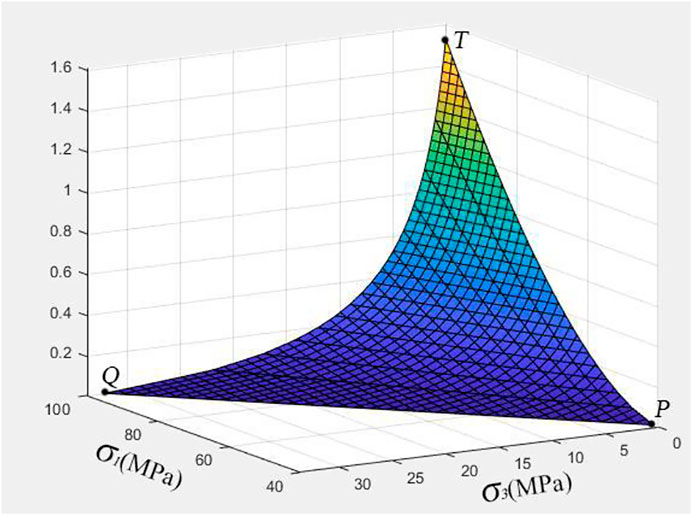
As shown in Figure 8, the function of l (σ1, σ3) is highly nonlinear. The shape of l (σ1,σ3) is a concave surface, which indicates that both axial loading and lateral unloading lead to an increase of the wing crack, and the growth rate would also increase. The curve line PT is a loading path with σ3 = 100MPa, the curve line QT is a lateral unloading path with σ1 = 100MPa; the intersection line of the function surface and the plane σ1−σ3 is the crack initiation criterion functions (Eq. 3).
4.2 Axial Loading and Lateral Unloading
For the convenience of plotting, the fracture strength KIC of the material is taken as a reference, and the stress unit is defined as:
The growth curve of l corresponding to axial monotonic loading is shown in Figure 10A, and the growth curve of l corresponding to lateral monotonic unloading is shown in Figure 10B. Under the conditions of axial loading and lateral unloading, the propagation characteristics of wing cracks have big differences. The major ones are summarized as follows:
1) The crack length curve sees a linear feature under the condition of axial loading: the crack length l increases monotonically with the increase of σ1, and the growth rate is relatively low at the beginning. After a short and slight decline, the growth rate of the crack length rises and soon remains almost unchanged, exhibiting a linear growing trend. The result shows that the larger the σ3, the smaller the slope of the curve, which indicates that σ3 greatly constrains the crack propagation under the condition of the σ1 monotonic increase shown in Figure 9A.
2) Under the condition of lateral unloading, the crack length grows exponentially: the crack length l increases monotonically with the decrease of σ3, and the growth rate of the crack is very low at first; when σ3 is close to zero, the growth rate shoots up exponentially. It indicates that when the brittle rock is under low-confined compression, a small disturbance of σ3 will cause a large crack expansion. Therefore, the brittle rock failure is abrupt and violent under the unloading condition shown in Figure 9B.
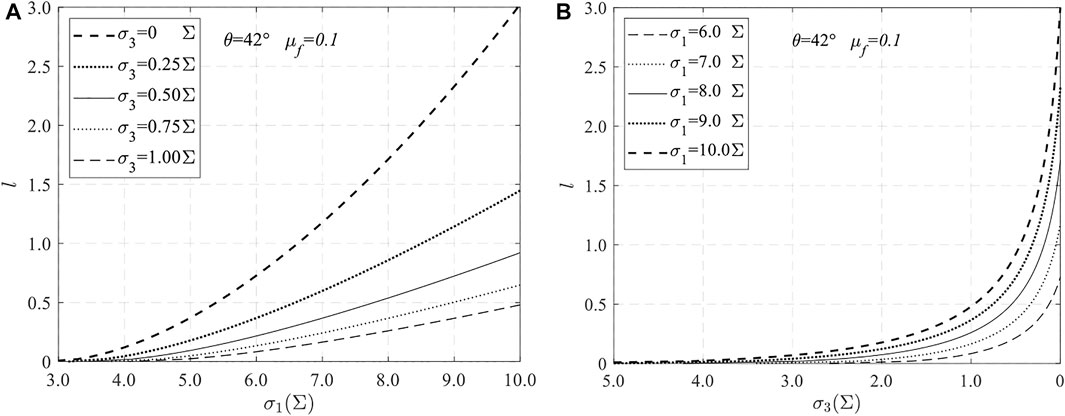
FIGURE 9. (A) l as a function of σ1 with σ3 fixed. (B) l as a function of σ3 with σ1 fixed (KIC = 2 MP·m0.5 and a = 0.01 m).
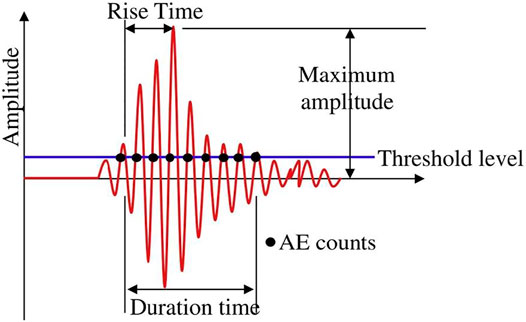
FIGURE 10. AE parameters in an AE hit (Ohno K., 2010).
5 Crack Classification Based on Acoustic Emission
Assuming that the micro-fracture mechanism of brittle rock under low-confined compression is sliding crack, σ3 has a more significant controlling effect on tensile fracture (wing crack) than shear fracture (pre-exist shearing crack) according to the previous analysis results. That is to say that increasing the confining pressure improves the resistance of rock against axial pressure, and more sliding cracks would be formed before the rock failure, of which wing cracks are much shorter.
It can be inferred that with increasing confining pressure, the risk of micro-tensile fracture events decreases, while the risk of shearing fracture events increases. In the following parts, the correctness of this inference will be verified by the tri-axial test combined with the waveform parameter method.
5.1 Waveform Parameter Method
The fracturing behavior of materials can be nondestructively monitored by the acoustic emission (AE) technique, using sensors that detect the transient elastic waves after any crack propagation event (Aggelis, D. G., 2012). Micro-fracture failure in rock may cause local elastic energy release and transmit into elastic waves. The elastic waves caused by different fracture events are various in waveforms. Theoretically, the mechanism of micro-fractures could be analyzed by waveform. AF (average frequency) and RA (rise time over the maximum Amplitude) are important parameters for judging the fracture mechanism for the waveform parameter method (Ohno K., 2010).
where RT is rise time, A is maximum amplitude, RC is ring-down count, and DT is duration time. The meaning of each waveform parameter is shown in Figure 10.
In the case of a tensile fracture (model I) that occurs, most of the elastic energy appears in the form of a longitudinal wave, which is characterized by high AF and low RA. In the case of a shear fracture (model II), most of the elastic energy transforms into a transverse wave, which is featured with low AF and high RA, as shown in Figure 11A.
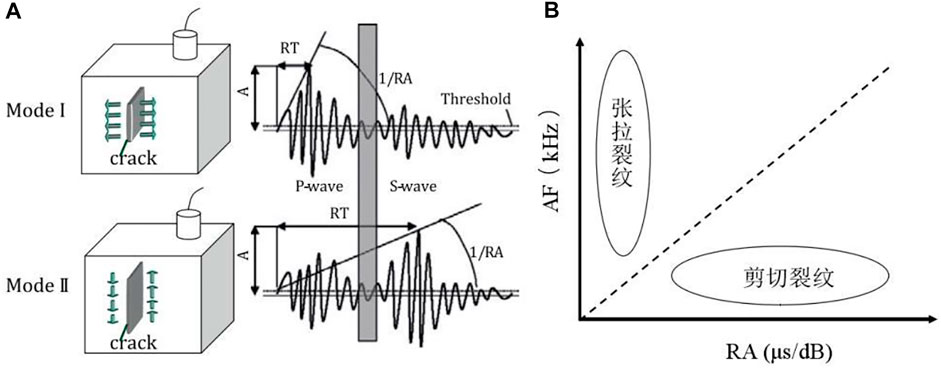
FIGURE 11. Schematic diagram of identifying fracture mode by the waveform parameter method. (A) Fracture mode and AE waveform (D. G. Aggelis et al., 2012); (B) relationship between the AF and RA value (Ohno K., 2010).
Each acoustic emission signal could be represented as a point in the RA-AF plane, which is called the wave characteristics point (WCP). According to the characteristics of longitudinal and transverse waves, the WCP of tensile fracture will be located in the upper left part of the RA-AF plane, and the WCP of shearing fracture will be located in the lower right part of the plane, as shown in Figure 11B.
According to the waveform characteristics of tensile fracture and shearing fracture discussed previously, an FMI (fracture mode index) is proposed to represent a fracture mode.
It could be seen from Figure 11B that when the value of FMI is high, the fracture event tends to be a tensile fracture; otherwise, it tends to be a shear fracture.
5.2 Micro-Crack Classification of Brittle Rock
In order to analyze the influence of confining pressure on micro-fractures, tri-axial tests combined with acoustic emission monitoring were carried out on Emei basalt. The rock cores are taken from the cavern buried at a depth of 460 m underground at the Baihetan hydropower station, and the standard rock sample (with a diameter of 50 mm and a height of 100 mm) is made of a homogenous and flawless core.
Four groups of tri-axial tests with different confining pressures (0, 10, 20, and 30 MPa) are conducted, and each group has four samples. The confining pressure is loaded to the specified value first, and then the axial pressure is applied by the displacement control method (0.05 mm/min); meanwhile, the acoustic emission events of the rock are monitored until the failure of the sample. Under different confining pressures, the stress–strain curve and corresponding AE ringing times are shown in the following figure.
According to the stage theory of rock deformation (Cai and Kaiser, 2004), at the beginning of compression, the AE events are mainly caused by the closure of cracks or cavities. Also, near the peak strength, the AE events are mainly caused by the coalescence of cracks. Therefore, it is assumed that the AE events in the middle of the loading process are mainly caused by sliding cracks. Thus, the AE events in the middle of the loading process are selected for waveform parameter analysis, and the images of WCP in the AF-RA plane are drawn as follows:
It could be seen from Figure 12 that increasing of confining pressure makes the WCP shift to the lower right corner. It suggests that increasing confining pressure has a significant effect on the tensile crack and increases the proportion of shearing crack, which is consistent with the prediction result of the sliding crack model (Section 3.2).
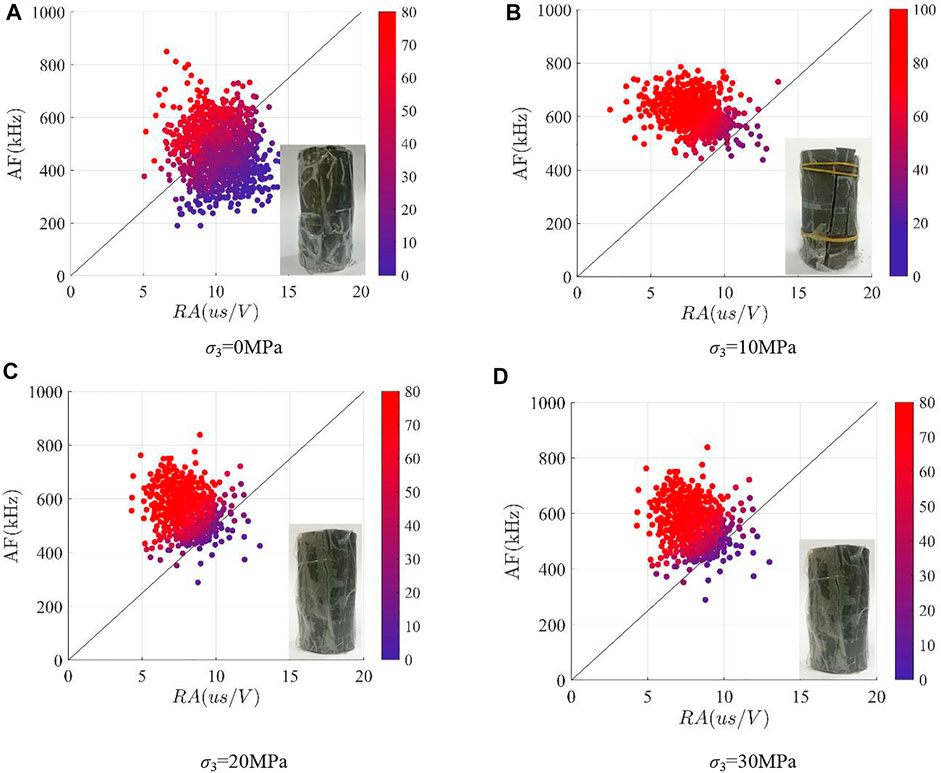
FIGURE 12. WCP in the AF-RA plane and FMI. (A) σ3 = 0 MPa, (B) σ3 = 10 MPa, (C) σ3 = 20 MPa, and (D) σ3 = 30 MPa.
The WCP is scattered in a wild range. Although the distribution of WCPs can be seen intuitively, the WCPs cannot be described quantitatively. Therefore, a single parameter (
Then, the FMI of the feature point, noted by
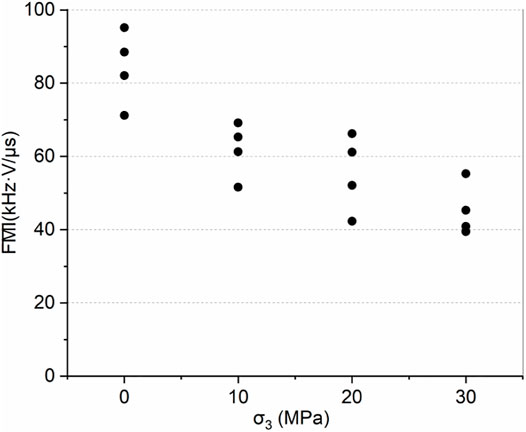
It could be seen from Figure 13 that increasing of confining pressure leads to a smaller value of
6 Conclusion
In this study, the theoretical formula of SIF is deduced by the equivalent straight crack model and verified by XFEM. On the basis of the SIF formula, the crack lengths under different loading conditions have been analyzed. Finally, tri-axial tests are carried out on Emei basalt, and the micro-fracture is analyzed by the waveform parameter method, which indirectly proves the correctness of the theoretical analysis. The conclusions are drawn as follows:
1) A new equivalent model of sliding crack is proposed, and the calculation formula of SIF at the wing crack tip is deduced by the weight function method. The calculation method is simple and has a clear physical meaning. By XFEM numerical simulation and contour integration, it is shown that the theoretical formula has high precision, and the error is about 5%.
2) Minimum principal stress has a strong controlling effect on long wing cracks. In other words, it is hard to form long wing cracks when σ3 is high. This is the reason why tensile fractures are suppressed in the high confining pressure compression test of brittle rock.
3) Under the condition of axial loading, the wing crack increases in an almost linear way, and the growth rate is negatively correlated with σ3. It indicates that under low confined compressive conditions, increasing confining pressure could greatly improve the strength of brittle rock.
4) Under the condition of lateral unloading, the growth rate of the crack is very low at first; when σ3 is close to zero, the growth rate shoots up exponentially. It indicates that a small disturbance of σ3 will cause a large crack expansion in brittle rock. Therefore, the brittle rock failure is abrupt and violent under the unloading condition.
5) Tri-axial compression tests are carried out on Emei basalt, and the rock micro-fracture events are analyzed by the waveform parameter method. The test results show that increasing of confining pressure could greatly reduce the tensile fracture tendency of micro-fractures but increase the shear tendency. Confining pressure has a significant effect on tensile cracks, which indirectly proves the correctness of the theoretical analysis of fracture.
Data Availability Statement
The raw data supporting the conclusion of this article will be made available by the authors, without undue reservation.
Author Contributions
YZ: fracture analysis and XFEM simulation. SC: fracture analysis and tri-axial test. JC: experimental data analysis.
Funding
The study is partially supported by the National Science Foundation of China (Nos. 41907254 and 41931296), National Key R&D Program of China (No. 2017YFC1501002), and Funds for Creative Research Groups of China (Grant No. 41521002). YZ was financially supported by the State Key Laboratory of Geohazard Prevention and Geoenvironment Protection (SKLGP) and Chengdu University of Technology.
Conflict of Interest
YZ and ZY were employed by the company Sichuan Road and Bridge (Group) Co., Ltd.
The remaining authors declare that the research was conducted in the absence of any commercial or financial relationships that could be construed as a potential conflict of interest.
Publisher’s Note
All claims expressed in this article are solely those of the authors and do not necessarily represent those of their affiliated organizations, or those of the publisher, the editors, and the reviewers. Any product that may be evaluated in this article, or claim that may be made by its manufacturer, is not guaranteed or endorsed by the publisher.
References
Aggelis, D. G., Mpalaskas, A. C., Ntalakas, D., and Matikas, T. E. (2012). Effect of Wave Distortion on Acoustic Emission Characterization of Cementitious Materials. Construction Building Mater. 35, 183–190. doi:10.1016/j.conbuildmat.2012.03.013
Ashby, M. F., and Hallam, S. D. (1986). The Failure of Brittle Solids Containing Small Cracks under Compressive Stress States. Acta Metallurgica 34 (3), 497–510. doi:10.1016/0001-6160(86)90086-6
Basista, M., and Gross, D. (1998). The Sliding Crack Model of Brittle Deformation: an Internal Variable Approach. Int. J. Sol. Structures 35 (5-6), 487–509. doi:10.1016/s0020-7683(97)00031-0
Bieniawski, Z. T. (1967). Mechanism of Brittle Fracture of Rock. Int. J. Rock Mech. Mining Sci. Geomechanics Abstr. 4 (4), 395–406. doi:10.1016/0148-9062(67)90030-7
Brace, W. F., and Bombolakis, E. G. (1963). A Note on Brittle Crack Growth in Compression. J. Geophys. Res. 68 (12), 3709–3713. doi:10.1029/jz068i012p03709
Bueckner, H. F. (1970). A Novel Principle for the Computation of Stress Intensity Factors. Z. fürAngewandte Mathematik Mechanik 50, 529–545.
Cai, M., and Kaiser, P. K. (2004). Generalized Crack Initiation and Crack Damage Stress Thresholds of Brittle Rock Masses Near Underground Excavations. Int. J. Rock Mech. Mining Sci. 41 (5), 834–847. doi:10.1016/j.ijrmms.2004.02.001
Clayton, J. D., and Knap, J. (2014). A Geometrically Nonlinear Phase Field Theory of Brittle Fracture. Int. J. Fract 189 (2), 139–148. doi:10.1007/s10704-014-9965-1
Cui, S., Pei, X., Jiang, Y., Wang, G., Fan, X., Yang, Q., et al. (2021). Liquefaction within a Bedding Fault: Understanding the Initiation and Movement of the Daguangbao Landslide Triggered by the 2008 Wenchuan Earthquake (Ms = 8.0). Eng. Geology. 295, 106455. doi:10.1016/j.enggeo.2021.106455
Dragon, A., Halm, D., and Desover, T. (2000). Anisotropic Damage in Quasi-Brittle Solids: Modeling, Computational Issues and Applications. Comp. Methods Appl. Mech. Eng. 183 (3–4), 331–352. doi:10.1016/s0045-7825(99)00225-x
Eberhardt, E., Stead, D., and Stimpson, B. (1999). Quantifying Progressive Pre-peak Brittle Fracture Damage in Rock during Uniaxial Compression. Int. J. Rock Mech. Mining Sci. 36, 361–380. doi:10.1016/s0148-9062(99)00019-4
Fairhurst, C., and Cook, N. G. W. (1966). The Phenomenon of Rock Splitting Parallel to the Direction of Maximum Compression in the Neighborhood of a Surface. Proc. 1st Int. Congress Rock Mech. 25, 697–692.
Horii, H., and Nemat-Nasser, S. (1986). Brittle Failure in Compression: Splitting, Faulting and Brittle-Ductile Transition. Phil. Trans. R. Soc. Lond. Ser. A, Math. Phys. Sci. 319 (1549), 337–374.
Horii, H., and Nemat-Nasser, S. (1985). Compression-induced Microcrack Growth in Brittle Solids: Axial Splitting and Shear Failure. J. Geophys. Res. 90 (B4), 3105–3125. doi:10.1029/jb090ib04p03105
Huang, C., Yang, W., Duan, K., Fang, L., Wang, L., and Bo, C. (2019). Mechanical Behaviors of the Brittle Rock-like Specimens with Multi-Non-Persistent Joints under Uniaxial Compression. Construction Building Mater. 220, 426–443. doi:10.1016/j.conbuildmat.2019.05.159
Janeiro, R. P., and Einstein, H. H. (2010). Experimental Study of the Cracking Behavior of Specimens Containing Inclusions (Under Uniaxial Compression). Int. J. Fract 164 (1), 83–102. doi:10.1007/s10704-010-9457-x
Jing, L. (2003). A Review of Techniques, Advances and Outstanding Issues in Numerical Modelling for Rock Mechanics and Rock Engineering. Int. J. Rock Mech. Mining Sci. 40 (3), 283–353. doi:10.1016/s1365-1609(03)00013-3
Kemeny, J. M., and Cook, N. G. W. (1987). Crack Models for the Failure of Rock under Compression. Proc. 2nd Int. Conf. Constitutive Laws Eng. Mat 2, 879–887.
Kolari, K. (2017). A Complete Three-Dimensional Continuum Model of wing-crack Growth in Granular Brittle Solids. Int. J. Sol. structures 115-116, 27–42. doi:10.1016/j.ijsolstr.2017.02.012
Lan, H., MartinC, D., and Hu, B. (2010). Effect of Heterogeneity of Brittle Rock on Micromechanical Extensile Behavior during Compression Loading. J. Geophys. Res. 115 (B1). doi:10.1029/2009jb006496
Lehner, F., and Kachanov, M. (2001). “On Modelling of "Winged" Cracks Forming under Compression,” in Physical Aspects of Fracture, 73–75. doi:10.1007/978-94-010-0656-9_6
Nemat-Nasser, S., and Obata, M. (1988). A Microcrack Model of Dilatancy in Brittle Materials. J. Appl. Mech. 55 (1), 24–35. doi:10.1115/1.3173647
Nemat‐Nasser, S., and Horii, H. (1982). Compression‐induced Nonplanar Crack Extension with Application to Splitting, Exfoliation, and Rockburst. J. Geophys. Res. Solid Earth 87 (B8), 6805–6821.
Ohno, K., and Ohtsu, M. (2010). Crack Classification in concrete Based on Acoustic Emission. Construction Building Mater. 24 (12), 2339–2346. doi:10.1016/j.conbuildmat.2010.05.004
Olsson, W. A., and Peng, S. S. (1976)., 13. Pergamon, 53–59. doi:10.1016/0148-9062(76)90704-xMicrocrack Nucleation in marbleInt. J. Rock Mech. Mining Sci. Geomechanics Abstr.2
Read, R. S. (2004). 20 Years of Excavation Response Studies at AECL’s Underground Research Laboratory. Int. J. Rock Mech. Mining Sci. 41 (5), 1251–1275. doi:10.1016/j.ijrmms.2004.09.012
Renshaw, C. E., and Schulson, E. M. (2001). Universal Behaviour in Compressive Failure of Brittle Materials. Nature 412 (6850), 897–900. doi:10.1038/35091045
Rice, J. R. (1972). Some Remarks on Elastic Crack-Tip Stress Fields. Int. J. Sol. Structures 8 (6), 751–758. doi:10.1016/0020-7683(72)90040-6
Steif, P. S. (1984). Crack Extension under Compressive Loading. Eng. Fracture Mech. 20 (3), 463–473. doi:10.1016/0013-7944(84)90051-1
Wang, Y. X., Cao, P., Huang, Y. H., Chen, R., and Li, J. T. (2012). Nonlinear Damage and Failure Behavior of Brittle Rock Subjected to Impact Loading. Int. J. Nonlinear Sci. Numer. Simulation 13 (1), 61–68. doi:10.1515/ijnsns-2011-104
Wong, T.-f., and Baud, P. (2012). The Brittle-Ductile Transition in Porous Rock: A Review. J. Struct. Geology. 44, 25–53. doi:10.1016/j.jsg.2012.07.010
Wong, T.-F. (1982). Effects of Temperature and Pressure on Failure and post-failure Behavior of Westerly Granite. Mech. Mater. 1 (1), 3–17. doi:10.1016/0167-6636(82)90020-5
Xun, Xi., Wu, X., Guo, Q., and Cai, M. (2020). Experimental Investigation and Numerical Simulation on the Crack Initiation and Propagation of Rock with Pre-existing Cracks. Ieee Access 8, 129636–129644.
Yuan, S. C., and Harrison, J. P. (2006). A Review of the State of the Art in Modelling Progressive Mechanical Breakdown and Associated Fluid Flow in Intact Heterogeneous Rocks. Int. J. Rock Mech. Mining Sci. 43 (7), 1001–1022. doi:10.1016/j.ijrmms.2006.03.004
Keywords: crack, LEFM, SIF, brittle rock, micro-fracture, acoustic emission
Citation: Zhang Y, Cui S, Yu Z and Cheng J (2022) Fracture Characteristics of Sliding Crack in Brittle Rock: Analysis Based on an Improved Equivalent Crack Model. Front. Earth Sci. 10:893549. doi: 10.3389/feart.2022.893549
Received: 10 March 2022; Accepted: 30 March 2022;
Published: 08 June 2022.
Edited by:
Yunhui Zhang, Southwest Jiaotong University, ChinaReviewed by:
Peifeng Han, Southwest University of Science and Technology, ChinaZizheng Guo, Hebei University of Technology, China
Copyright © 2022 Zhang, Cui, Yu and Cheng. This is an open-access article distributed under the terms of the Creative Commons Attribution License (CC BY). The use, distribution or reproduction in other forums is permitted, provided the original author(s) and the copyright owner(s) are credited and that the original publication in this journal is cited, in accordance with accepted academic practice. No use, distribution or reproduction is permitted which does not comply with these terms.
*Correspondence: Yin Zhang, emhhbmd5aW4wNTAzQGdtYWlsLmNvbQ==; Shenghua Cui, Y3Vpc2hlbmdodWExOEBjZHV0LmVkdS5jbg==
 Yin Zhang
 Shenghua Cui
 Zhibing Yu2