- 1Fujian Key Laboratory of Severe Weather, CMA, Fuzhou, China
- 2Department of Meteorology, University of Hawaii at Manoa, Honolulu, HI, United States
- 3Pingtan Meteorological Bureau, Pingtan, China
This study classifies regional persistent extreme precipitation events (PEPEs) in North China into two types in accordance with variance contributions and significance of different timescale rainfall variability in boreal summer. For type 1, PEPEs are dominated by a 10–20-day periodicity, and for type 2, PEPEs are mainly influenced by a 30–60-day mode. Atmospheric circulation anomalies associated with the two types of PEPEs are characterized by a zonal wave train (the EU pattern) in the mid–high latitudes in type 1 but a meridional wave train (the EAP pattern) in East Asia in type 2. The common feature of the two types is anomalous southerly on the west edge of the West Pacific Subtropical High (WPSH), which favors anomalous moisture transport into the key region. Additional moisture source for type 2 is linked to anomalous cross-equatorial flow. Both types of PEPEs result from the combined effect of intraseasonal oscillations in both the mid–high latitudes and the tropics. The impact of ENSO on the two types of PEPEs is investigated. While a La Niña SST condition in the preceding winter favor the occurrence of PEPEs, their subsequent transition in central and eastern equatorial Pacific will determine which of the two types of PEPEs is pronounced.
1 Introduction
Persistent extreme precipitation events (PEPEs hereafter) often cause more severe disasters than locally short-lived heavy precipitation events due to longer duration and wider spatial coverage, which pose a great threat to social and economic development (Galarneau et al., 2012; Lau and Kim 2012; Sun et al., 2016). Because of the complex formation and maintenance mechanisms, numerical models to date have limited ability to predict PEPEs successfully (Jiang et al., 2012, 2015; Li et al., 2016). Improving the understanding of underlying mechanisms and forecast skills of PEPEs is of great importance to disaster prevention and relief. The study of PEPEs has attracted increasing attention over recent decades (Zhai et al., 2013, 2016).
At present, one branch of research on PEPEs is to investigate the climate variability of PEPEs, especially under the global warming scenario, which cast large uncertainties on the trends of PEPEs from both global and regional perspectives (Tang et al., 2006; Bao and Huang 2006; Bao 2007; Chen and Zhai 2013; Yao and Ren 2019; Ge et al., 2022). As an important component of summer rainfall, PEPEs in East China are closely linked to the variability of East Asia summer monsoon (EASM). Numerous studies focused on the interdecadal and interannual variability of EASM driven by driving forces such as the Atlantic Multi-decadal Oscillation (AMO), Pacific Decadal Oscillation (PDO), El Niño Southern Oscillation (ENSO), Tropical Indian Ocean Dipole (IOD), and other climate modes in the coupled ocean-atmosphere system (Huang and Wu 1989; Huang et al., 2003; Chen et al., 2013; Feng and Chen, 2014; Si and Ding 2016; Yu and Zhai 2018; Zhang et al., 2018; Chen et al., 2019; Ding et al., 2020). Although not directly linked to PEPEs, these studies shed light on the cognition of variability in PEPEs and are helpful for understanding the background conditions controlling the variability of PEPEs.
Atmospheric intraseasonal oscillations (ISOs) play an important role in causing sub-seasonal rainfall variations in the Asian summer monsoon region (Ferranti et al., 1990; Yang 1992; Jones et al., 2000, 2003; Yang et al., 2010a; Chen et al., 2015; Lin et al., 2016; Sun et al., 2016). ISOs may be decomposed into quasi-biweekly (10–20 days) and lower-frequency (30–60 days) components over the monsoon regions (Li and Wang, 2005). Therefore, understanding and predicting the two low-frequency band variability modes and their linkage with PEPEs is critical for conducting extended-range weather forecasts (Chen and Wei 2012; Gao et al., 2016; Zhu and Li 2017; Li and Mao 2019; Zhang et al., 2019a).
It is widely accepted that long-lasting precipitation extremes are often associated with persistent circulation anomalies. For instance, a westward shift of the WPSH and an eastward displacement of the South Asia high (SAH) for an extensive period may provide persisting northward moisture transport from the tropical oceans to South China, leading to PEPEs in the subsequent weeks (Chen and Zhai 2014a; Chen and Zhai 2014b; Chen and Zhai 2016). A number of studies have linked persistent circulation anomalies to atmospheric teleconnection patterns such as the Eurasian Pattern (EU), the East Asia-Pacific Pattern (EAP) or Japan-Pacific Pattern (JP), and Silk Road Wave Train Pattern (Wallace and Gutzler 1981; Kosaka and Nakamura 2010; Kosaka et al., 2011; Liu et al., 2014; Chen and Zhai 2015; Orsolini et al., 2015; Wang et al., 2018).
Marked progress has been made in the application of the PEPEs forecast in China. Various forecast techniques have been developed using statistical, dynamical, or combined statistical-dynamical approaches (Chen and Wei 2012; Hsu et al., 2015; Zhou and Zhai 2016; He et al., 2017). Most of these studies focused on regions like the mid–lower reaches of the Yangtze River and South China (Chen and Wei 2012; Chen and Zhai 2015; Hsu et al., 2015), and less attention has been paid to PEPEs in North China as annual precipitation there is much less. However, precipitation in North China has its own unique feature with summer precipitation accounting for more than 50% of the annual precipitation, and most of the summer precipitation concentrates within several heavy precipitation processes (see compilers of “Heavy rainfall in North China” 1992). Some of the heavy precipitation events reach the criteria of PEPEs.
Previous studies on PEPEs in North China focused on the characteristics of concurrent atmospheric circulations and mesoscale processes of PEPEs (e.g., Zhang and Cui 2012; Fu et al., 2017; Zhang et al., 2019b; Zhou et al., 2020). For the low-frequency features of summer precipitation or PEPEs in North China, most studies were confined to mid-latitude quasi-biweekly oscillations (Zhou et al., 2014; Hao et al., 2015). Few studies paid attention to the relationship between tropical ISO and precipitation in North China. Hao et al. (2020) pointed out that the tropical ISO, the Madden-Julian Oscillation (MJO), played a role in affecting summer precipitation in North China in 2018 through northward water vapor transport. Therefore, it is desirable to carefully examine the impact of both the tropical and mid-latitude ISOs on PEPEs in North China.
The objective of this study is to conduct a comprehensive investigation of PEPEs in North China from the perspective of a multiscale influences point of view. Special attention will be paid to precursor signals prior to PEPEs in North China. The remainder of this article is organized as follows: Section 2 introduces the data and methods employed in this study. Section 3 describes the observed characteristics of PEPEs in North China. Section 4 investigates the multiscale influences on PEPEs. Section 5 summarizes relevant conclusions and presents some further discussions.
2 Data and Methods
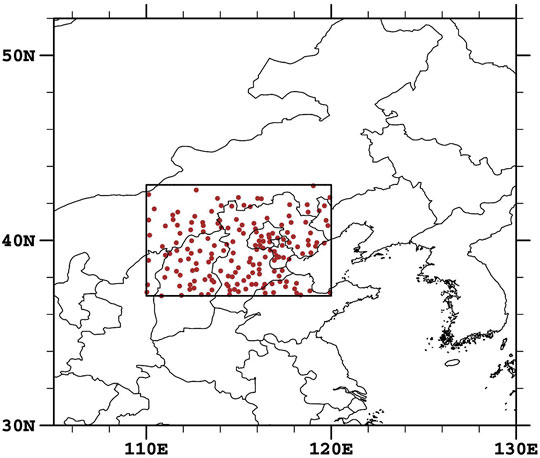
Datasets used in this study include daily precipitation (12:00-12:00UTC the following day) at 173 weather stations in North China (37-43°N, 110-120°E) for the period from 1979 to 2019, provided by National Meteorological Information Center (Figure 1). Data missing rates of these 173 stations are less than 0.05%, and the precipitation correlation of each station to the base station of North China (Zunhua station in Hebei Province) exceeds a 95% confidence level, which indicates these chosen stations are uniformly representative of the regional precipitation characteristics. Additional data include 3-dimensional atmospheric variables such as geopotential height, horizontal wind (zonal and meridional wind), and specific humidity fields, derived from European Centre for Medium-Range Weather Forecasts (ECMWF) ERA-Interim daily reanalysis for the period from 1979 to 2018 (Dee et al., 2011) and ERA5 daily reanalysis in 2019 (Hersbach et al., 2020). The reason to combine the two datasets is that the ERA-Interim reanalysis was superseded by ERA5 reanalysis on 1 September 2019. The horizontal resolution of the combined reanalysis data is 1.5°×1.5°, and vertically it extends from 1,000 hPa to 1 hPa with 37 vertical levels. The monthly SST field is obtained from the COBE SST data product (Ishii et al., 2005).
El Niño or La Niña years and their intensities are defined by the Ocean Niño Index (ONI), which is represented by a 3-months running mean SST anomaly in the Niño 3.4 region (5°N–5°S, 120–170°W). This index is available at the following website:
https://origin.cpc.ncep.noaa.gov/products/analysis_monitoring/ensostuff/ONI_v5.php
Analysis methods adopted in this article include Lanczos filtering (Duchon 1979), power spectrum analysis, wavelet analysis, and composite analysis. Student’s t-test is used for the significance test.
Regional PEPEs are identified by the criteria defined by Lin et al. (2020). To be specific, the criteria are (1) the number of stations at which daily precipitation exceeds the heavy precipitation threshold (33.3 mm in North China) is greater than or equal to 4% of all stations in the region, 33.3 mm corresponds to the 78 percentile of daily precipitation of all stations. It is worth noting that stations used here are national weather stations, each station is regarded as representing precipitation of relatively large areas. The reason for choosing 33.3 mm as the heavy precipitation threshold is that the frequency of PEPEs in North China would be much less and many heavy precipitation events causing severe disaster would be missed if the more commonly used threshold of torrential rain (i.e., greater than or equal to 50 mm per day) is accepted, 33.3 mm is adopted under the consideration of highlighting the extremes of precipitation and selecting heavy precipitation events brought great social impacts as much as possible in the meantime. (2) regional mean daily precipitation is greater than or equal to 6.95 mm, which is the addition of climatological regional mean daily precipitation (4.16 mm) and half of the standard deviation (2.79 mm), (3) at least one station at which daily precipitation greater than 33.3 mm persists two consecutive days, or rain band coincidence degree (CRB) exceed 20%, the equation of CRB is as follows:
N1 and N2 indicate amounts of stations at which daily precipitation is greater than or equal to the addition of climatological regional mean daily precipitation (4.16 mm) and the standard deviation (5.58 mm) on two successive days, N12 indicates the overlapped station amount. Heavy precipitation events meeting the above criteria and lasting longer than or equal to three consecutive days are considered a regional PEPE. 26 PEPEs are identified in North China during summertime (June–August) from 1979 to 2019.
3 Observed Characteristics of Persistent Extreme Precipitation Events in North China
According to the power spectrum analysis of regional averaged daily precipitation from May to September during 1979–2019 (figure omitted, in order to identify longer periodicity, the time span is expanded from May to September), the main periodicity of summer rainfall variations in North China is 10–20-days oscillation, which agrees with earlier findings of Hao et al. (2015). However, wavelet analysis reveals that longer periodicity such as 30–60-days oscillation is also significant in some of the years that PEPEs occur (Figure 2). Comparing to the evolution of different low-frequency oscillations and the occurrence of PEPEs, it is found that PEPEs always occurred during the peak of the positive phase of low-frequency oscillations, which indicates PEPEs are closely related to and modulate by the dominant low-frequency oscillations. Therefore, factors causing variations in summer rainfall and determining the significance of low-frequency modes could also affect the occurrence of PEPEs.
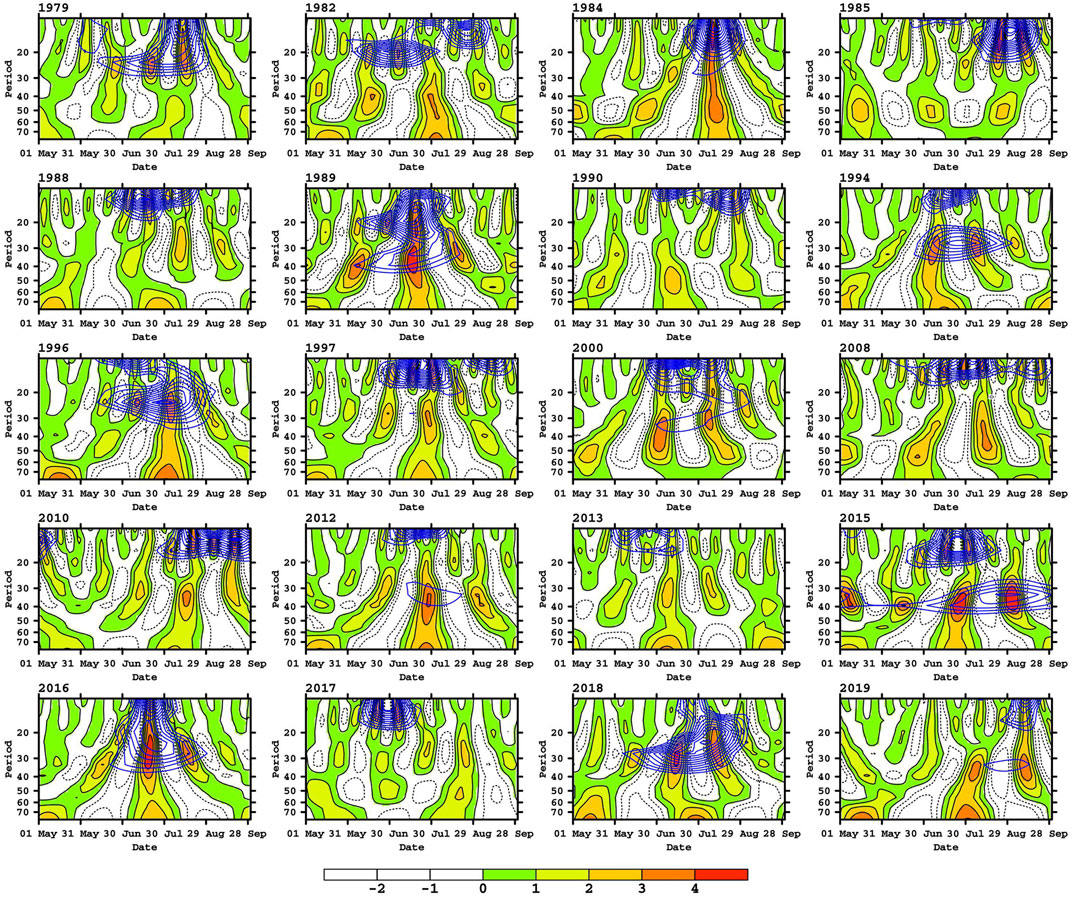
FIGURE 2. Wavelet analysis of regional daily precipitation from May to September in years that PEPEs occur, blue contour areas denote which periods are significant at the 95% confidence level.
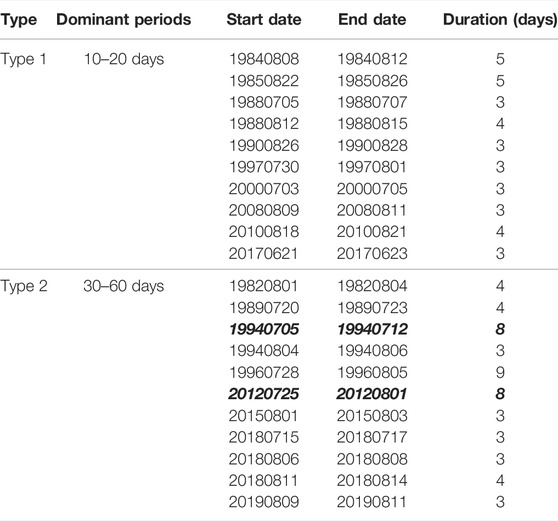
Different timescale filtered (10–20 days, 20–30 days, 30–90 days, and greater than 90 days) rainfall is firstly obtained, the variance of rainfall and the variance of each periodicity during summertime are then calculated to compare the contributions of different periodicities to the total variance of summer rainfall in each year that PEPEs occur. Based on the comprehensive consideration of dominant variance contributions (see Figures 3A,B) and the significance of these bands in all these years (Figure 2), PEPEs may be classified into two types (Table 1). For type 1 (type 2), PEPEs occur in the years when summer rainfall variations are dominated by the 10–20-day (30–60 days) oscillation, and these years are called type 1 (type 2) years. Case 5-8 July and case 10-12 July 1994 are merged into one case, as there is only 1-day gap between the two cases and they are influenced by the same low-frequency mode. Likewise, case 25–28 July and case 30 July–1 August 2012 are also merged (see the bold-italics in Table 1). Among 26 PEPE cases, three cases during 10–15 August 1979, 08–10 July 2013, and 18–20 July 2016 are excluded from the following composite analysis, because rainfall variance contributions of different periodicities in these years are relatively homogeneous, or variance contribution is not so pronounced despite the significance of that periodicity. Therefore, the remainder of this study is focused on the analysis of these 21 cases.
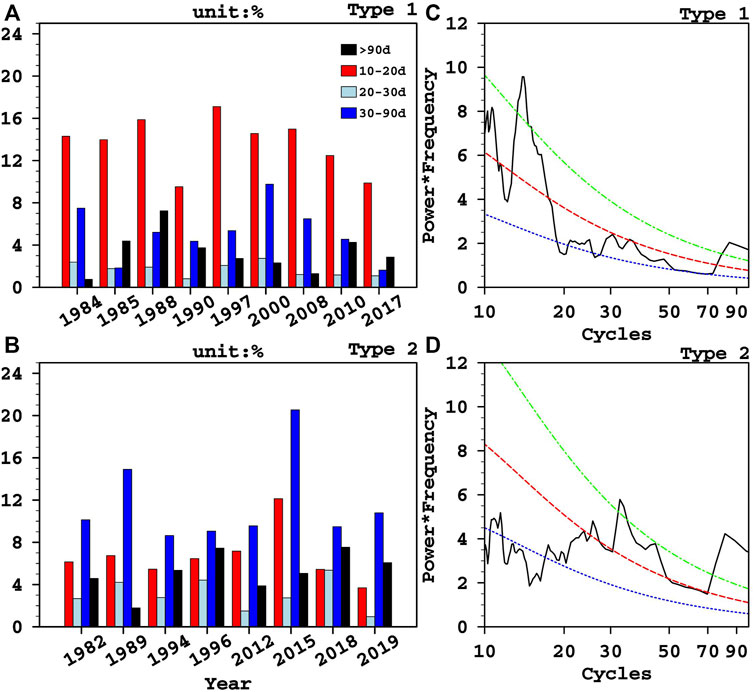
FIGURE 3. Variance contributions of different oscillations (10–20 days, 20–30 days, 30–90 days, and equal and greater than 90 days) to summer rainfall variations of type 1 (A) and type 2 (B) years. Power spectrum analyses of regional averaged daily precipitation during summer of type 1 (C) and type 2 (D) years.
Figures 3A,B shows the variance contributions of low-frequency bands (10–20 days, 20–30 days, and 30–90 days) to summer rainfall variations for type 1 and type 2 years, respectively. For comparison, the variance of a longer oscillation mode (with a period greater than 90 days) is also shown. It is clear that the contribution of the 10–20-day mode is greater than the sum of variance contributions of other modes for type 1 years. For type 2 years, on the other hand, the variance of the 30–90-day oscillation dominates. Figures 3C,D present the power spectrum analyses of type 1 and type 2 years. It can be seen that the 10–20-day (30–60 days) period is the most significant band with the greatest power density for type 1 (type 2) years. These features indicate that the 30–60-day oscillation is worth noting in some years, despite the 10–20-day oscillation being the main mode in North China in general.
4 Multiscale Influences on Persistent Extreme Precipitation Events in North China
4.1 Features of Tropical SST Anomalies Associated With Two Types of Persistent Extreme Precipitation Events
ENSO has been regarded as a major factor that influences the precipitation anomaly of EASM on the interannual timescale (Huang and Wu 1989; Feng et al., 2010; Chen et al., 2018; Yu and Zhai 2018), which could modulate the occurrence of PEPEs by affecting the advance and retreat of EASM and the accompanying circulation anomaly.
Statistically, 13 La Niña, 14 El Niño, and 14 neutral events occur during 1979–2019, among which, 4 out of 14 El Niño events (29%), 8 out of 13 La Niña events (62%), and 5 out of 14 neutral states (36%) are associated with PEPEs. Furthermore, La Niña, El Niño, and neutral states during the preceding winter of PEPEs account for 47%, 24%, and 29% of total cases respectively (Table 2), indicating La Niña in the preceding winter are more favorable for PEPEs, which are consistent with the fact that there is more precipitation in North China during La Niña events (Chen et al., 2006; Zhao et al., 2017). The transition of SST anomalies in the tropical Pacific from the preceding winter to the concurrent summer (Table 2, E-L (El Niño-La Niña) means SST anomalies in the tropical Pacific transiting from El Niño to La Niña, which indicates the states of SST in that region becoming colder), one can see that type 1 PEPEs tend to occur when the SST anomalies in central and the eastern equatorial Pacific become colder or keep the cold/neutral state (6/9 years), while type 2 PEPEs tend to occur in an opposite situation that the SST anomalies transition to warmer or keep the warm/neutral state in the concurrent summer (7/8 years).

TABLE 2. E, L, and N denote the SST states of central and eastern equatorial Pacific is El Niño, La Niña, and neutral, respectively. E–L means the SST states transiting from El Niño to La Niña from preceding winter (December–February, DJF) to concurrent summer (June–August, JJA), and vice versa. Red, blue, and black fonts mean SST of central and eastern equatorial Pacific in warm, cold, and neutral state, respectively.
Figure 4 shows the composite analyses of tropical SST anomalies during the preceding winter and concurrent summer for two types of years. The common feature is that both types of PEPEs present a La Niña pattern during the preceding winter, but warm and cold SST anomalies in western and eastern equatorial Pacific for type 2 years are more intense than those in type 1 years (Figure 4A,C,E). The La Niña pattern persists into the concurrent summer but with a weaker intensity for type 1 years, whereas the SST anomalies decay rapidly for type 2 years and transition into a warm SST anomaly in eastern equatorial Pacific. Moreover, significant warming appears in the northeastern Pacific and it lasts from the preceding winter to the concurrent summer (Figure 4C,D). The features of SST anomaly evolution in tropical Pacific of type 1 and 2 years agree with the results shown in Table 2. Type 1 PEPEs tend to occur during a persisting La Niña event. Type 2 PEPEs, on the other hand, are more likely to occur during the La Niña to El Niño transition state.
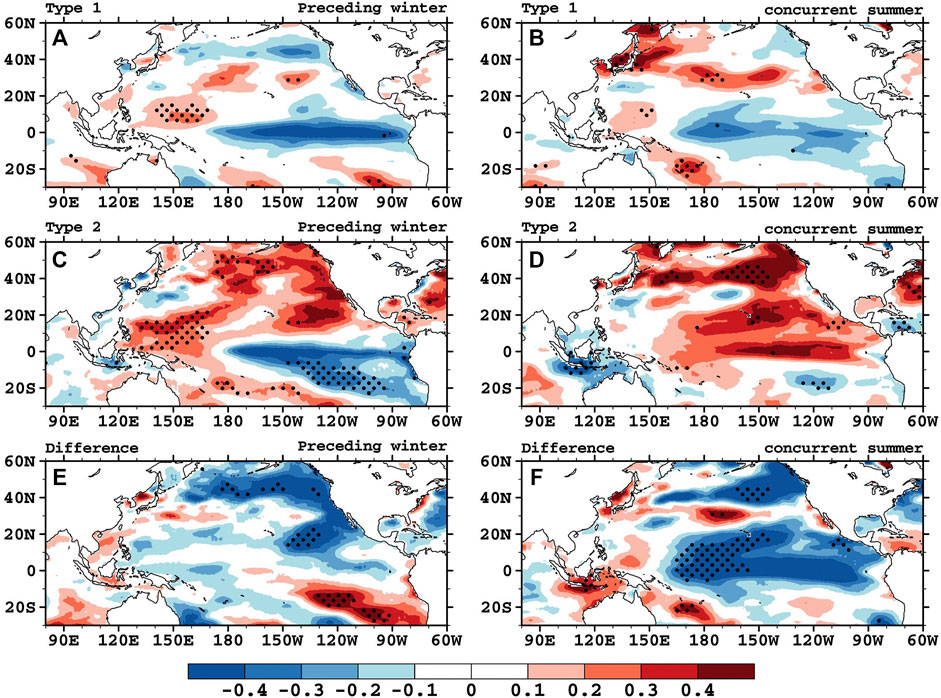
FIGURE 4. Composited preceding winter SST anomalies for type 1 (A), type 2 (C) years and different fields of preceding winter SST anomalies of type 1 and type 2 years (E). Composited concurrent summer SST anomalies for type 1 (B), type 2 (D) years, and different fields of concurrent summer SST anomalies of type 1 and type 2 years (F). Dotted areas indicate a 90% significance level.
4.2 Atmospheric Circulation Anomalies for the Two Types of Persistent Extreme Precipitation Events
Before examining anomalous atmospheric circulations associated with PEPEs, we first show the summertime climatological circulation in the region. Figure 5 illustrates the climatological westerly jet in the upper troposphere, the WPSH, and vertically integrated moisture flux in the East Asian/western Pacific region. A strong westerly jet lies in the mid-latitude (along 40°N), and North China is located to the northeast of the SAH (South Asia high, Figure 5A). The WPSH is located to the south of Japan with its ridge lying along 30°N. North China is located in the relatively uniform westerly region with a trough upstream at 90°E (Figure 5B). From the vertically integrated moisture flux map, one may see that North China is located over the northernmost boundary of the moisture convergence in summer due to the northward progression of boreal summer monsoon precipitation.
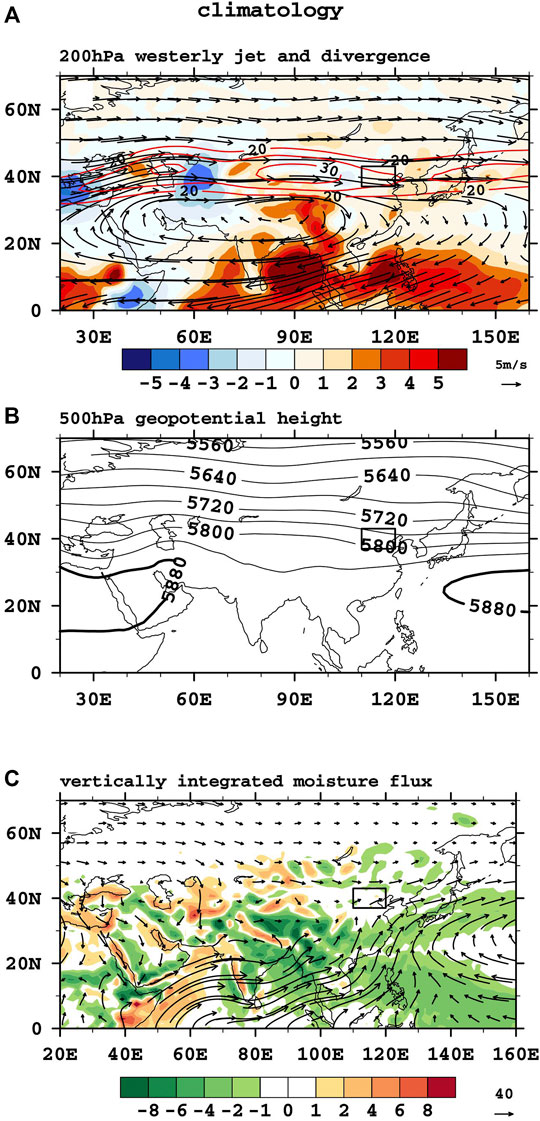
FIGURE 5. Climatology of wind field (vector, unit: m·s−1), westerly jet (contour, unit: m·s−1) and divergence (shading, unit: 10−6s−1) at 200 hPa (A), geopotential height (contour, unit: gpm) at 500 hPa (B), vertically integrated moisture flux (shading, unit: 10−5 kg/m2/s) and moisture flux divergence (vector, unit: kg/m/s) from 1,000 to 300 hPa (C) during summer from 1981 to 2010.
Circulation anomalies during two types of PEPEs are presented in Figure 6. The upper-tropospheric zonal wind and divergence anomaly fields show a divergence anomaly over the North China region, being consistent with enhanced precipitation over the region for both types of PEPEs (Figure 6A,B). The WPSH is intensified and shifts northwestward with the upstream westerly trough moving eastward for both types of PEPEs compared to their climatological state. This forms a favorable stationary anomalous high around North China by restraining the propagation of trough upstream. From the 500hPa height anomalies, a zonal wave-like pattern from Eurasia to East Asia in the mid–high latitudes and a meridional wave-like pattern from low to high latitudes in East Asia can be seen in both types of PEPEs, except that the zonal (meridional) wave train is more robust in type 1 (type 2) PEPEs (Figure 6C,D). It is worth noting that a positive height anomaly embedded in the wave train appears in North China for both types of PEPEs, while the associated positive height anomaly center in the lower troposphere shifts to the east, especially for type 2 PEPEs. This leads to pronounced anomalous southerlies south of the North China region (Figure 6E,F). The slightly tilted vertical structure is crucial in inducing anomalous moisture advection at low-level and causing PEPEs. From the anomalous vertical integrated moisture flux field (Figure 6G,H), there are evident moisture flux convergence in North China and moisture flux divergence downstream, which are well linked to the height and wind anomaly patterns at 850 hPa (Figure 6E,F).
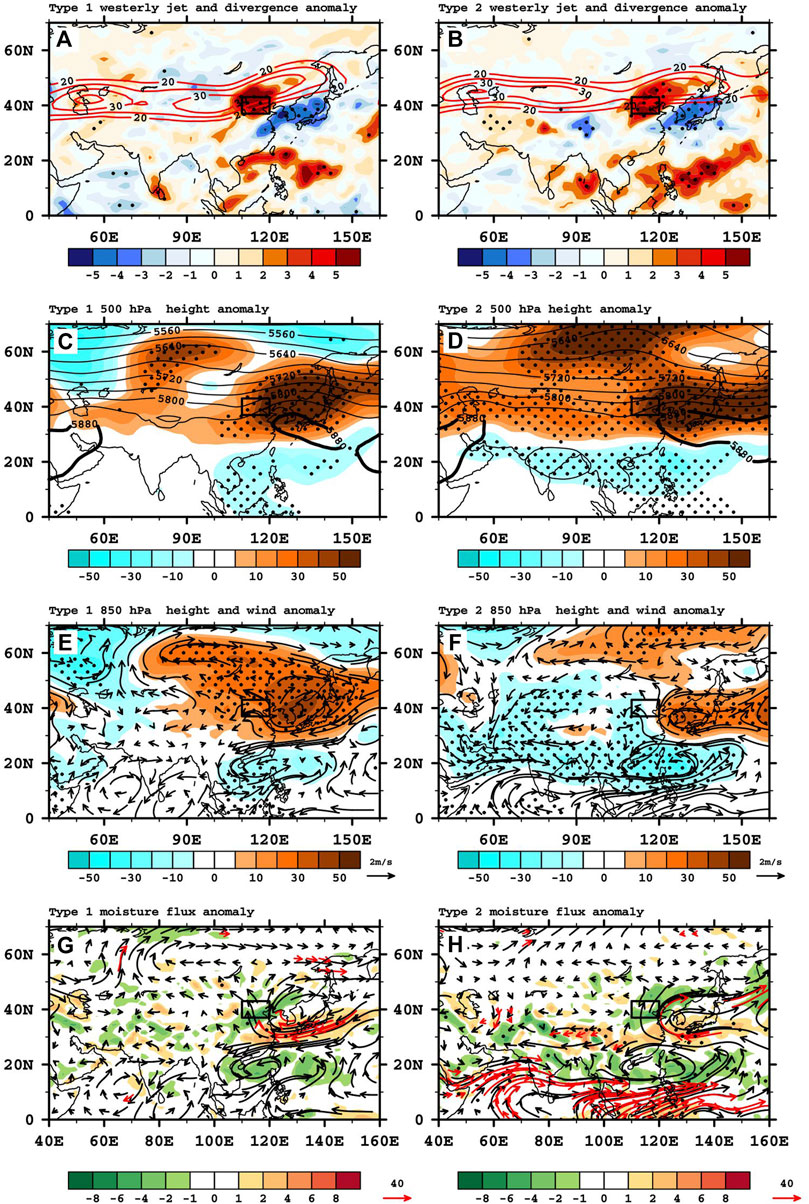
FIGURE 6. Westerly jet (contour, unit: m·s-1) and divergence anomalies (shading, unit: 10-6s-1) at 200 hPa (A,B), mean geopotential height (contour, unit: gpm) and height anomalies (shading, unit: gpm) at 500 (C,D) and 850 hPa (E,F), vertically integrated moisture flux anomalies (shading, unit: 10-5kg/m2/s) and moisture flux divergence anomalies (black vector, unit: kg/m/s) from 1,000 to 300 hPa (G,H) of type 1 and type 2 PEPEs. Dotted areas and red vectors in (G,H) indicate a 95% confidence level. Rectangle indicates North China.
The main difference in the moisture transport between the two types of PEPEs lies in the water vapor source. For both types, the direct and main moisture source is from the East China Sea (Figure 6G,H). According to Figure 5C, the cross-equatorial flow in the tropics plays an important role to transport moisture from long distances during summertime. Compared to the climatology, moisture sources from the tropical Indian Ocean, South China Sea, and western North Pacific are more intense for type 2 PEPEs, which indirectly influence North China by transporting moisture through the cyclonic circulation anomaly in the lower troposphere, while moisture transport from the tropical Indian Ocean is weakened for type 1 PEPEs (Figure 6G,H).
Abundant moisture and anomalous southerly in the lower troposphere are two critical factors to cause persistent rainfall. Figure 7 depicts the evolution of meridional wind anomalies and moisture anomalies associated with two types of PEPEs. The meridional wind anomalies and moisture anomalies switch to a positive and a wet phase 3 days before the onset of type 1 PEPEs (Figure 7A,B). The southerly anomaly and the positive moisture anomaly change sign 3 days after the onset of PEPEs, which is coherent with the duration of type 1 PEPEs. For type 2, the wet phase and anomalous southerly last longer than type 1. In particular, the positive moisture anomalies emerge earlier (Figure 7CD). The intensity and spatial coverage of the moisture and meridional wind anomalies in type 2 are greater than those of type 1.
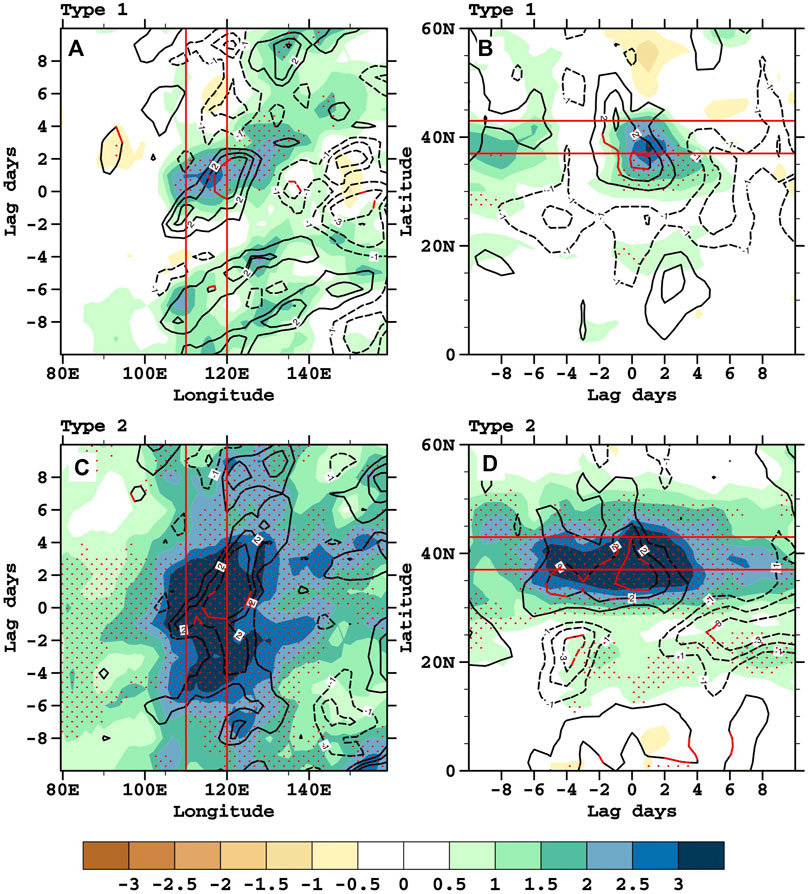
FIGURE 7. Time-longitude cross sections of mean meridional wind anomalies (contour, unit: m·s−1) and specific humidity anomalies (shading, unit: g·kg−1) at 850 hPa over 37–43N of type 1 (A) and 2 (C) PEPEs, Time-latitude cross sections of mean meridional wind anomalies (contour, unit: m·s−1) and specific humidity anomalies (shading, unit: g·kg−1) at 850 hPa over 110-120E of type 1 (B) and 2 (D) PEPEs, lag days equals -8 (8) means 8 days prior to (after) the onset of PEPEs. Red contour and dotted areas indicate a 95% confidence level. Red boxes indicate the longitude and latitude range of North China.
We further examine the detailed evolutions of anomalous circulations at 850 hPa for types 1 and 2 (Figure 8). Here the evolution of anomalous circulation in type 2 is tracked back further in time due to its longer period. Regardless of type, the occurrence of PEPEs is always associated with a transition from anomalous northerly to anomalous southerly and is accompanied by the increase of local moisture in North China. The establishment of the southerly is associated with the formation of an anomalous low-level anticyclone to the east. In addition, an anomalous cyclone appears in lower latitudes in both types of PEPEs, which intensifies as the anomalous anticyclone to its north develops. The pair of the cyclonic and anticyclonic circulation plays an important role in bridging the moisture from the tropical ocean to mid-latitudes. Its impact is more evident in type 2 PEPEs as seen in Figure 6H.
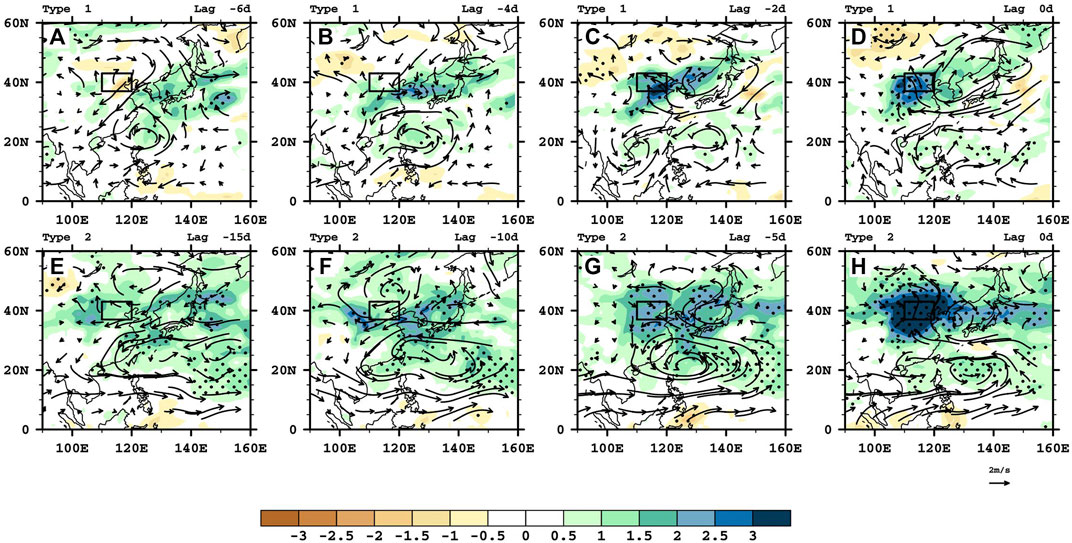
FIGURE 8. Composited specific humidity anomalies (shading, unit: g·kg−1) and wind anomalies (vector, unit: m·s−1) at 850 hPa during day 6 (A), 4 (B), 2 (C), and 0 (D) prior to the onset of type 1 PEPEs. Composited specific humidity anomalies (shading, unit: g·kg−1) and wind anomalies (vector, unit: m·s−1) at 850 hPa during day −15 (E), −10 (F), −5 (G), and 0 (H) prior to the onset of type 2 PEPEs. Dotted areas indicate 95% confidence level.
In brief, the low-frequency variation of the background circulation such as the westward shift of the WPSH and the establishment of the zonally and meridionally oriented wave train and associated vertical tilting of geopotential height anomalies provide favorable conditions for PEPEs. They induce pronounced anomalous low-level southerlies, leading to abundant moisture transport and thus PEPEs in North China.
4.3 Low-Frequency Differences Between the Two Types of PEPEs
As analyzed above, the atmospheric circulation anomalies of type 1 and type 2 PEPEs exhibit some similarities and differences. According to the power spectrum analysis in Figure 3, the 10–20-days and 30–60-days oscillations are the dominant modes in type 1 and type 2, respectively. Therefore, the different timescale modes may make major contributions to the differences in atmospheric circulation anomalies between the two types of PEPEs.
We first investigate the evolution of the 10–20-day filtered circulation of type 1 PEPEs. The left panel of Figure 9 shows the 10–20-day filtered geopotential height fields at 500 hPa and the right panel shows the 10–20-day filtered specific humidity and wind fields at 850 hPa during days 6, 4, 2, and 0 prior to the onset of type 1 PEPEs (lag 6d, 4d, 2d, and 0d). It is obvious that a zonally oriented wave train with the EU-like pattern appears in mid–high latitudes, which moves southeastward from East Europe to East Asia (Figure 9A,C,E,G). On day 6, (Figure 9A), a negative height anomaly appears over Northeast China and Japan. The height anomaly is associated with anomalous northwesterly in the region at 850 hPa (Figure 9B). On days 4 and 2, the negative height anomaly adjacent to North China transitions into a weak positive height anomaly (Figure 9C,E). Accordingly, the anomalous northerly turns to anomalous southerly, accompanied by the increase of the humidity anomaly (Figure 9D,F). From the onset of PEPEs (Figure 9G), North China locates between a negative and a positive height anomaly. This positive anomaly lying downstream of North China is essential to help setup the low-level southerly anomalies in the key region. It causes the westward shift and intensification of the WPSH. The negative height anomaly corresponds to a deep trough, which may promote anomalous ascending motion in North China. As a result, North China is anomalous wet and anomalous southerlies prevail in the lower troposphere (Figure 9H). By comparing the longitudinal locations of the positive height center at 500hPa and the dry area at 850hPa (Figure 9G,H), the latter lies downstream of North China due to the local low-level positive height anomaly there, one can see clearly the vertically tilted structure, with the low-level high-pressure center being located slightly eastward. With the eastward propagation of the wave train, there is an alternation between a dry and a wet phase shift, along with the change of anomalous northerly and southerly, forming a low-frequency oscillation.
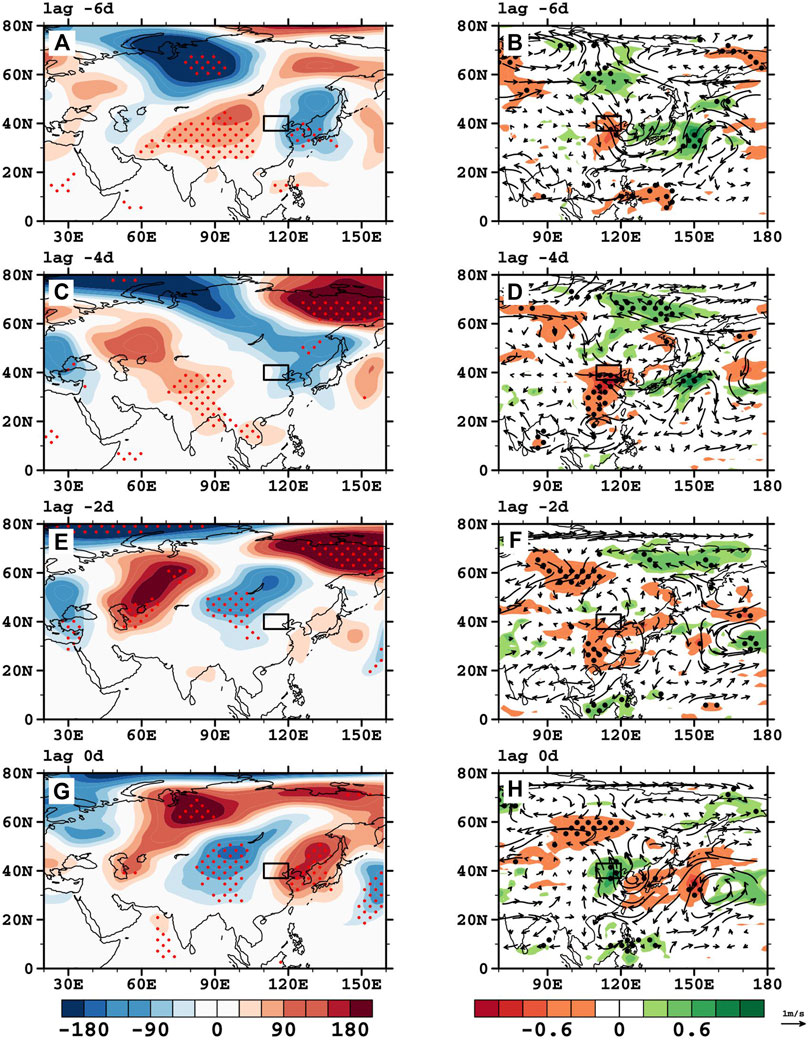
FIGURE 9. 10–20-day filtered geopotential height (shading, unit: gpm) fields at 500 hPa (A,C,E, G) and specific humidity (shading, unit: g·kg−1) and wind (vector, unit: m·s−1) fields at 850 hPa (B,D,F,H) during day 6, 4, 2, and 0 prior to the onset of type 1 PEPEs. Red and black dotted areas indicate a 95% confidence level. The rectangle indicates North China.
Figure 10 presents the evolution of the 30–60-day filtered circulation fields for type 2 PEPEs. It can be seen clearly that a meridional wave train resembling the EAP pattern from low latitude to high latitudes appears in East Asia (Figure 10A,C,E,G). Unlike type 1 PEPEs, the zonally oriented wave train in the mid–high latitudes is somewhat discontinuous in the early stage (Figure 10C). The amplitude of the local positive height anomaly intensifies quickly 5 days before the onset of PEPEs (Figure 10E). During the onset of type 2 PEPEs (Figure 10G), North China locates between a negative and a positive height anomaly in a way similar to type 1 PEPEs. However, this intensification results from the joint influence of the zonal wave train in the mid–high latitudes and the meridional wave train in East Asia. The impact of the meridional wave train can be detected from the pronounced northward propagation of anomalous anticyclone and cyclone pairs and associated dry and wet anomalies (Figure 10B,D,F,H).
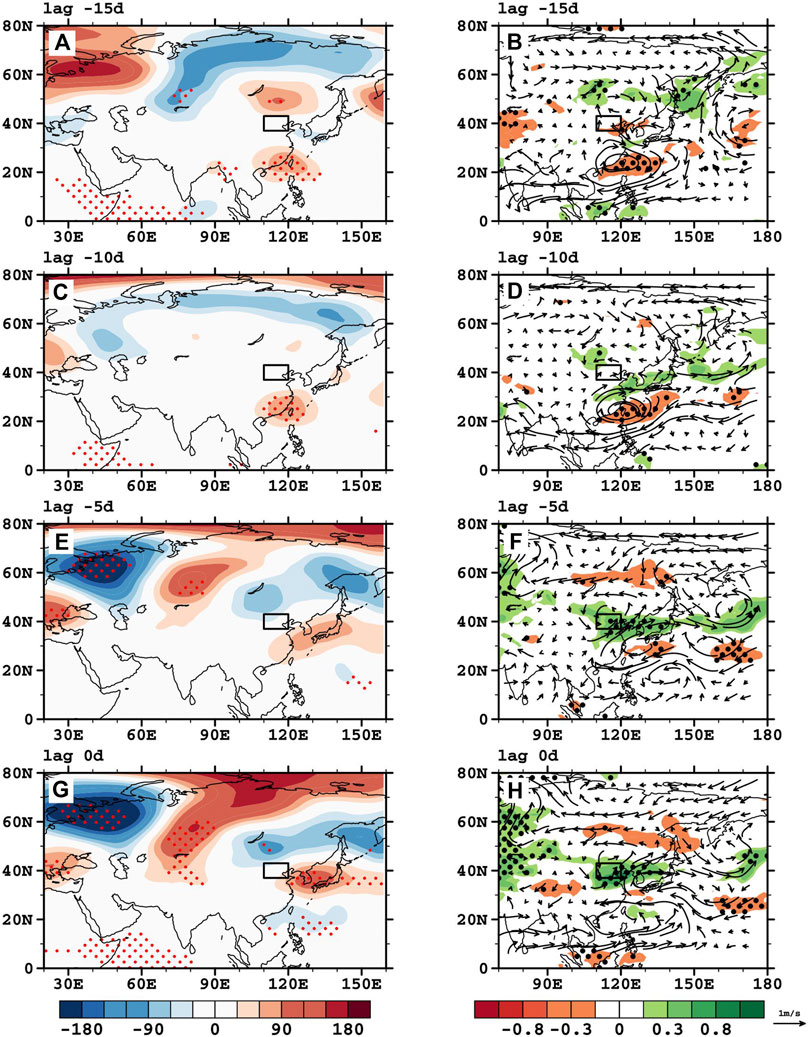
FIGURE 10. 30–60-day filtered geopotential height (shading, unit: gpm) fields at 500 hPa (A,C,E,G) and specific humidity (shading, unit: g·kg−1) and wind (vector, unit: m·s−1) fields at 850 hPa (B,D,F,H) during day 15, 10, 5, and 0 prior to the onset of type 2 PEPEs. Red and black dotted areas indicate a 95% confidence level. The rectangle indicates North China.
From the evolution of the dominant low-frequency circulation in type 1 and type 2, one may conclude that the key circulation pattern that causes PEPEs is the pair of negative and positive low-level height anomalies upstream and downstream of North China. This pattern favors anomalous southerly with abundant moisture transport into North China. While the anomalous southerly for type 1 is primarily modulated by the EU-like wave train through the tilted vertical structure, the anomalous southerly for type 2 PEPEs results primarily from the EAP wave train that has a pronounced meridional structure. The continuous evolution of low-frequency oscillations for two types of PEPEs may provide useful precursor signals for the extended-range forecast. Thus, monitoring the 10–20-day oscillation in the mid–high latitudes and the evolution of anomalous circulation in the upper and lower troposphere is critical for predicting type 1 PEPEs, while monitoring the amplitude and movement of the 30–60-day oscillation from the low latitudes is key for predicting type 2 PEPEs.
5 Summary and Discussion
PEPEs pose a great threat to social and economic development due to their longer duration and wider spatial coverage. This study attempts to investigate PEPEs in North China from the perspective of large-scale control by multiple climate modes. The main purpose is to gain a general understanding of PEPEs in North China and reveal their precursor signals.
In this study, we classify PEPEs in North China into two types in accordance with variance contributions and significance of different periodicities of summer rainfall variability. It is found that type 1 PEPEs are dominated by the 10–20-days oscillation, whereas type 2 PEPEs are mainly influenced by the 30–60-days oscillations.
On an interannual timescale, La Niña states in the preceding winter are more favorable for the occurrence of PEPEs. The major difference in tropical SST between the two types of PEPEs lies in the SST transition in the central and eastern equatorial Pacific from the preceding winter to the concurrent summer. Type 1 PEPEs tend to occur when SST anomalies in the regions persist, while type 2 PEPEs tend to occur when tropical Pacific SST anomalies transition from a cold to a warm anomaly in the concurrent summer.
Features of atmospheric circulation anomalies of the two types of PEPEs share some similarities and differences. For instance, upper-level divergence is favorable for both types of PEPEs. A major difference lies in the wave train pattern. A zonally oriented wave train is dominated in the mid–high latitudes for type 1 PEPEs, while a meridionally oriented wave train is clearly seen over the East Asia for type 2 PEPEs. The water vapor sources for type 1 PEPEs are mainly from the East China Sea in association with an anticyclone downstream of North China, while for type 2 there is an additional moisture source from the tropical Indian Ocean, the South China Sea, and the tropical western Pacific.
The comparison between two types of PEPEs indicates that both types result from combined effects of low-frequency oscillations in mid–high latitudes and the tropics. The EU-like (EAP-like) pattern with the 10–20-day (30–60 days) oscillation is more pronounced in type 1 (type 2) PEPEs, which suggests their different origins. Several previous studies focused on explaining the formation mechanisms for these teleconnection patterns and how they influence the weather and climate. Some studies pointed out that the North Atlantic Oscillation and the North Atlantic SST tri-pole mode could excite the EU pattern through Rossby wave energy dispersion (Ogi et al., 2003; Sung et al., 2006; Zuo et al., 2013). Different phases of the EAP index could affect the location of the rain belt in China by regulating the movement of the WPSH (Yang J. et al., 2010). The current study suggests that monitoring the 10–20-day oscillation in mid-latitudes may help set up a statistical model for conducting an extended-range forecast of type 1 PEPEs. For type 2 PEPEs, special attention should be paid to the 30–60-day signals from the tropics.
Data Availability Statement
The original contributions presented in the study are included in the article/supplementary material; further inquiries can be directed to the corresponding author.
Author Contributions
XG, JG, and TL contributed to conception and design of the study. LW organized the database. XG performed the data analysis. XG wrote the first draft of the manuscript. XG, JG, TL, and XC wrote sections of the manuscript. All authors contributed to manuscript revision and read and approved the submitted version.
Funding
This study was supported by the National Key Program for Developing Basic Science of China (Grants 2018YFC1505805 and 2018YFC1505906) and the National Natural Science Foundation of China (41575052).
Conflict of Interest
The authors declare that the research was conducted in the absence of any commercial or financial relationships that could be construed as a potential conflict of interest.
Publisher’s Note
All claims expressed in this article are solely those of the authors and do not necessarily represent those of their affiliated organizations, or those of the publisher, the editors and the reviewers. Any product that may be evaluated in this article, or claim that may be made by its manufacturer, is not guaranteed or endorsed by the publisher.
References
Bao, M., and Huang, R. H. (2006). Characteristics of the Interdecadal Variations of Heavy Rain over China in the Last 40 Years. Chin. J. Atmos. Sci. 30, 1057–1067. (in Chinese). doi:10.3878/j.issn.1006-9895.2006.06.01
Bao, M. (2007). The Statistical Analysis of the Persistent Heavy Rain in the Last 50 Years over China and Their Backgrounds on the Large Scale Circulation. Chin. J. Atmos. Sci. 31, 779–792. (in Chinese). doi:10.3878/j.issn.1006-9895.2007.05.03
Chen, G. J., and Wei, F. Y. (2012). An Extended-Range Forecast Method for the Persistent Heavy Precipitation over Yangtze-Huaihe River Valley in Summer Based on the Low-Frequency Oscillation Characteristics. Chin. J. Atmos. Sci. 36, 633–644. (in Chinese). doi:10.3878/j.issn.1006-9895.2011.11111
Chen, W., Kang, L. H., and Wang, D. (2006). The Coupling Relationship between Summer Rainfall in China and Global Sea Surface Temperature. Clim. Environ. Res. 11, 259–269. (in Chinese). doi:10.3878/j.issn.1006-9585.2006.03.02
Chen, W., Feng, J., and Wu, R. (2013). Roles of ENSO and PDO in the Link of the East Asian Winter Monsoon to the Following Summer Monsoon. J. Clim. 26, 622–635. doi:10.1175/jcli-d-12-00021.1
Chen, J., Wen, Z., Wu, R., Chen, Z., and Zhao, P. (2015). Influences of Northward Propagating 25-90-day and Quasi-Biweekly Oscillations on Eastern China Summer Rainfall. Clim. Dyn. 45, 105–124. doi:10.1007/s00382-014-2334-y
Chen, W., Ding, S. Y., Feng, J., Chen, S. F., Xue, X., and Zhou, Q. (2018). Progress in the Study of Impacts of Different Types of ENSO on the East Asian Monsoon and Their Mechanisms. Chin. J. Atmos. Sci. 42, 640–655. (in Chinese). doi:10.3878/j.issn.1006-9895.1801.17248
Chen, W., Wang, L., Feng, J., Wen, Z., Ma, T., Yang, X., et al. (2019). Recent Progress in Studies of the Variabilities and Mechanisms of the East Asian Monsoon in a Changing Climate. Adv. Atmos. Sci. 36, 887–901. doi:10.1007/s00376-019-8230-y
Chen, Y., and Zhai, P. (2013). Persistent Extreme Precipitation Events in China during 1951-2010. Clim. Res. 57, 143–155. doi:10.3354/cr01171
Chen, Y., and Zhai, P. (2014a). Two Types of Typical Circulation Pattern for Persistent Extreme Precipitation in Central-Eastern China. Q.J.R. Meteorol. Soc. 140, 1467–1478. doi:10.1002/qj.2231
Chen, Y., and Zhai, P. (2014b). Precursor Circulation Features for Persistent Extreme Precipitation in Central-Eastern China. Weather Forecast. 29, 226–240. doi:10.1175/waf-d-13-00065.1
Chen, Y., and Zhai, P. (2015). Synoptic‐scale Precursors of the East Asia/Pacific Teleconnection Pattern Responsible for Persistent Extreme Precipitation in the Yangtze River Valley. Q.J.R. Meteorol. Soc. 141, 1389–1403. doi:10.1002/qj.2448
Chen, Y., and Zhai, P. (2016). Mechanisms for Concurrent Low-Latitude Circulation Anomalies Responsible for Persistent Extreme Precipitation in the Yangtze River Valley. Clim. Dyn. 47, 989–1006. doi:10.1007/s00382-015-2885-6
Dee, D. P., Uppala, S. M., Simmons, A. J., Berrisford, P., Poli, P., Kobayashi, S., et al. (2011). The ERA-Interim Reanalysis: Configuration and Performance of the Data Assimilation System. Q.J.R. Meteorol. Soc. 137, 553–597. doi:10.1002/qj.828
Ding, Y. H., Li, Y., Wang, Z. Y., Si, D., and Liu, Y. J. (2020). Interdecadal Variation of Afro-Asian Summer Monsoon: Coordinated Effects of AMO and PDO Oceanic Modes. Trans. Atmos. Sci. 43, 20–32. (in Chinese). doi:10.13878/j.cnki.dqkxxb.20191011007
Duchon, C. E. (1979). Lanczos Filtering in One and Two Dimensions. J. Appl. Meteor. 18, 1016–1022. doi:10.1175/1520-0450(1979)018<1016:lfioat>2.0.co;2
Feng, J., and Chen, W. (2014). Influence of the IOD on the Relationship between El Niño Modoki and the East Asian-Western North Pacific Summer Monsoon. Int. J. Climatol. 34, 1729–1736. doi:10.1002/joc.3790
Feng, J., Chen, W., Tam, C.-Y., and Zhou, W. (2010). Different Impacts of El Niño and El Niño Modoki on China Rainfall in the Decaying Phases. Int. J. Climatol. 31, 2091–2101. doi:10.1002/joc.2217
Ferranti, L., Palmer, T. N., Molteni, F., and Klinker, E. (1990). Tropical-extratropical Interaction Associated with the 30-60 Day Oscillation and its Impact on Medium and Extended Range Prediction. J. Atmos. Sci. 47, 2177–2199. doi:10.1175/1520-0469(1990)047<2177:teiawt>2.0.co;2
Fu, J. L., Ma, X. K., Chen, T., Zhang, F., Zhang, X. D., Sun, J., et al. (2017). Characteristics and Synoptic Mechanism of the July 2016 Extreme Precipitation Event in North China. Meteorol. Mon. 43, 528–539. (in Chinese). doi:10.7519/j.issn.1000-0526.2017.05.002
Galarneau, T. J., Hamill, T. M., Dole, R. M., and Perlwitz, J. (2012). A Multiscale Analysis of the Extreme Weather Events over Western Russia and Northern Pakistan during July 2010. Mon. Weather Rev. 140, 1639–1664. doi:10.1175/mwr-d-11-00191.1
Gao, J., Lin, H., You, L., and Chen, S. (2016). Monitoring Early-Flood Season Intraseasonal Oscillations and Persistent Heavy Rainfall in South Chinaflood Season Intraseasonal Oscillations and Persistent Heavy Rainfall in South China. Clim. Dyn. 47, 3845–3861. doi:10.1007/s00382-016-3045-3
Ge, Z. A., Chen, L., Li, T., and Wang, L. (2022). How Frequently Will the Persistent Heavy Rainfall over Middle and Lower Yangtze River Basin in Summer 2020 Happen under Global Warming? Adv. Atmos. Sci.[In press]. doi:10.1007/s00376-022-1351-8
Hao, L., He, L., Ma, N., Liang, S., and Xie, J. (2020). Relationship between Summer Precipitation in North China and Madden-Julian Oscillation during the Boreal Summer of 2018. Front. Earth Sci. 8, 269. doi:10.3389/feart.2020.00269
Hao, L. S., Xiang, L., and Zhou, X. W. (2015). The Quasi-Biweekly Oscillation of Daily Precipitation and Low-Frequency Circulation Characteristics over North China Plain in Summer. Plateau Meteorol. 34, 486–493. (in Chinese). doi:10.7522/j.issn.1000-0534.2014.00004
He, S. H., Gong, Z. Q., Ye, F., and Feng, G. L. (2017). Application of Complex Network Method to Summer Extreme Rainfall in East Asia. Acta Meteorlogica Sin. 75, 894–902. (in chinese). doi:10.11676/qxxb2017.061
Hersbach, H., Bell, B., Berrisford, P., Hirahara, S., Horányi, A., Muñoz‐Sabater, J., et al. (2020). The ERA5 Global Reanalysis. Q.J.R. Meteorol. Soc. 146, 1999–2049. doi:10.1002/qj.3803
Hsu, P.-C., Li, T., You, L., Gao, J., and Ren, H.-L. (2015). A Spatial-Temporal Projection Model for 10-30 Day Rainfall Forecast in South China. Clim. Dyn. 44, 1227–1244. doi:10.1007/s00382-014-2215-4
Huang, R. H., and Wu, Y. F. (1989). The Influence of ENSO on the Summer Climate Change in China and its Mechanism. Adv. Atmos. Sci. 6, 21–33. doi:10.1007/bf02656915
Huang, R., Zhou, L., and Chen, W. (2003). The Progresses of Recent Studies on the Variabilities of the East Asian Monsoon and Their Causes. Adv. Atmos. Sci. 20, 55–69. doi:10.1007/bf03342050
Ishii, M., Shouji, A., Sugimoto, S., and Matsumoto, T. (2005). Objective Analyses of Sea-Surface Temperature and Marine Meteorological Variables for the 20th Century Using ICOADS and the Kobe Collection. Int. J. Climatol. 25, 865–879. doi:10.1002/joc.1169
Jiang, Z., Song, J., Li, L., Chen, W., Wang, Z., and Wang, J. (2012). Extreme Climate Events in China: IPCC-AR4 Model Evaluation and Projection. Clim. Change 110, 385–401. doi:10.1007/s10584-011-0090-0
Jiang, Z., Li, W., Xu, J., and Li, L. (2015). Extreme Precipitation Indices over China in CMIP5 Models. Part I: Model Evaluation. J. Clim. 28, 8603–8619. doi:10.1175/jcli-d-15-0099.1
Jones, C., Waliser, D. E., Schemm, J.-K. E., and Lau, W. K. M. (2000). Prediction Skill of the Madden and Julian Oscillation in Dynamical Extended Range Forecasts. Clim. Dyn. 16, 273–289. doi:10.1007/s003820050327
Jones, C., Carvalho, L. M. V., Higgins, R. W., Waliser, D. E., and Schemm, J. K. E. (2003). A Statistical Forecast Model of Tropical Intraseasonal Convective Anomalies. J. Clim. 17, 2078–2095. doi:10.1175/1520-0442(2004)017<2078:asfmot>2.0.co;2
Kosaka, Y., and Nakamura, H. (2010). Mechanisms of Meridional Teleconnection Observed between a Summer Monsoon System and a Subtropical Anticyclone. Part I: the Pacific-Japan Pattern. J. Clim. 23, 5085–5108. doi:10.1175/2010jcli3413.1
Kosaka, Y., Xie, S.-P., and Nakamura, H. (2011). Dynamics of Interannual Variability in Summer Precipitation over East Asia*. J. Clim. 24, 5435–5453. doi:10.1175/2011jcli4099.1
Lau, W. K. M., and Kim, K.-M. (2012). The 2010 Pakistan Flood and Russian Heat Wave: Teleconnection of Hydrometeorological Extremesflood and Russian Heat Wave: Teleconnection of Hydrometeorological Extremes. J. Hydrometeorol. 13, 392–403. doi:10.1175/jhm-d-11-016.1
Li, J. Y., and Mao, J. Y. (2019). Impact of the Boreal Summer 30-60-day Intraseasonal Oscillation over the Asian Summer Monsoon Region on Persistent Extreme Rainfall over Eastern China. Chin. J. Atmos. Sci. 43, 796–812. (in Chinese). doi:10.3878/j.issn.1006-9895.1809.18145
Li, T., and Wang, B. (2005). A Review on the Western North Pacific Monsoon: Synoptic-to-Interannual Variabilities. Terr. Atmos. Ocean. Sci. 16, 285–314. doi:10.3319/TAO.2005.16.2.285(A)
Li, W., Jiang, Z., Xu, J., and Li, L. (2016). Extreme Precipitation Indices over China in CMIP5 Models. Part II: Probabilistic Projection. J. Clim. 29, 8989–9004. doi:10.1175/jcli-d-16-0377.1
Liu, Y., Wang, L., Zhou, W., and Chen, W. (2014). Three Eurasian Teleconnection Patterns: Spatial Structures, Temporal Variability, and Associated Winter Climate Anomalies. Clim. Dyn. 42, 2817–2839. doi:10.1007/s00382-014-2163-z
Lin, A. L., Ji, Z. P., Gu, D. J., Li, C. H., Zhen, B., and He, C. (2016). Application of Atmospheric Intraseasonal Oscillation in Precipitation Forecast over South china. J. Trop. Meteorology 32, 878–889. (in Chinese). doi:10.16032/j.issn.1004-4965.2016.06.009
Lin, A. L., Gu, D. J., Peng, D. D., Zhen, B., and Li, C. H. (2020). A Definition Index Reflecting Large-Scale Characteristics of Regional Persistent Heavy Rainfall Events. J. Trop. Meteorology 36, 1–10. (in Chinese). doi:10.16032/j.issn.1004-4965.2016.06.009
Ogi, M., Tachibana, Y., and Yamazaki, K. (2003). Impact of the Wintertime North Atlantic Oscillation (NAO) on the Summertime Atmospheric Circulation. Geophys. Res. Lett. 30, 1704. doi:10.1029/2003gl017280
Orsolini, Y. J., Zhang, L., Peters, D. H. W., Fraedrich, K., Zhu, X., Schneidereit, A., et al. (2015). Extreme Precipitation Events over North China in August 2010 and Their Link to Eastward‐propagating Wave‐trains across Eurasia: Observations and Monthly Forecasting. Q.J.R. Meteorol. Soc. 141, 3097–3105. doi:10.1002/qj.2594
Si, D., and Ding, Y. (2016). Oceanic Forcings of the Interdecadal Variability in East Asian Summer Rainfall. J. Clim. 29, 7633–7649. doi:10.1175/jcli-d-15-0792.1
Sun, X. G., Jiang, G. X., Ren, X. J., and Yang, X. Q. (2016). Role of Intraseasonal Oscillation in the Persistent Extreme Precipitation over the Yangtze River Basin during June 1998. J. Geophys. Res. Atmos. 121, 10453–10469. doi:10.1002/2016JD02507710.1002/2016jd025077
Sung, M.-K., Kwon, W.-T., Baek, H.-J., Boo, K.-O., Lim, G.-H., and Kug, J.-S. (2006). A Possible Impact of the North Atlantic Oscillation on the East Asian Summer Monsoon Precipitation. Geophys. Res. Lett. 33, L21713. doi:10.1029/2006gl027253
Tang, Y., Gan, J., Zhao, L., and Gao, K. (2006). On the Climatology of Persistent Heavy Rainfall Events in China. Adv. Atmos. Sci. 23, 678–692. doi:10.1007/s00376-006-0678-x
Wallace, J. M., and Gutzler, D. S. (1981). Teleconnection in the Geopotential Height Field during the Northern Hemisphere Winter. Mon. Weather Rev. 109, 748–812. doi:10.1175/1520-0493(1981)109<0784:titghf>2.0.co;2
Wang, L., Wang, C., and Guo, D. (2018). Evolution Mechanism of Synoptic-Scale EAP Teleconnection Pattern and its Relationship to Summer Precipitation in China. Atmos. Res. 214, 150–162. doi:10.1016/j.atmosres.2018.07.023
Yang, G. J. (1992). The Characteristics of Low Frequency Oscillation about Rainfall and Wind Distribution over Eastern China. Chin. J. Atmos. Sci. 16, 103–110. (in chinese). doi:10.1016/0275-1062(92)90017-6
Yang, R. W., Tao, Y., and Cao, J. (2010a). A Mechanism for the Interannual Variation of the Early Summer East Asia-Pacific Teleconnection Wave Train. Acta Meteorol. Sin. 24, 452–458.
Yang, J., Wang, B., Wang, B., and Bao, Q. (2010b). Biweekly and 21-30-day Variations of the Subtropical Summer Monsoon Rainfall over the Lower Reach of the Yangtze River Basin. J. Clim. 23, 1146–1159. doi:10.1175/2009JCLI3005.1
Yao, R., and Ren, X. (2019). Decadal and Interannual Variability of Persistent Heavy Rainfall Events over the Middle and Lower Reaches of the Yangtze River Valley. J. Meteorol. Res. 33, 1031–1043. doi:10.1007/s13351-019-9070-5
Yu, R., and Zhai, P. M. (2018). The Influence of El Niño on Summer Persistent Precipitation Structure in the Middle and Lower Reaches of the Yangtze River and its Possible Mechanism. Acta Meteorol. Sina 76, 408–419. (in chinese). doi:10.11676/qxxb2018.012
Zhai, P. M., Ni, Y. Q., and Chen, Y. (2013). Mechanism and Forecasting Method of Persistent Extreme Weather Events: Review and Prospect. Adv. Earth Sci. 28, 1177–1188. (in chinese).
Zhai, P. M., Li, L., Zhou, B. Q., and Chen, Y. (2016). Progress on Mechanism and Prediction Methods for Persistent Extreme Precipitation in the Yangtze-Huai River Valley. J. Appl. Meteorological Sci. 27, 631–640. (in chinese). doi:10.11898/1001-7313.20160511
Zhang, D. Q., Zheng, Z. H., Chen, L. J., and Zhang, P. Q. (2019a). Advances on the Predictability and Prediction Methods of 10-30d Extended Range Forecast. J. Appl. Meteorological Sci. 30, 416–430. (in chinese). doi:10.11898/1001-7313.2019040310.1016/j.cclet.2019.08.035
Zhang, J., Zhou, Y. S., Shen, X. Y., and Li, X. F. (2019b). Evolution of Dynamic and Thermal Structure and Instability Condition Analysis of the Extreme Precipitation System in Beijing-Tianjin-Hebei on July 19 2016. Chin. J. Atmos. Sci. 43, 930–942. (in chinese). doi:10.3878/j.issn.1006-9895.1812.18231
Zhang, W. L., and Cui, X. P. (2012). Main Progress of Torrential Rain Researches in North China during the Past 50 Years. Torrential Rain Disasters 31, 384–391. (in chinese). doi:10.3969/j.issn.1004-9045.2012.04.014
Zhang, Z., Sun, X., and Yang, X.-Q. (2018). Understanding the Interdecadal Variability of East Asian Summer Monsoon Precipitation: Joint Influence of Three Oceanic Signals. J. Clim. 31, 5485–5506. doi:10.1175/JCLI-D-17-0657.1
Zhao, S. Y., Chen, L. J., and Cui, T. (2017). Effects of ENSO Phase-Switching on Rainy-Season Precipitation in North China. Chin. J. Atmos. Sci. 41, 857–868. (in chinese). doi:10.3878/j.issn.1006-9895.1701.16226
Zhou, B., and Zhai, P. (2016). A New Forecast Model Based on the Analog Method for Persistent Extreme Precipitation. Weather Forecast. 31, 1325–1341. doi:10.1175/WAF-D-15-0174.1
Zhou, N. F., Kang, Z. M., and Lai, F. F. (2014). The Low Frequency Characteristics of Precipitation and its Circulation over North China in Summer 2012. Meteorol. Mon. 40, 1106–1113. (in chinese). doi:10.7519/j.issn.1000-0526.2014.09.008
Zhou, X., Sun, J. S., Zhang, L. N., Chen, G. J., Cao, J., and Ji, B. (2020). Classification Characteristics of Continuous Extreme Rainfall Events in North China. Acta Meteorol. Sin. 78, 761–777. (in chinese). doi:10.11676/qxxb2020.052
Zhu, Z., and Li, T. (2017). The Statistical Extended-Range (10-30-day) Forecast of Summer Rainfall Anomalies over the Entire China. Clim. Dyn. 48, 209–224. doi:10.1007/s00382-016-3070-2
Keywords: multiscale influences, persistent extreme precipitation events, low-frequency oscillations, atmospheric circulation anomalies, zonal wave train, meridional wave train
Citation: Guan X, Gao J, Li T, Wang L and Chen X (2022) Multiscale Influences on Persistent Extreme Precipitation Events in North China. Front. Earth Sci. 10:893152. doi: 10.3389/feart.2022.893152
Received: 10 March 2022; Accepted: 26 April 2022;
Published: 30 May 2022.
Edited by:
Wei Zhang, Utah State University, United StatesReviewed by:
Gen Li, Hohai University, ChinaHuopo Chen, Institute of Atmospheric Physics(CAS), China
Jianqi Sun, Institute of Atmospheric Physics(CAS), China
Copyright © 2022 Guan, Gao, Li, Wang and Chen. This is an open-access article distributed under the terms of the Creative Commons Attribution License (CC BY). The use, distribution or reproduction in other forums is permitted, provided the original author(s) and the copyright owner(s) are credited and that the original publication in this journal is cited, in accordance with accepted academic practice. No use, distribution or reproduction is permitted which does not comply with these terms.
*Correspondence: Jianyun Gao, ZnpnYW9qeXVuQDE2My5jb20=
 Xiaojun Guan
 Jianyun Gao
 Tim Li
 Lan Wang1
 Xiaoxiao Chen