 Jin Wu1,2
 Hao Xu
95% of researchers rate our articles as excellent or good
Learn more about the work of our research integrity team to safeguard the quality of each article we publish.
Find out more
ORIGINAL RESEARCH article
Front. Earth Sci. , 12 April 2022
Sec. Structural Geology and Tectonics
Volume 10 - 2022 | https://doi.org/10.3389/feart.2022.889067
This article is part of the Research Topic Quantitative Characterization and Engineering Application of Pores and Fractures of Different Scales in Unconventional Reservoirs View all 24 articles
Pore and pore network evolution of shale is critical for the evaluation the pore system in shale gas reservoirs. Thermal maturation effect acts as an indispensable role in porosity evolution. In this paper, high-temperature and high-pressure in-situ thermal simulation experiments were conducted to investigate the process and controlling factors of pore evolution in marine-continental transitional shale. Multiple methods, including scanning electron microscopy (SEM), X-ray diffraction, helium porosimetry and low-pressure N2 and CO2 adsorption were used to investigate the evolution of mineral composition and pore structure at different stages of thermal maturity. The results showed that type III organic matter (OM) generated petroleum with the thermal maturity increasing. The total organic carbon (TOC) decreased by 13.3% when temperature reached 607°C. At the same time, it produced numerous organic and mineral pores during hydrocarbon generation. Besides, some changes in mineral composition have occurred, especially in illite (from 11% to 31%) and kaolinite (from 89% to 69%). In general, it can divide into 3 stages (maturity, high maturity and over maturity) for shale pore system evolution with the thermal maturity increasing. In the low maturity period, large amounts of pyrolytic bitumen and oil generated to fill the pores, causing the pore system to diminish; in the high maturity period, a large number of pores were generated when oil is cracked into gas, resulting in a rapid expansion of the pore system; in the over-maturity period, the cracking of pyrolysis and hydrocarbon slowed down, allowing the pore system to stabilize. Shale pore evolution is primarily controlled by the thermal evolution of OM, and the conversion of inorganic minerals contributes less to pore evolution compared to organic matter. The high maturity period (1.2% < Ro < 2.0%) was the period when extensive pyrolysis and hydrocarbon generated in the Shanxi Formation shale, which contributed mostly for the pores generation and accumulation of shale gas.
Marine, marine-continental transitional, and continental shales are widely distributed in China, and contributed 15% of the total natural gas production (Zou et al., 2019). Recently, marine shale is already being effectively developed in Sichuan Basin, with annual production of 200 × 108 m3 in 2020.And many researches on shale pore system evolution and shale gas accumulation in marine shales have been systematic analyzed (Liu Y. et al., 2020; Xu et al., 2020). Marine-continental transitional shale gas, which accounts for about a quarter of total stock of shale gas, represents a new strategic substitute resource for the China’s natural gas industry (Bhatti et al., 2020; Chen et al., 2020; Abouzar and Ghanbarian., 2021; Gao, 2021; Guo et al., 2021; Wu et al., 2021). And the unconventional resource in upper Paleozoic Carboniferous-Permian units in the Ordos Basin is rich (Yin et al., 2020). However, researchers pay small attention to the marine-continental transitional shale. There are few works for Permian Shanxi Formation shale and the enrichment mechanism of this type of shale are still unknown.
The pore system is very complex and many factors may influence the pores generation and evolution, such as total organic content, thermal maturity, maceral type, overburden/tectonic compaction (Chen and Xiao, 2014; Zargari et al., 2015; Ko et al., 2016; Liu Y. et al., 2020; Liu et al., 2020b; Dong et al., 2020; Hower and Groppo., 2021; Wang and Wang., 2021; Xue et al., 2021). Apart from the diagenetic process, the hydrocarbon generation of OM also constitutes a key influencing factor for shale pore evolution (Jarvie et al., 2007; Zhang et al., 2020; Hou et al., 2022). For the marine-continental transitional shale, the OM mostly comes from terrestrial higher plants and the type of OM is type III (Qiu et al., 2021). In the recent research of the typical marine-continental transitional shales such as Permian Longtan Formation, some researchers concluded that almost no pore developed in type III OM (Jiang et al., 2017; Li et al., 2020; Zhao W et al., 2020). Some others discovered that some type III OM contains hydrocarbon-generating gas pores, but these pores were inhomogeneous (Liu et al., 2020c; Kuang et al., 2020; Qie et al., 2021). Some researchers also hold different opinions toward the pore development degree of type III OM. Some believed that vitrinite tends to have poor pore development (Dong et al., 2015); and some previous researchers reported that large numbers of micropores smaller than 2 nm were observed in vitrinite (Mastalerz et al., 2013). Obviously, the pore system of type III OM is insufficiently understood, especially the pore evolution inside OM.
Thermal simulation experiment of hydrocarbon generation is one of the most important way to investigate source rocks and evaluate shale gas reservoirs (He et al., 2020; Santosh and Feng., 2020; Wang et al., 2020). Thermal simulation experiment can be used to examine the hydrocarbon dynamics during hydrocarbon generation-expulsion of source rocks, and now it has also been frequently used to investigate the pore dynamics in shale reservoirs (Shi et al., 2018; Wang et al., 2021; Zhang et al., 2021; Zhao et al., 2021). Through extensive thermal evolution simulation on low maturity shale, previous researchers have demonstrated that maturity is the main controlling factor for the development of organic pores in shale (Klaver et al., 2012; Löhr et al., 2015; Zargari et al., 2015; Sun et al., 2021). Besides, the shale inhomogeneity, experiment development degree, and water-bearing condition also have some impacts on the development degree of organic pores in shale (Sun et al., 2015; Li and Li., 2021; Zhang et al., 2022). In addition, due to the limitations of design purpose, sample selection and experimental equipment, it is difficult to match the simulation evolution stage and experimental conditions with the real underground conditions. However, previous researchers have tried to investigate the shale diagenetic history and organic pore evolution in different ways. Dong et al. (2015) controlled the simulation temperature by assuming a short action and without considering the effect of formation pressure, and the porosity after experiments could be a little larger than that of the real geological sample. Chen and Xiao performed an anhydrous pyrolysis experiment on three low maturity shale samples with different kerogen types or TOC contents at a wide range of temperatures and applied N2 adsorption, CO2 adsorption to characterize the micro-nano pore systems. (Chen and Xiao, 2014). Ji et al. (2017). designed high-temperature and high-pressure simulation experiments for constant temperature and constant pressure, respectively, to explore how temperature and pressure control shale pore evolution. The results showed that large numbers of micropores can form in OM, pyrite, and dolomite matrices.
Identifying the process and controlling factors of pore evolution is the basis for understanding the genesis and enrichment mechanism of shale gas (Cavelan et al., 2020). However, there are still few researches on pore structure evolution for marine-continental transitional shale. So in this paper, the Shanxi Formation shales were collected to conduct the thermal simulation experiment to analysis the pore evolution and shale gas accumulation. High-temperature, high-pressure thermal simulation experiments were performed on low maturity marine-continental transitional shale from Ordos Basin. And the pore system of shale samples were characterized before and after simulation, respectively. Besides, the rock pyrolysis, X-ray diffraction (XRD), and gas adsorption results were quantitatively compared to explore the process and controlling factors of pore evolution. The findings could provide some clues for examining the enrichment mechanism of marine-continental transitional shale gas.
In this paper, dozens of marine-continental transitional shale samples were collected from Permian Shanxi Formation shale across the Palougou section in Baode, Ordos Basin (Figure 1). The shale samples from Permian Shanxi Formation are a typical marine-continental transitional shale. The selected shale samples were cut into several similar groups to conduct the thermal simulation experiments. Multiple techniques were used in this paper, XRD and SEM were used to obtain microscopic petrological and mineralogy characteristics; Rock-Eval and vitrinite reflectance analysis were used to get the geochemical characteristics of the shales; and SEM, low pressure N2 and CO2 adsorption were conducted to obtain the pore structure of the shale.
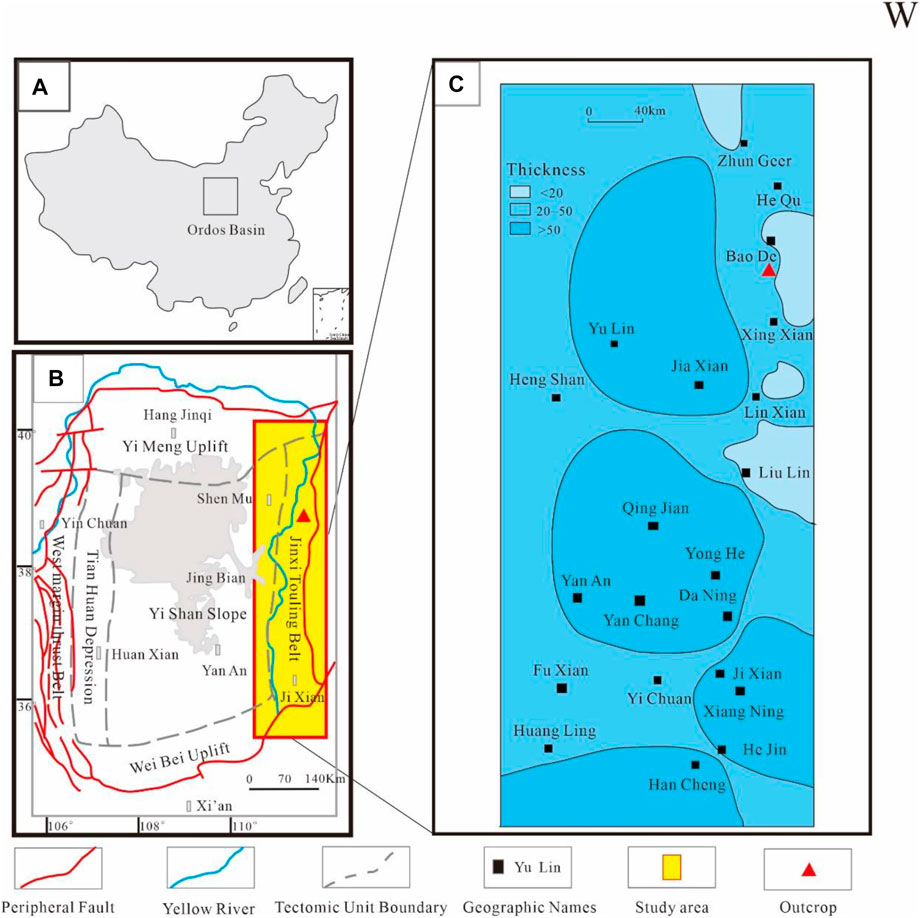
FIGURE 1. (A) Locations of the Ordos Basin. (B) Sketch map of Ordos Basin, the study area, and gas resource distribution. (C) Thickness distribution of Shanxi Formation shale and well location.
TOC, rock-Eval and XRD analyses were completed at the Key Laboratory of Petroleum Geochemistry of CNPC, using a LECCO CS230 carbon-sulfur analyzer and Rigaku TTR III automatic X-ray diffractometer. Low-temperature CO2 and N2 adsorption experiments were completed at Beijing Center for Physical & Chemical Analysis, using an Autosorb-IQ-MP specific surface and porosity analyzer. The test pore size interval was 0.35–200 nm. Pore structure parameters were calculated with Dubinin-Radushkevich (DR) model and Barrett-Johner-Halenda (BJH) model. All experiments were run in strict accordance with the national and industry specifications for experiment.
Thermal simulation experiment was carried out at the Key Laboratory of Oil and Gas Reservoir of CNPC, using a diagenesis physical simulation system. Closed system thermal simulation method was applied. The experiment was completed in a split reactor system. The temperature of each reactor can be separately controlled by the program set on the computer. The maximum experiment temperature was 550°C; the maximum static rock pressure was 275 MPa. The main body of the instrument is an autoclave that contains the massive samples needed for simulation. The autoclave cavity is 2 cm in diameter and 40 cm deep. Two-dimensional FE-SEM images of the samples before and after simulation was completed with an Apreo dual-probe low vacuum FE-SEM. The experiment procedure was as follows: 1) The sample was divided into four parallel samples, which were separately prepared into four FE-SEM samples and four 100-mesh powder samples; 2) FE-SEM imagery characterization was performed on the four SEM samples to obtain pore structure information of the original samples; 3) The four samples were separately placed into four reactors, the desired simulation temperatures were set, the experiment pressure was set to 60 MPa, the temperature increase rate was set to 20°C/h; 4) The four samples after thermal simulation were taken out, naturally cooled after 8 h of constant temperature, before.
FE-SEM imagery characterization was performed at the same position as in step (2) to obtain their pore structure information under the simulation temperature; (5) The four powder samples were placed into four respective reactors and thermally treated at the same temperature point as set in step (3); (6) Organic geochemical, XRD, and gas adsorption analyses were performed on the thermally treated powder samples.
Thermal decomposition experiment was carried out with a synchronous thermal analyzer, using air as the reaction gas. High-purity N2 was injected as the protective gas. The sample was heated at the temperature increase rate of 10°C/min to obtain its DG curve from normal temperature to 1,000°C (Figure 2). Thermal gravimetric analysis was proceeded in two stages: from normal temperature to 308°C, the mass of the sample reduced from 255.72 to 253.91 g, with weight loss rate of 0.71%; from 308 to 600°C, the mass of the sample reduced from 253.91 to 172.05 g, with weight loss rate of 32%. The experiment result indicated that the OM thermal decomposition temperature of Shanxi Formation shale is between 308 and 600°C, with maximum DTG corresponding to approximately 550°C. The Ro of the original sample is 0.78%. The four temperature points set for the simulation were: 400°C, 450°C, 500°C, and 550°C; the corresponding Ro levels were approximately 1.0%–1.2%, 1.4%–1.6%, 1.8%–2.0%, and 2.2%–2.5%. It can be classified into three evolution stages according to the different Ro size: low maturity, high maturity and high over-maturity stage.
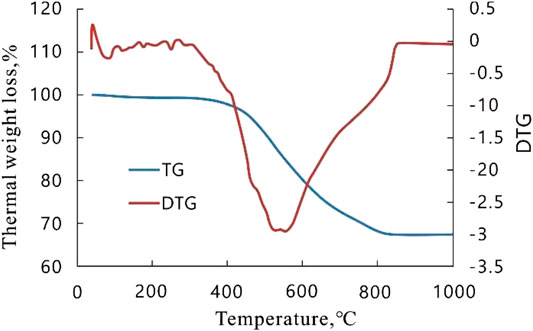
FIGURE 2. Thermal gravimetry (TG) and differential thermal gravimetry (DTG) curves of the samples.
The marine-continental transitional shale in the Shanxi Formation has been cut and preserved as 5 samples with the same characteristics. The original shale samples were selected from the original samples of organic geochemistry, petrology and mineralogy, and then thermal simulation experiments were performed on the remaining 4 shale samples. Geochemical parameters, mineral composition and gas adsorption experimental results of the original samples and thermal simulation experimental samples at different temperatures were shown in Table 1. It can be obtained from the data: original shale vitrinite reflectance (Ro) = 0.78%, total organic carbon (TOC) = 19.47%, free hydrocarbon content = 1.7 mg/g, pyrolysis hydrocarbon content = 60.46 mg/g, the maximum Pyrolysis peak temperature = 436°C. According to the analysis of microscopic components, the types of OM were mainly chitinite and vitrinite, and the type of kerogen is type III; the mineral components were mainly clay minerals and quartz, with a small amount of feldspar; the clay minerals were mainly kaolinite, Illite content is less (Table 1).
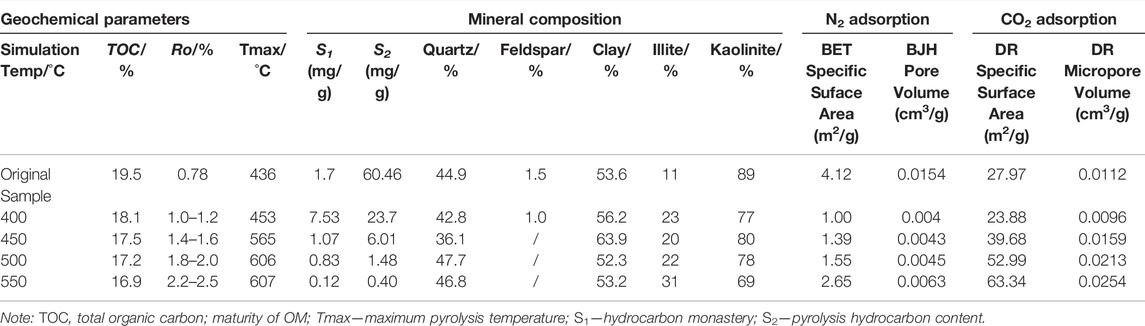
TABLE 1. Shale sample parameters under different simulation temperatures.
A small amount of clay mineral interlayer pores, organic pores, dissolution pores and micro-fractures developed in the original samples. The observation results of nearly 500 observation layers show that with the increase of thermal simulation temperature, the pore system of the sample first decreases and then increases (Figure 3). Using FE-SEM observation, it was found that some microcracks appeared in the sample at 400°C (Figure 3B), but the OM had melted, the surface softened and folded, and the oil spilled out of the pyrolyzed asphalt, which was an intermediate product of the pyrolysis of the OM (Figure 3C). The pyrolyzed bitumen is highly plastic and can fill the original pores, resulting in a reduced pore system (Figure 3F). From 450 to 500°C, the liquid hydrocarbon products produced in the early stage were continuously consumed by secondary pyrolysis, resulting in the formation of organic pores or the expansion of the original organic pores, and the organic micro-cracks also continue to be generated or expanded (Figures 3G–N). Besides, some bar OM (ligneous OM) also begins to generate large numbers of singular organic pores. These circular or elliptical pores spread in a dispersed manner, generally smaller than 20 nm in size (Figures 3O,P).
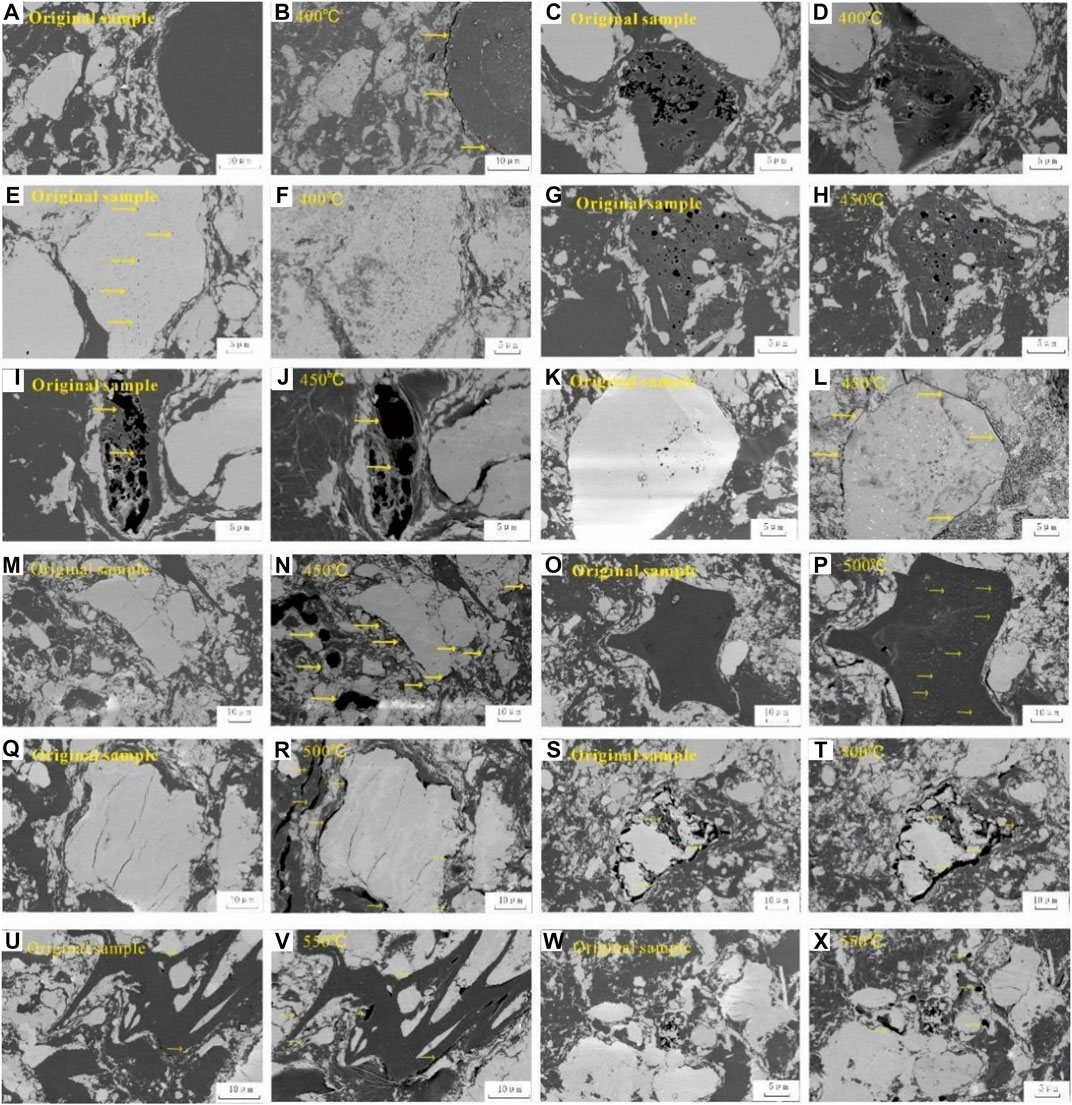
FIGURE 3. Evolution of OM and inorganic minerals under different temperatures. (A) Original sample, where no pore was developed; (B) 400°C simulation sample, where microfactures appeared on the edge of OM and minerals; (C) Original sample, a few biogenic air pores were developed; (D) 400°C simulation sample, OM melted to produce pyrolytic bitumen that fills the original pores; (E) A few original pores developed in the inorganic minerals; (F) 400°C simulation sample, where the original pores were filled; (G) OM pores were developed in the original sample; (H) 450°C simulation sample, micropores emerged; (I) OM pores developed in the original sample; (J) 450°C simulation sample, the OM pores enlarged; (K) Very few microfractures emerged on the edge of minerals in the original sample; (L) 450°C simulation sample, the microfractures on the edge of minerals increased and broadened; (M) No pore developed in the original sample; (N) 450°C simulation sample, OM pores and fractures developed; (O) Original sample, pores were not developed on the edge of massive OM; (P) 500°C simulation sample, large numbers of singular pores emerged in the OM; (Q) A few inorganic mineral pores and fractures developed in the original sample; (R) 500°C simulation sample, where inorganic mineral pores and fractures have not changed visibly, large numbers of pores and fractures emerged inside the OM; (S) Intergranular pores and fractures developed in the OM and inorganic minerals in the original sample; (T) 500°C simulation sample, where the intergranular pores and fractures increased and enlarged; (U) No pore developed in the original sample; (V) 550°C simulation sample, OM pores and fractures are developed; (W) A few OM pores were present in the original sample; (X) 550°C simulation sample, OM increased and enlarged.
For samples at 550°C, organic pores and micro-cracks continued to increase, but the increase was smaller (Figures 3U–X). Although micro-fractures were likely to appear at the edges of inorganic minerals and OM, the inorganic mineral pores and fractures have little change before and after the thermal simulation experiment (Figures 3I,R,T).
Low-temperature CO2 adsorption and low-temperature N2 adsorption experiments were carried out to quantitatively compare the structural characteristics of micro-pores (d < 2 nm) and mesopores (2 nm < d < 50 nm) in the samples before and after thermal simulation experiments. The experimental results show that with the increase of the temperature of the thermal simulation experiment, the structural parameters of the micropores and mesopores show a trend of first decreasing and then increasing. The BET mesopore specific surface area first decreased from 4.12 m2/g of the original sample to 1.0 m2/g (400°C), and then increased to 1.3 m2/g (450°C), 1.55 m2/g (500°C) and 2.65 m2/g (550°C). Correspondingly, the BJH mesopore volume first decreased from 0.0154 cm3/g in the original sample to 0.004 cm3/g (400°C), and then increased to 0.0043 cm3/g (450°C), 0.0045 cm3/g (500°C) and 0.0063 cm3/g (550°C) (Table 1). Similarly, the specific surface area of DR micro-pores first decreased from 27.97 m2/g of the original sample to 23.88 m2/g (400°C), and then increased to 39.68 m2/g (450°C), 52.99 m2/g (500°C) and 63.34 m2/g (550°C). In addition, the volume of DR micro-pores decreased from 0.0112 cm3/g of the original sample to 0.0096 cm3/g (400°C), and then increased to 0.0159 cm3/g (450°C), 0.0213 cm3/g (500°C), and 0.0254 cm3/g (550°C) (Table 1). It can be obtained from the experimental data that the higher the temperature of the thermal simulation experiment, the higher the degree of micro-pore development of the sample. For example, under the temperature condition of 550°C, the micro-porous structure parameters of the samples are more than twice that of the original samples.
Figure 4 showed the comparison of low-temperature CO2 adsorption isotherms of samples at different temperatures. As can be seen from the figure, under the temperature condition of 400°C, the adsorption capacity of the sample is the smallest, even lower than that of the original sample. After that, with the increase of the temperature of the thermal simulation experiment, the adsorption amount of the sample also began to increase, and reached the highest level at 550°C. The size distribution of the DFT micropores (Figure 5) also supports this observation. But it is worth noting that, compared with the original samples, two new peaks at 0.55 and 0.65 nm appeared in the pore size distribution of the samples at 450°C, 500°C and 550°C, which indicated that during the thermal evolution, the new micro Pore diameters may appear between 0.5 and 0.7 nm.
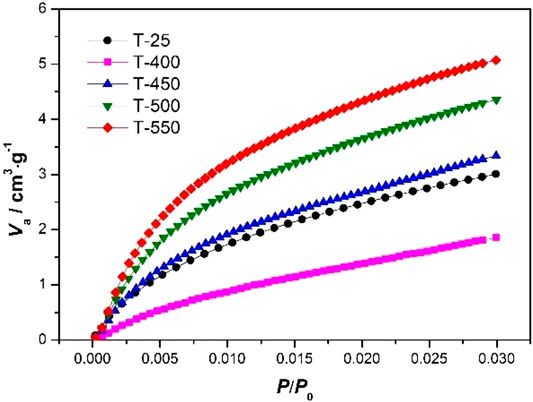
FIGURE 4. Low-temperature CO2 adsorption isotherms of the samples at different temperatures.
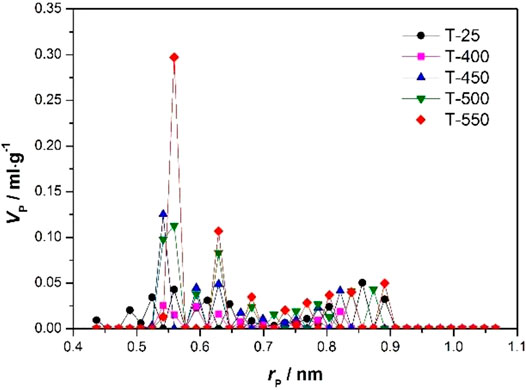
FIGURE 5. Pore size distribution of micro-pores in the samples at different temperature points.
Figures 6, 7 show the low-temperature N2 adsorption curves and mesopore distributions of the samples under different temperature conditions. It can be seen that the N2 adsorption-desorption curve of the original sample is similar to the H3 curve under the IUPAC classification. With the increase of relative pressure, the adsorption curve rises slowly; when approaching the saturated vapor pressure, the adsorption curve rises sharply and the desorptioncurve falls sharply due to capillary condensation. This experimental phenomenon indicated that there were groove pores around. The N2 adsorption-desorption curves of the thermal simulation samples were similar to the H4 curve, and also show some characteristics of the H3 curve. The adsorption-desorption loop was narrow. As the relative pressure increased, the adsorption curve firstly rose slowly. And then the curve became a steep rise due to capillary coalescence when the pressure near the saturation vapour pressure. The desorption curve dropped fast, which indicating the existence of slit pores and slot pores open on four sides. With the increase of the temperature of the thermal simulation experiment, the mesopores and micropores changed from mainly slot pores to coexistence of slit pores and slot pores.
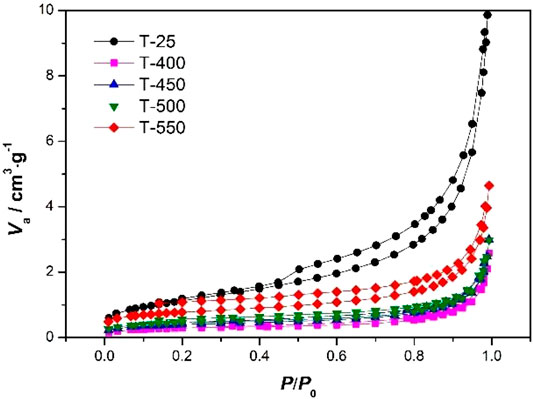
FIGURE 6. Low-temperature N2 adsorption curves of the samples at different temperature points.
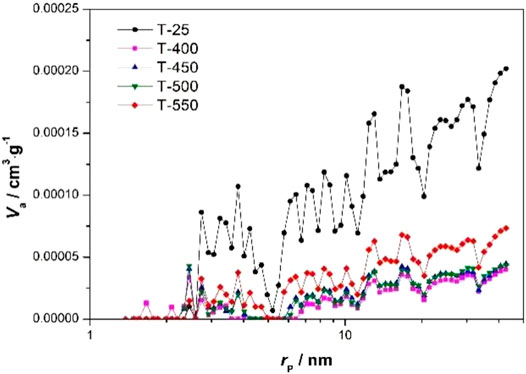
FIGURE 7. Pore size distribution of mesopores in the samples at different temperature points.
The mesoporous structure parameters of the thermal simulation experimental samples are significantly smaller than those of the original samples. From 400 to 550°C, the structural parameters increased, but were still smaller than the original samples. The BET specific surface area decreased from 4.12 m2/g of the original sample to 1.0 m2/g (400°C), then increased to 1.39 m2/g (450°C), 1.55 m2/g (500°C) and 2.65 m2/g (550°C). The BJH mesopore volume reduces from 0.015 cm3/g for the original sample to 0.004 cm2/g, then increases to 0.0043 cm3/g (450 °C), 0.0045 cm3/g (500°C), and 0.0063 cm3/g (550°C).
Previous researchers have found that nanopores were related to the petroleum generation and OM reshape through heating experiments and SEM observation (Ko et al., 2016). Similar to previous pyrolysis experiments on type I kerogen, the results of thermal simulation experiments for type Ⅲ kerogen showed that porosity were associated with the stages of OM. From the observation for the shale samples during the process of the artificial heating experiments, it is found that there were distinct changes for shale pores during the thermal evolution, so the shale evolution process can divide into four stages as follows (Figure 8):
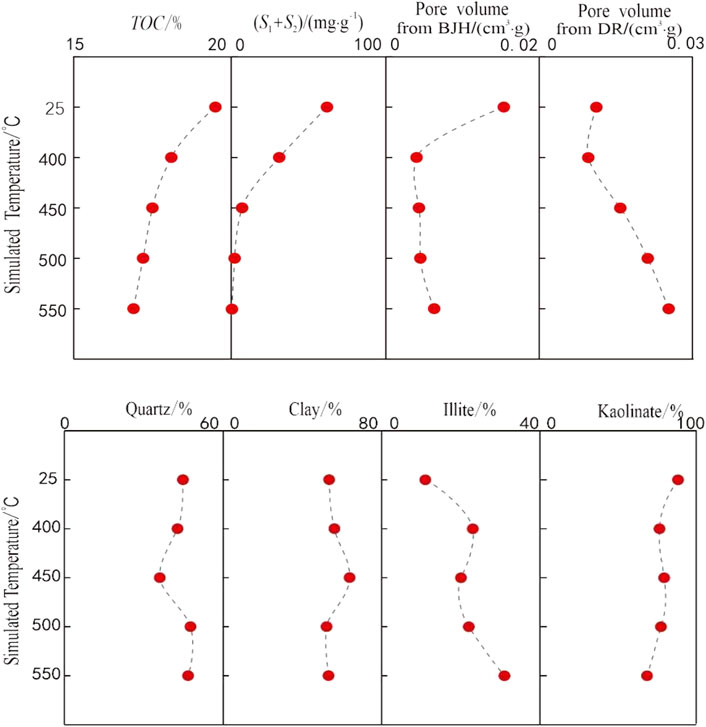
FIGURE 8. Parameters variation trend for the simulated samples at different temperatures.
Stage 1 (1.0% < Ro < 1.2%),the maturity stage. It is corresponding to the simulated temperature of 400°C. The porosity decreased rapidly in this stage. During this period, the pyrolysis of OM produced a large amount of pyrolysis asphalt, the TOC decreased and the hydrocarbon generation capacity (S1+S2) decreased from 62.16 mg/g to 31.23 mg/g. Micro-pores and micro-cracks appeared in the interior or edges of OM. Most of these new pores were observed to be mainly slit pores. In addition, the high plasticity hot asphalt filled the pores in a large area, resulting in a sharp reduction of the pore system, especially the mesopores.
Stage 2 (1.2% < Ro < 2.0%), the high maturity stage, the corresponding simulated temperature was 400–500°C. The pore system developed rapidly in the stage. During this period, the pyrolysis of OM produced a large amount of gaseous hydrocarbons, and the (S1+S2) level decreased from 31.23 mg/g to 2.31 mg/g. The formation of a large number of organic pores resulted that the pore system expanded rapidly. Additionally, a large amount of organic acid also produced when OM generated hydrocarbons. It leaded to the transformation of feldspar minerals and many dissolution pores were observed. High temperature and pressure conditions in this stage stimulated the transformation of clay minerals such as kaolinite and illite as well, which leading to an increment of the inorganic mineral pore system. So both organic and inorganic pores increased rapidly in this stage. In the late of this period (2.0% < Ro < 2.5%), it is also in the high maturity stage, while the formation of new pores speeded down. The corresponding simulated temperature is around 550°C. During this period, OM contents continued to decrease, with (S1+S2) levels dropping from 2.31 mg/g to 0.52 mg/g. The organic minerals tended to stabilize, the conversion rate decreased. The pore space contribution from this period to whole porosity was much smaller than last period.
Stage 3 (Ro > 2.5%), over-mature stage. And the pore system was trend to stable. At this period, (S1+S2) level was 0.52 mg/g, a small amount of OM was pyrolyzed and a small amount of organic pores were generated. At this time, the rock was in the late diagenetic stage and had good compression resistance and stability. Mineral particles and OM particles existed alternately to form an interconnected organic-inorganic pore network system, which kept the entire pore system relatively stable.
In conclusion, the whole process of porosity evolution during the thermal simulation was roughly divided into 3 stages (maturity, high maturity and over maturity) as the thermal maturity increases. The porosity first decreased, then increased, and finally stabilized. The high maturity period (1.2 %< Ro<2.0%) was the period when extensive hydrocarbon generated in the Shanxi Formation shale.
Summarily, the high maturity period (1.2% < Ro < 2.0%) is the period of OM maturity. At this time, the shale of the Shanxi Formation was extensively pyrolyzed to generate hydrocarbons, and the pore system was greatly expanded. This period is the best period for pore evolution.
Hydrocarbon generation and diagenesis were key controlling factors for shale pore evolution (Cavelan et al., 2020; Liu et al., 2017; Zhao Z. et al., 2020). From the results of thermal simulation experiments: with the increase of simulated temperature, TOC decreased from 19.47% to 16.92%; (S1+S2) level decreased from 62.16 mg/g to 0.52 mg/g (Table 1; Figure 8). This indicated that strong pyrolysis hydrocarbon generation occurred in the OM. In our observations, maturity and OM type affect the pore system. In immature shale, organic pores were not developed; in mature shale, pores were mainly developed in OM. Therefore, maturity is a key factor affecting the development of shale pores (Sun et al., 2015). In shale samples, the pore system does not increase linearly with the increase of maturity, and secondly, it showed a trend of first decreasing and then increasing rapidly. Obviously, in the low maturity stage, the OM loses some pores; in the high maturity stage, a large number of pores regenerated. In the low maturity stage, a large amount of pyrolysis asphalt produced by the pyrolysis of OM fills the pores in a large area, resulting in a smaller pore system, and the volume of mesopores decreases from 0.0154 cm3/g to 0.004 cm3/g; the volume of micropores decreases from 0.0112 cm3/g to 0.0096 cm3/g. In the high over-maturity stage, OM undergoes structural rearrangement, pyrolysis cyclization, aromatization polycondensation or cross-linking to generate small molecular hydrocarbons, resulting in a large number of pores. The pyrolyzed bitumen produced in the early stage also began to undergo a second pyrolysis, resulting in a large number of organic pores and the rapid expansion of the pore system. Micropore volume increased from 0.0096 cm3/g to 0.0254 cm3/g; mesopore volume increased from 0.004 cm3/g to 0.0063 cm3/g. In addition, the type of organic pores changed with increasing maturity. The original sample is at an immature stage, affected by shallow biological processes, resulting in a small amount of biogas and a small number of slots. In the thermal simulation experimental samples, a large number of pores and cracks generated in the OM, and the pores were mainly slits.
The type of OM also plays a role in pore development. Compared with type I and type II kerogen, type III kerogen is more prone to a large number of micro-pores (Jia et al., 2020). The OM of our experimental samples is type III, and a large number of micro-pores and a small amount of mesopores were generated during the thermal simulation experiment, further confirming that type III OM has the potential to generate a large number of pores and cracks (Figure 3). In the high maturity stage (400–500°C), a large number of micro-pores were formed, and the pore volume increases from 0.0096 cm3/g to 0.0159 cm3/g, an increase of 1.2 times; a small amount of mesopores develops, and the pore volume increases from 0.004 cm3/g to 0.0045 cm3/g. In the high over-maturity period (500–550°C), a large number of mesopores were formed, and the pore volume increased from 0.0045 cm3/g to 0.0063 cm3/g, an increase of 0.4 times; the micro-pores also developed continuously, and the pore volume increased by 0.2 times, resulting in an increase of 0.4 times. The micro-pores were interconnected to form mesopores. Previous studies have demonstrated that rock micro-pores containing vitrinite components were very developed (Ji et al., 2017). Our FE-SEM observation also revealed that singular pores were developed in bar OM, with pore size smaller than 20 nm. This result is consistent with the organic pore development characteristics of the high-maturity shale in the Shanxi Formation, which further verifies the reliability of our thermal simulation results. However, given the limited resolution of FE-SEM, we likely did not observe many pores smaller than 10 nm.
The inorganic minerals in the Shanxi Formation shale samples were mainly clay minerals and quartz, with less feldspar. XRD analysis showed that with the increase of simulation temperature, the content of clay minerals first increased and then decreased; the content of kaolinite decreased; the content of illite increased; the content of quartz decreased first and then increased; the content of feldspar decreased to zero (Table 1; Figure 8), the result indicated that inorganic minerals were transformed during diagenesis. When the simulated temperature reached to 450°C, the inherently acidic diagenetic conditions of coal measure formations resulted in the transformation of feldspar to kaolinite (Kuila et al., 2014), which increased the content of clay minerals. The potassium ions released by the feldspar alteration also caused the continuous transformation of kaolinite to illite. When the simulated temperature exceeds 450°C, the high temperature and high pressure conditions further stimulate the transformation of clay minerals, and the released siliceous precipitates were transformed into authigenic quartz, thereby reducing the content of clay minerals and increasing the content of quartz (Peltonen et al., 2009; Xu et al., 2021). The range of 400–500°C was the main transformation period of clay minerals, and the corresponding Ro was 1.0%–2.0%. After this, the degree of transformation and the contribution to the storage space decreased. The acidic fluid generated by organic hydrocarbon generation can dissolve soluble minerals and generate dissolution pores. From the FE-SEM observation, the feldspar dissolution cracked in the simulated samples tended to enlarge (Figure 3I). In addition, increased or enlarged micropores and microfractures can also be observed inside the quartz mineral, but at a limited rate of increase (Figure 3T). Overall, from the XRD results, the inorganic minerals in the shale were transformed with the increase of temperature; but from the FE-SEM results, no obvious mineral pores were observed in the samples before and after the thermal simulation experiment. One possible explanation was that the high-pressure conditions generated by the closed system used for the experiments inhibited the development of pores to some extent, especially for inorganic minerals that cannot generate hydrocarbons.
In summary, as the temperature of the thermal simulation experiment increased, both organic hydrocarbon generation and inorganic mineral transformation played a certain role in the development of shale pores, but the former had a much greater impact on the development of pores. The type of OM determined the type of pore development; the maturity of OM controlled the degree of pore development. In addition, in the closed-system thermal simulation experiments, the pressure inhibited the development of shale pores to a certain extent. In other words, under high pressure conditions, there were fewer pores and smaller pore sizes.
The production tests from several wells from the eastern Ordos Basin have shown that the Permian continental and marine transitional shale has great potential and broadly exploration prospects (Kuang et al., 2020). The previous research has shown that organic-rich shale in the Shanxi Formation has the characteristics of high continuous thickness, high organic carbon content, and wide distribution range (Wu et al., 2021). So it has received extensive attention in the study of marine-continental transitional shale gas in recent years. But there is still a debate about the effectiveness for pore system of the Shanxi Formation. Some researchers believe that the pore system in Type III OM is not sufficient to form shale gas reservoir (Jiang et al., 2017). To reveal the effectiveness and evolution process for shale pores system, the artificial pyrolysis or thermal simulation experiments play a key factor. Many existing experiments, such as gold tube pyrolysis experiments, artificial high-pressure and high-temperature simulation experiments can explore the stepwise changes in pores shape and size in the process of thermal maturity (Chen and Xiao, 2014; Ko et al., 2016; Dong et al., 2020; Hower and Groppo., 2021).And then the experiments results can show the potential and effectiveness of the shale. So, for this study, we tried to use thermal simulation experiments to reveal the pore evolution process and controlling factors of marine-continental shale, and finally come to the conclusion that 1) the pore system of the Shanxi Formation shale is sufficient enough to accumulate shale gas and 2) whether the Type III OM has the capacity to generate the enough hydrocarbon for shale gas.
Through thermal simulation experiments and careful analysis during the process of the thermal simulation, two main understandings can be drawn: 1) Type III OM has good hydrocarbon generation potential, though the capacity of hydrocarbon generation for Type III OM is weaker than that of type I. 2) complex, stable and sufficient pore system in Shanxi Formation shale formed in the process of hydrocarbon generation and the high maturity stage (1.2% < Ro < 2.0%) is the extensive pyrolysis of OM in the Shanxi Formation shale to generate hydrocarbons period. The findings from high-pressure and high-temperature simulation experiments can guide to explore the “sweet-spots” for shale gas for this kind of shale. Based on our previous research, the regional maturity of the Shanxi Formation in the eastern Ordos Basin varies greatly, with Ro distribution ranging from 0.6% to 2.8%, and the maturity increases from northeast to southwest. The Ro of the shale in the northern Baode-Xingxian-Linxian line is 0.6%–1.2%, which is in the low maturity stage; the shale in the southern part is deeply buried and the maturity is high, and the Ro of the shale along the Shilou-Daning-Jixian line is 1.2%–2.2%, the Ro value along the Fuxian-Yichuan line is as high as 2.8% (Wu et al., 2021). Based on these findings, maturity can be used as a key indicator for finding the most favorable zones for shale gas in the Shanxi Formation. Based on the high-pressure and high-temperature simulation experiments and Ro distribution for the shale, it can roughly conclude that the most potential area for the Shanxi shale is around along the Shilou-Daning-Jixian line. However, due to the significant differences in temperature, pressure and fluid between actual formation conditions and thermal simulation experiments, this research work is only a preliminary exploration of pore evolution. The Ro can play a key factor for the exploration for the marine continental transitional shale, and TOC, depth, fracturity and other parameters also act the important role.
(1) The results from artificial high-temperature and high pressure thermal simulation experiments showed that the type III OM shale from Shanxi Formation has good hydrocarbon generation potential though smaller than type I OM. It produced large numbers of micropores (<2 nm) and small numbers of mesopores (2–50 nm) during hydrocarbon generation. And maturity can be used as a key indicator for finding the most favorable zones for shale gas in the Shanxi Formation.
(2) The key factor influenced the shale pore system evolution during the thermal simulation is the generation and adjustment of organic pores. The organic pores from conversion of inorganic minerals (kaolinite into illite) contribute less to pore volume than organic pores.
(3) The evolution of the shale pore system can be divided into 3 stages (maturity, high maturity and over maturity) as the thermal maturity increases. The porosity first decreased, then increased, and finally stabilized. The high maturity period (1.2%< Ro <2.0%) was the period when extensive hydrocarbon generated in the Shanxi Formation shale, which contributed mostly for the pores generation and accumulation of shale gas.
The original contributions presented in the study are included in the article/Supplementary Material, further inquiries can be directed to the corresponding authors.
JW, XZ, and HX contributed to the conception of the study; YX contributed to drafting the discussion; JW and HX contributed significantly to analysis and manuscript preparation; GL, LJ, ND, and ZR, performed the data analyses and figure preparation. YX, XZ, and HX performed the constructive discussions and revised the manuscript. All authors contributed to the article and approved the submitted version.
JW, XZ, and YX were employed by PetroChina Research Institute of Petroleum Exploration and Development.
The remaining authors declare that the research was conducted in the absence of any commercial or financial relationships that could be construed as a potential conflict of interest.
All claims expressed in this article are solely those of the authors and do not necessarily represent those of their affiliated organizations, or those of the publisher, the editors and the reviewers. Any product that may be evaluated in this article, or claim that may be made by its manufacturer, is not guaranteed or endorsed by the publisher.
We want to thank National Natural Science Foundation of China (Grant No. 42002157), Sichuan Science and Technology Support Project (2021YJ0349), PetroChina Research Institute of Petroleum Exploration & Development and National Energy Shale Gas R&D (Experimental) Center for this research. We greatly acknowledge Associate Editor and all the reviewers for their insightful and thorough reviews to contribute greatly to this special issue.
Abouzar, M., and Ghanbarian, B. (2021). A New Methodology for Grouping and Averaging Capillary Pressure Curves for Reservoir Models. Energ. Geosci. 2, 52–62. doi:10.1016/j.engeos.2020.09.001
Bhatti, A. A., Ismail, A., Raza, A., Gholami, R., Rezaee, R., Nagarajan, R., et al. (2020). Permeability Prediction Using Hydraulic Flow Units and Electrofacies Analysis. Energ. Geosci. 1, 81–91. doi:10.1016/j.engeos.2020.04.003
Cavelan, A., Boussafir, M., Le Milbeau, C., Delpeux, S., and Laggoun-Défarge, F. (2020). Influence of Experimental Temperature and Duration of Laboratory Confined thermal Maturation Experiments on the Evolution of the Porosity of Organic-Rich Source Rocks. Mar. Pet. Geology. 122, 104667. doi:10.1016/j.marpetgeo.2020.104667
Chen, J., and Xiao, X. (2014). Evolution of Nanoporosity in Organic-Rich Shales during thermal Maturation. Fuel 129, 173–181. doi:10.1016/j.fuel.2014.03.058
Chen, Y., Wang, Y., Guo, M., Wu, H., Li, J., Wu, W., et al. (2020). Differential Enrichment Mechanism of Organic Matters in the marine-continental Transitional Shale in Northeastern Ordos Basin, China: Control of Sedimentary Environments. J. Nat. Gas Sci. Eng. 83, 103625. doi:10.1016/j.jngse.2020.103625
Dong, S., Zeng, L., Lyu, W., Xia, D., Liu, G., Wu, Y., et al. (2020). Fracture Identification and Evaluation Using Conventional Logs in Tight Sandstones: A Case Study in the Ordos Basin, China. Energ. Geosci. 1 (3–4), 115–123. doi:10.1016/j.engeos.2020.06.003
Dong, T., Harris, N. B., Ayranci, K., Twemlow, C. E., and Nassichuk, B. R. (2015). Porosity Characteristics of the Devonian Horn River Shale, Canada: Insights from Lithofacies Classification and Shale Composition. Int. J. Coal Geology. 141-142, 74–90. doi:10.1016/j.coal.2015.03.001
Gao, F. Q. (2021). Influence of Hydraulic Fracturing of strong Roof on Mining-Induced Stress Insight from Numerical Simulation. J. Mining Strata Control. Eng. 3 (2), 023032. doi:10.13532/j.jmsce.cn10-1638/td.20210329.001
Guo, L. L., Zhou, D. W., Zhang, D. M., and Zhou, B. H. (2021). Deformation and Failure of Surrounding Rock of a Roadway Subjected to Mining-Induced Stresses. J. Mining Strata Control. Eng. 3 (2), 023038. doi:10.13532/j.jmsce.cn10-1638/td.20200727.001
He, X., Zhang, P., He, G., Gao, Y., Liu, M., Zhang, Y., et al. (2020). Evaluation of Sweet Spots and Horizontal-Well-Design Technology for Shale Gas in the basin-margin Transition Zone of southeastern Chongqing, SW China. Energ. Geosci. 1, 134–146. doi:10.1016/j.engeos.2020.06.004
Hou, L., Cui, J., and Zhang, Y. (2022). Evolution Mechanism of Dynamic thermal Parameters of Shale. Mar. Pet. Geology. 138, 105423. doi:10.1016/j.marpetgeo.2021.105423
Hower, J. C., and Groppo, J. G. (2021). Rare Earth-Bearing Particles in Fly Ash Carbons: Examples from the Combustion of Eastern Kentucky Coals. Energ. Geosci. 2 (2), 90–98. doi:10.1016/j.engeos.2020.09.003
Jarvie, D. M., Hill, R. J., Ruble, T. E., and Pollastro, R. M. (2007). Unconventional Shale-Gas Systems: The Mississippian Barnett Shale of north-central Texas as One Model for Thermogenic Shale-Gas Assessment. Bulletin 91 (4), 475–499. doi:10.1306/12190606068
Ji, L., Su, L., Wu, Y., and He, C. (2017). Pore Evolution in Hydrocarbon-Generation Simulation of Organic Matter-Rich Muddy Shale. Pet. Res. 2 (2), 146–155. doi:10.1016/j.ptlrs.2017.07.002
Jia, A., Hu, D., He, S., Guo, X., Hou, Y., Wang, T., et al. (2020). Variations of Pore Structure in Organic-Rich Shales with Different Lithofacies from the Jiangdong Block, Fuling Shale Gas Field, SW China: Insights into Gas Storage and Pore Evolution. Energy Fuels 34 (10), 12457–12475. doi:10.1021/acs.energyfuels.0c02529
Jiang, S., Tang, X., Cai, D., Xue, G., He, Z., Long, S., et al. (2017). Comparison of marine, Transitional, and Lacustrine Shales: A Case Study from the Sichuan Basin in China. J. Pet. Sci. Eng. 150, 334–347. doi:10.1016/j.petrol.2016.12.014
Klaver, J., Desbois, G., Urai, J. L., and Littke, R. (2012). BIB-SEM Study of the Pore Space Morphology in Early Mature Posidonia Shale from the Hils Area, Germany. Int. J. Coal Geology. 103, 12–25. doi:10.1016/j.coal.2012.06.012
Ko, L. T., Loucks, R. G., Zhang, T., Ruppel, S. C., and Shao, D. (2016). Pore and Pore Network Evolution of Upper Cretaceous Boquillas (Eagle Ford-equivalent) Mudrocks: Results from Gold Tube Pyrolysis Experiments. Bulletin 100 (11), 1693–1722. doi:10.1306/04151615092
Kuang, L., Dong, D., He, W., Wen, S., Sun, S., Li, S., et al. (2020). Geological Characteristics and Development Potential of Transitional Shale Gas in the East Margin of the Ordos Basin, NW China. Pet. Exploration Dev. 47 (3), 471–482. doi:10.1016/s1876-3804(20)60066-0
Kuila, U., McCarty, D. K., Derkowski, A., Fischer, T. B., Topór, T., and Prasad, M. (2014). Nano-scale Texture and Porosity of Organic Matter and clay Minerals in Organic-Rich Mudrocks. Fuel 135, 359–373. doi:10.1016/j.fuel.2014.06.036
Li, L., and Li, S. J. (2021). Evolution Rule of Overlying Strata Structure in Repeat Mining of Shallow Close Distance Seams Based on Schwarz Alternating Procedure. J. Mining Strata Control. Eng. 3 (2), 023515. doi:10.13532/j.jmsce.cn10-1638/td.20210225.001
Li, Y., Zhou, D.-H., Wang, W.-H., Jiang, T.-X., and Xue, Z.-J. (2020). Development of Unconventional Gas and Technologies Adopted in China. Energ. Geosci. 1 (1–2), 55–68. doi:10.1016/j.engeos.2020.04.004
Liu, B., Schieber, J., and Mastalerz, M. (2017). Combined SEM and Reflected Light Petrography of Organic Matter in the New Albany Shale (Devonian-Mississippian) in the Illinois Basin: A Perspective on Organic Pore Development with thermal Maturation. Int. J. Coal Geology. 184, 57–72. doi:10.1016/j.coal.2017.11.002
Liu, R., Hao, F., Engelder, T., Zhu, Z., Yi, J., Xu, S., et al. (2020b). Influence of Tectonic Exhumation on Porosity of Wufeng-Longmaxi Shale in the Fuling Gas Field of the Eastern Sichuan Basin, China. Bulletin 104 (4), 939–959. doi:10.1306/08161918071
Liu, R., Zheng, J., Hao, F., Nie, Z., Heng, D., Tan, X., et al. (2020c). Variation in Pore Systems with Tectonic Stress in the Overthrust Wufeng-Longmaxi Shale of the Southern Sichuan Basin, China. J. Nat. Gas Sci. Eng. 83, 103617. doi:10.1016/j.jngse.2020.103617
Liu, Y., Gao, M., and Zhao, H. (2020a). Detection of Overlying Rock Structure and Identification of Key Stratum by Drilling and Logging Technology. J. Mining Strata Control. Eng. 2 (2), 023038. doi:10.13532/j.jmsce.cn10-1638/td.2020.02.004
Löhr, S. C., Baruch, E. T., Hall, P. A., and Kennedy, M. J. (2015). Is Organic Pore Development in Gas Shales Influenced by the Primary Porosity and Structure of Thermally Immature Organic Matter? Org. Geochem. 87, 119–132. doi:10.1016/j.orggeochem.2015.07.010
Mastalerz, M., Schimmelmann, A., Drobniak, A., and Chen, Y. (2013). Porosity of Devonian and Mississippian New Albany Shale across a Maturation Gradient: Insights from Organic Petrology, Gas Adsorption, and Mercury Intrusion. Bulletin 97 (10), 1621–1643. doi:10.1306/04011312194
Peltonen, C., Marcussen, Ø., Bjørlykke, K., and Jahren, J. (2009). Clay mineral Diagenesis and Quartz Cementation in Mudstones: The Effects of Smectite to Illite Reaction on Rock Properties. Mar. Pet. Geology. 26 (6), 887–898. doi:10.1016/j.marpetgeo.2008.01.021
Qie, L., Shi, Y. N., and Liu, J. S. (2021). Experimental Study on Grouting Diffusion of Gangue Solid Filling Bulk Materials. J. Mining Strata Control. Eng. 3 (2), 023011. doi:10.13532/j.jmsce.cn10-1638/td.20201111.001
Qiu, Z., Song, D., Zhang, L., Zhang, Q., Zhao, Q., Wang, Y., et al. (2021). The Geochemical and Pore Characteristics of a Typical marine-continental Transitional Gas Shale: A Case Study of the Permian Shanxi Formation on the Eastern Margin of the Ordos Basin. Energ. Rep. 7, 3726–3736. doi:10.1016/j.egyr.2021.06.056
Santosh, M., and Feng, Z. Q. (2020). New Horizons in Energy Geoscience. Energ. Geosci. 1 (1–2), A1–A2. doi:10.1016/j.engeos.2020.05.005
Shi, M., Yu, B., Zhang, J., Huang, H., Yuan, Y., and Li, B. (2018). Evolution of Organic Pores in marine Shales Undergoing Thermocompression: A Simulation experiment Using Hydrocarbon Generation and Expulsion. J. Nat. Gas Sci. Eng. 59, 406–413. doi:10.1016/j.jngse.2018.09.008
Sun, J., Xiao, X., Wei, Q., Cheng, P., and Tian, H. (2021). Occurrence of Irreducible Water and its Influences on Gas-Bearing Property of Gas Shales from Shallow Longmaxi Formation in the Xishui Area, Guizhou, Southern China. Front. Earth Sci. 9, 654136. doi:10.3389/feart.2021.654136
Sun, L., Tuo, J., Zhang, M., Wu, C., Wang, Z., and Zheng, Y. (2015). Formation and Development of the Pore Structure in Chang 7 Member Oil-Shale from Ordos Basin during Organic Matter Evolution Induced by Hydrous Pyrolysis. Fuel 158, 549–557. doi:10.1016/j.fuel.2015.05.061
Wang, H., Qiao, L., Lu, S., Chen, F., Fang, Z., He, X., et al. (2021). A Novel Shale Gas Production Prediction Model Based on Machine Learning and its Application in Optimization of Multistage Fractured Horizontal Wells. Front. Earth Sci. 9, 726537. doi:10.3389/feart.2021.726537
Wang, J., and Wang, X. L. (2021). Seepage Characteristic and Fracture Development of Protected Seam Caused by Mining Protecting Strata. J. Mining Strata Control. Eng. 3 (3), 033511. doi:10.13532/j.jmsce.cn10-1638/td.20201215.001
Wang, P., Zhang, C., Li, X., Zhang, K., Yuan, Y., Zang, X., et al. (2020). Organic Matter Pores Structure and Evolution in Shales Based on the He Ion Microscopy (HIM): A Case Study from the Triassic Yanchang, Lower Silurian Longmaxi and Lower Cambrian Niutitang Shales in China. J. Nat. Gas Sci. Eng. 84, 103682. doi:10.1016/j.jngse.2020.103682
Wu, J., Wang, H., Shi, Z., Wang, Q., Zhao, Q., Dong, D., et al. (2021). Favorable Lithofacies Types and Genesis of marine-continental Transitional Black Shale: A Case Study of Permian Shanxi Formation in the Eastern Margin of Ordos Basin, NW China. Pet. Exploration Dev. 48 (6), 1315–1328. doi:10.1016/s1876-3804(21)60289-6
Xu, H., Zhou, W., Hu, Q., Yi, T., Ke, J., Zhao, A., et al. (2021). Quartz Types, Silica Sources and Their Implications for Porosity Evolution and Rock Mechanics in the Paleozoic Longmaxi Formation Shale, Sichuan Basin. Mar. Pet. Geology. 128, 105036. doi:10.1016/j.marpetgeo.2021.105036
Xu, S., Gou, Q., Hao, F., Zhang, B., Shu, Z., and Zhang, Y. (2020). Multiscale Faults and Fractures Characterization and Their Effects on Shale Gas Accumulation in the Jiaoshiba Area, Sichuan Basin, China. J. Pet. Sci. Eng. 189, 107026. doi:10.1016/j.petrol.2020.107026
Xue, F., Liu, X. X., and Wang, T. Z. (2021). Research on Anchoring Effect of Jointed Rock Mass Based on 3D Printing and Digital Speckle Technology. J. Mining Strata Control. Eng. 3 (2), 023013. doi:10.13532/j.jmsce.cn10-1638/td.20201020.001
Yin, S., Dong, L., Yang, X., and Wang, R. (2020). Experimental Investigation of the Petrophysical Properties, Minerals, Elements and Pore Structures in Tight Sandstones. J. Nat. Gas Sci. Eng. 76, 103189. doi:10.1016/j.jngse.2020.103189
Zargari, S., Canter, K. L., and Prasad, M. (2015). Porosity Evolution in Oil-Prone Source Rocks. Fuel 153, 110–117. doi:10.1016/j.fuel.2015.02.072
Zhang, Y., Hu, S., Shen, C., Liao, Z., Xu, J., and Zhang, X. (2022). Factors Influencing the Evolution of Shale Pores in Enclosed and Semi-enclosed thermal Simulation Experiments, Permian Lucaogou Formation, Santanghu Basin, China. Mar. Pet. Geology. 135, 105421. doi:10.1016/j.marpetgeo.2021.105421
Zhang, Y., Yu, B., Pan, Z., Hou, C., Zuo, Q., and Sun, M. (2020). Effect of thermal Maturity on Shale Pore Structure: A Combined Study Using Extracted Organic Matter and Bulk Shale from Sichuan Basin, China. J. Nat. Gas Sci. Eng. 74, 103089. doi:10.1016/j.jngse.2019.103089
Zhang, Z., Zhang, K., Song, Y., Jiang, Z., Jiang, S., Wang, P., et al. (2021). Study on the Formation Mechanism of Shale Roof, Floor Sealing, and Shale Self-Sealing: A Case of Member I of the Upper Ordovician Wufeng Formation-Lower Silurian Longmaxi Formation in the Yangtze Region. Front. Earth Sci. 9, 764287. doi:10.3389/feart.2021.764287
Zhao, W., Wang, K., Liu, S., Ju, Y., Zhou, H., Fan, L., et al. (2020). Asynchronous Difference in Dynamic Characteristics of Adsorption Swelling and Mechanical Compression of Coal: Modeling and Experiments. Int. J. Rock Mech. Mining Sci. 135, 104498. doi:10.1016/j.ijrmms.2020.104498
Zhao, W., Wang, K., Wang, L., Cheng, Y., Dong, H., Li, B., et al. (2021). Influence of Matrix Size and Pore Damage Path on the Size Dependence of Gas Adsorption Capacity of Coal. Fuel 283, 119289. doi:10.1016/j.fuel.2020.119289
Zhao, Z., Wu, K., Fan, Y., Guo, J., Zeng, B., and Yue, W. (2020). An Optimization Model for Conductivity of Hydraulic Fracture Networks in the Longmaxi Shale, Sichuan basin, Southwest China. Energ. Geosci. 1, 47–54. doi:10.1016/j.engeos.2020.05.001
Keywords: porosity evolution, thermal simulation, marine-continental transitional shale, shanxi formation, ordos basin
Citation: Wu J, Zhang X, Xu H, Xiao Y, Liu G, Jiang L, Deng N and Ren Z (2022) Process and Controlling Factors of Pore Evolution in Marine-Continental Transitional Black Shale—An Example From Permian Shanxi Formation in the Eastern Margin of Ordos Basin. Front. Earth Sci. 10:889067. doi: 10.3389/feart.2022.889067
Received: 03 March 2022; Accepted: 28 March 2022;
Published: 12 April 2022.
Edited by:
Wenlong Ding, China University of Geosciences, ChinaReviewed by:
Rui Liu, Southwest Petroleum University, ChinaCopyright © 2022 Wu, Zhang, Xu, Xiao, Liu, Jiang, Deng and Ren. This is an open-access article distributed under the terms of the Creative Commons Attribution License (CC BY). The use, distribution or reproduction in other forums is permitted, provided the original author(s) and the copyright owner(s) are credited and that the original publication in this journal is cited, in accordance with accepted academic practice. No use, distribution or reproduction is permitted which does not comply with these terms.
*Correspondence: Xiaowei Zhang, emhhbmd4dzY5QHBldHJvY2hpbmEuY29tLmNu; Hao Xu, aGFveHU3NzdAcXEuY29t
Disclaimer: All claims expressed in this article are solely those of the authors and do not necessarily represent those of their affiliated organizations, or those of the publisher, the editors and the reviewers. Any product that may be evaluated in this article or claim that may be made by its manufacturer is not guaranteed or endorsed by the publisher.
Research integrity at Frontiers
Learn more about the work of our research integrity team to safeguard the quality of each article we publish.