 Juanjuan Fang
 Yitian Li1*
- 1State Key Laboratory of Water Resources and Hydropower Engineering Science, Wuhan University, Wuhan, China
- 2Water Resources Department, Changjiang River Scientific Research Institute, Wuhan, China
Lake systems are of fundamental significance for the ecological environment and social development. Driven by climatic changes and human activities, the hydrological situation of rivers and lakes has been altered considerably, and it has directly affected the reliability of irrigation and water supply in lake areas. In the case of the Yangtze River–Dongting Lake area, the quasi-equilibrium of their hydrological states and water balance have been affected by the operation of the Three Gorges Project that has led to irrigation and water supply problems across the lake area. Ever since, the available water supply in the Dongting Lake area has decreased by 31.5% and 47.7% during the months of September and October, and the overall water level in the lake area has dropped by 0.8–2.0 m. The proportion of domestic and agricultural irrigation water demands to available water supply in the Dongting Lake area is very small, and the decline of water level is the main reason for the lack of water supply in Dongting Lake area, Although the total amount of water in the lake area is still above the water supply threshold, an obvious decreasing trend has been observed in the fulfillment of the demand for both irrigation and water supply in urban and rural regions. Additionally, the fulfillment of secured water supply and irrigation requirements has respectively dropped from 95% to 78% before the operation of the Three Gorges Project to 82% and 46% after it. Meanwhile, the total water shortage increased from 57.683 to 143.607 million cubic meters. By advancing or postponing impoundment schedules, the impact of the Three Gorges Reservoir on irrigation and water supply in the lake area during September and October can be alleviated, and the water supply capacity can be respectively increased by approximately 1.3% and 1.4%. The highlights of this study include the quantification of the impacts of the operation of large-scale water conservancy projects at the level at which the requirements on irrigation and water supply in the lake area are satisfied, and the prediction of the trends for future evolvement. In addition, corresponding strategies that provide a technical reference for the comprehensive regulation and control over water resources and the security of water supply in the river basin are discussed.
1 Introduction
Lakes are not only important ecosystems that influence the local climate and ecological balance but also valuable economic resources for the development of human society (Du et al., 2011; Lai et al., 2021; Zhu et al., 2021). In recent decades, the hydrological regimes of many lakes around the world have been modified because of climatic changes and human activities, which have exerted a direct impact on both the regional ecological environment and the sustainable development of the economy and society (Du et al., 2011; Feng et al., 2021; Yuan et al., 2021). Since the beginning of this century, human activities have become the leading factor in the evolution and adjustment of the hydrological situations of rivers and lakes (Yuan et al., 2015; Lai et al., 2021; Lei et al., 2021; Yuan et al., 2021). In the case of the Yangtze River Basin, considerable attention has been given to the impact of the Three Gorges Project on the hydrological regimes (Lai et al., 2016; Guo et al., 2021), sediment transport (Yang et al., 2014; Huang et al., 2019), river erosion and deposition (Dai and Liu, 2013; Tang et al., 2021), shipping (Fan et al., 2015; Xue et al., 2021), and other fields (Xu et al., 2013; Han et al., 2022). Meanwhile, studies on the river–lake relationship, featured by both the Dongting and Poyang Lakes, respectively situated in the middle and lower reaches of the Yangtze River, have become the focus in water security and water resources (Lai et al., 2014; Wang et al., 2014; Yuan et al., 2015; Feng et al., 2017; Gao et al., 2020; Lai et al., 2021).
Dongting Lake is the second largest freshwater lake in China and is interconnected with the Yangtze River. It is not only a natural reservoir of the Yangtze River but also an important wetland in the world. The lake area has a warm and humid climate with four distinct seasons and superior hydrothermal conditions. In addition, it is considered a giant and vital agricultural production base in China; agricultural irrigation activities have been affected remarkably by water levels in the lake area as the irrigation water comes from either the inner lakes or Dongting Lake (Wang et al., 2021). Owing to the particularity of its geographical location and inflow water conditions, the water levels of Dongting Lake have been dependent not only on climatic factors and other natural conditions, but also on the incoming water from the Yangtze River and the four tributaries (Xu and Milliman, 2009; Tang et al., 2010). In recent years, the river–lake relationship between the Yangtze River and Dongting Lake has experienced the effects of natural evolution and influences from human activities, such as the blocking of the Tiaoxiankou, the natural and artificial bending of the lower Jingjiang River, the closure of Gezhouba Dam, and the impoundment of the Three Gorges Reservoir. Consequently, great changes have taken place in the hydraulic relationship between rivers and lakes and the hydrological regime of lakes, and the water level has also been greatly affected (Gao et al., 2013; Wang et al., 2013; Yuan et al., 2015; Zhou et al., 2017; Li et al., 2020). Among them, the impact of the operation of the Three Gorges Reservoir is the focus of ongoing research. Many researchers have analyzed the impact of the operation of the Three Gorges on Dongting Lake from different perspectives, including the landscape pattern (Wu et al., 2017), ecosystem response (Gao et al., 2020), changes in sediment transportation (Chen et al., 2010), water quality (Geng et al., 2021a; Geng et al., 2021b), hydrological regime (Dai et al., 2017), flood processes (Lai and Wang, 2017), and change of lake area (Wang et al., 2014). According to Zhong and Yu (2015) reported that after 50 years of operation of the Three Gorges Reservoir, flow diversion at the three channels would decrease, the cut-off time during the rainless seasons would be further prolonged, and the low-flow situation in the lake area would thus get worsened. All these changes would result in difficulties in irrigation and degraded water supply reliability, which would affect the safety of water supply and irrigation in the lake area. As a result, engineering and non-engineering measures are needed to alleviate the adverse effects of changes in the river–lake relationship (Zhong and Yu, 2015). However, the impact of the modified flow regimes induced by the Three Gorges Project on the irrigation and water supply safety, which influences the water utilization in the lake area, has not yet been quantitatively assessed.
Taking Dongting Lake on the Yangtze River as a case study, this study investigated the characteristics of the changes in water resources and water level in the lake area, before and after the operation of the Three Gorges Project. Based on the relationship between the demand and water supply with the irrigation and urban and rural uses in the lake area, the impact of the Three Gorges Project on the hydrological regimes and water safety of irrigation and water supply were analyzed quantitatively. Results from this study provided a reference to the implementation of comprehensive control of water resources and the safety guarantee of the irrigation and water supply in the Dongting Lake area.
2 Research Region and Methodologies
2.1 Research Region
Dongting Lake is located from 111°14′E to 113°10′E, and from 28°30′N to 30°23′N, that is, in the south reach of Jingjiang River and the north of the Hunan Province. The topography of Dongting Lake is higher in the west and lower in the east, and it can be divided into the eastern, southern, and western Dongting Lakes, thus forming a sloping water surface from the west to the east. The river network of Dongting Lake is mainly composed of four tributaries, namely, Xiang, Zishui, Yuanjiang, and Lishui rivers, together with three channels from the Jingjiang River, namely, Songzi, Taiping, and Ouchi rivers. In addition, it has several other tributaries, such as the Miluo and Xinqiang Rivers. The water in the lake flows into the Yangtze River at Chenglingji, with an average annual water inflow of approximately 254 billion cubic meters.
This study focused on the Dongting Lake area, which refers to the vast plain and lake regions located in the south reach of Jingjiang River below the tail control stations of the four tributaries (Xiang, Zishui, Yuanjiang, and Lishui rivers) with a maximum elevation of 50 m across the Hunan and Hubei provinces. The total lake area is 20,109 km2, out of which the natural lakes account for approximately 2,625 km2. The river networks and hydrological stations in the lake area are shown in Figure 1.
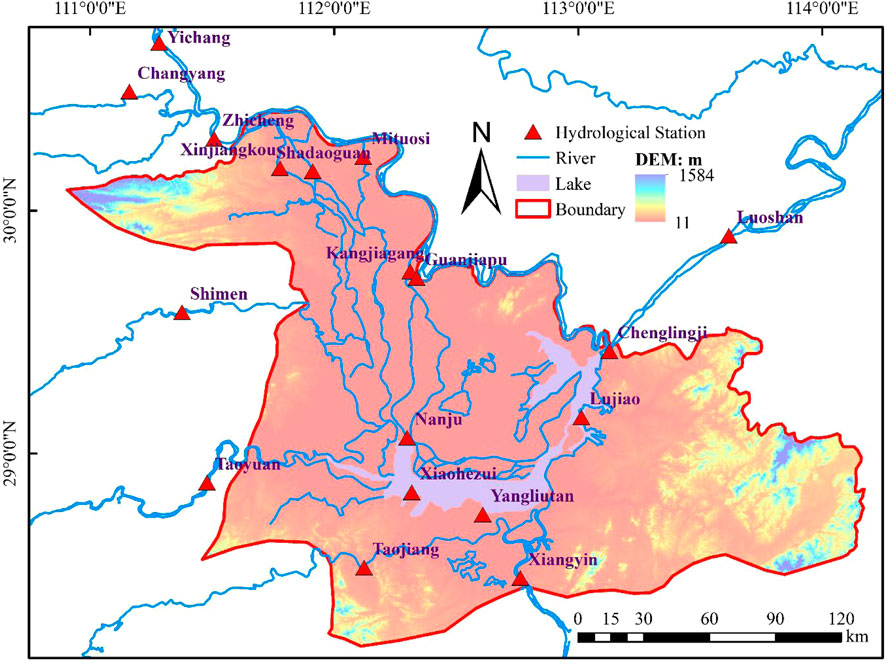
FIGURE 1. River networks and hydrological stations in the Dongting Lake area.
2.2 Experimental Data
All the hydrological data used in the study consist of information regarding water level, as well as inflow and outflow volumes of the Dongting Lake from 1960 to 2019. These data were acquired on a daily basis from the hydrological stations managed by the Hydrology Bureau of the Changjiang River Water Resources Commission. Table 1 lists the type of hydrological data of some representative stations. The Lujiao, Xiaohezui, Yangliutan and Chenglingji stations were the used to measure the water levels in Dongting Lake area, and Chenglingji was also used for obtaining outflow observations. Data for the inflow volume were collected from the Xiangyin, Taojiang, Taoyuan, and Shimen stations that represent the four tributaries—Xiang, Zishui, Yuanjiang, and Lishui rivers, respectively. Discharge data for the three channels were collected from the Xinjiangkou and Shadaoguan stations of the Songzi River, Mituosi station of the Hudu River, and Kangjiagang and Guanjiapu stations of the Ouchi River.
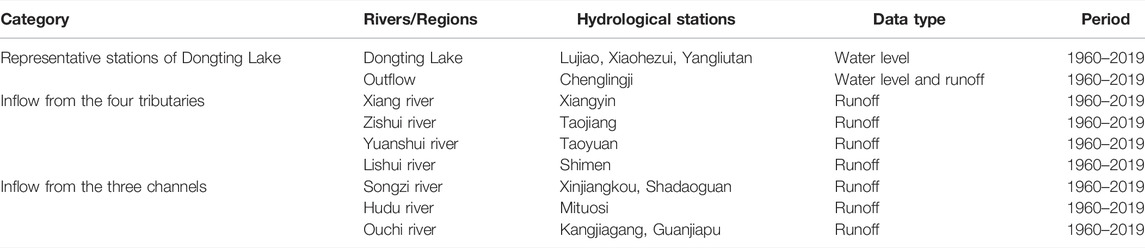
TABLE 1. Hydrological data.
The water intake data used in the study include the data of water plants and polders in the lake area. There is one water plant and 26 polders in the lake area, each with several distributed water intake outlets. According to the location of irrigation water intake in the Dongting Lake area, irrigated farmland can be divided into four subregions: western, southern, south of eastern, and north of eastern Dongting Lake. The data of water plants and polders are summarized in Table 2.
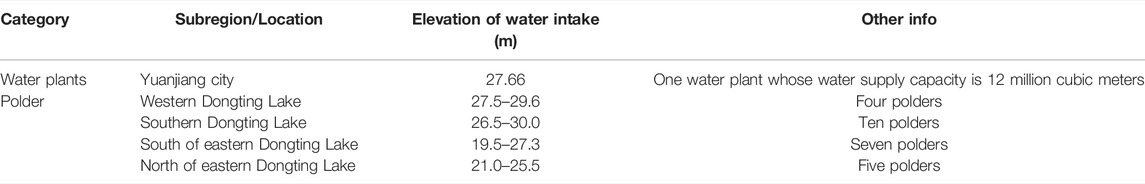
TABLE 2. Water intake data.
2.3 Methodologies
In this study, the moment at which the Three Gorges Reservoir came into operation was utilized to divide the observation period into two phases: the phase before its operation (1960–2002) and that after its operation (2003–2019). Changes in water volume and the balance of supply and demand for water resources were then analyzed. Variations in the water level, as well as the impact on both irrigation and water supply for urban and rural uses were then scrutinized based on the irrigation and water supply safety index of the lake area. Finally, different impoundment plans of the Three Gorges Reservoir in terms of the safety of water supply were compared.
2.3.1 Analysis of Water Volume Changes and Water Resources Supply and Demand Balance
When analyzing the changes in volume, variation in the water storage capacity of the Dongting Lake in different periods can be calculated from the following water balance equation,
where Vin and Vout are the inflow and outflow runoff volumes of the Dongting Lake, respectively. Given that the Dongting Lake flows into the Yangtze River at Chenglingji, the runoff volume at Chenglingji station was therefore regarded as the outflow volume Vout. The total inflow volume is calculated from the three channels of Jingjiang River and the four tributaries as follows,
where VFT and VTC are the inflow volumes from the four tributaries and the three channels into the lake, respectively. VXY, VTJ, VTY, and VSM denote the volumes from the Xiangyin station of Xiang River, Taojiang station of Zishui River, Taoyuan station of Yuanshui River, and Shimen station of Lishui River, respectively. VXJK, VSDG, VMTS, VKJG, and VGJP represent the volumes of Xinjiangkou and Shadaoguan stations of Songzi River, Mituosi station of Hudu River, and Kangjiagang and Guanjiapu stations of Ouchi River, respectively. The variation in the water storage capacity described here represents the difference between the inflows from the three channels and four tributaries and the outflows from Chenglingji and not the real variation in water storage capability.
In the analysis of the balance of supply and demand for water resources, the volumes of Dongting Lake in different months were calculated according to the volume curve of the natural Dongting Lake and the water level of Dongting Lake, and regarded as the available water supply volumes. The monthly water demand was determined based on results from research and surveys. Consequently, the available water supply and water demand in the Dongting Lake area were compared and analyzed.
2.3.2 Analysis of the Satisfaction of Irrigation and Water Supply
The flow diagram used to analyze irrigation and water supply satisfaction is shown in Figure 2. First, based on data collection and onsite investigations, water level data at representative intake facilities for both urban and rural water supply and agricultural irrigation around Hunan Province and Hubei Province were acquired. Subsequently, the intake water level was converted to the water level of nearby hydrological stations to examine the security of water supply of each station. Finally, the fulfillment and shortage volume of irrigation and water supply were calculated by comparing the safety water level and recorded water levels during the period of 1960–2002 and 2003–2019.
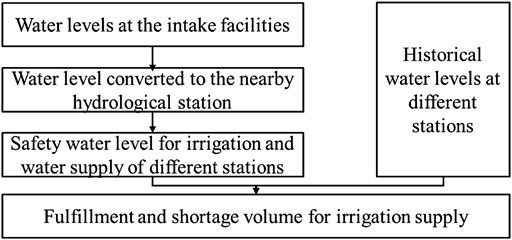
FIGURE 2. Analysis flow on the fulfillment of irrigation and water supply.
The method used to convert the intake water level to the water level at the hydrological station is as follows. According to the water surface slope of the lake area for a low-water flow <85% in each subregion, combined with the distance between the water intake and the adjacent control section, the conversion was achieved using the following equation,
where H0 is the lowest water intake elevation, S is the water surface slope for a low-water flow in the area <85%, L is the distance between the water intake and the representative station, which is negative in the upstream of the station and positive in the downstream of station, and Hr is the lowest intake water level near the control representative station, that is, when the water level of the station reaches the elevation of Hr, water can be drawn.
After the conversion of all the requirements based on the lowest intake of water level to those of the adjacent control representative station, we took the outer envelope of the required lowest intake water level for each station (that is, the maximum value) as the safety water level for irrigation and urban and rural water supplies of the station. Considering the different objects and properties of water supply, a set of water level safety indices for urban and rural water supply and agricultural irrigation were proposed.
After the determination of the safety water level of different hydrological stations, the water level satisfaction period of urban and rural water supplies and agricultural irrigation were calculated based on the recorded water levels for the pre- and post-operation of the Three Gorges Reservoirs. The fulfillment of water levels as well as the water shortage (cases in which the water level does not meet the requirements) were also calculated.
2.3.3 Impact of Different Impoundment Plans on the Three Gorges Reservoir
According to the instructions on the impoundment of the Three Gorges Reservoir specified in the approval on the “Cascade Regulation of the Three Gorges (normal operation period)-Gezhouba Dam Water Control Project (revised in 2019)” by the Ministry of Water Resources, different water storage plans were prepared to emulate the change process of water level at the Chenglingji station from August to November, and their impacts on water supply security were analyzed. The control times and corresponding water levels of the three impoundment plans are shown in Table 3.
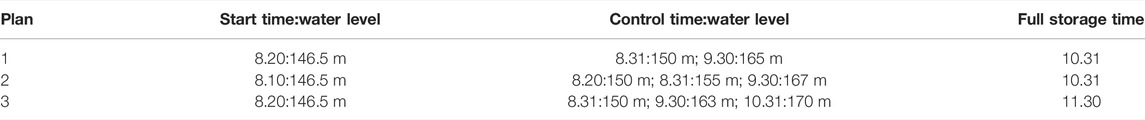
TABLE 3. Establishment of three impoundment plans for the Three Gorges Reservoir.
3 Analysis on Volume Changes and Water Supply and Demand in the Dongting Lake Area
3.1 Volume Changes in the Dongting Lake Area
3.1.1 Inflow Runoff Volume of the Dongting Lake
3.1.1.1 Inflow Runoff Volume of the Three Channels of Jingjiang River
For the three channels of the Jingjiang River, the inflow runoff volumes and the variations during different periods are shown in Figure 3A and Table 4. The average annual inflow runoffs to Dongting Lake from 1960 to 2002 and from 2003 to 2019 were 860.2 × 10⁸ m3 and 483.3 × 10⁸ m3, respectively. The decrease was 376.9 × 10⁸ m3 (43.8%). In terms of runoff distribution across the year, the inflow runoff was only found to be increased from January to March, but it decreased in other months (especially in September and October), and the loss reached 153.6 × 10⁸ m3 and accounted for 57.7%.
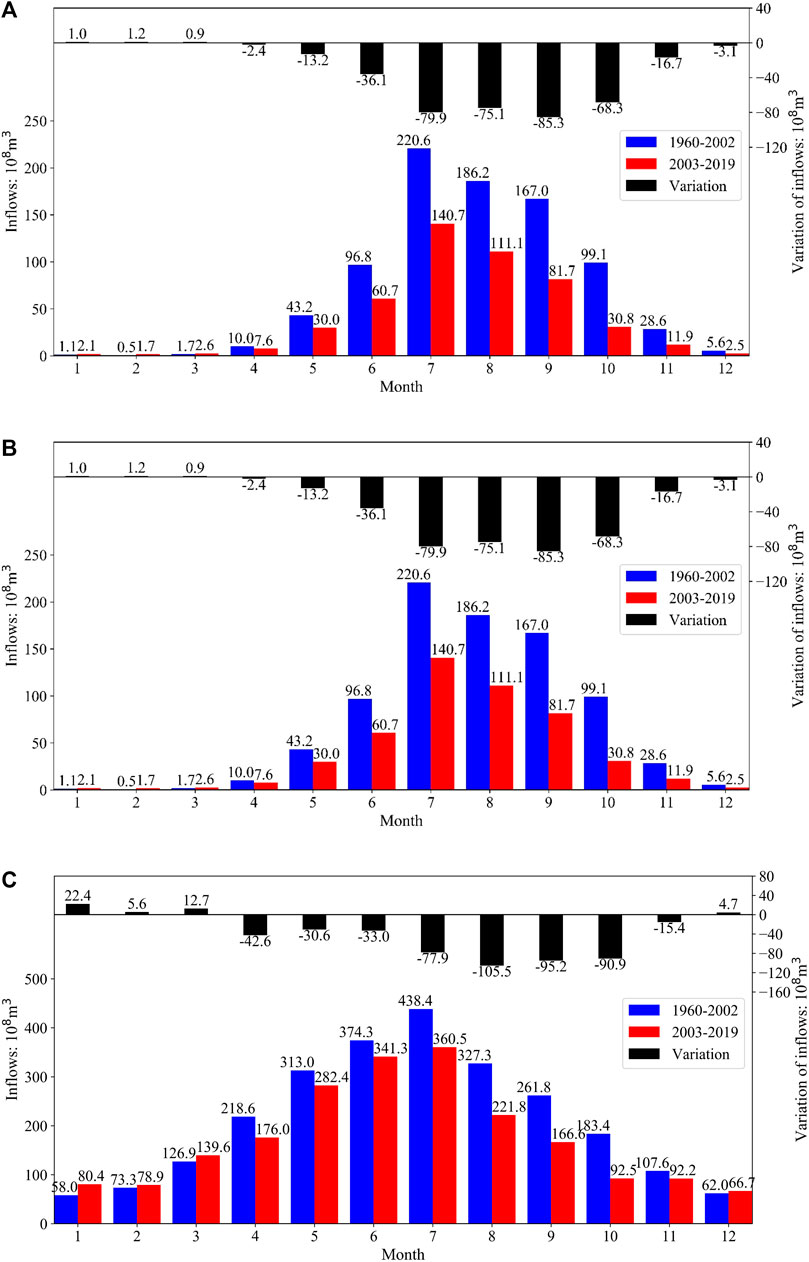
FIGURE 3. Inflow volumes and variations of Dongting Lake at different time periods (A) Inflow from three channels; (B) Inflow from four tributaries; (C) Total inflow.doc.
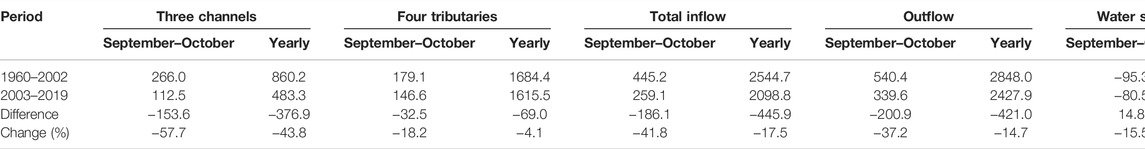
TABLE 4. Inflow and outflow of Dongting Lake and the corresponding water storage change.
3.1.1.2 Inflow Runoff Volume of the Four Tributaries
For the four tributaries, the inflow runoff volumes and the variations in different periods are shown in Figure 3B and Table 4. The average annual inflow runoffs to Dongting Lake from 1960 to 2002 and from 2003 to 2019 were 1,684.4 × 108 m3 and 1,615.5 × 108 m3, respectively. The decrease was 69.0 × 10⁸ m3 (4.1%). In terms of runoff distribution during the year, the months of April, August, and October were associated with larger decreases, which were equal to 40.3 × 10⁸ m3 (19.3%), 30.3 × 10⁸ m3 (21.5%), and 22.7 × 10⁸ m3 (26.9%), respectively.
3.1.1.3 Total Inflow Runoff Volume
The total inflow runoff volume and the variations of the three channels and the four tributaries in different periods of time are shown in Figure 3C and Table 4, and the total inflow runoff volumes in different years are shown in Figure 4. The average annual inflow runoffs of the Dongting Lake from 1960 to 2002 and from 2003 to 2019 were 2,544.7 × 108 m3 and 2,098.8 × 108 m3, respectively, which correspond to a decrease of 445.9 × 10⁸ m3 (17.5%). Specifically, the runoffs from September to October decreased by 186.1 × 10⁸ m3 (or equivalently by 41.8%). In terms of inflow runoff distribution, the inflow runoff from December to March of the following year increased by 7.6%–38.5% (the absolute volume values were in the range of 4.7 × 10⁸ m3–22.3 × 10⁸ m3), while from April to November, the inflow runoff decreased by 8.8%–49.6% (the absolute volume values were in the range of 15.4 × 10⁸ m3–105.5 × 10⁸ m3). Based on comparisons of the inflow runoff data against time, the decrease in volume mainly took place from September to October. The reason can be attributed to the significant decrease of inflow runoff from the three channels of Jingjiang River after the operation of the Three Gorges Project, which accounts for about 82.5% and 84.5% of the total reduction in inflow from September to October and during the whole year, respectively.
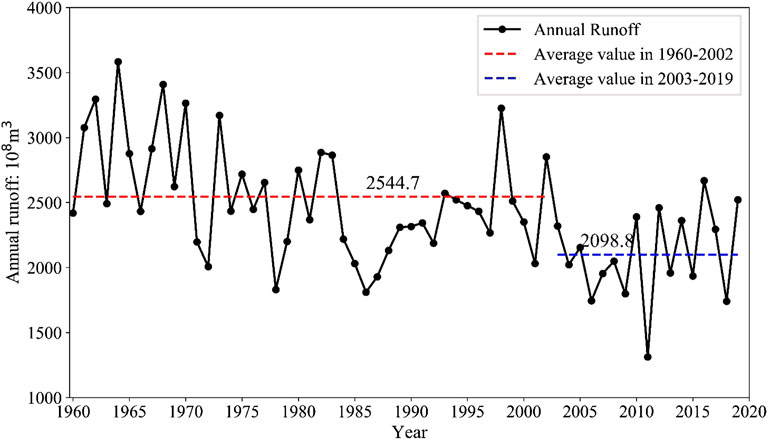
FIGURE 4. Variations of annual inflow of Dongting Lake.
3.1.2 Outflow Volume of the Dongting Lake
The outflow volumes and the variations are shown in Figure 5 and Table 4. From 1960 to 2002, and from 2003 to 2019, the average annual outflow runoffs were 2848.0 × 108 m3 and 2427.9 × 108 m3, respectively. Their difference was 420.1 × 10⁸ m3 (or equivalently, 14.7%). Specifically, the most notable decrease was also observed during the months of September and October, which was 200.9 × 10⁸ m3, with a decrease rate of 37.2%. In terms of the outflow runoff distribution across the year, from December to March of the following year, the runoff volume increased by 0.4%–33.7% (the absolute volume values were 0.3 × 10⁸ m3–23.5 × 10⁸ m3), while from April to November, the outflow runoff decreased by 1.4%–41.8% (the absolute volume values were 5.2 × 10⁸ m3–102.5 × 10⁸ m3).

FIGURE 5. Outflow volumes and variations of Dongting Lake at different time periods.
3.1.3 Water Balance in the Dongting Lake Area
From the inflow runoff data of the three channels of Jingjiang River and the four tributaries as well as the outflow runoff data organized in the previous sections, water storage change, and the variations of Dongting Lake in different periods of time are presented in Figure 6 and Table 4. For the two observation periods, 1960–2002 and 2003–2019, the average annual water storage changes were 303.3 × 10⁸ m3 and −329.1 × 10⁸ m3, respectively. The decrease in volume was 25.8 × 10⁸ m3, out of which the largest loss was 14.8 × 10⁸ m3 during the months of September and October. In terms of the distribution across the year, the decreased volume for January to April, June, and August ranged between 1.2 × 10⁸ m3 and 27.9 × 10⁸ m3; while for the rest of the year, that is, for May, July, and September to December, the water storage increased. Increases were in the range of 2.3 × 10⁸ m3–14.8 × 10⁸ m3.
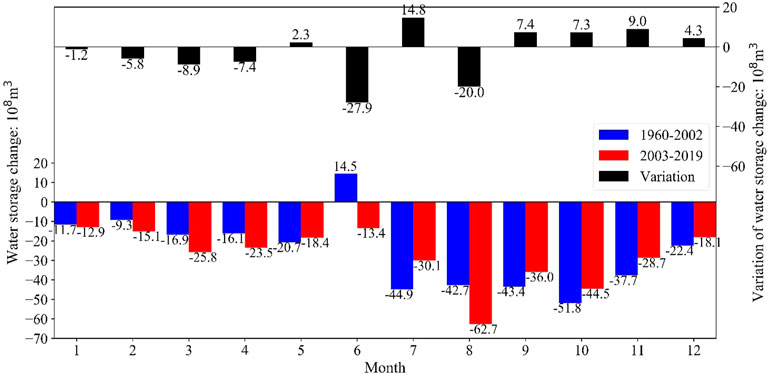
FIGURE 6. Water storage changes of the Dongting Lake and variations at different periods of time.
3.2 Analysis of Water Supply and Demand in the Dongting Lake Area
3.2.1 Available Water Supply in the Lake Area
The change processes of the Dongting Lake of the multiyear average available water volume among different months before and after the operation of the Three Gorges Project are demonstrated in Figure 7. From 1960 to 2002, and from 2003 to 2019, the available water supply among different months in the Dongting Lake area were in the range of 8.2 × 10⁸ m3–88.8 × 10⁸ m3 and 8.5 × 10⁸ m3–82.4 × 10⁸ m3, respectively. For the months from January to June, the numbers changed from 8.2 × 10⁸ m3–39.2 × 10⁸ m3 to 8.5 × 10⁸ m3–48.3 × 10⁸ m3 in the two observations phases, which implied increases of 0.3 × 10⁸ m3–9.2 × 10⁸ m3 in volume (equivalently the percentage change was in the range of 3.3%–23.4%). For the second half of the year, from July to December, the average supply as a function of month changed from 9.2 × 10⁸ m3–88.8 × 10⁸ m3 to 8.7 × 10⁸ m3–82.4 × 10⁸ m3 in the two observations phases, respectively, which implied decreases of 0.5 × 10⁸ m3–16.8 × 10⁸ m3 in volume (equivalently the percentage change was in the range of 5.3%–47.7%). Specifically, the largest losses were found for the months of September and October, the water level decreased from 53.1 × 10⁸ m3 and 29.6 × 10⁸ m3 to 36.4 × 10⁸ m3 and 15.5 × 10⁸ m3, respectively (or equivalently by 31.5% and 47.7%, respectively).
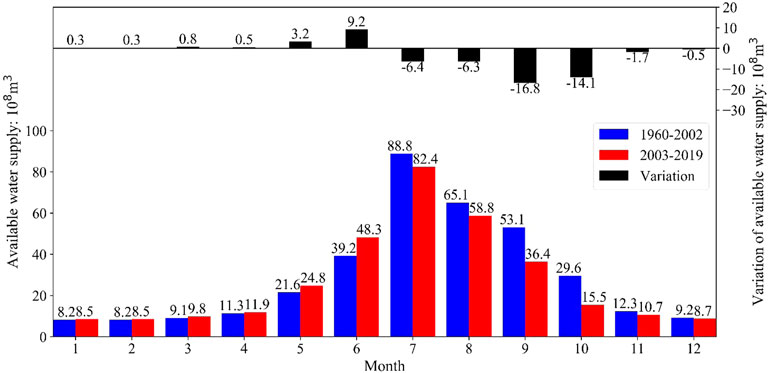
FIGURE 7. Multiyear average available water supply and monthly variations before and after the operation of the Three Gorges Reservoir.
3.2.2 Water Demand in the Dongting Lake Area
Water demand in the Dongting Lake area is classified into domestic and agricultural irrigation water demands. Based on onsite investigations in conjunction with the verification results of water intake facilities in the Yangtze River Basin in 2019, the single water plant that drew off water from the Dongting Lake had an annual water intake capacity of 12 million cubic meters, which was distributed evenly across the 12 months. The water demand for agricultural irrigation purposes was mainly during the months from May to October, as well as during the spring irrigation (that is, from April to May). According to the present situation of irrigation in the lake area and the quota method, the monthly requirement on water for irrigational purposes can be determined. Combining domestic water demand and irrigation water demand, the total demand in the Dongting Lake area was 1.35 billion cubic meters. Accordingly, the monthly water demand process is shown in Figure 8. It can be indicated that the requirements on water for domestic uses and irrigations in the Dongting Lake area mainly concentrated from April to October, and the monthly demand ranged from 3,378 × 104 m3 to 32,473 × 104 m3. During this period, the month with the highest demands above 2.5 × 10⁸ m3 were July (ranked first at 32,473 × 104 m3), followed by August (30,014 × 104 m3), and September (26,326 × 104 m3).
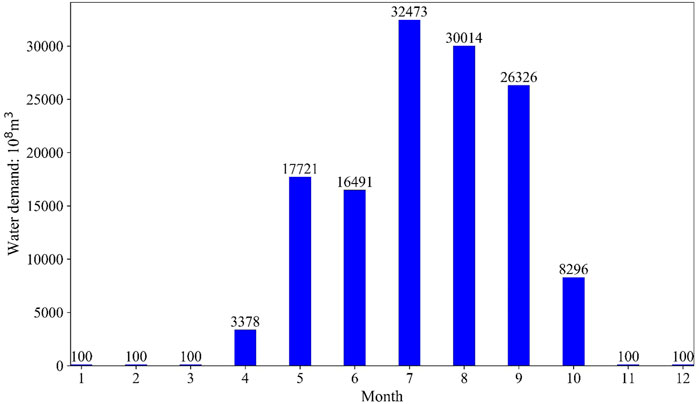
FIGURE 8. Monthly demand for domestic and irrigation water in the Dongting Lake area.
3.2.3 Analysis of Supply and Demand Balance of Water Resources in the Dongting Lake Area
When the total water demand and the available water volume of the lake area were compared (Figures 7, 8), the proportion of domestic and irrigation water demand of the Dongting Lake against the water volume was quite small. This implied that the water supply could meet the demand, and no water shortage should exist with respect to volume of available water. However, when projecting the trend of changes in water volume in the lake area, a decreasing tendency was prevalent from July to December. Specifically, during the months with high demand (from July to October), the water volume in the Dongting Lake area exhibited a loss of 6.3 × 10⁸ m3–16.8 × 10⁸ m3, which should be considered as a potential threat for future utilization of the water resources in the lake area.
4 Changes in Water Level and Safety Assessment of Irrigation and Water Supply in the Dongting Lake Area
4.1 Changes of Water Level in the Dongting Lake Area
4.1.1 Variations in the Average Water Level by Month in the Lake Area
Variations of average water level with month at Chenglingji, Xiaohezui, Lujiao, and Yangliutan stations over the two observation phases, from 1960 to 2002 and from 2003 to 2019, are displayed in Figure 9. With regard to Chenglingji station, the average water level by month over the two observation phases ranged in 20.0–30.3 m and 21.3–30.2 m, respectively. These variations were between −2.0 and 1.5 m. The most prominent water level decrease was observed during the months from July to November. The largest drop of 2 m was documented in October. By contrast, from December to June of the following year, the water level increased, and the largest boost was observed in March (1.5 m). With regard to the Xiaohezui station, the average monthly water levels during the two observation phases were in the ranges of 28.6–32.2 m and 28.6–31.9 m, respectively; the respective variations were between −1.1 and 0.0 m. With the exceptions of January and March, the water level exhibited a decreasing trend in the other 10 months. The largest loss of 1.1 m was documented in October. With regard to the Lujiao station, the average monthly water level over the two observation phases ranged from 21.7 to 30.6 m and 22.3–30.5 m, respectively; the respective variations were between −2.0 and 0.6 m. In the months of April, as well as from July to December, the water level decreased by values which ranged between 0.1 and 2.0 m. The maximum decrease was in October (2.0 m). By contrast, the water level increased in the other months by 0.2 and 0.6 m. With regard to the Yangliutan station, the average monthly water level during the two observation phases ranged from 27.7 to 31.4 m and 27.7–31.1 m, respectively; the respective variations were between −0.9 and 0.1 m. In the months of April, May, as well as from July to December, the water level values decreased between 0.1 and 0.9 m. Water levels were replenished again and reached their highest levels by October (0.9 m). Overall, October was the month with the most significant changes in water level at each of the hydrological stations. Decreases ranged from 0.9 to 2.0 m, while September was the month with the second largest fall in the water level, and ranged from 0.8 to 1.2 m. From the perspective of geological distribution, the closer the station is to the main stream of the Yangtze River, the greater the decrease in water, which is attributed to the operation of the Three Gorges Reservoir. To sum up, given the operation of the Three Gorges Reservoir, the safety of the water supply for irrigation from the Dongting Lake area was mainly concentrated in the months of September and October, which is the period of water storage in the reservoir.
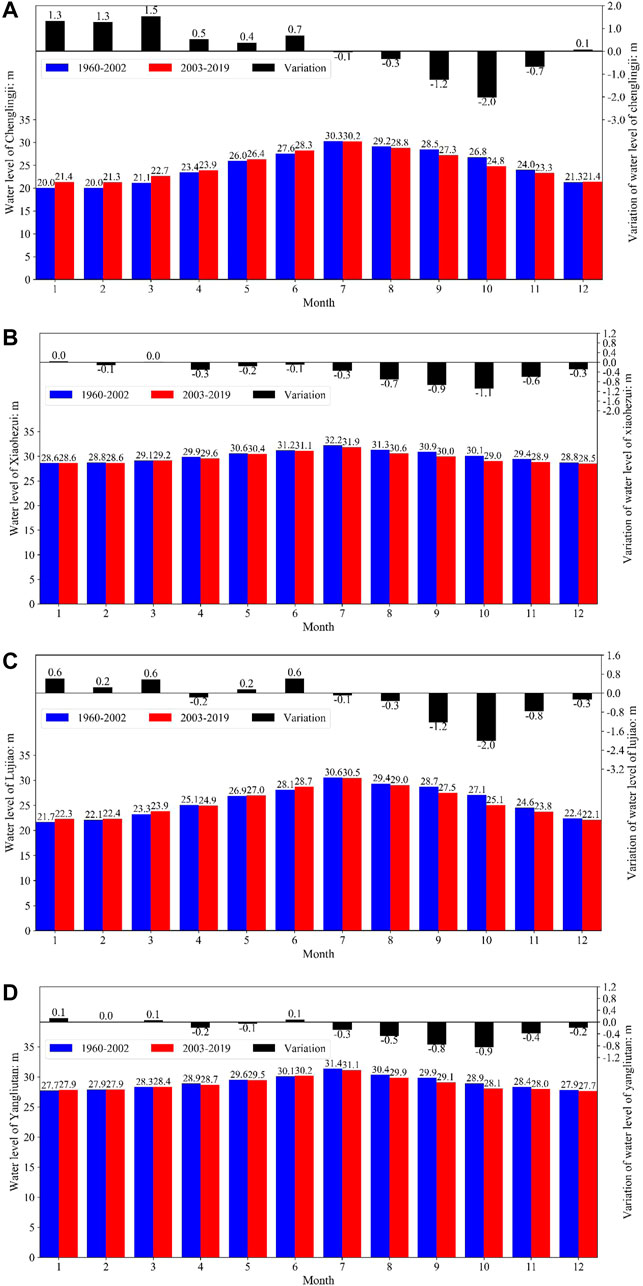
FIGURE 9. Variations of water levels at different time periods at the (A) Yangtze River at Chenglingji, (B) Xiaohezui, (C) Lujiao, and (D) Yangliutan stations. The dotted lines in each figure is the fitted trend line.
4.1.2 Changes in the Lowest Water Level in the Lake Area
The lowest annual water levels at the Chenglingji, Xiaohezui, Lujiao, and Yangliutan stations from 1960 to 2019 are shown in Figure 10. In the cases of the Chenglingji and Lujiao stations, the lowest annual water levels exhibited a mild upward trend, while Xiaohezui station exhibited an opposite trend, and Yangliutan station remained relatively stable. The main reason for the boost in the lowest water level is that the Three Gorges Reservoir strengthens the water supply to the middle and lower reaches of the Yangtze River during the dry season, which has benefited both the Chenglingji and Lujiao stations. However, as the operation of the reservoir group in the upper reach is being continuously used, the low-flow channels in the middle and lower reaches of the Yangtze River have been further scoured. Thus, the siltation along the inflow channel of Dongting Lake has become more obvious than before, and it has resulted in a decrease in the inflow volume during the dry period. Furthermore, the inflow volume from the main stream of the Yangtze River has also decreased. As a result, the lowest water level at the Xiaohezui station has exhibited a mild downward trend.
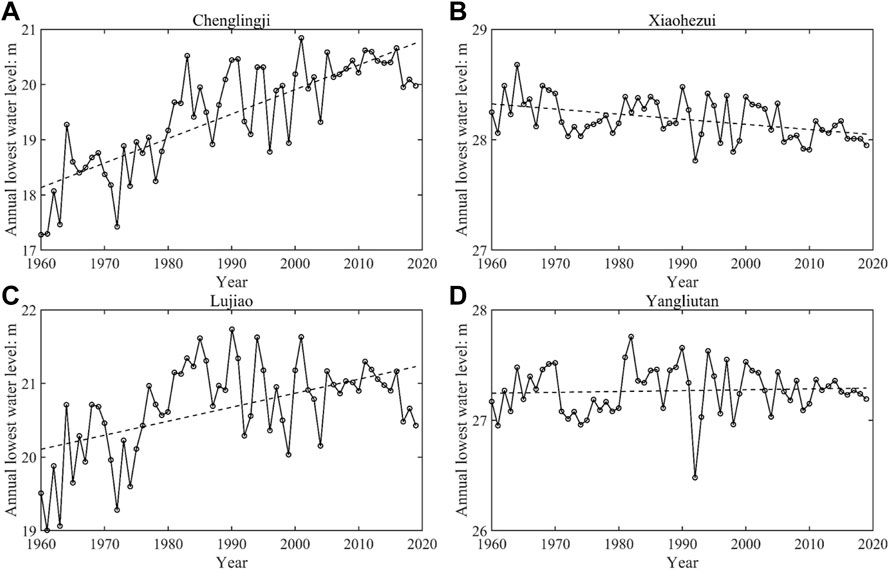
FIGURE 10. Process diagram of annual lowest water level of each station in the Dongting Lake area (A) Chenglingji; (B) Xiaohezui; (C) Lujiao; (D) Yangliutan.
4.2 Safety Indices of Irrigation and Water Supply for Urban and Rural Uses in the Lake Area
4.2.1 Water Supply Safety Index for Urban and Rural Uses
There is one water plant that draws water from the Dongting Lake, whose annual intake is 12 million cubic meters and the elevation is at 27.66 m. With the nearby Yangliutan station selected as the representative station, the safety index of water level after conversion is 27.66 m.
4.2.2 Water Level Safety Index for Agricultural Irrigations
A total of 26 polders drawing water from the lake basin are distributed along the Dongting Lake (Figure 11). Water intake facilities and agricultural water conservancy facilities, such as internal pumping stations and irrigation canals, have mostly been completed before the operation of the Three Gorges Reservoir. Some of the polders have been built or rebuilt in recent years, and certain emergency measures have been implemented for drought resistance. Based on the elevation of irrigation sluice slab of each polder, the lowest elevation value for each polder in the western, southern, southeastern, and northeastern Dongting Lake subregions were selected as the control water levels to realize self-flow and water diversion in that polder. Meanwhile, the maximum value of the control value out of all the polders in each subregion was considered as the control value of the lowest water level for self-flow irrigation for each subregion. After conversion, the required water levels for irrigation at the representative stations in each subregion are listed in Table 5.

FIGURE 11. Required water levels for irrigation of the polders in the Dongting lake.
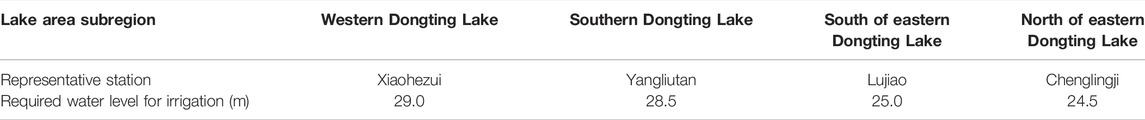
TABLE 5. Required water levels for irrigation in the Dongting Lake area.
4.3 Evaluation on Water Supply Safety for Irrigation and Urban and Rural Uses
4.3.1 Evaluation on Water Supply Safety for Urban and Rural Uses
The safety water level of urban and rural water supply in Dongting Lake area at the Yangliutan station is 27.66 m. From historical statistical water level data at the Yangliutan station, the fulfillment of safety water supply before the operation of the Three Gorges Reservoir (from 1960 to 2002) was more than 95%, while after the operation, it dropped to 82%, with an average annual water shortage of 32 × 104 m3.
4.3.2 Evaluation on Water Supply Safety for Irrigation
Based on the long-term measurement of water level at Xiaohezui, Yangliutan, Lujiao, and Chenglingji stations, which are the representative stations of each subregion in the lake area, the fulfillment of intake water level for irrigation and water shortage were analyzed, as shown in Figure 12. From 1960 to 2002, the fulfillment of the water level requirement for irrigation of the polders in Dongting Lake area was relatively high (average level of 78%). The long-term average annual water shortage was 5768.3 × 104 m3. For the western, southern, southeastern, and northeastern Dongting Lake area subregions, the fulfillment of the irrigation water level requirements were 81.0%, 79.2%, 78.4%, and 71.3%, respectively. Compared with other subregions, the lowest level of fulfillment was found in the north part of the eastern subregion of the Dongting Lake area, followed by the south part of the same subregion. A decline of the fulfillment to the required water level for irrigation was observed from the west to the east throughout the lake area. From 2003 to 2019, the fulfillment of required water level for irrigation of polders in Dongting Lake decreased (with an average level of 45.6%). For the four defined subregions, the fulfillment decreased to 44.0%, 47.0%, 47.7%, and 40.0%, respectively. The north part of eastern Dongting Lake showed the lowest fulfillment value. Additionally, the average annual water shortage in the long term increased to 1.43 × 10⁸ m3, thus accounting for 10.69% of the average water demand from 2003 to 2019 (the absolute volume was 13.38 × 10⁸ m3). The main cause behind the decrease in the water level intended for irrigation and the aggravation of water shortage is attributed to the fact that the water level in the lake area decreased considerably during the water storage period (September and October) after the operation of the Three Gorges Reservoir. This made it difficult to meet the water supply demand for irrigation in the region. From the perspective of geological distribution, the northeastern Dongting Lake area has encountered the biggest threat in water supply owing to its proximity to the mainstream of the Yangtze River.
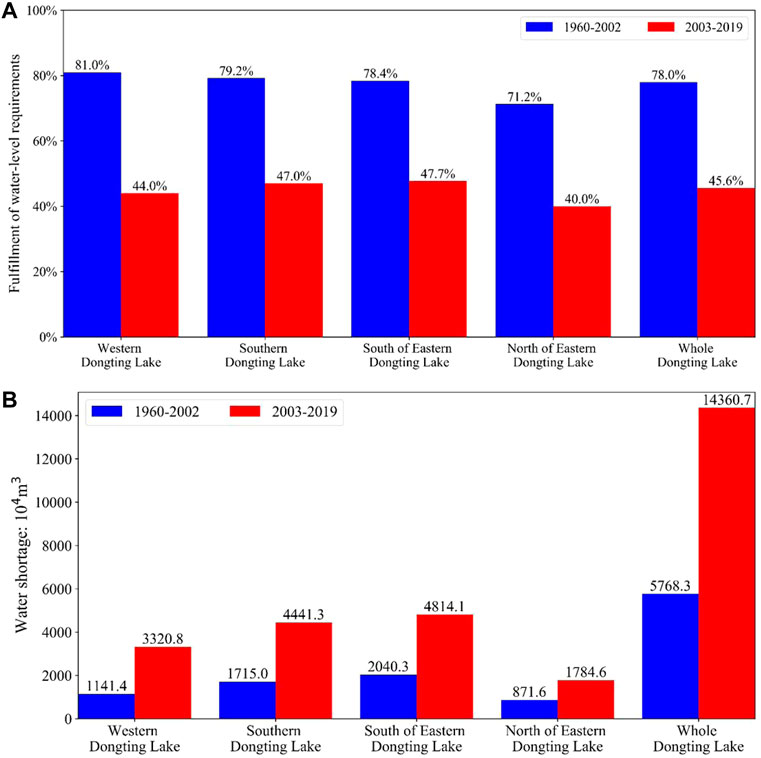
FIGURE 12. Fulfillment of water level requirements for irrigation and shortage volume of different subregions (A) Fulfillment of water level requirements for irrigation; (B) Water shortage.
4.4 Impact of Different Impoundment Plans on Water Level and Water Supply Safety
The multiyear monthly average water level process and the corresponding reduction calculations at the Chenglingji station from August to November with different impoundment plans are shown in Figure 13. Compared with the water level from reduction calculations, the decrease in the water levels from different plans with respect to the involved months are listed in Table 6. In the case of plan 1, as the water storage in August was relatively small during the flood season of the Yangtze River, the water level at the Chenglingji station was affected to a lower extent (reduced by 0.05 m). In September and October, water storage reached its top capacity. Specifically, with plan 1, the storage in October was larger than that with the other two plans. Hence, the water levels in September and October were affected considerably, and a drop of 1.43 m in October was the largest among the three plans. In the case of plan 2, the impoundment in August was advanced, and the water storage was thus larger than that of the other two plans. As a result, the water level dropped 0.32 m in August, which was the largest among the three plans. Although water storage in September was less than that with plan 1, the decrease in the water level in September in the case of plan 2 (0.99 m) was still larger than that of plan 1 (0.96 m) owing to the low-water level in August. In the case of plan 3, water storage levels in August, September, and October were larger than their corresponding volumes with the other two plans; thus, the water level drop was found to be the smallest. However, as the impoundment was still ongoing in November, a considerable water level decrease was observed. The largest decrease among the three plans was 0.91 m.
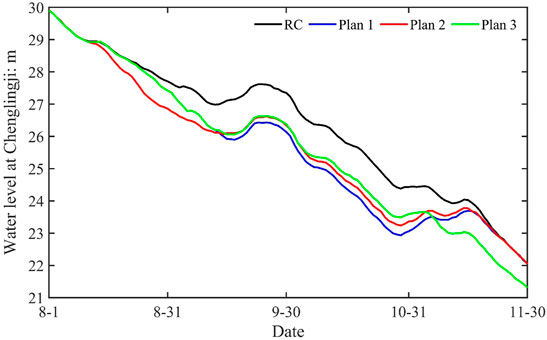
FIGURE 13. Water level process at the Chenglingji station with different impoundment plans.
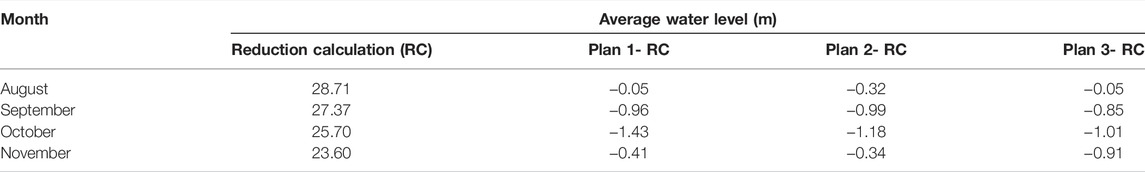
TABLE 6. Variation of average water level by month at Chenglingji station with different impoundment plans.
From the water level process (Figure 13), for plan 1, the water level was affected in late August, and decreased rapidly from the middle (mid) of September to end-October. For plan 2, the water level was affected as early as the middle of August, and the impact on the water level before mid-September was the greatest among the three plans, while the water level reduction rate from mid-September to end-October was relatively small. For plan 3, the impact on the water level was the least before end-October, and the impact on the water level in November was considerable. In summary, the later the stage the impoundment is performed, the less prominent the early impact will be, while the opposite applies for later impacts. On the contrary, the earlier the impoundment is performed, the earlier the influence on the water level will be exhibited, but the magnitude of the influence will be reduced.
Compared with the current water storage schedule (plan 1), the other two plans are able to adjust the water supply capacity in the lake area via advanced or delayed impoundment schedules. Compared with plan 1, plan 2 reduced the water level in the lake area in August, the month during which the water level in the lake area was relatively high; accordingly, this had a minor impact on the water intake. The average water level in the lake area from September to October increased by 0.11 m, and thus, benefited from this plan. This could raise the irrigation and water supply capacity of the Dongting Lake by 1.3%, and would mainly affect the north part of the eastern Dongting Lake area. Conversely, the postponed impoundment in plan 3 prolonged the influence time of the water level decreases, and resulted in a larger drop in water levels in November. However, given that the demand for irrigation water in the lake area was smaller after October, a decreased water level has a minor impact on irrigation. On the contrary, while the water level increased by 0.27 m from September to October, the water supply for irrigation could experience boosts of 7 MCB in volume and 1.4% in the water supply capacity. Therefore, to alleviate the impact from impoundment of the Three Gorges Reservoir on the utilization of water resources in Dongting Lake area, it is necessary to store as much water as possible in the season when larger volumes of inflow are expected from the main stream of the Yangtze River, and minimize the water storage while increasing the discharge during the irrigation period from September to October in the lake area.
5 Conclusion
The farmland polders in the Dongting Lake area in the middle reaches of the Yangtze River draw water from the lake area. Since the operation of the Three Gorges Project, the hydrological situation of the Dongting Lake area has been modified, and it had a direct impact on the irrigation and water supply of the lake area. We used Dongting Lake as a case study to investigate the changes of water volume and level before and after the operation of the Three Gorges Project, as well as their effects on irrigation and urban and rural water supply in the lake area. The main conclusions are as follows:
(1) Before and after the operation of the Three Gorges Project, the inflow runoff volume, outflow runoff volume, and water storage changes of the Dongting Lake experienced notable changes, especially from September to October. Compared with 1960–2002, the inflow runoff volume of the Dongting Lake during 2003–2019 decreased by 445.9 × 10⁸ m3 and accounted for 17.5%. From September to October, the decrease was the most noticeable (volume: 186.1 × 10⁸ m3, or equivalently: 41.8%). Between the two observation phases, the outflow runoff volume decreased from 2848.0 × 108 m3 to 2427.9 × 108 m3, and the average annual water storage change in the lake area decreased from −303.3 × 10⁸ m3 to −329.1 × 10⁸ m3.
(2) After the operation of the Three Gorges Project, the amount of water in the Dongting Lake area decreased from July to December (peaked in September and October) from 53.1 × 10⁸ m3 and 29.6 × 10⁸ m3 to 36.4 × 10⁸ m3 and 15.5 × 10⁸ m3 (with equivalent decreased proportions of 31.5% and 41.7%, respectively). Even though the available water was reduced, the demand for domestic water and irrigation water could still be met. However, this downward trend should be considered a potential threat to the utilization of water resources in the future.
(3) After the operation of the Three Gorges Project, the average water level at different stations in the Dongting Lake area decreased in the second half of the year with values in the ranges of 0.9–2.0 m in October and 0.8–1.2 m in September (top-ranked months). Affected by the decrease of the water level in the lake area, the fulfillment rate of the safety water level of supply after the operation of the Three Gorges Reservoir decreased from 95% to 82% with an average annual water shortage of 32 × 104 m3. Additionally, the fulfillment of irrigation water level requirements decreased from 78% to 46%, and the total water shortage increased from 5768.3 × 104 m3 to 14,360.7 × 104 m3.
(4) By advancing or postponing the impoundment of the Three Gorges Reservoir, the water level decrease in the lake area from September to October can be reduced, its impact on irrigation and water supply in the lake area from September to October can be alleviated, and the water supply capacity can be respectively increased by approximately 1.3% and 1.4%.
This study can be utilized in the water resources management to guarantee the safety of irrigation and water supply for the Dongting Lake area. However, some factors must be investigated in future works. 1) The impact of the solutions of early or postponed impoundment of the Three Gorges Project on other fields, such as hydropower and flood defying, should be assessed. 2) Several studies has been suggesting the use of both engineering and non-engineering based solutions to overcome the negative impacts of large water projects. The effects of these solutions must be further analyzed. 3) Only the impact of the Three Gorges Project was discussed in this study, the impact of other human activities on climate change should be researched in the future works.
Data Availability Statement
The original contributions presented in the study are included in the article/Supplementary Material, further inquiries can be directed to the corresponding author.
Author Contributions
Full text written by JF; YL put forward the research ideas; DW and SX contributed to data processing and graph rendering.
Funding
The study was financially supported by the Fundamental Research Funds for Central Public Welfare Research Institutes (No. CKSF2019197/SZ and No.CKSF2019490/SZ).
Conflict of Interest
The authors declare that the research was conducted in the absence of any commercial or financial relationships that could be construed as a potential conflict of interest.
Publisher’s Note
All claims expressed in this article are solely those of the authors and do not necessarily represent those of their affiliated organizations, or those of the publisher, the editors and the reviewers. Any product that may be evaluated in this article, or claim that may be made by its manufacturer, is not guaranteed or endorsed by the publisher.
References
Chen, Z., Wang, Z., Finlayson, B., Chen, J., and Yin, D. (2010). Implications of Flow Control by the Three Gorges Dam on Sediment and Channel Dynamics of the Middle Yangtze (Changjiang) River, China. Geology 38 (11), 1043–1046. doi:10.1130/g31271.1
Dai, M., Wang, J., Zhang, M., and Chen, X. (2017). Impact of the Three Gorges Project Operation on the Water Exchange between Dongting Lake and the Yangtze River. Int. J. Sediment Res. 32 (4), 506–514. doi:10.1016/j.ijsrc.2017.02.006
Dai, Z., and Liu, J. T. (2013). Impacts of Large Dams on Downstream Fluvial Sedimentation: An Example of the Three Gorges Dam (TGD) on the Changjiang (Yangtze River). J. Hydrology 480, 10–18. doi:10.1016/j.jhydrol.2012.12.003
Du, Y., Xue, H.-P., Wu, S.-J., Ling, F., Xiao, F., and Wei, X.-H. (2011). Lake Area Changes in the Middle Yangtze Region of China over the 20th Century. J. Environ. Manag. 92 (4), 1248–1255. doi:10.1016/j.jenvman.2010.12.007
Fan, Q., Zhu, H., and Geng, J. (2015). Monitoring Result Analyses of High Slope of Five-Step Ship Lock in the Three Gorges Project. J. Rock Mech. Geotech. Eng. 7 (2), 199–206. doi:10.1016/j.jrmge.2015.02.007
Feng, M., Liu, P., Guo, S., Shi, L., Deng, C., and Ming, B. (2017). Deriving Adaptive Operating Rules of Hydropower Reservoirs Using Time-Varying Parameters Generated by the EnKF. Water Resour. Res. 53 (8), 6885–6907. doi:10.1002/2016wr020180
Feng, Y., Zheng, B.-H., Jia, H.-F., Peng, J.-Y., and Zhou, X.-Y. (2021). Influence of Social and Economic Development on Water Quality in Dongting Lake. Ecol. Indic. 131, 108220. doi:10.1016/j.ecolind.2021.108220
Gao, B., Yang, D., and Yang, H. (2013). Impact of the Three Gorges Dam on Flow Regime in the Middle and Lower Yangtze River. Quat. Int. 304, 43–50. doi:10.1016/j.quaint.2012.11.023
Gao, Y., Xie, Y.-H., and Zou, D.-S. (2020). Hydrological Regime Change and its Ecological Responses in East Dongting Lake, China. Ecohydrol. Hydrobiology 20 (1), 142–150. doi:10.1016/j.ecohyd.2019.07.003
Geng, M., Wang, K., Yang, N., Li, F., Zou, Y., Chen, X., et al. (2021a). Evaluation and Variation Trends Analysis of Water Quality in Response to Water Regime Changes in a Typical River-Connected Lake (Dongting Lake), China. Environ. Pollut. 268, 115761. doi:10.1016/j.envpol.2020.115761
Geng, M., Wang, K., Yang, N., Li, F., Zou, Y., Chen, X., et al. (2021b). Spatiotemporal Water Quality Variations and Their Relationship with Hydrological Conditions in Dongting Lake after the Operation of the Three Gorges Dam, China. J. Clean. Prod. 283, 124644. doi:10.1016/j.jclepro.2020.124644
Guo, S., Xiong, L., Zha, X., Zeng, L., and Cheng, L. (2021). Impacts of the Three Gorges Dam on the Streamflow Fluctuations in the Downstream Region. J. Hydrol. 598 (3), 126480. doi:10.1016/j.jhydrol.2021.126480
Han, D., Huang, G., Liu, L., Zhai, M., Fu, Y., Gao, S., et al. (2022). Unveiling Direct and Indirect Impacts of the Three Gorges Project for Supporting Synergistic Water-Power Management. J. Clean. Prod. 338, 130547. doi:10.1016/j.jclepro.2022.130547
Huang, Y., Wang, J., and Yang, M. (2019). Unexpected Sedimentation Patterns Upstream and Downstream of the Three Gorges Reservoir:Future Risks. Int. J. Sediment Res. 34 (02), 108–117. doi:10.1016/j.ijsrc.2018.05.004
Lai, X., Chen, H., Hou, Y., Finlayson, B., Li, M., and Chen, J. (2021). Lowering Water Level of Dongting Lake of the Mid-Yangtze River in Response to Large-Scale Dam Construction: A 60-Year Analysis. Geomorphology 391, 107894. doi:10.1016/j.geomorph.2021.107894
Lai, X. J., and Wang, Z. M. (2017). Flood Management of Dongting Lake after Operation of Three Gorges Dam. Water Sci. Eng. 10 (004), 303–310. doi:10.1016/j.wse.2017.12.005
Lai, X., Liang, Q., Huang, Q., Jiang, J., and Lu, X. X. (2016). Numerical Evaluation of Flow Regime Changes Induced by the Three Gorges Dam in the Middle Yangtze. Hydrol. Res. 47 (S1), 149–160. doi:10.2166/nh.2016.158
Lai, X., Liang, Q., Jiang, J., and Huang, Q. (2014). Impoundment Effects of the Three-Gorges-Dam on Flow Regimes in Two China's Largest Freshwater Lakes. Water Resour. Manage 28 (14), 5111–5124. doi:10.1007/s11269-014-0797-6
Lei, X., Gao, L., Wei, J., Ma, M., Xu, L., Fan, H., et al. (2021). Contributions of Climate Change and Human Activities to Runoff Variations in the Poyang Lake Basin of China. Phys. Chem. Earth, Parts A/B/C 123, 103019. doi:10.1016/j.pce.2021.103019
Tang, J., Li, Y., Sun, Z., and Guo, X. (2010). Preliminary Study on the Changes of Water Levels at Chenglingji Station after the Impoundment of the Three Gorges Project (TGP). J. Basic Sci. Eng. 18 (2), 273–280. doi:10.3969/j.issn.1005-0930.2010.02.0010
Tang, X., Tong, S., Huang, G., Xu, G., Li, X., Lei, K., et al. (2021). Characteristics of Sedimentation and Channel Adjustment Linked to the Three Gorges Reservoir. Int. J. Sediment Res. 36 (02), 177–189. doi:10.1016/j.ijsrc.2020.10.003
Wang, J., Sheng, Y., Gleason, C. J., and Wada, Y. (2013). Downstream Yangtze River Levels Impacted by Three Gorges Dam. Environ. Res. Lett. 8 (4), 044012. doi:10.1088/1748-9326/8/4/044012
Wang, J., Sheng, Y., and Tong, T. S. D. (2014). Monitoring Decadal Lake Dynamics across the Yangtze Basin Downstream of Three Gorges Dam. Remote Sens. Environ. 152, 251–269. doi:10.1016/j.rse.2014.06.004
Wang, L., Li, Z., Wang, D., Chen, J., Liu, Y., Nie, X., et al. (2021). Unbalanced Social-Ecological Development within the Dongting Lake Basin: Inspiration from Evaluation of Ecological Restoration Projects. J. Clean. Prod. 315, 128161. doi:10.1016/j.jclepro.2021.128161
Wu, H., Zeng, G., Liang, J., Chen, J., Xu, J., Dai, J., et al. (2017). Responses of Landscape Pattern of China's Two Largest Freshwater Lakes to Early Dry Season after the Impoundment of Three-Gorges Dam. Int. J. Appl. Earth Obs. Geoinf. 56, 36–43. doi:10.1016/j.jag.2016.11.006
Xu, K., and Milliman, J. D. (2009). Seasonal Variations of Sediment Discharge from the Yangtze River before and after Impoundment of the Three Gorges Dam. Geomorphology 104 (3), 276–283. doi:10.1016/j.geomorph.2008.09.004
Xu, X., Tan, Y., and Yang, G. (2013). Environmental Impact Assessments of the Three Gorges Project in China: Issues and Interventions. Earth Sci. Rev. 124, 115–125. doi:10.1016/j.earscirev.2013.05.007
Xue, J., Papadimitriou, E., Reniers, G., Wu, C., Jiang, D., and van Gelder, P. H. A. J. M. (2021). A Comprehensive Statistical Investigation Framework for Characteristics and Causes Analysis of Ship Accidents: A Case Study in the Fluctuating Backwater Area of Three Gorges Reservoir Region. Ocean. Eng. 229, 108981. doi:10.1016/j.oceaneng.2021.108981
Yang, S. L., Milliman, J. D., Xu, K. H., Deng, B., Zhang, X. Y., and Luo, X. X. (2014). Downstream Sedimentary and Geomorphic Impacts of the Three Gorges Dam on the Yangtze River. Earth Sci. Rev. 138, 469–486. doi:10.1016/j.earscirev.2014.07.006
Yuan, Y., Zeng, G., Liang, J., Huang, L., Hua, S., Li, F., et al. (2015). Variation of Water Level in Dongting Lake Over a 50-Year Period: Implications for the Impacts of Anthropogenic and Climatic Factors. J. Hydrol. 525, 450–456. doi:10.1016/j.jhydrol.2015.04.010
Yuan, Z., Wu, D., Niu, L., Ma, X., Li, Y., Hillman, A. L., et al. (2021). Contrasting Ecosystem Responses to Climatic Events and Human Activity Revealed by a Sedimentary Record from Lake Yilong, Southwestern China. Sci. Total Environ. 783, 146922. doi:10.1016/j.scitotenv.2021.146922
Zhong, Z., and Yu, Q. (2015). Study of Water Quantity Optimization and Regulation Project of Dongting Lake and Poyang Lake. Yangtze River 46 (19), 52–57. doi:10.16232/j.cnki.1001-4179.2015.19.014
Keywords: hydrological regime evolution, irrigation and water supply safety, three Gorges project, Dongting Lake, impact of impoundment plans
Citation: Fang J, Li Y, Wang D and Xie S (2022) Modified Hydrological Regime on Irrigation and Water Supply in Lake Areas: A Case Study of the Yangtze River–Dongting Lake. Front. Earth Sci. 10:888729. doi: 10.3389/feart.2022.888729
Received: 03 March 2022; Accepted: 14 April 2022;
Published: 02 May 2022.
Edited by:
Xijun Lai, Nanjing Institute of Geography and Limnology (CAS), ChinaCopyright © 2022 Fang, Li, Wang and Xie. This is an open-access article distributed under the terms of the Creative Commons Attribution License (CC BY). The use, distribution or reproduction in other forums is permitted, provided the original author(s) and the copyright owner(s) are credited and that the original publication in this journal is cited, in accordance with accepted academic practice. No use, distribution or reproduction is permitted which does not comply with these terms.
*Correspondence: Yitian Li, MzU5Njg5MTM1QHFxLmNvbQ==