 Shengdong Zhu1
 Ziyi Bai
 Zhuoting Gan
 Chong Zhang
94% of researchers rate our articles as excellent or good
Learn more about the work of our research integrity team to safeguard the quality of each article we publish.
Find out more
ORIGINAL RESEARCH article
Front. Earth Sci., 15 September 2022
Sec. Environmental Informatics and Remote Sensing
Volume 10 - 2022 | https://doi.org/10.3389/feart.2022.887043
This article is part of the Research TopicMethods and Applications in Environmental Informatics and Remote SensingView all 9 articles
With the development of deep learning and big data technology, artificial neural network methods are used to simulate new areas with high potential to develop tourist attractions. They break through the limitation of the lifespan development of domestic tourist attractions and improve the credibility of results caused by the sample size and scale effect. This study applied the data for 906 scenic spots in Northwest China by a geographic detector model and deep learning technology to explore the dominant factors explaining their spatial distribution under the optimal research spatial scale and to simulate new areas with a high potential for development as tourist attractions. The main conclusions of this study were as follows. 1) The results were more reliable for Northwest China under a research spatial scale of 150 km × 150 km. 2) The leading factors affecting the development of tourist attractions in Northwest China were normalized difference vegetation index (NDVI), distance from the city, population, and transportation accessibility. 3) The results identified areas that are highly suitable for tourist attractions, showed regional maturity in either the natural environment or social development. This study can act as a reference for further exploration and the application of artificial intelligence technology in scenic spots.
Scenic spots are the core destinations of tourism. China classifies scenic spots in the descending order of quality into 5A-level tourist attractions, 4A-level tourist attractions, 3A-level tourist attractions, 2A-level tourist attractions, and 1A-level tourist attractions, especially high-level tourist attractions [4A and 5A tourist attractions are defined as high-level tourist attractions (Ge, 2018)]. This classification has great influence and plays an important role in the development of tourism. High-level tourist attractions are becoming increasingly popular, and many tourists have already traveled to the high-level tourist attractions, resulting in a shortened development life of the tourist attractions. Therefore, there is an urgent need to reduce pressure on these tourist attractions by developing new tourism areas. The identification of areas with high potential for tourism development can be achieved through model simulation.
There have been fruitful research results in the research on tourist attractions at home and abroad. They mainly include the price system of scenic spots (Zhu et al., 2020; Wang et al., 2021), the energy consumption of different types of scenic spots (Hu et al., 2016), the satisfaction of tourists (Ge, 2018; Bai et al., 2019; Liu and Hao, 2020), the spatial behavior of tourists in scenic spots (Wu et al., 2017; Wang et al., 2018), the smart tourism scenic spot system (Zhu and Chen, 2008; Xie et al., 2021), and the spatial structure of scenic spots based on fractal theory (Wu et al., 2013; Li et al., 2018). Domestic scholars’ research mainly focuses on the spatial distribution pattern, spatial structure characteristics, and the influencing factors of scenic spots. For example, Wu et al. took the first batch of 4A-level tourist attractions as an example to analyze their spatial structure and the regular distance differentiation with different scale customer source markets (Wu et al., 2011; Zhu et al., 2019); Fengjiao et al. have shown that the spatial distribution of China’s 4A-level tourist attractions has an obvious coupling relationship with the regional economic level and the level of urban development (Fengjiao and Wang, 2014); Zhu Hong et al. believe that China’s A-level tourist attractions are highly correlated in space with population, regional economic development level, terrain, traffic, etc., (Zhu and Chen, 2008; Cheng and Hu, 2014); and Wu Qing et al. believe that topography, lake water system, social and economic level, traffic conditions, and population distribution are the dominant factors affecting the spatial distribution of tourist attractions (Wu et al., 2017; Tang et al., 2018).
On the whole, when scholars analyzed the spatial distribution and the influencing factors of tourist attractions in the past, they concluded that the dominant factors affecting the spatial distribution of tourist attractions are natural environment, social economy, and policy factors. But in the analysis of influencing factors, they have rarely considered the spatial scale, and this negligence is dangerous as the identification of the contributions of different influencing factors depends on the spatial scale used. Most previous studies did not comprehensively consider the optimal spatial scale and applied a spatial scale of county level or municipal administrative divisions for mathematical calculation. In addition, studies generally have not simulated the spatial pattern of scenic spots and have not considered the development of new tourism areas. Research methods mainly focus on the application of geographic information system (GIS) spatial analysis technology, mathematical statistics, and the geographic detector model; these studies have not yet attempted the application of new technologies to the simulation of scenic spots, such as deep learning methods in machine learning.
The northwest region of China is an important strategic location within the broader development of western China. This region contains valuable tourism resources due to its unique geography, with proportions of 5A, 4A, and 3A scenic spots accounting for 3.31%, 32.34%, and 64.35% of all 906 scenic spots in the region, respectively (Figure 1). The tourism industry in the northwest region has gradually become increasingly important (Wei et al., 2020; Yang et al., 2022). But there remain few previous studies on tourist attractions in Northwest China (Xu et al., 2020). This is partly because of the difficulty in obtaining the positioning information for scenic areas, particularly in Xinjiang, Qinghai, and other places. The geographic locations of a few scenic spots have been obtained through telephone inquiries and positioning technology. In addition, in comparison with s China, the development of the tourism economy and tourism marketing in Northwest China remains relatively immature. The scenic spots in Northwest China not only remain few in number and poorly developed but also there is no obvious regularity in their distribution (Figure 1).
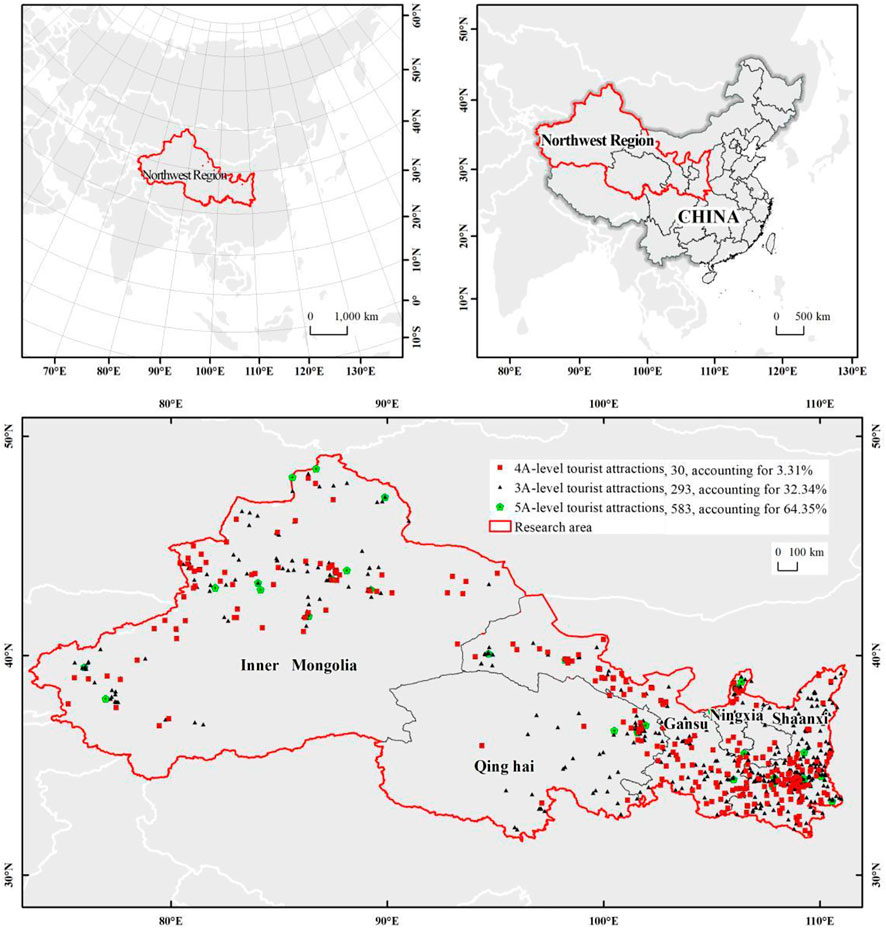
FIGURE 1. Spatial distribution of 3A-level and above scenic spots in Northwest China.
The present study attempts to make innovative attempts in two aspects: 1) an attempt to identify the optimal spatial scale for the study area under which the optimal reliability of the research results could be obtained and 2) to apply deep learning technology to simulated areas with a high potential for development as scenic spots. The research idea of this study is as follows: to identify the contributions of natural and socioeconomic factors to the spatial distribution of tourist attractions under different spatial scales. In this way, by identifying the optimal spatial scale and the dominant factors affecting the spatial distribution of tourist attractions in Northwestern China, deep learning technology was then applied to predict areas of high suitability for development as new scenic spots. The present study examined the spatial differentiation of tourist attractions in Northwest China because of its complex geographic environmental conditions. It is hoped that the results of the present study can contribute to the optimization of tourist attractions in the region to drive economic development and provide reference for tourism in other regions around the world.
In the study area, there are 30 5A-level scenic spots, accounting for 3.31%, 293 4A-level scenic spots, accounting for 32.34%, and 583 3A-level scenic spots, accounting for 64.35%. Because the influence of 5A-level scenic spots is much greater than that of 3A-level scenic spots and the number of 5A-level scenic spots is relatively small. Therefore, in order to accurately express the actual situation of scenic spots (Huang and Bian, 2009; Cheng et al., 2013), this study uses the influence degree F of scenic spots to represent the spatial distribution of scenic spots in the study area, that is, change the number of scenic spots in the original statistical unit window to the scenic spot influence degree F of the statistical unit window. The influence degree F of the scenic spot is calculated as follows:
where F is the influence degree of scenic spots in Northwest China; M1, M2, and M3, respectively, represent the number of 5A scenic spots, 4A scenic spots, and 3A scenic spots in a region; W1, W2, and W3, respectively, represent the weight of 5A-level scenic spot, 4A-level scenic spot, and 3A-level scenic spot in the study area; and S represents the area of scenic spots in a region. This study uses AHP, and after a series of decision-making and consistency tests, the weights are as follows: Table 1.
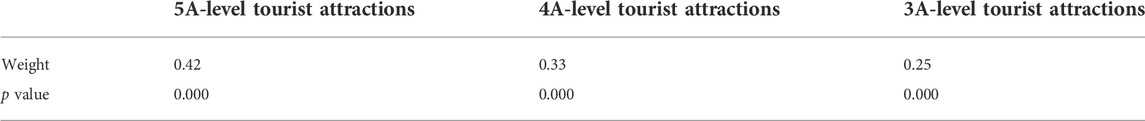
TABLE 1. Scenic spot weight statistics.
Geographic detector is an important method to detect the cause and mechanism of spatial pattern of geographical elements (Wang and Xu, 2017; Huo and Sun, 2021). This study uses the factor detector in the geographic detector to analyze the contribution rate of the factors affecting the spatial distribution of tourist attractions in Northwest China measured by the value of q-statistic, that is, the larger the value of q-statistic, the stronger the influence of factor X on tourist attractions, the smaller the value of q-statistic, the weaker the influence of factor X on tourist attractions, and the value of q-statistic means that X explains 100 × q% of the Y.
Deep learning is a new field in machine learning research and is currently widely applied in facial recognition, voice recognition, medical treatment, driverless vehicles, and geosciences (Cepeda-Pacheco and Domingo, 2022). Convolutional neural network (CNN) is an important algorithm used in deep learning (Liu and Tao, 2020). CNN consists of an input layer, a hidden layer with three sublayers (the convolutional, pooling, and fully connected sublayers), and an output layer and is characterized by a simple structure, few training parameters, and strong adaptability.
SqueezeNet is a classic variation of the CNN model, which can achieve the approximate effect of AlexNet on the ImageNet dataset (Liu and Tao, 2020) but with 50 times fewer parameters than AlexNet. Its core is the fire module, which consists of two layers, the SqueezeNet layer and the +expandNet layer. Among them, the SqueezeNet layer is a 1 × 1 convolutional layer, mainly used to reduce the number of input channels input to this module; the +expandNet layer contains 1 × 1 and 3 × 3 convolutional layers, mainly used for refusion and re-expression of data features so that more information can be retained; hence, it has the advantages of simple structure, high computational efficiency, and high accuracy (He et al., 2019). Therefore, the present study selected this network for simulation and prediction. First, the input layer and the first convolutional layer of SqueezeNet were modified to ensure that the input size and number of channels of the input layer could be customized according to the characteristics of the input image. This allowed for the number of channels of the first convolutional layer to equal the number of image bands. The fully connected Softmax and the classification layers were modified to obtain an output size of the fully connected layer of one. The Softmax and the classification layers were replaced by the regression layer. Please refer to the attachment for the specific code. Attachment 1 is the SqueezeNet modification code, Attachment 2 is the SqueezeNet training code, and Attachment 3 is the SqueezeNet prediction code.
Data for scenic spots in the five northwest provinces were obtained from the official websites of provincial tourism bureaus (the latest deadline for statistics is January 2018). The coordinates for the sites were determined through Google Earth, following which they were imported into ArcGIS. The Digital Elevation Model (DEM) data were obtained from the geospatial data cloud (https://www.gscloud.cn/). Data for administrative divisions; urban areas, including prefecture- and provincial capital city-level populations; river data, including first- to fifth-level rivers; and transportation data, including national, provincial, country highways, and railways, were obtained from the National Basic Geographic Information Database. Data for gross domestic product (GDP) and population were obtained from the Resource and Environmental Science Data Center of the Chinese Academy of Sciences (http://www.resdc.cn/). Data for the normalized difference vegetation index (NDVI) were obtained from the USGS website (https://lpdaac.usgs.gov/) and had a spatial resolution of 1,000 m.
The present study first identified the main factors affecting the spatial distribution of scenic spots in Northwest China. The geographic detector model was then used to explore the contributions of various factors to the distribution of scenic spots under different spatial scales (municipal, county, and 10 km × 10 km scales), and the leading factors affecting the spatial distribution of scenic spots in Northwest China were identified based on the optimal scale. Finally, deep learning technology was applied to predict areas with high suitability for the development as new scenic spots.
The present study chose seven factors as the main factors affecting the spatial distribution of scenic spots within the broad categories of natural environmental and socioeconomic factors. The natural environmental factors included NDVI (representative of vegetation coverage), DEM, and rivers, whereas the socioeconomic factors included transportation, cities, GDP, and population (Figure 2).
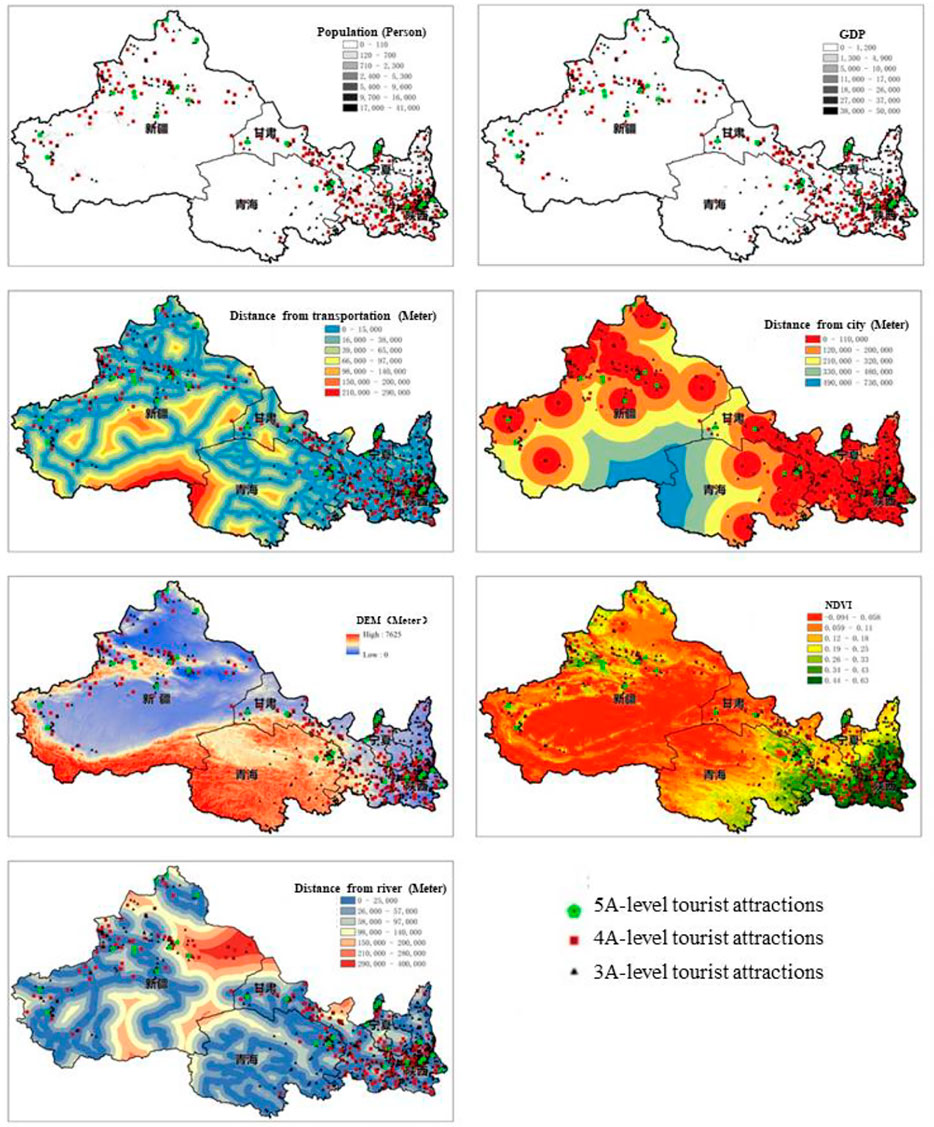
FIGURE 2. Overview of each impact factor.
Vegetation resources (represented by NDVI) are important qualities of scenic spots. The DEM represents the ground elevation of tourist spots, and elevation is an important characteristic of the natural landscape. River landscapes are important natural tourism resources. Cities act as hubs of resources, information, and energy and provide a gathering place for tourists as well as a foundation for tourism resources. The distance of human population from a city affects the flow of tourists to tourist attractions. As one of the six elements of tourism, the quality of transportation conditions not only restricts the accessibility of tourist attractions but also affects the development and distribution of tourist attractions. GDP is a representation of the level of regional, social, and economic development and the main driving force affecting the spatial distribution and the formation of regional tourist attractions. Tourist attractions in Northwest China are mainly visited by nearby communities and the population of Northwest China is relatively small. Therefore, scenic spots are usually distributed in areas close to human settlements. Consequently, the distribution of tourist attractions in Northwest China is to some degree correlated to the distribution of human settlements to facilitate travel and promote the development of scenic spots.
The attribution model has been widely used in geographic research in recent years, and the geographic detector model is an important method applied to detect the drivers and mechanisms of the spatial patterns of geographic elements (Wang and Xu, 2017). The results of the geographic detector model differ dramatically under different spatial scales, and most previous applications of the geographic detector model did not comprehensively consider the optimal spatial scale under which to apply the model. The present study applied the geographic detector model under various commonly used research scales, including administrative division-, city-, and county-level scales and a scale of 10 km × 10 km. The impact of each driving factor on the distribution of scenic spots was determined under each spatial scale to identify the contribution of each factor to tourist attractions.
The present study applied the geographic detector model under the administrative division-scale in Northwest China. The sampling tool of ArcGIS was used in which the influence F on scenic spot was taken as the Y factor, and the seven main influencing factors (transportation, rivers, cities, population, GDP, DEM, and NDVI) were taken as the X factors. Under this approach, 71 groups of sampling point data were obtained, which were input into the factor detector model of the geographic detector to identify the influence of each factor on the spatial distribution of tourist attractions (Table 2). The obtained value of q was proportional to the strength of the influence of factor X on tourist attractions. As shown in Table 2, the dominant factors affecting the spatial distribution of tourist attractions in Northwestern China were NDVI, GDP, and cities. The order of the factors with the greatest influence on the spatial distribution of tourist attractions was NDVI (0.4475) > GDP (0.4053) > cities (0.3298). Population, transportation, rivers, and the DEM had relatively minor influences on the distribution of tourist attractions.
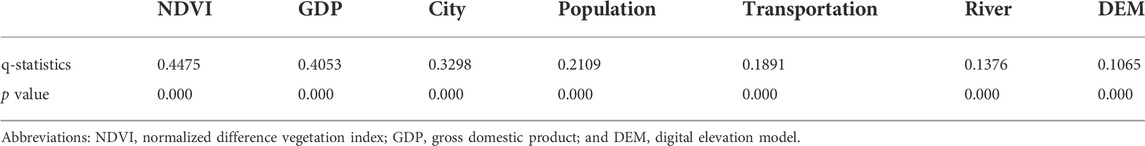
TABLE 2. Q-statistics table for the correlations between the various factors and the spatial distribution of scenic spots in Northwest China based on geographic detectors (scale size: municipal scope).
The approach taken to determine the contributions of influencing factors on the distribution of scenic spots at a county level in Northwest China was similar to that under the municipal level. Here, 287 groups of sampling point data were obtained and input into the factor detector model to identify the impact of each factor on the spatial distribution of scenic spots (Table 3). As shown in Table 3, the dominant factors affecting the spatial distribution of tourist attractions in Northwest China were cities and NDVI, in the order of city (0.4890) > NDVI (0.2931). In contrast, rivers, DEM, GDP, population, and transportation had relatively minor influences on the distribution of scenic spots. These results under a county scale differed from those under a municipal scale (Table 2), with the GDP factor having a strong impact under the latter scale but not under the former.
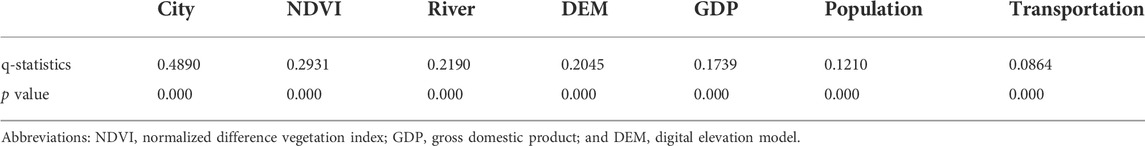
TABLE 3. Q-statistics table for the correlations between the various factors and the spatial distribution of scenic spots in Northwest China based on geographic detectors (scale size: county scope).
In theory, the authenticity of data and the experimental effect should increase with increasing sampling points. The present study investigated the contributions of various factors to the spatial distribution of tourist spots in Northwest China under a scale of 10 km × 10 km. Here, the 30,170 groups of sampling point data obtained were input into the geographic detector model to identify the influences of various factors on the spatial distribution of tourist attractions in Northwest China (Table 4). As shown in Table 4, the dominant factors affecting the spatial distribution of tourist attractions in the northwestern region were NDVI, cities, and transportation, with an order of NDVI (0.4657) > cities (0.4236) > transportation (0.3180). In contrast, population, river, GDP, and DEM had relatively minor influences on the spatial distribution of tourist spots. The results under this spatial scale were consistent with those under the municipal- and district-level spatial scales in that NDVI and cities were factors that affected the spatial distribution of scenic spots under all three spatial scales. However, the differences between results under the three scales related to the different degrees of influence of the remaining factors and their order of influence.

TABLE 4. Q-statistics table for the correlations between the various factors and the spatial distribution of scenic spots in Northwest China based on geographic detectors (scale size: 10 km × 10 km).
In summary, the results showed that the contributions of the different factors to the spatial distribution of scenic spots changed with changing spatial scale. The results indicated that optimal results can be obtained under a particular spatial scale.
The results aforementioned showed that the relationships between the influencing factors and the spatial distribution of scenic spots differ at different spatial scales. In addition, the spatial scale under which these relationships are examined determines the quantity of data available. The input of a large quantity of data under a small spatial scale to the geographic detector can easily result in the model experiencing an error and failing to execute. Therefore, the present study used Python scripting to conduct multiscale sampling in the study area to avoid scale-related errors in the results. A correlation analysis was used to select the optimal spatial scale unit under which to study the relationships between the influencing factors and the spatial scale of scenic spots in the study area.
The selection of the optimal spatial scale followed the procedure outlined below. First, the scenic spot influence F (see Section 2.1.1) was calculated under different spatial scales (nonoverlapping windows) within the study area. The mean value sequence of each factor in the window was then obtained, and the correlation analysis was performed on the sequence (Figure 3). The results showed that the variation in correlation coefficients of the F values of rivers, transportation, GDP, and population with the distribution of scenic spots increased with the increasing spatial scale, and all of the peaks appeared at a scale of 150 km.
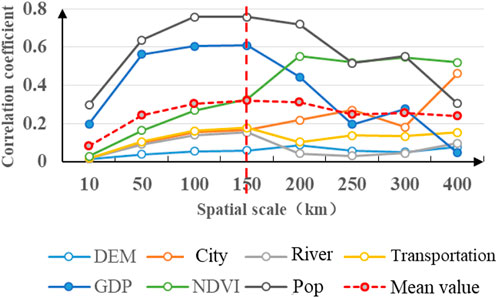
FIGURE 3. Correlations between the distribution of scenic spots in Northwest China and each influencing factor under different spatial scales. Abbreviations: NDVI, normalized difference vegetation index; GDP, gross domestic product; and DEM, digital elevation model.
Population has the strongest correlation with the distribution of scenic spots at various scales, followed by GDP, transportation, and rivers. The changes in the correlation coefficients between the spatial distribution of scenic spots and DEM, cities, and NDVI were both consistent and different. The correlation coefficients between the spatial distribution of scenic spots and NDVI and DEM were highest under a scale of 200 km, whereas those between the scenic spots and cities were highest under a spatial scale of 400 km. The rank of the three factors according to their correlations with the spatial distribution of scenic spots was NDVI > City > DEM. The mean value of the correlation coefficients between each factor and the spatial distribution of scenic spots under different spatial scales showed that a peak correlation coefficient occurred under a spatial scale of 150 km.
After setting the spatial scale to 150 km × 150 km, the 134 groups of sampling point data were obtained and input into the geodetector model. The results showed that the rank of factors according to their influence on the spatial distribution of scenic spots was NDVI (0.5958) > cities (0.4925) > population (0.3589) > transportation (0.3075) > rivers (0.1440)> DEM (0.1048) > GDP (0.0006) (Table 5). This result showed that NDVI, cities, population, and transportation were the dominant factors affecting the spatial distribution of scenic spots in Northwest China, whereas the remaining factors had relatively little influence.
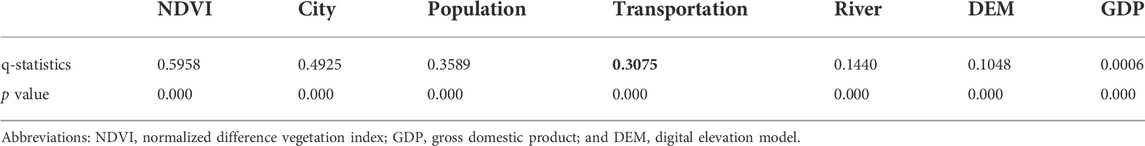
TABLE 5. Q-statistics table for the correlations between the various factors and the spatial distribution of scenic spots in Northwest China based on geographic detectors (scale size: 150 km × 150 km).
The relationships between the influencing factors and the spatial distribution of scenic spots showed both changes and similarities with the changing spatial scale, with the differences significantly exceeding the commonalities. Relationships that were common across all spatial scales included the strong influences of NDVI and cities on the spatial distribution of scenic spots in Northwest China. The differences were reflected in the degree of influence of some factors on the spatial distribution of scenic spots under different spatial scales. For example, while the GDP strongly influenced the spatial distribution of tourist spots under a city-level scale, it had a minor influence under a county-level scale. Transportation had a weak influence on the spatial distribution of scenic spots under the municipal- and county-level scales, whereas this factor strongly influenced the spatial distribution of scenic spots under a spatial scale of 10 km ×10 km. In addition, the contribution rate of each factor to the spatial distribution of scenic spots increased under an optimal research scale of 150 km × 150 km. Consequently, the Q statistics also increased, indicating more reliable research results under the optimal scale.
In summary, among the natural factors, green vegetation is important for promoting the popularity of scenic spots in Northwest China. Among the socioeconomic factors, the distance from the city, the number of people, and the accessibility of transportation play an extremely important role in the spatial distribution of tourist attractions.
Based on the dominant factors (NDVI, city, population, and transportation) affecting the spatial distribution of tourist attractions, new areas with high potential to develop tourist attractions are simulated and predicted, which will have an immeasurable role in the future development of tourism. Therefore, this study applies deep learning technology to simulate and predict the suitability of areas for development of high-level tourist attractions. Within the deep learning network, deep neurons are abstract representations of shallow neurons. The deep neurons learn the more abstract features of the influencing factors and can extract hidden information on the relationships between the spatial pattern of scenic spots and the influencing factors. This approach provides more reliable results compared to the traditional neural network algorithm.
The factors showing a strong influence on the spatial differentiation of high-level scenic spots (NDVI, city, population, and transportation) were then used as the predictors (characteristic variable X) of the spatial distribution of scenic spots (3A- to 5A-level tourist attractions; target variable Y). Sampling allowed for a sample dataset to be obtained that simulated the spatial characteristics of scenic spots. The sample dataset was input into the SqueezeNet model, and the model was trained over repeated iterations. Finally, the model was applied to predict the areas with high potential for development as scenic spots. The value obtained by the model for an area was proportional to its potential for development as a tourism spot (Figure 4).
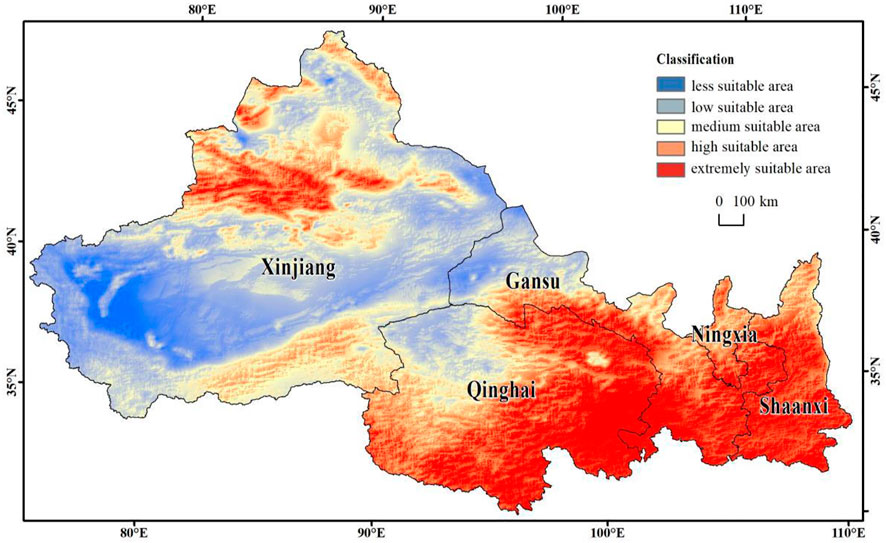
FIGURE 4. Deep learning predictions of areas in Northwest China with high potential for development as scenic spots.
The results showed that the southeast region in the area is highly suitable for the development of high-level scenic spots, whereas the northwest region is less suitable. The potential for the development of scenic spots was found to be high in the urban agglomerations in the Guanzhong Plain and Lanxi, followed by that on the northern slope of the Tianshan mountains and along the Yellow River in Ningxia. Southern Shaanxi, southern Ningxia, southern Gansu, and southeastern Qinghai were shown to be suitable for the development of high-level scenic spots, whereas southeastern Xinjiang, southeastern Qinghai, and northwestern Gansu were less suitable (Figure 4).
The population of an area was shown to be proportional to the suitability of that area for development as a high-level tourism spot. This result indicates that population plays an important role in the spatial distribution of tourist scenic spots in Northwest China. An average human population of ∼68 (unit:1,000 people) and 11 (unit: 1,000 people) were shown to be highly suitable and less suitable for the development of high-level tourist attractions, respectively. The NDVI of an area was shown to be proportional to the potential of the area to be developed into a high-level tourism spot. The average NDVIs of ∼0.32 and 0.06 were shown to be highly suitable and less suitable for the development of high-level tourist attractions, respectively. The potential of an area for development as a high-level tourism spot was shown to be inversely related to its distance from the nearest provincial- and prefecture-level city, with this relationship being more linear for prefecture-level cities. Distances of an area from a provincial capital city of ∼299 and 861 km were shown to be highly suitable and less suitable for the development of high-level tourist attractions, respectively. The potential of an area for development as a high-level tourism spot was inversely proportional to its distance from a national-, provincial-, or county-level highway. There was no clear relationship between the suitability of areas for development into high-level scenic spots and their proximity to railway lines. This can be attributed to most railway lines not extending into more remote areas in which scenic spots are typically found. Distances of an area of ∼50 km from a national road, 27 km from a provincial road, and 15 km away from a county road were shown to increase the suitability of that area for development into a high-level tourism spot. This result also reflects the importance of transportation links to tourist attractions and the distances of scenic spots from national, provincial, and county roads (Table 6).
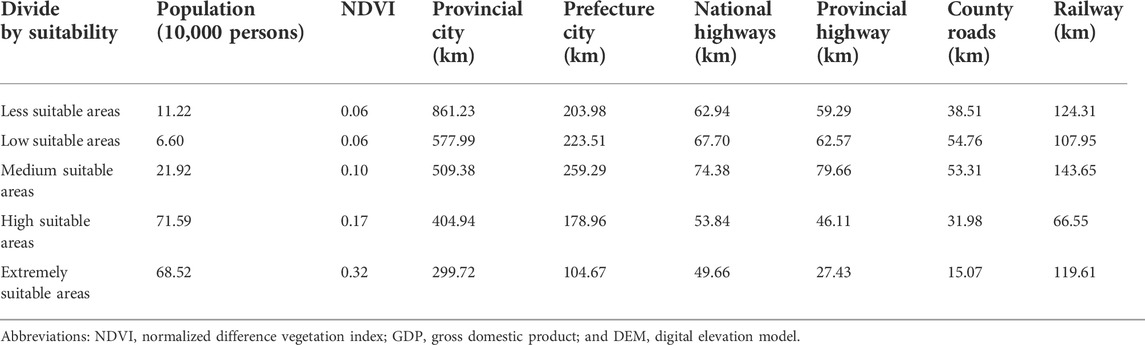
TABLE 6. Statistical summary of the application of deep learning to identify areas in Northwest China with high potential for development as scenic spots.
In summary, the areas that were highly suitable for development as high-level tourist attractions showed regional, environmental, or socioeconomic maturity and development; a large population; extensive vegetation coverage; close proximity to provincial capital city- and prefecture-level cities; and close proximity to national, provincial, and county roads.
The present study used data for 906 3A-level and aforementioned tourist attractions in Northwest China to identify the seven natural and socioeconomic factors (transportation, rivers, city, population, GDP, DEM, and NDVI) explaining the spatial distribution of scenic spots through the application of the geographic detector model. Relationships were investigated under municipal-, county-, and grid-level scales. The optimal spatial scale was identified, and this scale was used to identify the leading factors explaining the spatial distribution of scenic spots in Northwest China. The potential of new areas for development into high-level scenic spots were then simulated using deep learning technology. The main conclusions of the present study were as follows.
(1) There are differences and commonalities in the relationships between the factors and the spatial distribution of scenic spots under different spatial scales (city, county, and 10 km × 10 km scales), with the differences having a significantly greater influence than the commonalities. The optimal spatial scale for identifying the relationships between the influencing factors and the spatial distribution of scenic spots in Northwest China was found to be 150 km × 150 km.
(2) Under the optimal spatial scale (150 km × 150 km), the dominant factors affecting the spatial distribution of tourist attractions in Northwest China were vegetation coverage (NDVI), distance from cities (urban distribution), population, and transportation.
(3) The application of deep learning showed that the southeast region of the study area is more suitable for developing high-level scenic spots, whereas the northwest region is less suitable. In addition, areas showing high suitability for development into high-level scenic spots showed high environmental and socioeconomic maturity and development. Areas with high potential for development into scenic spots were characterized by a large population; large vegetation coverage; close proximity to provincial capital- and prefecture-level cities; and close proximity to national, provincial, and county roads.
(4) The northwest region should focus on building ecotourism in areas with great potential for tourism development, such as forest tourism, grassland tourism, marine tourism, and desert tourism, in order to promote the sustainable development of tourism.
The dominant factors affecting the spatial distribution of tourist attractions in the actual situation are basically consistent with the conclusions based on the optimal scale.
The development of tourism resources in Northwest China is more limited than that in other regions. Northwest China is characterized by high terrain and harsh climate conditions, with the Tianshan mountains in the north and the Himalayas in the south. Therefore, development of tourism resources in Northwest China faces more challenges compared to that in the southern region. Northwest China also has a vast area, a relatively small population, and relatively discrete distribution of urban centers. Scenic spots are typically distributed in areas not far from populated centers and cities. Therefore, these two factors play an extremely important role in the spatial distribution of tourist attractions in Northwest China. In addition, the unique geographical characteristics of Northwest China have resulted in accessibility to transport becoming an important factor affecting the spatial distribution and the formation of tourist attractions in the region, and this factor also plays an important role in promoting the development and scale of tourist attractions.
Green vegetation in the natural environment is an important factor promoting the quality of scenic spots. The quality of the ecological environment of a scenic spot is directly related to the viewing experience of tourists. The results of the present study showed that rivers and terrain were important landscape elements influencing the distribution of scenic spots. The geomorphology of the northwestern region is complex, and this region also experiences extreme climatic conditions. These climatic conditions and the steep inclines and high altitudes of mountain regions can pose a risk to the safety of tourists, thereby restricting the development of scenic spots to some extent. In addition, Northwest China has a lower distribution of rivers, resulting in a relatively lower performance of tourist attractions. Therefore, the results of the present study showed that rivers and topography had little influence on the spatial distribution of tourist attractions in Northwest China.
Deep learning method shows two characteristics not reflected in traditional learning methods. First, the deep learning method contains a higher number of hidden layers (6–10 layers). Second, feature learning is applied in the deep learning during which the original data features are transformed from one feature space to another through feature transformation at each layer. This approach simplifies the prediction and the classification process. In addition, the process of deep learning uses big datasets as samples, and not fictitious data. Therefore, deep learning is able to produce more realistic simulations. The convolutional neural network (CNN) in deep learning is to build a simple convolutional network for image recognition; this method reduced the complexity of the network and improved its efficiency. At the same time, this approach reduced model overfitting and improved simulation accuracy. Others used the CNN network to extract image features and have shown this method to have high accuracy (Cepeda-Pacheco and Domingo, 2022). The high accuracy of the method is expressed as sample information closer to real values (Liu and Tao, 2020). Under the CNN algorithm, many samples are trained through a supervised learning mode, whereas the model is fine-tuned against other samples to reduce model overfitting during training (He et al., 2019).
In recent years, the number of layers of CNN has been increasing, from 7-layer AlexNet to 16-layer VGGNet, then to 22-layer GoogleNet, 152-layer ResNet, and more complex networks with thousands of layers. Although the network performance has been improved, with it comes the problem of efficiency. The problem of efficiency mainly refers to the problem of model storage and model prediction calculation. Only by solving the problem of efficiency can the CNN go out of the laboratory and be more widely used in daily life. In this regard, the usual method is to compress on the already trained model so that the network carries fewer parameters, thus solving the memory and speed problems. In contrast, the main idea of the lightweight model is to design a more efficient “network computing method” so that the network parameters are reduced without excessive loss of network operations. This article mainly studies the application of convolutional network SqueezeNet in scenic spot adaptability assessment. Due to the advantages of high accuracy, less time-consumption, and limited personal computer configuration, the network can quickly iterate and try different settings during data training. Zhao et al. (2019) applied SqueezeNet to conduct forest fire detection research and also came to the same conclusion as aforementioned. Future research on scenic spots should apply more cutting-edge artificial intelligence science and technology, such as other neural network models of deep learning (Random Forest and Long Short-Term Memory Network). This would allow for the sustainable development of scenic spots.
The method proposed in the present study is an improvement to the traditional research methods used for studying tourist attractions. Previous studies of the spatial distribution of tourism attractions mostly applied mathematical statistics, GIS, and the analysis of influencing factors through geographic detectors. These studies suffer from a certain level of uncertainty due to the application of key technologies (Zhu and Chen, 2008; Wu et al., 2013; Wu et al., 2017; Li et al., 2018; Zhu et al., 2019; Xie et al., 2021). For example, the use of a geographic detector model to analyze the factors influencing the spatial distribution of scenic spots will provide different results under different spatial scales. Previous studies have generally examined these relationships under a county-level or municipal administrative regions spatial scale. Moreover, the geographic detector model requires an independent variable to be a categorical variable. Difference in the data discretization method within the quantification of different indicators to a unified scale will also lead to differences in results. When applying GIS sampling, the number of samples will increase as the spatial resolution increases. The geographic detector tends to give errors under a large quantity of sample data (Cheng and Hu, 2014; Fengjiao and Wang, 2014; Tang et al., 2018; Jia et al., 2019; Tang et al., 2019). The present study used Python scripting to conduct multiscale sampling in the study area. This approach allowed for the scale-dependence of the results to be avoided by selecting the most suitable spatial scale for sampling in the study area through a correlation analysis. Future research should consider a wider range of influencing factors in the model, such as policy factors, cultural factors, preferences of tourists, and other emotional factors, thereby increasing the accuracy of the model results and providing a solid scientific reference for the development of regional tourism according to local conditions. The use of deep learning methods is suitable for identifying new areas with high suitability for development into high-level scenic spots and is relatively novel within the field of tourism science (Liu et al., 2017; Romão et al., 2018; Wu et al., 2018). In addition, the present study identified new areas with a high potential for tourism development based on existing resources with the aim of sustainable tourism development (Blancas et al., 2011). Innovative green tourism should be promoted in these areas, such as ecotourism, agricultural tourism, forest tourism, grassland tourism, marine tourism, and desert tourism.
The original contributions presented in the study are included in the article/Supplementary Material; further inquiries can be directed to the corresponding author.
SZ contributed to the formal analysis, investigation, and writing—original draft. ZB, ZG, SJ, CZ, and JW contributed to the review of the original draft. All authors have read and agreed to the submitted version of the manuscript.
This research was funded by the Shaanxi Social Science Foundation Project in China (No. 2020D008), Shaanxi Natural Science Basic Research Program in China (No. 2021JM-513), and the Scientific Research Plan Project of Shaanxi Department of Education in China (No. 21JK0475).
The authors declare that the research was conducted in the absence of any commercial or financial relationships that could be construed as a potential conflict of interest.
All claims expressed in this article are solely those of the authors and do not necessarily represent those of their affiliated organizations, or those of the publisher, the editors, and the reviewers. Any product that may be evaluated in this article, or claim that may be made by its manufacturer, is not guaranteed or endorsed by the publisher.
Bai, Z. Y., Xue, L., and Yan, Y. (2019). Quantitative analysis of spatial distribution characteristics and influencing factors of tourist attractions based on GIS: A case of A-class tourist attractions in yunnan province. J. Yunnan Univ. Nat. Sci. Ed. 41 (05), 982–991. doi:10.7540/j.ynu.20180594 |
Blancas, F. J., Lozano-Oyola, M., González, M., Guerrero, F. M., and Caballero, R. (2011). How to use sustainability indicators for tourism planning: The case of rural tourism in Andalusia (Spain). Sci. Total Environ. 412–413, 28–45. doi:10.1016/j.scitotenv.2011.09.066 | |
Cepeda-Pacheco, J. C., and Domingo, M. C. (2022). Deep learning and Internet of Things for tourist attraction recommendations in smart cities. Neural comput. Appl. 34, 7691–7709. doi:10.1007/s00521-021-06872-0 |
Cheng, H., and Hu, W. (2014). Spatial structure of class A tourist attraction in chizhou. Sci. Geogr. Sin. 34 (10), 1275–1280. doi:10.13249/j.cnki.sgs.2014.10.021 |
Cheng, Q., Su, B., and Tan, J. (2013). Developing an evaluation index system for low-carbon tourist attractions in China– A case study examining the Xixi wetland. Tour. Manag. 36, 314–320. doi:10.1016/j.tourman.2012.10.019 |
Fengjiao, H., and Wang, D. (2014). The space organization and optimization of A-class scenic spots in Shaanxi province. Henan Sci. 32 (08), 1669–1673. doi:10.13537/j.issn.1004-3918.2014.08.063 |
Ge, L. (2018). Study on temporal and spatial characteristics of tourism preference of 4A and 5A scenic spots in Shanghai based on Baidu Index. Shanghai, China: Shanghai Normal University.
He, W., Chun, L., Nie, G., Jackie, Y., Leong, S., and Wang, C. (2019). The latent application of deep learning in urban perception: Image discrimination analysis by convolutional neural network. Urban Plan. Int. 34 (1), 8–17. doi:10.22217/upi.2018.514 |
Hu, Y. N., Mei, L., and Chen, Yan. (2016). Quality assessment and spatial feature of portal websites in China’s 5A rated tourism attraction. Sci. Geogr. Sin. 36 (04), 548–554. doi:10.13249/j.cnki.sgs.2016.04.008 |
Huang, Y., and Bian, L. (2009). A Bayesian network and analytic hierarchy process based personalized recommendations for tourist attractions over the Internet. Expert Syst. Appl. 36 (1), 933–943. doi:10.1016/j.eswa.2007.10.019 |
Huo, H., and Sun, C. (2021). Spatiotemporal variation and influencing factors of vegetation dynamics based on geodetector: A case study of the northwestern yunnan plateau, China. Ecol. Indic. 130, 108005. doi:10.1016/j.ecolind.2021.108005 |
Jia, Y., Hu, J., Liu, D., and Zhu, L. (2019). Spatial evolution and influence mechanism of A-level scenic spots in urban agglomeration in the middle reaches of the yangtze river. Econ. Geogr. 39 (01), 198–206. doi:10.15957/j.cnki.jjdl.2019.01.024 |
Li, P., Yu, H., and Wang, Y. J. (2018). Spatial agglomeration characteristics of from 3A-class to 5A-class scenic spots in China. Sci. Geogr. Sin. 38 (11), 1883–1891. doi:10.13249/j.cnki.sgs.2018.11.016 |
Liu, B., Songshan, H., and Hui, F. (2017). An application of network analysis on tourist attractions: The case of Xinjiang, China. Tour. Manag. 58, 132–141. doi:10.1016/j.tourman.2016.10.009 |
Liu, M., and Hao, W. (2020). Spatial distribution and its influencing factors of national A-level tourist attractions in Shanxi Province. Acta Geogr. Sin. 75 (04), 878–888. doi:10.11821/dlxb202004015 |
Liu, X., and Tao, P. (2020). Research on Chinese scenic spot named entity recognition based on convolutional neural network. Comput. Eng. Appl. 56 (4), 140–145. doi:10.3778/j.issn.1002-8331.1811-0020 |
Romão, J., Kourtit, K., Neuts, B., and Peter, N. (2018). The smart city as a common place for tourists and residents: A structural analysis of the determinants of urban attractiveness. Cities 78, 67–75. doi:10.1016/j.cities.2017.11.007 |
Tang, C., Sun, M., and Wan, Z. (2019). Spatial distribution characteristics of high-level scenic spots and its influencing factors in beijing-tianjin-hebei urban agglomeration. Econ. Geogr. 39 (10), 204–213. doi:10.15957/j.cnki.jjdl.2019.10.025 |
Tang, L., He, Q., and Zhu, X. (2018). Spatial distribution characteristics of A-class scenic spots in changsha city. Econ. Geogr. 38 (06), 218–224. doi:10.15957/j.cnki.jjdl.2018.06.027 |
Wang, J., and Xu, C. (2017). Instrumental networking and social network building: How horizontal networking and upward networking create social capital. Acta Psychol. Sin. 72 (01), 116–134. doi:10.3724/sp.j.1041.2017.00116 |
Wang, T., Wang, L., and Ning, Z. Z. (2018). Spatial pattern of tourist attractions and its influencing factors in China. J. Spatial Sci. 65, 327–344. doi:10.1080/14498596.2018.1494058 |
Wang, T., Wu, P., Ge, Q. S., and Ning, Z. Z. (2021). Ticket prices and revenue levels of tourist attractions in China: Spatial differentiation between prefectural units. Tour. Manag. 83, 104214. doi:10.1016/j.tourman.2020.104214 |
Wei, W., Li, Z., Xie, B., Zhou, J., and Guo, Z. (2020). Spatial distance-based integrated evaluation of environmentally sensitivity for ecological management in northwest China. Ecol. Indic. 118, 106753. doi:10.1016/j.ecolind.2020.106753 |
Wu, C., Li, L. J., He, X. H., and Wang Jiao, E. (2018). Spatial analysis of scenic spots in the yangtze river economic belt. Resour. Sci. 40 (6), 1196–1208. doi:10.18402/resci.2018.06.10 |
Wu, B. H., Qiao, Y., and Xiao, J. Y. (2011). The category and distribution of China tourism attractions above 3A (01), 6–14. (In Chinese).
Wu, L. M., Huang, Z. F., Zhou, W., and Fang, Y. L. (2013). The spatiotemporal evolution and dynamic mechanism of A-grade tourist attractions in jiangsu province. Econ. Geogr. 33 (08), 158–164. doi:10.15957/j.cnki.jjdl.2013.08.027 |
Wu, Q., Li, X. G., Wu, L., and Chen, S. (2017). Distribution pattern and spatial correlation of A-grade tourist attractions in hunan province. Econ. Geogr. 37 (02), 193–200. doi:10.15957/j.cnki.jjdl.2017.02.026 |
Xie, X., Zhang, L., Sun, H., Chen, F. F., and Zhou, C. C. (2021). Spatiotemporal difference characteristics and influencing factors of tourism urbanization in China’s major tourist cities. Int. J. Environ. Res. Public Health 18, 10414. doi:10.3390/ijerph181910414 | |
Xu, G., Wang, W., Chen, F., Li, W., and Wang, G. (2020). ELISA is superior to bacterial culture and agglutination test in the diagnosis of brucellosis in an endemic area in China. BMC Infect. Dis. 42 (02), 11–15. doi:10.1186/s12879-019-4729-1 | |
Yang, L., Qi, F., Zhu, M., Wang, L., Alizadeh, M. R., Adamowski, J. F., et al. (2022). Variation in actual evapotranspiration and its ties to climate change and vegetation dynamics in northwest China. J. Hydrology 607, 127533. doi:10.1016/j.jhydrol.2022.127533 |
Zhao, L. H., Fu, X., Xiao, B. Y., and Zhang, Y. W. (2019). Research on forest fire smoke detection algorithm based on convolutional neural network. 12, 23–24. doi:10.13612/j.cnki.cntp.2019.12.012 |
Zhu, D. D., Xie, X., Li, X. D., and Wang, Y. H. (2020). Spatial distribution characteristics and influencing factors of A-level tourist scenic spots in Xinjiang. J. Xinjiang Univ. Nat. Sci. Ed. Chin. Engl. 37 (3), 353–361. doi:10.13568/j.cnki.651094.651316.2019.12.18.0004 |
Zhu, H., and Chen, X. L. (2008). Space distribution structure of A-grade scenic spot in China. Sci. Geogr. Sin. 28 (05), 607–615.
Keywords: geographic detector, deep learning technology, research scale, Northwest China, tourist attractions
Citation: Zhu S, Bai Z, Gan Z, Jin S, Zhang C and Wang J (2022) Simulation of the spatial pattern of scenic spots combining optimal scale and deep learning. Front. Earth Sci. 10:887043. doi: 10.3389/feart.2022.887043
Received: 01 March 2022; Accepted: 11 August 2022;
Published: 15 September 2022.
Edited by:
Marco Casazza, University of Salerno, ItalyReviewed by:
Karansher Singh Sandhu, Bayer Crop Science, United StatesCopyright © 2022 Zhu, Bai, Gan, Jin, Zhang and Wang. This is an open-access article distributed under the terms of the Creative Commons Attribution License (CC BY). The use, distribution or reproduction in other forums is permitted, provided the original author(s) and the copyright owner(s) are credited and that the original publication in this journal is cited, in accordance with accepted academic practice. No use, distribution or reproduction is permitted which does not comply with these terms.
*Correspondence: Ziyi Bai, OTIwMzA3MjY0QHFxLmNvbQ==
Disclaimer: All claims expressed in this article are solely those of the authors and do not necessarily represent those of their affiliated organizations, or those of the publisher, the editors and the reviewers. Any product that may be evaluated in this article or claim that may be made by its manufacturer is not guaranteed or endorsed by the publisher.
Research integrity at Frontiers
Learn more about the work of our research integrity team to safeguard the quality of each article we publish.