 Marta Pischiutta
 Aybige Akinci
 Chiara Felicetta2
 Francesca Pacor
94% of researchers rate our articles as excellent or good
Learn more about the work of our research integrity team to safeguard the quality of each article we publish.
Find out more
ORIGINAL RESEARCH article
Front. Earth Sci. , 13 June 2022
Sec. Solid Earth Geophysics
Volume 10 - 2022 | https://doi.org/10.3389/feart.2022.886606
This article is part of the Research Topic New Challenges for Seismic Risk Mitigation in Urban Areas View all 11 articles
This research focuses on predicting and assessing earthquake impact due to future scenarios regarding the ground motion seismic hazard by accounting mainly for site effect in the Central Apennines. To this end, we produced synthetic broadband seismograms by adopting a hybrid simulation technique for the Mw6.0 Amatrice earthquake, Central Italy, on 24 August 2016, accounting for site conditions by means of amplification curves, computed with different approaches. Simulations were validated by comparing with data recorded at 57 strong-motion stations, the majority installed in urban areas. This station sample was selected among stations recording the Amatrice earthquake within an epicentral distance of 150 km and potentially prone to experience site amplification effects because of lying in particular site conditions (sedimentary basins, topographic irregularities, and fault zones). The evaluation of amplification curves best suited to describe local effects is of great importance because many towns and villages in central Italy are built in very different geomorphological conditions, from valleys and sedimentary basins to topographies. In order to well reproduce observed ground motions, we accounted for the site amplification effect by testing various generic and empirical amplification curves such as horizontal-to-vertical spectral ratios (calculated from Fourier spectra using both earthquake, HVSR, and ambient noise, HVNSR, recordings) and those derived from the generalized inversion technique (GIT). The site amplifications emanated from GIT improve the match between observed and simulated data, especially in the case of stations installed in sedimentary basins, where the empirical amplification curve effectively reproduces spectral peaks. On the contrary, the worst performances are for the spectral ratios between components, even compared to the generic site amplification, although the latter ignores the strong bedrock/soil seismic impedance contrasts. At sites on topography, we did not observe any systematic behavior, the use of empirical curves ameliorating the fit only in a small percentage of cases. These results may provide a valuable framework for developing ground motion models for earthquake seismic hazard assessment and risk mitigation, especially in urban areas located in the seismically active central Italy region.
On 24 August 2016, at 03:36 local time, an Mw 6.0 earthquake with a shallow focal depth (8.0 km) occurred close to the Accumoli village and Amarice town in Central Apennines. This event triggered an extended sequence with five Mw ≥ 5 earthquakes, including a strong shock Mw6.5 on 30 October 2016. The first shock caused heavy damage in several villages, mainly in Accumoli, Amatrice, and Arquata del Tronto, with X to XI MCS intensity values (Galli et al., 2016a; Galli et al., 2016b; Quest, 2016; Zanini et al., 2016), and several ancient building collapsed due to the vicinity of the causative fault and the high vulnerability. During the 2016 Central Italy seismic sequence in various municipalities and hamlets, the damage patterns indicated strong evidence of local site effects (Sextos et al., 2018), mainly related to stratigraphic and topographic effects.
It is fundamental to know the features of the ground shaking during an earthquake to support the interventions and actions both in the emergency and the reconstruction phases. For example, shake maps (Wald et al., 1999; Michelini et al., 2008; Licia Faenza et al., 2016), generated in a quasi-real-time, interpolating observed and predicted data represent the distribution of ground-motion parameters following an earthquake. Generating these maps for future events from a given seismic source’s selected locations, magnitudes, and rupture mechanisms has important implications for land use planning and seismic risk mitigation of a given area.
There exist a variety of empirical and numerical methods for generating shaking maps from empirical ground motion models to physics-based approaches (Douglas and Aochi, 2008; Goulet et al., 2015) that implement different strategies to include the local site effects. In empirical models, the site-local effects are introduced through site proxies, among which the S-wave velocity in the first 30 m, Vs30, is the most common. 1D and 3D site effects may directly be introduced in the numerical physics-based approach, but they need detailed knowledge of the site-local geological and geomorphology setting, including geophysical and geotechnical properties. An alternative strategy is to simulate ground motion at rock and then add the amplification curves, empirically or numerically estimated, using 1D simplified models overlaying rigid substrate. The aim of the work is the inclusion of the site response in shaking scenarios calculations using broadband ground motion hybrid modeling for the 24 August 2016 earthquake, to make available a tool useful to reduce seismic hazards and improve risk mitigations in urban areas. The evaluation of amplification curves best suited to describe local effects is of great importance because many towns and villages in Central Italy are built in very different geomorphological conditions, from valleys and sedimentary basins to topographies.
In sedimentary basins, the presence of superficial soft sediments and strong shear-wave velocity and impedance contrasts led to strong amplification of seismic waves, even produced by earthquakes originating at relevant distances (hundreds of meters). First observations date back to the 80s and 90s of the last century all over the world, firstly involving soft soil deposits: in Mexico city during Michoacàn earthquakes (1985, M = 8.1 and 7.5, e.g., Sánchez-Sesma et al., 1988); in Los Angeles basin during Mw 6.7, 1994 Northridge earthquake (e.g., Graves, 1995); in Osaka basin after M 7.2 1995 Kobe earthquake (e.g., Iwata et al., 1996). The physical mechanism at the basis of the phenomenon involves refraction of seismic waves by a velocity contrast between superficial soft sediments and an underlying stiff bedrock and subsequent phase constructive interference causing a resonance effect. Stratigraphic resonance effects are considered in seismic design codes of many countries for seismic risk mitigation (e.g., Eurocode8 in EU, NTC18 in Italy, NEHRP in the United States, NZS1170.5), through the use of scaling factors defined on the basis of the shear-wave velocity profile and the Vs30 parameter. The Italian seismic design prescribes five classes: A (average Vs30 over 800 m/s); B (Vs30 between 360 and 800 m/s); C (Vs30 between 180 and 360 m/s); D (Vs30 lower than 180 m/s); E (particular cases). The former represents rock sites that are considered to be unaffected by site amplification, apart from high-frequency effects due to superficial weathering. Nevertheless, many recent studies have highlighted that even at frequencies of engineering interest (0.5–20 Hz) at rock sites, seismic waves can be amplified due to the local properties of the rock (i.e., the presence of pervasive fractures and/or large open cracks in different domains — fault zones, landslides, volcanoes, for example, Pischiutta et al., 2012, 2017; Panzera et al., 2014; Falsaperla et al., 2010; Ben-Zion and Sammis 2003; Lewis and Ben-Zion, 2010, Felicetta et al., 2018; Lanzano et al., 2020 (to cite a few among many). Maximum amplification (with an increase of over 100%) occurs along a site-dependent azimuth at a high angle to the fault strike; this is the reason for calling such effect “directional amplification” (using a term coined by Bonamassa and Vidale, 1991).
Finally, even sites on topography can be affected by seismic amplification. Therefore, design codes account for topographic irregularities considering scaling factors depending on the topographic slope surrounding the studied site. This is particularly important in the framework of seismic hazards and for cultural heritage maintenance and prevention since many historical and ancient settlements in Italy were built on the top of hills, for defense reasons. The topic is complex and has been under debate for the last 5 decades. Seminal papers explained the effect in terms of constructive interference of seismic waves diffracted by the convex shape of topography (“topo-resonant model”, e.g., Géli et al., 1988). However, recent studies underlined that when considering a large number of sites (e.g., Burjánek et al., 2014a; Burjanek et al., 2014b; Pischiutta et al., 2018; Kaiser et al., 2022), this model is often not satisfied because a significant role is played by local velocity distribution and geological setting, as 1) large-scale open cracks (Moore et al., 2011; Burjanek et al., 2012); 2) microcracks in fractured rocks associated to fault activity (Martino et al., 2006; Marzorati et al., 2011; Pischiutta et al., 2012, 2015, 2017); 3) rock instabilities (e.g., Del Gaudio et al., 2019).
In this study, we investigated how to insert in hybrid simulations such amplification effects, observed in different geological and morphological conditions. The modeling was obtained by merging the low-frequency contribution from the kinematic rupture model proposed by Tinti et al. (2016), and the high-frequency contribution achieved by stochastic simulation performed through the EXSIM code (e.g., Boore, 2009), both at bedrock and the site. In stochastic simulations, we exploit the model parameters validated in previous work (Pischiutta et al., 2021), including regional-specific source scaling, attenuation parameters, and the source complexity. They demonstrated that such a model can adequately explain spectral amplitudes, temporal characteristics of observed seismograms, and detect near-source effects related to the distribution of asperities on the fault plane. However, Pischiutta et al. (2021) also proved that, despite the general good consistency, in some cases simulations were not able to reproduce particular features of the observed acceleration spectrum. They ascribed such discrepancies to the occurrence of site amplification effects that are not accounted for by the use of generic amplification curves obtained through the quarter wavelength technique, due to improper consideration of the site contribution in ground-motion amplification. Also, Boore (2013) has revealed their constraints inferred by the method, which smooths, underestimating the primary resonant peaks provoked by the strong bedrock/soil seismic impedance contrasts. Moreover, several investigations have also suggested the significance of the soil/bedrock impedance contrast, the thickness of soil, and soil belongings in representing the site response in terms of amplitude and frequency content (e.g., Akinci et al., 2021).
Therefore, in this work, we have adopted different amplification curves to include the site contribution, such as the generic site curve; the horizontal-to-vertical spectral ratio (HVSR); the site functions from spectral inversion techniques (GIT). Then, we evaluated their performance by comparing observed and simulated ground motion, calculating the residual and the bias as a function of frequency.
Broadband synthetic motion was generated following a hybrid approach exploited in Akinci et al. (2017), Ojeda et al. (2021), and Pischiutta et al. (2021). Here, the low-frequency (LF) portion of the synthetics (below 1 Hz) was obtained from the rupture model published by Tinti et al. (2016). Conversely, the high-frequency (HF) portion of synthetics (over 1 Hz) was attained by using a stochastic finite-fault simulation model, based on dynamic corner frequency, explained in the following section (Motazedian and Atkinson 2005; Boore 2009). These two frequency portions were merged in the frequency domain at each station following Mai and Beroza (2003). First, the LF component was selected to merge with the HF part using the consistency of the plateau level of acceleration in the Fourier space. Two frequency values are considered, f1 and f2: below f1 the signal is 100% LF, over f2 the signal is 100% HF, and between f1 and f2 the LF and HF spectra should be identical. Considering that LF simulations are reliable up to 1 Hz, we adopted 0.3 and 0.8 Hz for f1 and f2, respectively. However, at stations in deep sedimentary basins where site effects are expected below 1 Hz, we tailored the choice of f1 and f2 values, adopting values of 0.2 and 0.6 Hz, respectively (ex. CLF, GBP, SULA, etc). In this, way we ensure that at these stations, hybrid synthetics include site amplification effects that are accounted for only by the HF signals.
The HF and LF signals were synchronized using a long- and short-time average (LTA/STA) automatic picking algorithm. To avoid a mismatch in the plateau levels between the HF and LF spectrum, we rotated the two horizontal low-frequency components by increments of 1°. The application of this procedure resulted in hybrid broadband signals related to the horizontal components of ground motion. More details can be found in Akinci et al. (2017).
In order to simulate the strong ground motion of the Amatrice earthquake we applied the stochastic finite-fault method, and later examined the residual of the ground motions between observed and simulated ground motion parameters both in the time and frequency domain. We follow the approach and parameters already exploited in Pischiutta et al. (2021). The finite-fault simulation employed the EXSIM code, produced by Motazedian and Atkinson (2005) and revised by Boore (2009), which requires as input model parameters a region-specific source model, path, and site contributions.
The total spectrum of the ground motion in this approach consists of earthquake sources, paths, sites, and instruments. These terms can be included in a comprehensive equation in the frequency domain, as follows:
where
We adopt the same spectral parameters describing the earthquake source, employed and validated in Pischiutta et al. (2021). They are tabulated in Supplementary Table S1. The stress drop parameter σ, which rules the levels of the acceleration spectrum at high frequencies, was calculated at about 150 bars by Malagnini and Munafò, 2018, and Akinci et al. (2021). We also adopted the kinematic rupture model proposed by Tinti et al. (2016), divided into 0.5 km × 0.5 km sub faults along the strike and dip. According to earlier studies, source parameters, such as geometry (strike 156°, dip 50°), density (2.8 km/m3), and rupture propagation velocity (3.1 km/s), are employed among ordinarily referred values (Supplementary Table S1).
Seismic wave propagation and seismic attenuation are essential topics, and they are required for the earthquake ground motion estimations in seismic hazard analysis. In our study, we decided to use the most recently described seismic attenuation parameters presented in Malagnini et al. (2011) model. It was obtained from several regressions of 170 weak-motion records belonging to foreshocks and aftershocks of the 2009 L’Aquila seismic sequence and realized through regression analyses of velocity time-series and Fourier spectra from 0.1 to 10 Hz, recorded at distances between 40 and 350 km. It provides the average features of three contributions in the wave propagation: geometrical attenuation, anelastic attenuation, and ground motion duration.
The chosen spectral parameters for seismic wave propagation are reported in Supplementary Table S2. The path spectrum,
Concerning the geometrical spreading coefficient
A power-law pattern of Qs gives the anelastic attenuation:
where Q0 is the value of Qs at a frequency of 1 Hz, and η is the frequency parameter proposed by Aki and Chouet (1975). For the Central Italy region, the quality factor at frequencies > 0.6 Hz is given by
Values adopted for frequency < 0.6 Hz are given in Supplementary Table S2. However, at such low frequency ranges the hybrid motion is dominated by the LF contribution due to the merging procedure previously explained.
In the code EXSIM, site amplification is accounted for through the combination of the amplification A(f) and attenuation
where an exponential decay marks the kappa parameter (
Here, we aimed to involve the site amplifications determined from different approaches to testing the performance and using such generic, empirical, and “specific” site amplification curves at stations selected in conditions potentially prone to experiencing site effects (ex. basin, topography). We used the following site amplification curves, determined throughout commonly affirmed techniques:
1. Generic site curves employed in Pischiutta et al. (2021), and representative of NTC-18 classes A, B, C, and D. According to Eq. 5, they are composed of the product of the wave amplification term A(f) and the diminution term D(f), this latter accounting for high-frequency attenuation.
Many studies in the literature have provided generic amplification curves for the term A(f), in the framework of the National Earthquake Hazard Reduction Program, NEHRP which is the seismic code adopted in the United States (e.g., Boore and Joyner, 1997; Boore, 2003; Boore 2016; Campbell and Boore, 2016). However, considering that the class thresholds for Italian and United States seismic design codes are different (see Table 4 in Pischiutta et al., 2021), in this study we choose to exploit such curves only for NTC-18 classes -B and -C (corresponding to NEHRP -C and -D, respectively). In particular, we adopted two A(f) curves proposed in Boore and Joyner, 1997 without particular frequency peaks and with associated Vs30 parameter lying in the middle of the ranges allowed in each class (520 and 255, respectively, for representative curves chosen for -B and -C classes). They are reported in Supplementary Table S3 and graphed in Supplementary Figure S2 (green and red continuous lines). Considering the differences between Vs30 thresholds in the Italian NTC-18 and United States seismic codes, for NTC-18 class-A we adopted an A(f) curve generated in Pischiutta et al. (2021) using the quarter wavelength approach (Boore, 2003; Boore, 2005) considering a typical velocity profile for Italian soft rocks (limestones, marls, and flysch), without strong impedance contrasts. It is reported in Supplementary Table S4 and shown in Supplementary Figure S2 (blue continuous line). Similarly, for the NTC18 class-D (corresponding to NEHRP class-E), we exploited another A(f) curve generated by Pischiutta et al. (2021) considering a velocity profile with Vs30 in the ranges prescribed by NTC18 (<180 m/s) and without significant impedance and velocity contrasts (see also Supplementary Table S4 and the orange continuous line in Supplementary Figure S2). We remark that generic site amplification curves determined throughout the quarter wavelength procedure are represented by velocity gradients being insensitive to impedance variances connecting the layers (Joyner and Fumal, 1984; Boore and Joyne, 1997; Boore et al., 1994, 2011).
To calculate the diminution term D(f) representing high-frequency attenuation, we used the following values for the kappa parameter (
The G(f) curves obtained following Eq. 5 are reported in Supplementary Figure S2 through dotted lines.
2. Generalized inversion technique (GIT, Andrews 1986; Castro et al., 1990). This approach is a reference site method such as the standard spectral ratio method (SSR) but, in contrast with the SSR, the GIT curves are the result of a nonparametric inversion scheme applied to a dataset composed of multiple events and stations. In this study, we used the GIT amplification functions obtained from a dataset of 283 stations and 455 events that occurred in Central Italy (Morasca et al., 2022). The GIT analysis was performed on a frequency range of 0.5–25 Hz and considered a hypocentral distance range of 10–120 km. The solution of the linear system composed of three terms (source, attenuation, and site contributions) required two prior constraints to remove unresolved degrees of freedom. A first assumption is that for all frequencies the attenuation term is set to unity at the reference distance of 10 km (the smallest in the dataset). The second one is a reference site condition. Considering six reference sites (LSS, MNF, NRN, SNO, SDM, and SLO) located on the rock and carefully selected on the base of Lanzano et al., 2021 analysis, their average amplification is fixed to 1, removing the linear dependence between source and site terms. We also exploit the GIT amplification function obtained only from the Amatrice earthquake (when available). In Supplementary Figure S3 we provide such GIT curves at the eleven stations that are thoroughly investigated in this paper. At some of them (CLF, FOC, TRE, FEMA, BSS, SULA, GBB) the two GIT curves show differences both in terms of amplified frequency band and amplitude level. This prompted us to test both of them in stochastic simulations, in a way to better reproduce observed motions.
3. Horizontal-to-vertical (HV) spectral ratio computed on the Fourier Amplitude Spectra (FAS) of strong-motion recordings (HVSR) and ambient noise (HVNSR). Although these methods are usually adopted to estimate the resonance frequencies of the site, we test if they can be also adopted to evaluate the site amplification in specific geomorphological conditions (Molnar et al., 2018; Kawase teal., 2019; Zhu et al., 2020). The HV method may estimate the site amplification function if the vertical amplification is negligible (Lachet and Bard, 1994; Field and Jacob, 1995). The HV curves are available in the Italian Accelerometric Archive v 3.2 (ITACA, Russo, et al., 2022). If the HVNSR curve is missing, we select the HV computed on the coda waves since many studies demonstrated that the curves obtained from noise and coda waves are comparable. Instead, if the HVSR curve is not available in ITACA we use the HV curves from an independent study (Priolo et al., 2019) estimated using records of small events (magnitude < 4.5).
Adopted site amplification curves were not concurrently available at all stations. The kappa coefficient
Among stations recording the Amatrice 24 August 2016 earthquake at 150 km from the epicenter, we selected a subset of 57, installed in different site conditions potentially prone to experience site amplification effects (Figure 1) (Table 1), as
1. Twenty-two (22) stations in sedimentary basins (circles in Figure 1) mostly related to site classes C and D, with only a minor percentage (five stations) in class B. An inspection of the HVSRs and HVNSRs published on the ITACA database resulted in relevant amplification (exceeding a factor of three).
2. Eighteen (18) stations are located on topographic irregularities (squares in Figure 1). Most parts of them lie in site class A (10) and B (6).
3. Six (6) stations on class A rock sites and close to fault zones (as identified by a visual inspection of geological maps and information archived in the ITACA database).
4. Eleven (11) and other stations belong to A, B, and C sites (no faults/topography/sedimentary basins) as a further constraint.
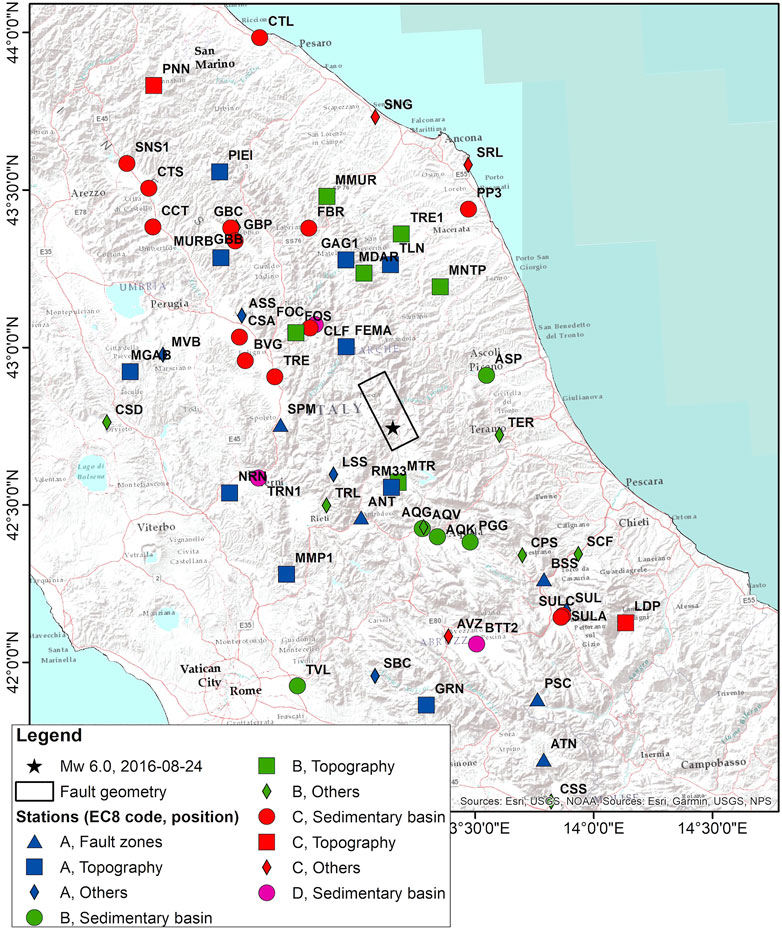
FIGURE 1. Map showing stations considered in this study up to a distance of 150 km to the epicenter of the Mw6.0 Amatrice earthquake (black star), and lying in particular site conditions, such as sedimentary basins (circle), topographic irregularities (square), fault zones (triangles). They belong to RAN (“IT”) and RSN (“IV”) networks (Table 1). We also add the fault surface projection of the causative fault proposed in Tinti et al. (2016). Symbol color is related to site classification according to NTC18 based on the Vs30 parameter (blue = class A, green = class B, red = classes C, and pink = D).
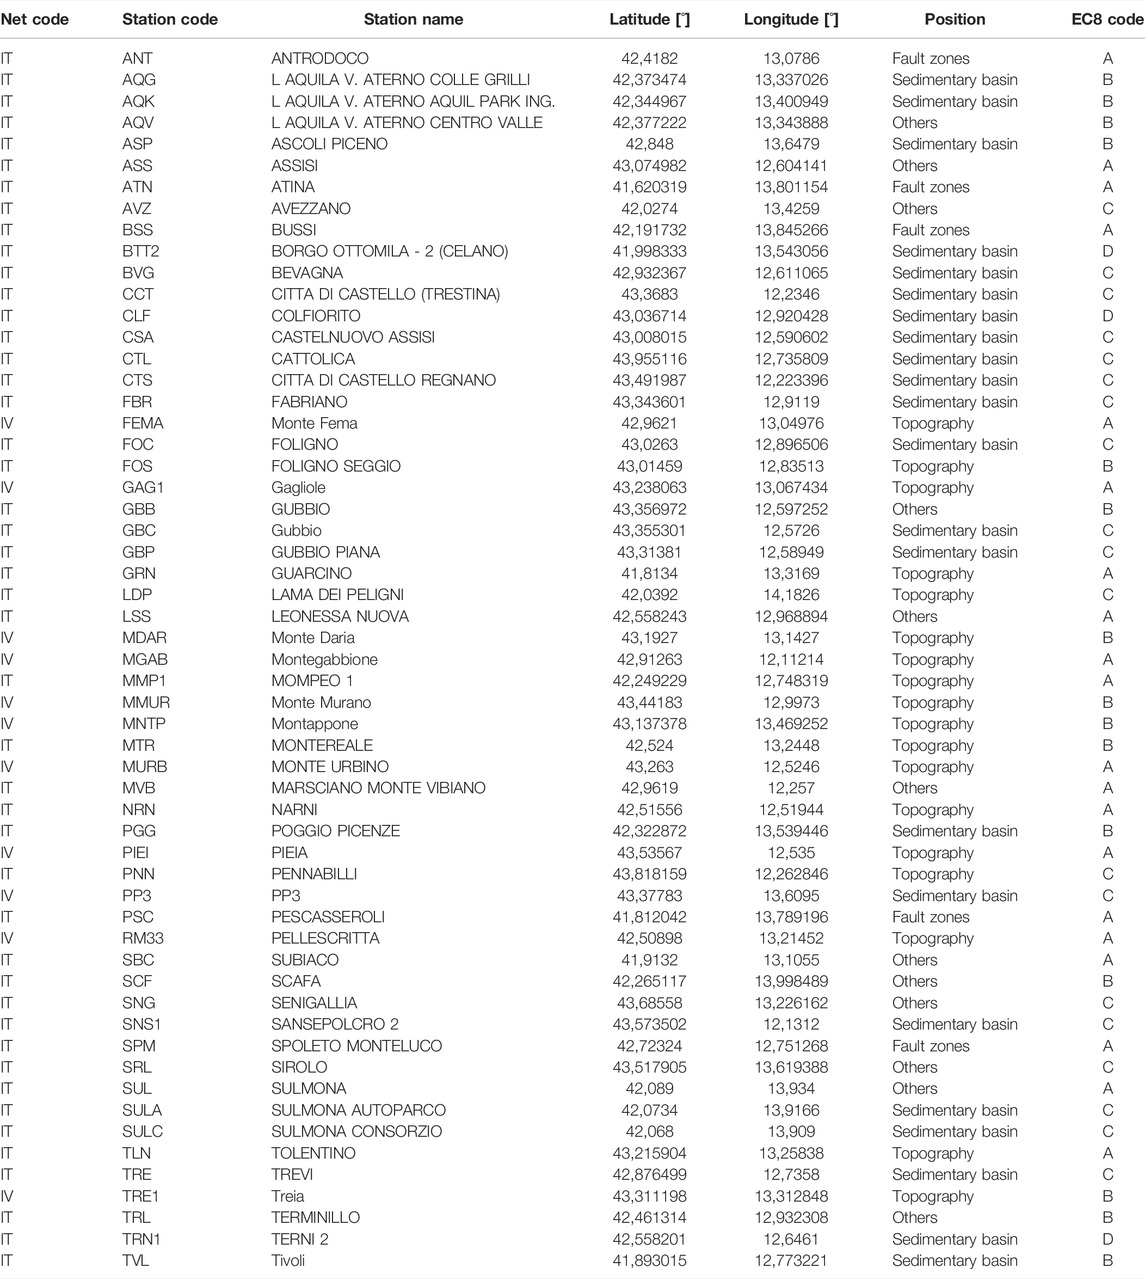
TABLE 1. Station sample considered in this study.
Such a station sample is a portion of the one used in Pischiutta et al. (2021) work, where 133 stations at 150 km from the epicenter were selected to validate stochastic simulations through comparison with recorded data in this work.
A comparison between observed and simulated ground motion was led to get insight into simulation reliability and the performance of the different adopted site amplification curves. Figure 2, reports exemplificative simulation results at station BSS (Bussi) of the IT network, related to site class A and located close to a tectonized zone. The left-top panel shows amplification curves used for stochastic simulations (Eq. 5). The red curve is the generic one that we used for all class B sites defined in NTC-18 based on the Vs30 value (see also Supplementary Figure S2). According to Eqs 5, and 6, it is obtained by the product of
1) The cyan curve is the HVSR calculated using S-waves of seismic recordings
2) The green and turquoise curves are the GIT-derived amplification for the station by using, respectively, 455 events (Morasca et al., 2022), the empirical function resulting from average overall events for robustness reasons, and only the Amatrice 24 August 2015 earthquake
3) The blue curve is the HVNSR calculated using ambient noise or earthquake coda waves
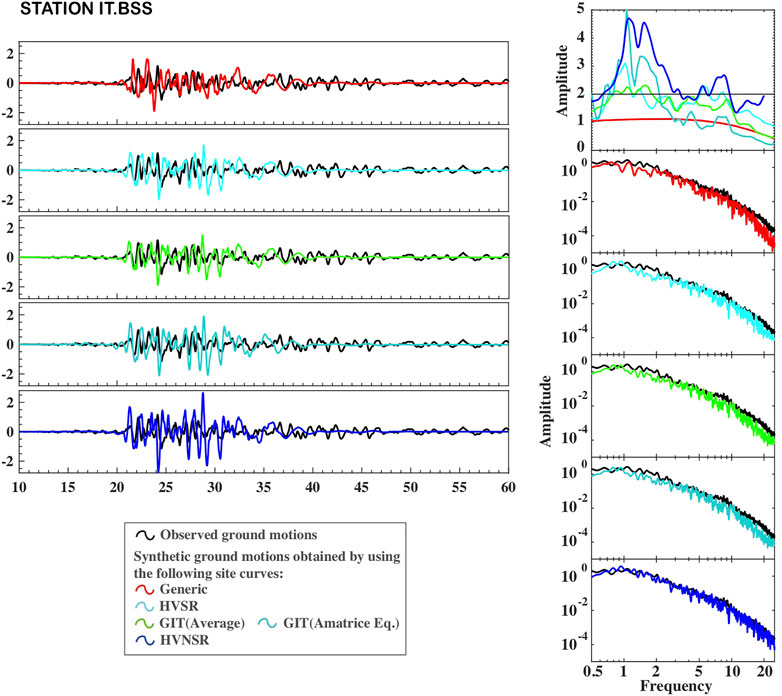
FIGURE 2. Exemplification simulation results at station BSS (Bussi), belonging to the IT network. The left-top panel shows amplification curves applied as the term G(f) in the EXSIM code used for stochastic simulations (Eq. 5). The red curve is the generic one that we used for all class B sites defined in NTC-18 based on the Vs30 value (see also Supplementary Figure S3). The other tested site-empirical specific curves are: the cyan curve is the HVSR calculated using earthquake weak motion (S waves); the green and turquoise curves are the GIT-derived amplification function by using 455 earthquakes and only the Amatrice earthquake, respectively (Morasca et al., 2022); the blue curve is the HVNSR calculated using ambient noise or earthquake coda waves. Synthetic hybrid broadband horizontal component velocity time histories (left panel) and Fourier velocity amplitude spectra (top-right panel) are compared with the recorded ground motions (black lines). For the latter, we calculated the geometric mean, and mean of the two horizontal components of ground motion, respectively, for time histories and Fourier spectra.
To validate the effectiveness of our simulations to reproduce observations and test the different site curves, we compared the synthetic velocity time histories (right panel) to recorded horizontal ground motion (arithmetic mean). Velocity Fourier amplitude spectra (left-bottom panel) were also compared with recorded ones (geometric and mean of the two horizontal components of ground motion).
The HVNSR curve and the GIT curve obtained from the Amatrice earthquake consistently show a peculiar characteristic concerning other amplification curves presenting two prominent peaks between 1 and 2 Hz at station BSS. These peaks are easily observed in the simulated time histories, as shown in the left-bottom panel of Figure 2.
As a second step, to quantitatively assess simulations’ overall performance we calculated residuals
Similarly, we calculated the residual
We finally computed the bias averaging over the total station sample N:
A perfect match between the empirical model and the broadband simulation would have null BIAS values, whereas positive/negative residual shows an underprediction/overprediction of the simulations concerning observed ground motion.
In order to thoroughly investigate how many stratigraphic effects are accounted for/unaccounted for in the earthquake-induced ground motions, we selected twenty-two stations in sedimentary basins.
Figure 3 details results at two sedimentary basins where Gubbio (panel A) and Sulmona (panel B) towns are settled. Gubbio is a historical town in the Umbria region, central Italy, with more than 30,000 inhabitants and a rich artistic and cultural heritage dating to the Middle-Age. The historical part was built at the lower slope of Ingino hill, but the modern portion expanded towards the alluvial plain. In this area, three stations of the Italian seismic network IT are installed: GBP in the middle of the alluvial basin (site class C); GBC on the basin border, inside Gubbio settlement (site class C); GBB outside the alluvial basin (site class B). Bindi et al. (2009) observed that time series of local earthquakes recorded in the Gubbio plain are characterized by locally generated surface waves, which increase in duration and amplitude with respect to the nearby reference station on a rock (GBB), the spectral energy is distributed over the range 0.4–2 Hz. In particular, they found that the peak ground velocity is amplified by a factor of 5, and the duration is increased by a factor of about 2 where the sedimentary cover is thickest (ca 600 m).
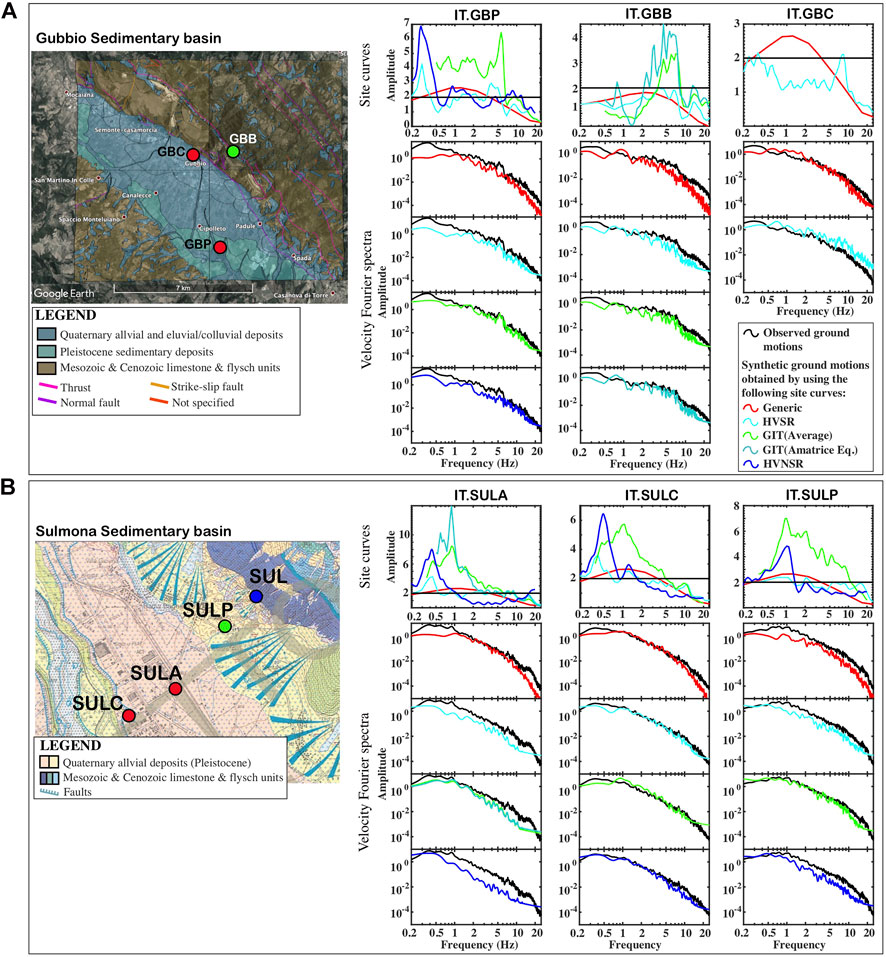
FIGURE 3. Simulation results and records of Amatrice earthquake at Gubbio [panel (A)] and Sulmona sedimentary basins [panel (B)]. For each site, we add: a rough geological map of the area (provided in the ITACA database); the applied generic and empirical site curves at each station (consistently with Figure 2); Synthetic velocity Fourier spectra were obtained using the different site curves and recorded velocity Fourier spectra (geometric mean of the two horizontal components).
In the top panel A of Figure 3, we report a basic geological map of the area. We also add the site curves for each station, consistently with Figure 2. While the generic curve (red) which does not account for the specific basin structure, does not show any significant peaks, the GIT curves (green and turquoise) show a relevant amplitude peak at about 5 Hz and between 2 and 10 Hz at stations GBB and GBP, respectively. The use of GIT curves led to better reproduction of the general spectral trend and velocity recorded signals (Figure 4A). At station GBP, in the middle of the basin, the HVSR and HVNSR curves show a peak at about 0.35 Hz, up to a factor of 4 and 7, respectively. In Figure 4, we include synthetic velocity time series for Gubbio (panel A) and Sulmona (panel B) cases. Especially by using the HVNSR and GIT curves, we obtained synthetic time histories with amplitudes and spectral content more consistent with recorded signals. At station GBC we applied only the empirical HVSR curve together with the generic one. Bindi et al. (2009) highlighted that in the Gubbio basin the HVSR are strongly affected by amplification on the vertical component, and this is particularly evident close to the basin border. In this study, we found that at station GBC the use of the HVSR curve did not lead to obtaining synthetic signals consistent with observed data.
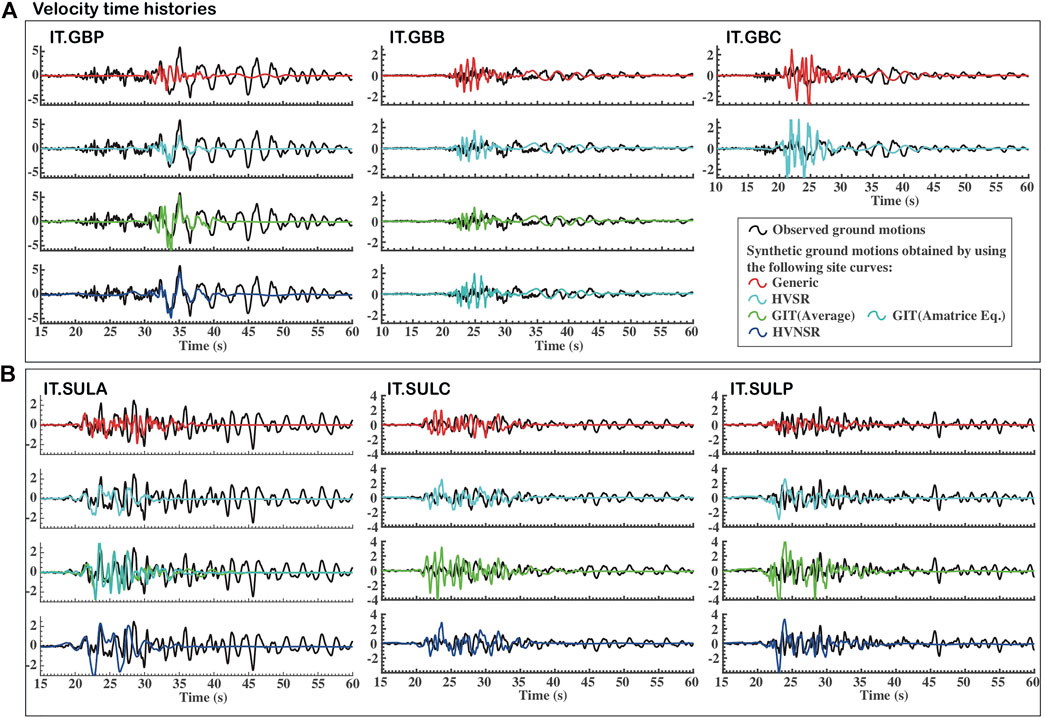
FIGURE 4. Velocity time series at Gubbio [panel (A)] and Sulmona [panel (B)] sites. In black, we plot recorded seismograms (arithmetic mean of the two horizontal components). Colored lines depict synthetic hybrid seismograms obtained from the HF and LF contributions (see Section 2.3), obtained through the EXSIM code seismic source inversion by Tinti et al. (2016). They were obtained by using empirical site curves in the EXSIM code: GIT (green), HVSR (cyan), and HVNSR (blue).
The sedimentary basin hosting the Sulmona town in the Abruzzi region hosts more than 20,000 inhabitants (Figure 3B). Sulmona was founded in Roman times and holds a rich artistic and cultural heritage dating from the Middle-Age. Sulmona rises in the center of the Peligna Valley, which in prehistoric times was occupied by a vast lake. It is located between the Vella torrent and the Gizio rivers, to the west of the Maiella and Morrone mountains, which overlook the city.
In this study, we consider four stations of the Italian seismic network IT: SULA, in the middle of the alluvial basin (site class C); SULC and SULP, on the basin borders (site class C and B, respectively); SUL, outside the alluvial basin (site class A). In Figure 3, we also show the geological map of the area, as well as the adopted site curves at each station. While the generic (red) and HVSR (cyan) site curves do not show any significant peaks, the GIT curves at stations SULA, SULC, and SULP show a peak at about 1 Hz, with amplitudes varying from 5 close to the basin borders (SULP and SULP) to over 8 in the middle of the basin (SULA). The HVNSR curves show another peak at about 0.45 Hz at SULA and SULC, with amplitudes decreasing from 8 to 6. It is also evident on the HVSR curve even if with lower amplitude levels (ranging from 3 to 4). By applying the GIT site curves we obtained synthetic velocity spectra reproducing the observed spectral trend on data at stations SULA, SULP, and SULC. At this latter station, a better performance was achieved by adopting the HVSR and HVNSR. Finally, at station SUL there are no differences in synthetic spectra obtained by adopting the different site curves (velocity time histories are given in the Supplementary Figure S4.
We finally highlight that at stations in the middle of the two investigated sedimentary basins (GBP and SULA), recorded seismograms show the presence of low-frequency phases, mainly in the coda, due to 3D amplification caused by the impedance contrast between soft sediments and underlying rock formations and by wave reverberation across the sedimentary body in the basin (e.g., Cornou and Bard, 2003). Such empirical 3D effects cannot be thoroughly simulated by employing the stochastic finite-fault technique implemented in this study. However, these effects are not observed at stations installed near the sedimentary basin borders (GBC, SULC, SULP). Finally, stations outside sedimentary basins (GBB and SUL) do not significantly improve by using different amplification curves in fitting the observed time histories. In fact, since they are installed outside the sedimentary basin, they are not affected by any significant site amplification effects.
In Supplementary Figure S5, we also provide results from two other study cases in sedimentary basins: Colfiorito and Foligno. They are both located in the Umbria region (central Italy) and experienced an MCS damage intensity of VII during the 1997 seismic sequence (e.g., Camassi et al., 2008), where over six shocks with magnitude larger than 5.0 were produced. In the Colfiorito basin, two stations of the Italian seismic network “IT” are installed: FOC (close to the basin border) and CLF (in the middle of the basin). The former station is inside the small village of Colfiorito, hosting about 5,000 inhabitants and some interesting monuments (i.e., a Church dating back to the fifth century). In Supplementary Figure S5A, we report several geological information included in the ITACA database: a geological map and section passing through station FOC and a velocity profile above station CLF. The latter highlights a strong velocity contrast at about 50 m depth, probably responsible for the about 1.0 Hz peak observed on both the GIT and HVNSR curves. However, at this station, empirical site-specific curves in stochastic simulations did not generally result in better reproducing observed data. Conversely, at station FOC the use of the GIT curves (in particular the ones derived by using only the Amatrice earthquake) led to obtaining synthetic spectra similar to the observed trend on recorded spectra at frequencies over 5 Hz.
Foligno municipality has more than 50,000 inhabitants and is located close to Colfiorito (20 km far), in the center of the Umbrian Valley that is crossed by the Topino river. Foligno possesses an important cultural heritage, with many civil and religious edifices dated since the Middle-Ages. The two stations installed in this area (BVG and TRE) show a relevant amplitude peak between 1 and 3 Hz, most prominent on the GIT curves (Supplementary Figure S5B). The use of the latter (in particular the ones derived by using only the Amatrice earthquake at station TRE) led to achieving the best consistency between synthetic and recorded spectra.
In order to get an insight into the performance of the generic and empirical site amplification curves exploited in the EXSIM code all over the station sample in sedimentary basins, we calculated the bias of the model as the logarithm (base n) of the ratio of the observed to the simulated following Eq. 10: it is an indication of the difference in the frequency domain between simulated and observed ground motion. In the top panels in Figure 5, we plot the bias versus frequency for both acceleration (panel A) and velocity (panel C) spectra. Colored curves represent the bias obtained between observed and simulated spectra by applying the generic site (red), GIT (green), HVSR (cyan), and HVNSR (violet) site curves. The standard deviation is plotted as well. An overall bias reduction is achieved using the GIT site curve, whose performance is better than the generic one at low (0.5–1.5 Hz) and high frequencies (>10 Hz). This is quite evident in the bias related to velocity spectra (Figure 5B) and to the peak ground velocity (PGV, Figure 5D), where it is lower than 0.5. Moreover, at high frequencies (>10 Hz) there is a tendency in all empirical curves for the bias reduction, that can be ascribed to the implicit inclusion of the attenuation effect in empirical curves. Conversely, in generic curves attenuation was not derived but only hypothesized through the application of the
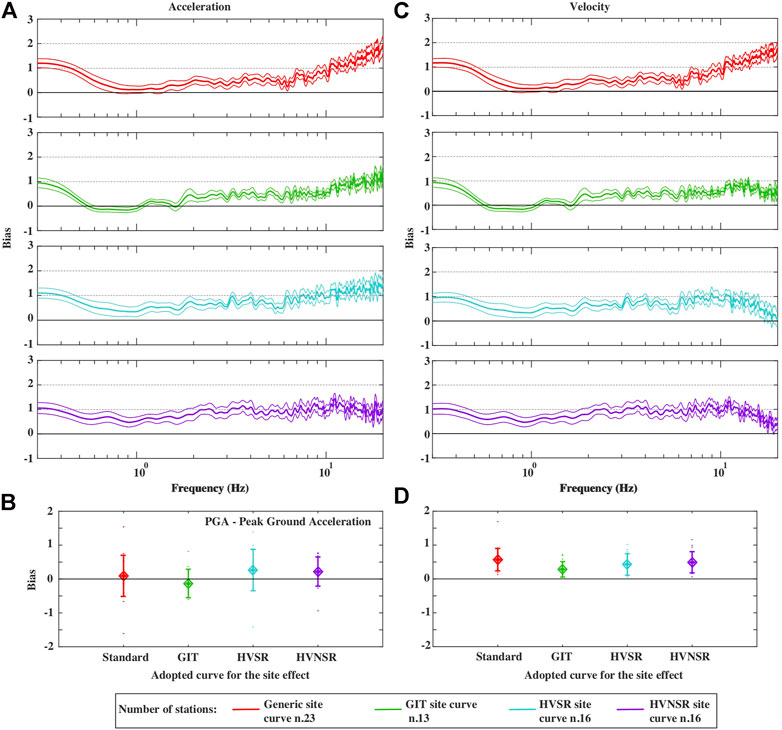
FIGURE 5. Bias calculated following Eq. 10, to get an insight into the performance of the generic and empirical site amplification curves exploited in the EXSIM code all over the station sample in sedimentary basins. The top panels show bias versus frequency for both acceleration (A) and velocity (B) spectra. Black curves represent the bias obtained by applying the generic site curve, while color curves are related to the use of GIT (green), HVSR (cyan), and HVNSR (violet) site curves. The standard deviation is plotted as well. The bottom panels show the bias calculated for peak ground acceleration [PGA, panel (B)] and peak ground velocity [PGV, panel (C)].
To investigate the topographic effects on the earthquake-induced ground motions, we have considered 18 stations located on topographic irregularities (middle slope or top), mainly belonging to class A (Vs30 > 800 m/s) and class B (360 < Vs30 > 800 m/s), as prescribed by the Italian NTC18 seismic design code.
Figure 6 shows two examples, both stations belonging to seismic network IV. The former (panel A) is station GAG1 (B site class), installed in Gagliole (Marche region), a village built in the Middle-Age on the top of a 1,000 m high hill. The historic center retains the original urban structure with the ancient medieval castle, the walls dating back to the 14th century, some ancient churches, and a monastic complex dated back to the 12th century. The GIT site amplification curves show overall higher amplitudes than both the HVSR and generic ones, with a peak at about 3.5 Hz. Its use led to achieving synthetic spectra more consistent with observed ones.
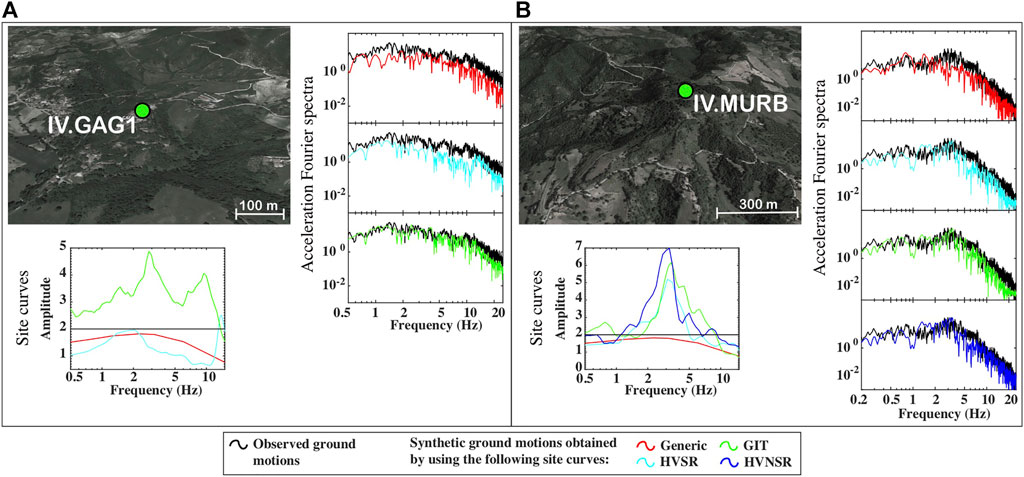
FIGURE 6. Simulation results and records of the Amatrice earthquake at stations GAG1 [panel (A)] and MURB [panel (B)], located on topographic irregularities. For each one, we show a digital elevation model to evince topography shape; the applied generic and empirical site curves at each station (consistently with Figure 2); Synthetic velocity Fourier spectra were obtained using the different site curves and recorded velocity Fourier spectra (geometric mean of the two horizontal components).
The second example (Figure 6B) is station MURB, installed on the top of Monte Urbino, an 800 m-high uninhabited hill in the Umbria region. While the generic site curve (related to B class) attains amplitude levels lower than 2 (see also Supplementary Figure S2, green-dotted curve), the three-empirical site curves (GIT, HVSR, and HVNSR) show a similar trend, with an amplitude up to eight peaks between 3 and 4 Hz. We, therefore, got synthetic spectra more consistent with observed ones between 2 and 5 Hz. Finally, through the use of the HVNSR curve, synthetic signals better reproduce the observed spectral trend even at high frequencies (>10 Hz).
In the Supplementary Material, we show four other study cases. While station FEMA is located on an uninhabited prominent ridge (over 1,500 m high), stations MMP1, PIEI, and TLN are close to small towns and have less prominent topography. All stations site curves show peaks at site-specific frequencies (about 10 Hz at FEMA; 1.5–3 Hz at MMP1; about 3 and 10 Hz at PIEI; about 2 Hz at TLN). This led to generally obtaining synthetic spectra more similar to observations in these frequency bands. Moreover, as for stations in sedimentary basins, at high frequencies (>10 Hz) the use of empirical site curves led to achieving a spectral trend more consistent with observed data. This is particularly evident at station FEMA, where the use of the GIT curve derived from the Amatrice earthquake (turquoise) led to a better fit of the velocity Fourier spectra at 2 Hz, where a prominent peak is observed. Finally, at station MMP1, empirical curves led to overestimating observation, so the generic site curves became more appropriate.
In Figure 7, similar to Figure 5, we plot the bias following Eq. 10 to get an indication of the difference in the frequency domain between simulated and observed ground motion. At high frequencies (>10 Hz) empirical site curves (HVSR and GIT) are more performant in producing a better fit with data. In fact, while they led to bias values lower than 0.5, the use of the generic curve is associated with bias values increasing from 0.5 to 1 from 10 to 25 Hz. Conversely, at low frequencies, no improvements are observed in the use of empirical site curves. Finally, observed PGA and PGV values are slightly but systematically underestimated and overestimated by the simulations.
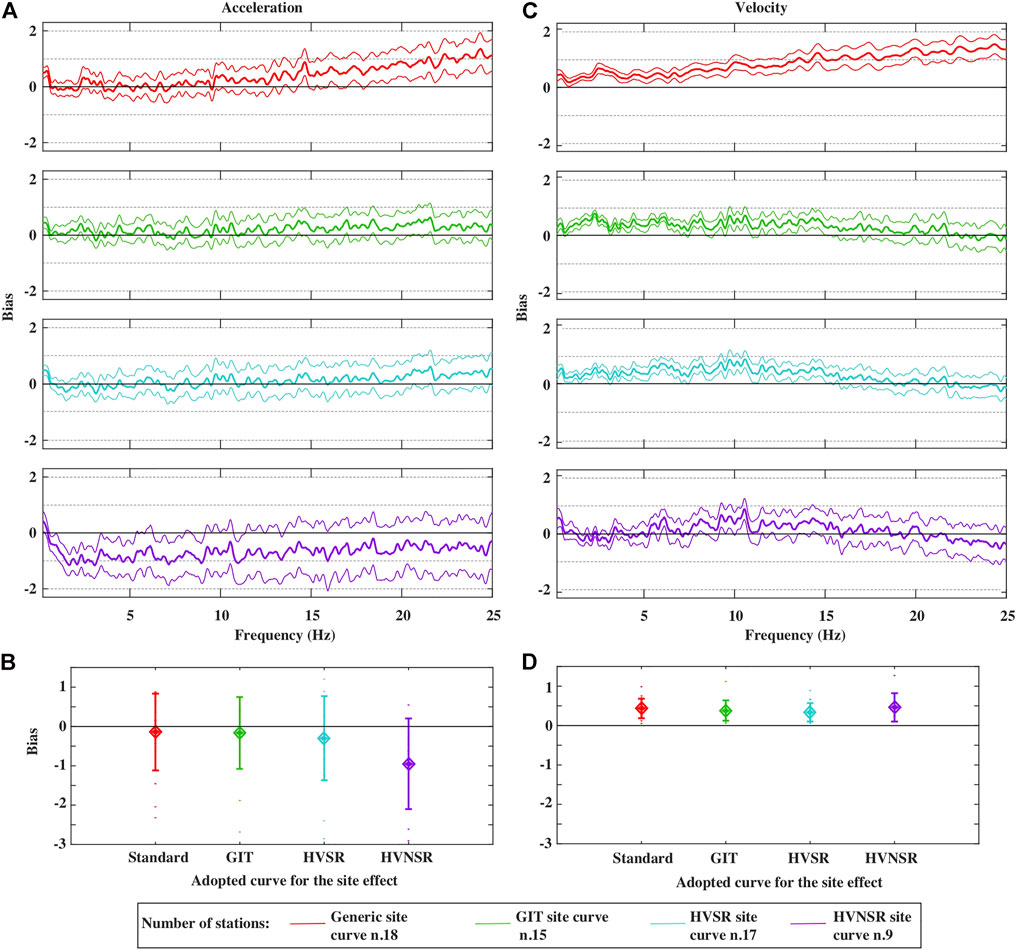
FIGURE 7. Bias calculated following Eq. 10, to get an insight into the performance of the generic and empirical site amplification curves exploited in the EXSIM code all over the station sample on topography. The top panels show bias versus frequency for both acceleration (A) and velocity (C) spectra. Black curves represent the bias obtained by applying the generic site curve, while color curves are related to the use of GIT (green), HVSR (cyan), and HVNSR (violet) site curves. The standard deviation is plotted as well. The bottom panels show the bias calculated for peak ground acceleration [PGA, panel (B)] and peak ground velocity [PGV, panel (D)].
To study the site amplification effect of the rocks we utilized five stations installed on rock and related to site class A. However the HVSR and HVNSR amplification curves, published on the ITACA database, unexpectedly highlight the presence of peaks over a factor of three at intermediate frequencies (between 1 and 10 Hz), where we consider no amplification.
In Figure 8A, we show station LSS as an example of a reference rock site (i.e., no site amplification) installed on Mesozoic limestone lithotypes. All site curves (both generic and empirical) show amplitudes lower than a factor of 1.5, the difference between them being small without sharp peak/s at certain frequencies. Therefore, no differences are observed on synthetic velocity Fourier spectra when using the different site curves. Conversely, SPM is an exemplificative station for site amplification on rock sites (Figure 8B). It is installed on Mesozoic limestone, in an intensely tectonized zone, and at the middle slope of a hill. Empirical site curves show an amplitude exceeding three peaks at about 5 Hz. However, visually speaking, we may say that the GIT curves lead to better reproduction of observed Fourier spectra, particularly at frequencies higher than 5 Hz.
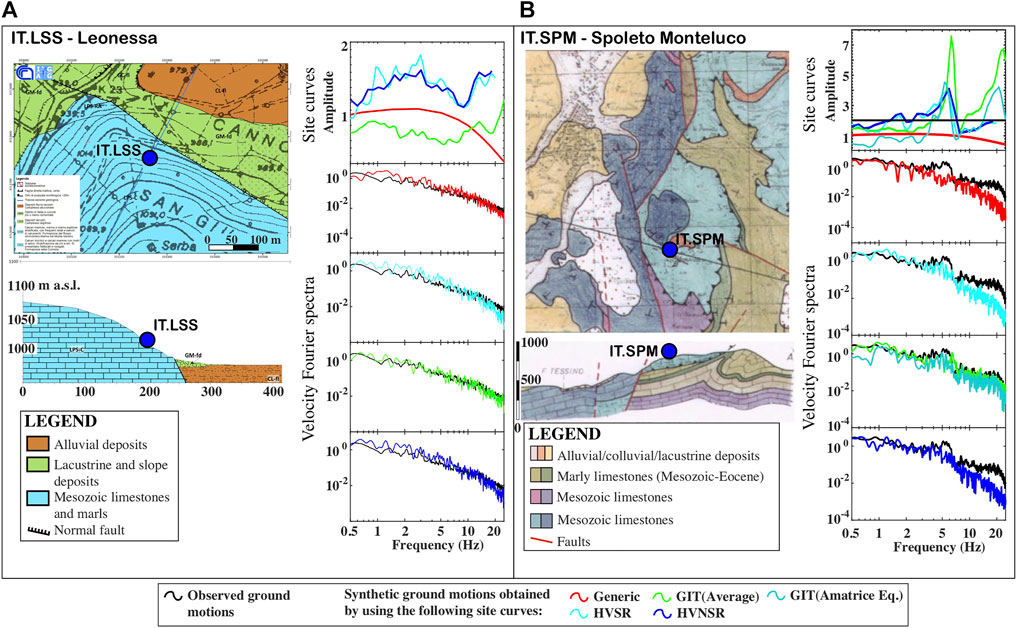
FIGURE 8. Simulation results and records of Amatrice earthquake at stations LSS [panel (A)] and SPM [panel (B)], installed on rock and related to site class A. For each one, we show: the geological map and profile furnished in the ITACA database; the applied generic and empirical site curves at each station (consistently with Figure 2); Synthetic velocity Fourier spectra were obtained using the different site curves, and recorded velocity Fourier spectra (geometric mean of the two horizontal components).
In Supplementary Figure S7, we furnish two other examples. The former (panel A) is represented by station ANT, installed in the town of Antrodoco (Latium region) on dolomite lithotypes and in an intensely tectonized area. Using empirical site curves HVSR and HVNSR (showing the amplitude of three peaks at about 2 Hz) led to overestimating observed velocity Fourier spectra, while by using the GIT curve simulated Fourier spectra they are consistent with observed data, especially at high frequencies. Moreover, the use of the GIT curve derived only using the Amatrice earthquake led to better reproduction of observed ground-motion levels. The same findings are shown at station PSC (Figure 8B) installed in Pescasseroli village (Abruzzi region) on calcarenites.
We produced synthetic broadband seismograms using a hybrid simulation technique for the Mw6.0 Amatrice earthquake, Central Italy, on 24 August 2016, following the previous work of Pischiutta et al. (2021). In the present study, we focused on the site amplification parameters and tried to understand their impact on ground motions with the aim to improve the hazard assessment for seismic risk reductions, particularly in urban areas in the central Apennines. To do so, the 57 stations selected, mainly located in urban areas, are potentially prone to experience site amplification effects because of lying in particular site conditions (sedimentary basins, topographic irregularities, and fault zones).
In this work, we tested the use of different empirical amplification curves, such as horizontal-to-vertical spectral ratios (calculated using both earthquakes, HVSR, and ambient noise recordings, HVNSR), and site curves derived from the generalized inversion technique (GIT) to improve our simulations. The latter were derived by using 455 earthquakes that occurred in Central Italy (Morasca et al., 2022). We also tested the use of the GIT curve derived only by the Amatrice earthquake. Their performance was linked to the generic curves by comparing the goodness of fit with recorded data. In general, we observed the following:
• In sedimentary basins, the presence of superficial soft sediments and strong shear-wave velocity and impedance contrasts leads to strong amplification due to refraction of seismic waves by an underlying stiff bedrock and subsequent phase constructive interference causing a resonance effect. We found that at the 22 stations in sedimentary basins selected in this study, empirical site curves led to a better fit with the data. They include amplitude peaks at site-characteristic frequencies, which depend on the superficial mean shear-wave velocities and the depth of the velocity contrast. In particular, the GIT site curve was most performant among the empirical adopted curves, achieving the best fit between observed and simulated velocity Fourier spectra. The GIT curve derived only by the Amatrice earthquake is more performant than the one derived as an average among considered earthquake data set in Morasca et al., 2022, suggesting that site correction may be scenario-dependent.
• An overall bias reduction is achieved using the GIT site curve, whose performance is better than the generic one. This behavior is quite evident on velocity spectra both at (i) low frequencies (0.5–1.5 Hz), where amplification effects are generally realized in deep sedimentary basins (hundreds of meters); (ii) high frequencies (>10 Hz), since all empirical curves implicitly include the attenuation effect in empirical curves that is hypothesized on generic curves through the application of k0 parameter, arbitrarily assigned on the basis of the site class. However, due to the limitation intrinsic to the 1D stochastic finite-fault approach implemented in this study, our simulations could not reproduce wave reverberation across the sedimentary body, visible at stations installed in the middle of the basins on time histories as low-frequency coda phases.
• Amplification effects occur on the top of reliefs, due to the constructive interference of seismic waves diffracted by the convex topography. Almost certainly, a significant role is played by the local velocity distribution and subsoil structure. This study selects 18 stations installed on topography at which empirical site curves show peaks at different frequencies which depend on site specificities. As for stations in sedimentary basins, even at these sites, the use of empirical curves led to achieving a spectral trend more consistent with observed data at high frequencies (>10 Hz). Conversely, at low frequencies, no general improvements are observed in the use of empirical site curves. In fact, each site shows its own peculiar behavior, and a preferential empirical/generic curve leading to achieving synthetic motion more consistent with observed data.
• Rock sites are considered to be unaffected by site amplification. Nevertheless, many recent studies have highlighted that seismic waves can be amplified due to the local properties of the rock (i.e., the presence of pervasive fractures and/or large open cracks). We investigate five stations installed on rock and related to site class A, where empirical site curves highlight the occurrence of amplification effects at intermediate frequencies (between 1 and 10 Hz). Again, we found that the GIT empirical site curves led to obtaining synthetic spectra more consistent with observed ones. This is particularly evident when using the GIT site curve derived only from the Amatrice earthquake suggesting that site correction may be scenario-dependent.
Similar efforts have been shown in different parts of the world. For example, recently Zhu et al. (2022a) have tested and compared the effectiveness of different estimation techniques using a unique benchmark dataset at 1725 K-NET and KiK-net sites, in Japan. Evaluated prediction approaches included: 1) the empirical correction to the horizontal-to-vertical spectral ratio of earthquakes (c-HVSR, see also Kawase et al., 2019 and Zhu et al., 2020); 2) one-dimensional ground response analysis (GRA); 3) the square-root-impedance (SRI) method (also called the quarter wavelength approach). They found that, at the majority of analyzed sites, the empirical correction to HVSR was highly effective in achieving a “good match” in both spectral shape and amplitude. Since this technique has great potential in seismic hazard assessments, even considering that it does not require a velocity model, its use could be evaluated in similar further tests involving hybrid simulations.
We finally stress that, due to the 1D stochastic finite-fault approach implemented in this study, our simulations could not reproduce several scattering and resonance effects. 3D deterministic approaches may rather enhance the ground motion simulations in the sedimentary basins and the presence of topography (Pitarka et al., 2022). Moreover, many studies present clear evidence of rupture directivity in the Mw6.0 2016 Amatrice earthquake, Central Italy (e.g., Calderoni et al., 2017; Ren et al., 2017). However, the method used in this study, the stochastic model through the EXSIM code (Motazedian and Atkinson, 2005; Boore, 2009), is a simplistic model and dismisses the effect of rupture directivity on the azimuth dependent variability of ground motions. Although our simulations at low frequencies capture the directivity effect (Tinti et al., 2016; Pischiutta et al., 2021), the goodness of fit between simulated and observed ground motions might be biased for some of the stations only at higher frequencies.
Publicly available datasets were analyzed in this study. This data can be found at: https://itaca.mi.ingv.it/ItacaNet_32/#/home.
MP, AA, and FP contributed to the conception and design of the study. MP and CF organized the database. CF and PM furnished the site amplification curves adopted in this study. MP and AA wrote the first draft of the manuscript. FP wrote sections of the manuscript. All authors contributed to manuscript revision and read and approved the submitted version.
The authors declare that the research was conducted in the absence of any commercial or financial relationships that could be construed as a potential conflict of interest.
All claims expressed in this article are solely those of the authors and do not necessarily represent those of their affiliated organizations, or those of the publisher, the editors, and the reviewers. Any product that may be evaluated in this article, or claim that may be made by its manufacturer, is not guaranteed or endorsed by the publisher.
The Supplementary Material for this article can be found online at: https://www.frontiersin.org/articles/10.3389/feart.2022.886606/full#supplementary-material
Aki, K., and Chouet, B. (1975). Origin of Coda Waves: Source, Attenuation, and Scattering Effects. J. Geophys. Res. 80, 3322–3342. doi:10.1029/jb080i023p03322
Akinci, A., Aochi, H., Herrero, A., Pischiutta, M., and Karanikas, D. (2017). Physics‐Based Broadband Ground‐Motion Simulations for ProbableMw≥7.0 Earthquakes in the Marmara Sea Region (Turkey). Bull. Seismol. Soc. Am. 107 (3), 1307–1323. doi:10.1785/0120160096
Akinci, A., Cheloni, D., and Dindar, A. A. (2021). The 30 October 2020, M7.0 Samos Island (Eastern Aegean Sea) Earthquake: Effects of Source Rupture, Path and Local-Site Conditions on the Observed and Simulated Ground Motions. Bull. Earthq. Eng. 19, 4745–4771. doi:10.1007/s10518-021-01146-5
Anderson, J. G., and Hough, S. E. (1984). A Model for the Shape of the Fourier Amplitude Spectrum of Acceleration at High Frequencies. Bull. Seismol. Soc. Am. 74 (5), 1969–1993. doi:10.1785/BSSA0740051969
Andrews, D. J. (1986). Objective Determination of Source Parameters and Similarity of Earthquakes of Different Size. Earthq. Source Mech. 37, 259–267. doi:10.1029/GM037p0259
Ben-Zion, Y., and Sammis, C. G. (2003). Characterization of Fault Zones. Pure Appl. Geophys. 160, 677–715. doi:10.1007/pl00012554
Bindi, D., Pacor, F., Luzi, L., Puglia, R., Massa, M., Ameri, G., et al. (2011). Ground Motion Prediction Equations Derived from the Italian Strong Motion Database. Bull. Earthq. Eng. 9 (6), 1899–1920. doi:10.1007/s10518-011-9313-z
Bindi, D., Parolai, S., Cara, F., Di Giulio, G., Ferretti, G., Luzi, L., et al. (2009). Site Amplifications Observed in the Gubbio Basin, Central Italy: Hints for Lateral Propagation Effects. Bull. Seismol. Soc. Am. 99 (2A), 741–760. doi:10.1785/0120080238
Bonamassa, O., and Vidale, J. E. (1991). Directional Site Resonances Observed from Aftershocks of the 18 October Loma Prieta Earthquake. Bull. Seism. Soc. Am. 81 (5), 1945–1957. doi:10.1785/BSSA0810051945
Boore, D. M. (2005). SMSIM—Fortran Programs for Simulating Ground Mo- tions from earthquakes: Version 2.3—A Revision of OFR 96-80-A. Available at: http://www.daveboore.com/smsim.
Boore, D. M. (2009). Comparing Stochastic Point-Source and Finite-Source Ground-Motion Simulations: SMSIM and EXSIM. Bull. Seismol. Soc. Am. 99, 3202–3216. doi:10.1785/0120090056
Boore, D. M. (2016). Determining Generic Velocity and Density Models for Crustal Amplification Calculations, with an Update of the Boore and Joyner (1997) Generic Site Amplification for VS(30) = 760 M/s. Bull. Seismol. Soc. Am. 106, 316–320. doi:10.1785/0120150229
Boore, D. M., Joyner, W. B., and Fumal, T. E. (1994). Estimation of Response Spectra and Peak Accelerations from Western North American Earthquakes: an Interim Report, Part 2. U.S. Geol. Surv. Open-File rept. 94–127, 40. doi:10.3133/ofr94127
Boore, D. M., and Joyner, W. B. (1997). Site Amplifications for Generic Rock Sites. Bull. Seismol. Soc. Am. 87, 327–341. doi:10.1785/bssa0870020327
Boore, D. M. (2003). Simulation of Ground Motion Using the Stochastic Method. Pure Appl. Geophys. 160, 635–676. doi:10.1007/pl00012553
Boore, D. M. (2013). The Uses and Limitations of the Square-Root-Impedance Method for Computing Site Amplification. Bull. Seismol. Soc. Am. 103, 2356–2368. doi:10.1785/0120120283
Boore, D. M., Thompson, E. M., and Cadet, H. (2011). Regional Correlations of VS30 and Velocities Averaged over Depths Less Than and Greater Than 30 Meters. Bull. Seismol. Soc. Am. 101, 3046–3059. doi:10.1785/0120110071
Burjánek, J., Edwards, B., and Fäh, D. (2014a). Empirical Evidence of Local Seismic Effects At Sites With Pronounced Topography: A Systematic Approach Geophys. J. Intern. 197 (1), 608–619. doi:10.1093/gji/ggu014
Burjanek, J., Fäh, D., Pischiutta, M., Rovelli, A., Calderoni, G., and Bard, P.-Y. (2014b). “NERA-JRA1 Working Group,” in Site Effects at Sites with Pronounced Topography: Overview & Recommendations (Research report for EU project NERA), 64.
Burjánek, J., Moore, J. R., Yugsi Molina, F. X., and Fäh, D. (2012). Instrumental Evidence of Normal Mode Rock Slope Vibration. Geophys. J. Int. 188 (2), 559–569. doi:10.1111/j.1365-246x.2011.05272.x
Calderoni, G., Rovelli, A., and Di Giovambattista, R. (2017). Rupture Directivity of the Strongest 2016-2017 Central Italy Earthquakes. J. Geophys. Res. Solid Earth 122, 9118–9131. doi:10.1002/2017jb014118
Camassi, R., Azzaro, R., and Tertulliani, A. (2008). Macroseismology: the Lessons Learnt from the 1997/1998 Colfiorito Seismic Sequence. Ann. Geophys. 51 (2/3). doi:10.4401/ag-4453
Campbell, K. W., and Boore, D. M. (2016). Evaluation of Six NEHRP B/C Crustal Amplification Models Proposed for Use in Western North America. Bull. Seismol. Soc. Am. 106, 673–686. doi:10.1785/0120150242
Castro, R. R., Anderson, J. G., and Singh, S. K. (1990). Site Response, Attenuation and Source Spectra of S Waves along the Guerrero, Mexico, Subduction Zone. Bull. Seismol. Soc. Am. 80, 1481–1503. doi:10.1785/BSSA08006A1481
Chiara, F., Giovanni, L., Maria, D. A., Rodolfo, P., Lucia, L., and Francesca, P. (2018). Ground Motion Model for Reference Rock Sites in Italy. Soil Dyn. Earthq. Eng. 110, 276–283. doi:10.1016/j.soildyn.2018.01.024
Cornou, C., and Bard, P. Y. (2003). Site-to-bedrock over 1D Transfer Function Ratio: An Indicator of the Proportion of Edge-Generated Surface Waves? Geophys. Res. Lett. 30, 1453–1457. doi:10.1029/2002gl016593
Del Gaudio, C., De Risi, M. T., Ricci, P., and Verderame, G. M. (2019). Empirical Drift-Fragility Functions and Loss Estimation for Infills in Reinforced Concrete Frames under Seismic Loading. Bull. Earthq. Eng. 17, 1285–1330. doi:10.1007/s10518-018-0501-y
Douglas, J., and Aochi, H. (2008). A Survey of Techniques for Predicting Earthquake Ground Motions for Engineering Purposes. Surv. Geophys 29, 187–220. doi:10.1007/s10712-008-9046-y
Falsaperla, S., Cara, F., Rovelli, A., Neri, M., Behncke, B., and Acocella, V. (2010). Effects of the 1989 Fracture System in the Dynamics of the Upper SE Flank of Etna Revealed by Volcanic Tremor Data: the Missing Link? J. Geophys. Res. 115 (B11306). doi:10.1029/2010JB007529
Field, E., and Jacob, K. (1995). A Comparison and Test of Various Site-Response Estimation Techniques, Including Three that Are Not Reference-Site Dependent. Bull. Seismol. Soc. Am. 85 (4), 1127–1143. doi:10.1785/BSSA0850041127
Galli, P., Peronace, E., Bramerini, F., Castenetto, S., Naso, G., Cassone, F., et al. (2016b). The MCS Intensity Distribution of the Devastating 24 August 2016 Earthquake in Central Italy (MW 6.2). Ann. Geophys 59. doi:10.4401/ag-7287
Galli, P., Peronace, E., and Tertulliani, A. (2016a). Rapporto sugli effetti macrosismici del terremoto del 24 agosto 2016 di Amatrice in scala MCS, Roma, Rapporto congiunto DPC, CNRIGAG, 15. doi:10.5281/zenodo.161323
Géli, L., Bard, P.-Y., and Jullien, B. (1988). The Effect of Topography on Earthquake Ground Motion: a Review and New Results. Bull. Seism. Soc. Am. 78 (1), 42–63. doi:10.1785/BSSA0780010042
Goulet, C. A., Abrahamson, N. A., Somerville, P. G., and Wooddell, K. E. (2015). The SCEC Broadband Platform Validation Exercise: Methodology for Code Validation in the Context of Seismic-Hazard Analyses. Seismol. Res. Lett. 86 (1), 17–26. doi:10.1785/0220140104
Graves, R. W. (1995). Preliminary Analysis of Long-Period Basin Response in the Los Angeles Region from the 1994 Northridge Earthquake. Geophys. Res. Lett. 22 (2), 101–104. doi:10.1029/94gl02894
Iwata, T., Hatayama, K., Kawase, H., and Irikura, K. (1996). Site Amplification of Ground Motions during Aftershocks of the 1995 Hyogo-Ken Nanbu Earthquake in Severely Damaged Zone. J. Phys. Earth 44 (5), 553–561. doi:10.4294/jpe1952.44.553
Joyner, W., and Fumal, T. (1984). Use of Measured Shear-Wave Velocity for Predicting Geologic Site Effects on Strong Ground Motion. Proc. 8th world conf. Earthq. Eng. 2, 777–783.
Kaiser, A., Massey, C., Pischiutta, M., Fry, B., and Nicol, A. (2022). Quantifying Seismic Amplification on Topography in New Zealand and its Relationship to Landslide Occurrence: First Steps under New Zealand’s Resilience Challenge Programme. Bellevue, Washington: Sesmological Society America Annual Meeting.
Kawase, H., Nagashima, F., Nakano, K., and Mori, Y. (2019). Direct Evaluation of S-Wave Amplification Factors from Microtremor H/V Ratios: Double Empirical Corrections to "Nakamura" Method. Soil Dyn. Earthq. Eng. 126, 105067. doi:10.1016/j.soildyn.2018.01.049
Lachetl, C., and Bard, P.-Y. (1994). Numerical and Theoretical Investigations on the Possibilities and Limitations of Nakamura's Technique. J. Phys. Earth 42 (5), 377–397. doi:10.4294/jpe1952.42.377
Lanzano, G., Felicetta, C., Pacor, F., Spallarossa, D., and Traversa, P. (2022). Generic-to-reference Rocks Scaling Factors for the Seismic Ground Motion in Italy. Bull. Seismol. Soc. Am.. (accepted), 1–24. doi:10.1785/0120210063
Lanzano, G., Felicetta, C., Pacor, F., Spallarossa, D., and Traversa, P. (2020). Methodology to Identify the Reference Rock Sites in Regions of Medium-To-High Seismicity: an Application in Central Italy. Geophys. J. Int. 222 (3), 2053–2067. doi:10.1093/gji/ggaa261
Lewis, M. A., and Ben-Zion, Y. (2010). Diversity of Fault Zone Damage and Trapping Structures in the Parkfield Section of the San Andreas Fault from Comprehensive Analysis of Near Fault Seismograms. Geophys. J. Int. 183, 1579–1595. doi:10.1111/j.1365-246x.2010.04816.x
Licia Faenza, L., Valentino Lauciani, V., and Alberto Michelini, A. (2016). The ShakeMaps of the Amatrice, M6, Earthquake. Ann. Geophys. 59. FAST TRACK 5. doi:10.4401/ag-7238
Mai, P. M., and Beroza, G. C. (2003). A Hybrid Method For Calculating Near Source, Broadband Seismograms: Application To Strong Motion Prediction Phys. Earth Planet. Inter. 137 (1/4), 183–199. doi:10.1016/S0031-9201(03)00014-1
Malagnini, L., Akinci, A., Mayeda, K., Munafo', I., Herrmann, R. B., and Mercuri, A. (2011). Characterization of Earthquake-Induced Ground Motion from the L'Aquila Seismic Sequence of 2009, Italy. Geophys J. Int. 184 (1), 325–337. doi:10.1111/j.1365-246x.2010.04837.x
Malagnini, L., and Munafò, I. (2018). On the Relationship between ML and MW in a Broad Range: An Example from the Apennines, Italy. Bull. Seism. Soc. Am. 108 (2), 1018–1024. doi:10.1785/0120170303
Zanini, M. A., Lorenzo Hofer, L., Flora Faleschini, F., Paolo Zampieri, P., Nicola Fabris, N., and Carlo Pellegrino, C. (2016). Preliminary Macroseismic Survey of the 2016 Amatrice Seismic Sequence. Ann. Geophys. 59. Fast Track 5. doi:10.4401/ag-7172
Martino, S., Minutolo, A., Paciello, A., Rovelli, A., Mugnozza, G. S., and Verrubbi, V. (2006). Evidence of Amplification Effects in Fault Zone Related to Rock Mass Jointing. Nat. Hazards 39, 419–449. doi:10.1007/s11069-006-0001-2
Marzorati, S., Ladina, C., Falcucci, E., Gori, S., Saroli, M., Ameri, G., et al. (2011). Site Effects "on the Rock": the Case of Castelvecchio Subequo (L'Aquila, Central Italy). Bull. Earthq. Eng. 9, 841–868. doi:10.1007/s10518-011-9263-5
Michelini, A., Faenza, L., Lauciani, V., and Malagnini, L. (2008). Shakemap Implementation in Italy. Seismol. Res. Lett. 79, 688–697. doi:10.1785/gssrl.79.5.688
Moore, J. R., Gischig, V., Burjanek, J., Loew, S., and Fah, D. (2011). Site Effects in Unstable Rock Slopes: Dynamic Behavior of the Randa Instability (Switzerland). Bull. Seismol. Soc. Am. 101 (6), 3110–3116. doi:10.1785/0120110127
Molnar, S., Cassidy, J. F., Castellaro, S., Cornou, H., Crow, J. A., Hunter, S., et al. (2018). Application of Microtremor Horizontal-to-Vertical Spectral Ratio (MHVSR) Analysis for Site Characterization: State of the Art Surv. Geophys. 39, 613–631. doi:10.1007/s10712-018-9464-4
Morasca, P., D’Amico, M., Lanzano, G., Sgobba, S., Colavitti, L., Pacor, F., et al. (2022). Empirical Correlations between a FAS Non-ergodic Ground Motion Model and a GIT Derived Model for Central Italy. Geophys. J. Int.. (in prep.).
Motazedian, D., and Atkinson, G. M. (2005). Stochastic Finite-Fault Modeling Based on a Dynamic Corner Frequency. Bull. Seismol. Soc. Am. 95, 995–1010. doi:10.1785/0120030207
NEHRP Building Seismic Safety Council (2015). “NEHRP Recommended Seismic Provisions for New Buildings and Other Structures,” in Part 1 Provisions, Part 2 Commentary, FEMA Rept. 2015 Edition (Washington, D.C: National Institute of Building Sciences), 1, P-1050-1051.
NTC18 (2018). Italian building code ‘Norme Tecniche per le Costruzioni – Ministero delle Instrutture e dei Trasporti. Available at: https://www.gazzettaufficiale.it/eli/gu/2018/02/20/42/so/8/sg/pdf. (Accessed December 2020).
NZS (2004). Standards New Zealand 2004. Structural Design Actions—Part 5 Earthquake Actions—New Zealand. Standards New Zealand. Private Bag 2439, Wellington 6020. ISBN 1-86975-018-7 (incorporating Amendment 1 (following Canterbury Earthquake Sequence). Available at: https://www.standards.govt.nz/shop/nzs-1170-52004/.
Ojeda, J., Akinci, A., Tinti, E., Arriola, S., and Ruiz, S. (2021). Hybrid Broadband Strong-Motion Simulation to Investigate the Near-Source Characteristics of the M6.5, 30 October 2016 Norcia, Italy Earthquake. Soil Dyn. Earthq. Eng. 149, 106866. doi:10.1016/j.soildyn.2021.106866
Panzera, F., Pischiutta, M., Lombardo, G., Monaco, C., and Rovelli, A. (2014). Wavefield Polarization in Fault Zones of the Western Flank of Mt. Etna: Observations and Fracture Orientation Modelling. Pure Appl. Geophys. 171, 3083–3097. doi:10.1007/s00024-014-0831-x
Pischiutta, M., Akinci, A., Tinti, E., and Herrero, A. (2020). Broad-band Ground-Motion Simulation of 2016 Amatrice Earthquake, Central Italy. Cent. Italy. Geophys. J. Int. 224, 1753–1779. doi:10.1093/gji/ggaa412
Pischiutta, M., Cianfarra, P., Salvini, F., Cara, F., and Vannoli, P. (2018). A Systematic Analysis of Directional Site Effects at Stations of the Italian Seismic Network to Test the Role of Local Topography. Geophys. J. Int. 214 (1), 635–650. doi:10.1093/gji/ggy133
Pischiutta, M., Fondriest, M., Demurtas, M., Magnoni, F., Di Toro, G., and Rovelli, A. (2017). Structural Control on the Directional Amplification of Seismic Noise (Campo Imperatore, Central Italy). Earth Planet. Sci. Lett. 471, 10–18. doi:10.1016/j.epsl.2017.04.017
Pischiutta, M., Salvini, F., Fletcher, J., Rovelli, A., and Ben-Zion, Y. (2012). Horizontal Polarization of Ground Motion in the Hayward Fault Zone at Fremont, California: Dominant Fault-High-Angle Polarization and Fault-Induced Cracks. Geophys. J. Int. 188 (3), 1255–1272. doi:10.1111/j.1365-246x.2011.05319.x
Pischiutta, M., Savage, M. K., Holt, R. A., and Salvini, F. (2015). Fracture-related Wavefield Polarization and Seismic Anisotropy across the Greendale Fault. J. Geophys. Res. Solid Earth 120, 7048–7067. doi:10.1002/2014jb011560
Pitarka, A., Akinci, A., De Gori, P., and Buttinelli, M. (2022). Deterministic 3D Ground-Motion Simulations (0-5 Hz) and Surface Topography Effects of the 30 October 2016 Mw 6.5 Norcia, Italy, Earthquake. Bull. Seismol. Soc. Am. 112 (1), 262–286. doi:10.1785/0120210133
Priolo, E., Pacor, F., Spallarossa, D., Milana, G., Laurenzano, G., Romano, M. A., et al. (2019). Seismological Analyses of the Seismic Microzonation of 138 Municipalities Damaged by the 2016–2017 Seismic Sequence in Central Italy. Bull. Earthq. Eng. 18 (12), 1–41. doi:10.1007/s10518-019-00652-x
Quest, W. G., Raffaele, A., Andrea, T., Filippo, B., Romano, C., Sergio Del, M., et al. (2016). The 24 August 2016 Amatrice Earthquake: Macroseismic Survey in the Damage Area and EMS Intensity Assessment. Ann. Geophys. 59. fast track 5. doi:10.4401/ag-7203
Ren, Y., Wang, H., and Wen, R. (2017). Imprint of Rupture Directivity from Ground Motions of the 24 August 2016 M W 6.2 Central Italy Earthquake. Tectonics 36, 3178–3191. doi:10.1002/2017tc004673
Russo, E., Felicetta, C., D’ Amico, M., Sgobba, S., Lanzano, G., Mascandola, C., et al. (2022). “Italian Accelerometric Archive v3.2 - Istituto Nazionale di Geofisica e Vulcanologia,” in Dipartimento Della Protezione Civile Nazionale. doi:10.13127/itaca.3.2
Sánchez-Sesma, F., Chávez-Pérez, S., Suàrez, M., Bravo, M. A., and Pérez-Rocha, L. E. (1988). The Mexico Earthquake of September 19, 1985—On the Seismic Response of the Valley of Mexico. Earthq. Spectra 4 (3), 569–589. doi:10.1193/1.1585491
Sextos, A., De Risi, R., Pagliaroli, A., Foti, S., Passeri, F., Ausilio, E., et al. (2018). Local Site Effects and Incremental Damage of Buildings during the 2016 Central Italy Earthquake Sequence. Earthq. Spectra 34 (4), 1639–1669. doi:10.1193/100317eqs194m
Sgobba, S., Lanzano, G., and Pacor, F. (2020). Empirical Nonergodic Shaking Scenarios Based on Spatial Correlation Models: An Application to Central Italy. Earthq. Engng Struct. Dyn. 50, 60–80. doi:10.1002/eqe.3362
Tinti, E., Scognamiglio, L., Michelini, A., and Cocco, M. (2016). Slip Heterogeneity and Directivity of the ML 6.0, 2016, Amatrice Earthquake Estimated with Rapid Finite-Fault Inversion. Geophys. Res. Lett. 43, 10745–10752. doi:10.1002/2016gl071263
Wald, D. J., Quitoriano, V., Heaton, T. H., and Kanamori, H. (1999). Relationships between Peak Ground Acceleration, Peak Ground Velocity, and Modified Mercalli Intensity in California. Earthq. Spectra 15 (3), 557–564. doi:10.1193/1.1586058
Zhu, C., Cotton, F., Kawase, H., Haendel, A., and Nakano, K. (2022b). How Well Can We Predict Earthquake Site Response So Far? Machine Learning vs. Physics-Based Modeling. doi:10.13140/RG.2.2.34933.91365
Zhu, C., Cotton, F., Kawase, H., Haendel, A., Pilz, M., and Nakano, K. (2022a). How Well Can We Predict Earthquake Site Response So Far? Site-specific Approaches. Earthq. Spectra 38 (2), 1047–1075. doi:10.1177/87552930211060859
Keywords: site amplification effects, Amatrice earthquake, central Italy, ground motion simulations, horizontal-to-vertical spectral ratio (HVSR), generalized inversion technique (GIT)
Citation: Pischiutta M, Akinci A, Felicetta C, Pacor F and Morasca P (2022) Testing Site Amplification Curves in Hybrid Broadband Ground Motion Simulations of M6.0, 24 August 2016 Amatrice Earthquake, Italy. Front. Earth Sci. 10:886606. doi: 10.3389/feart.2022.886606
Received: 28 February 2022; Accepted: 26 April 2022;
Published: 13 June 2022.
Edited by:
Nicola Alessandro Pino, National Institute of Geophysics and Volcanology (INGV), ItalyReviewed by:
Chuanbin Zhu, GFZ German Research Centre for Geosciences, GermanyCopyright © 2022 Pischiutta, Akinci, Felicetta, Pacor and Morasca. This is an open-access article distributed under the terms of the Creative Commons Attribution License (CC BY). The use, distribution or reproduction in other forums is permitted, provided the original author(s) and the copyright owner(s) are credited and that the original publication in this journal is cited, in accordance with accepted academic practice. No use, distribution or reproduction is permitted which does not comply with these terms.
*Correspondence: Marta Pischiutta, bWFydGEucGlzY2hpdXR0YUBpbmd2Lml0
Disclaimer: All claims expressed in this article are solely those of the authors and do not necessarily represent those of their affiliated organizations, or those of the publisher, the editors and the reviewers. Any product that may be evaluated in this article or claim that may be made by its manufacturer is not guaranteed or endorsed by the publisher.
Research integrity at Frontiers
Learn more about the work of our research integrity team to safeguard the quality of each article we publish.