 Huang Wang1,2,3
 Zhihong Zhao
 Haonan Gan
- 1School of Environmental Studies, China University of Geosciences, Wuhan, China
- 2China Geological Survey, Ministry of Natural Resources, Beijing, China
- 3Technology Innovation Center for Geothermal & Hot Dry Rock Exploration and Development, Ministry of Natural Resources, Shijiazhuang, China
- 4Institute of Hydrogeology and Environmental Geology, Chinese Academy of Geological Sciences, Shijiazhuang, China
- 5Department of Civil Engineering, Tsinghua University, Beijing, China
- 6State Key Laboratory of Biogeology and Environmental Geology, China University of Geosciences, Wuhan, China
Hydraulic fracturing (HF) technology is crucial to form connected fracture network within the low-permeability geothermal reservoir. However, the HF process and failure mechanism in this process are only partly understood. A series of true triaxial hydraulic fracturing tests on large-scale natural granite samples were conducted under different confining conditions, combining with acoustic emission monitoring to evaluate the initiation and propagation of hydraulic fractures. Results show that a main hydro-fracture was formed in three samples during the first fracturing process. Many AE events occurred during the first pump period. The proportion of tensile fractures during the hydraulic fracturing accounted for more than 85% of all fractures. The test results could provide a new understanding of the effect of HF under different stress conditions. And implied that field engineering should pay attention to the initial HF, which may determine the main fracture framework of the field at the first pump procedure.
1 Introduction
Geothermal energy shows significant potential as a renewable energy because of its huge resource reserve, clean, and low-carbon characteristics. The geothermal heat source has been widely applied in power generation and heat supply uses (Moya et al., 2018). China has gradually increased its policy support for geothermal energy development in recent years. According to the outline of the 14th Five-Year Plan (2021–2025) for national economic and social development and vision 2035, China plans to develop and utilize geothermal energy in accordance with local conditions (Xinhua News Agency is authorized to release, 2021). The State Council released an action plan for reaching carbon dioxide peak before 2030, which proposed to explore ways of expanding the exploitation and utilization of geothermal energy (State Council Report, 2021). Hot dry rock (HDR) energy is an important part of geothermal energy, and is considered to be the future energy due to its huge reserves and development prospects (MIT-Led Report, 2006). Enhanced geothermal system (EGS) is essential for the extraction of geothermal heat from HDR, and a number of EGS sites have been carried out worldwide [(Lu, 2018) and references therein]. A series of EGS tests is conducted by the China Geological Survey (CGS) in Qinghai Province since 2018, and aim to establish a demonstration project in the next few years (Zhang et al., 2019).
Reservoir construction by Hydraulic fracturing (HF) for EGS is a key technology (Fan and Zhang, 2014; Wu et al., 2017; Tomac and Sauter, 2018). A network of hydraulic fractures can provide a path for fluid flow and heat exchange with the surrounding hot rock. The injected geothermal fluid (usually water) flows through the fractures and exchanges heat with the HDR reservoir.
The monitoring of HF and laboratory simulations have been intensively studied (Kumari et al., 2018; Liu et al., 2018; Xing et al., 2019; Zhou et al., 2019; Shan et al., 2021). The HF process of reservoir rocks can be monitored with the help of laboratory tests, and the propagation of fractures can be directly observed. This provides an understanding of the fracturing characteristics, rock fracture mechanism, and hydraulic fracture network distribution of HDR reservoirs at the given sites. The fracture initiation and propagation behavior of HF are mainly studied using true triaxial hydraulic fracturing physical simulation experiments. The influence of pre-existing fractures on HF in the EGS project has been proven in many previous studies (Guo, 2016; Mao et al., 2017; Kolawole and Ispas, 2020; Zhou et al., 2020; Liu et al., 2021). The extension path of hydraulic fractures in the HDR reservoir is simple and extending only in the direction of the maximum principal stress; however, because of the influence of the weak surface of the rock, hydraulic fractures prefer to extend along the weak surface, creating a complicated fracture network (Liu et al., 2021). Mao et al. (2017) conducted HF tests on granite with prefabricated fractures under different confining pressures, and found that the extension path of the hydraulic fractures obviously influenced by the magnitude of the horizontal stress difference, and the larger the horizontal stress difference, the greater the curvature of the hydraulic fracture extension path.
Previous studies have divided the process during HF into five stages (Caulk et al., 2016; Lei et al., 2019). 1) The steel wellbores of the sample were gradually filled with water, and the rock samples were not affected by the water pressure; 2) continued injection of water resulted in a rapid increase in pressure; 3) accumulation of pressure caused the rock to be hydrofractured; and 4) pressure of the induced hydraulic fracture was gradually released along the induced hydraulic fracture. In this process, under the same injection rate, there was almost no change in the water pressure, which is defined as the residual pressure that induces cracks. The residual pressure can be regarded as the corresponding minimum confining pressure; 5) post-fracture stage.
Acoustic emission (AE) systems are used to monitor fracture propagation and energy release activities in rocks (Matsunaga et al., 1993; Ishida, 2001; Zhou et al., 2019). Significant energy is released during HF fracture propagation, and AE events are generated (Ishida, 2001; Shan et al., 2021). Laboratory and field studies have shown that during HF the failure mechanism is not unique. The stress and direction of natural cracks control the dominant failure mechanism for HF (Fischer and Guest, 2011; Yamamoto et al., 2019). The failure mechanism can be distinguished by specific AE parameters, and cracks are classified into tensile and shear cracks (Yuyama et al., 1999; Ohtsu, 2010). The order of tension and shearing depends on the specific microcrack in granite (Li and Einstein, 2019).
However, for granites that are commonly applied to geothermal energy utilization, the HF process and failure mechanism are only partly understood, which merits further study. Additionally, fracturing experiments for large-scale granite samples are few.
In this study, a series of true triaxial hydraulic fracturing experiments were performed to evaluate the impact of the fracture on the HF process under different compressive pressures on natural granite rock samples. During the fracturing process, an acoustic emission monitoring system was used to record the acoustic emission events during the HF of the rock samples. The experiments show the AE-based fracturing behavior reveals the notable characteristics of hydraulic fractures. This study is useful for understanding the effect of HF in granite reservoirs under different stress conditions.
2 Experimental Procedures
2.1 Experiment Setup
The equipment used in this experiment was a true triaxial hydraulic fracture propagation simulation system developed by Jiangsu Huaan Scientific Reasarch Devices Co., Ltd. The equipment can carry a maximum sample size of 600 mm × 600 mm × 600 mm, and the triaxial pressure can be automatically and uniformly loaded separately. The maximum loading pressure is 70 MPa. To accurately detect the development of fractures, an acoustic emission probe is directly installed on the surface of the rock sample. During the test preparation stage, the rock sample was opened and slotted for the monitoring probe.
The equipment included a true triaxial pressure control system and a pressure monitoring system (Figure 1) as well as an acoustic emission monitoring system in addition to the fracturing main part, which can monitor the pressure and acoustic emission data in real time during the experiment, to identify the fracture development, and the fluid used for fracturing. The maximum injection pressure is up to 120 MPa.
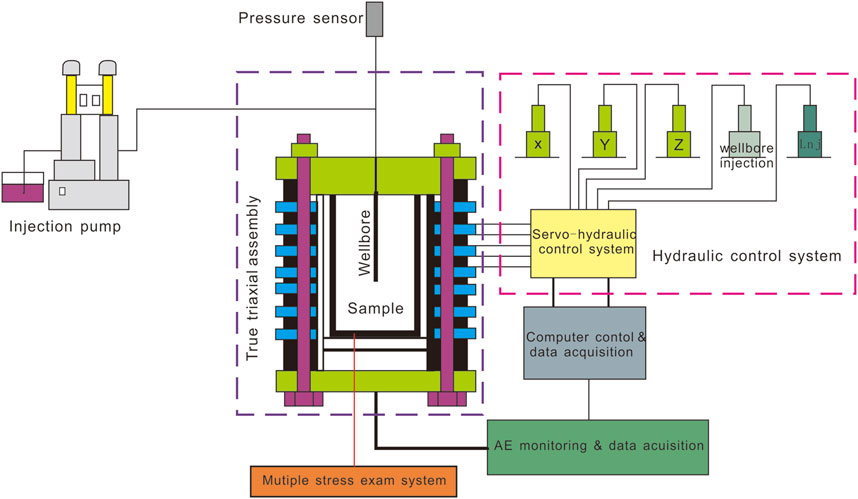
FIGURE 1. Schematic diagram of the true triaxial hydraulic fracturing system.
2.2 Sample Preparation
The samples used in the HF experiments were all outcropping Permian strata and Middle-Late Triassic granodiorite and granite from Qinghai Province, northwestern China. The samples were gray, medium-grained biotite granite, with a massive structure. The sample size was 400 mm × 400 mm × 400 mm cubes, all of which were polished in order to reduce uneven stress of the samples during the test. Three samples were prepared to study the influence of the injection pressure on the HF and AE parameters. Distilled water was used as the fracturing fluid during the fracturing process.
Before processing, we carefully checked for natural cracks on each end surface of the sample, recorded, and described them. The samples were relatively intact, and no obvious natural cracks were observed (Figure 2A). The samples were then perforated and slotted, including injection wells (bore diameter is 30 mm, hole depth is 200 mm, which equals 1/2 of the sample side length) and holes for acoustic emission probe placement (Figure 2B). The reason for the designed length of the injection well is to attempt to keep the fracturing extension and AE events as centrally located as possible. After completing the drilling, the wellbore was placed in a well, sealed the wellbore with glue, and dried for at least 24 h to ensure the sealing effect (Figure 2C).
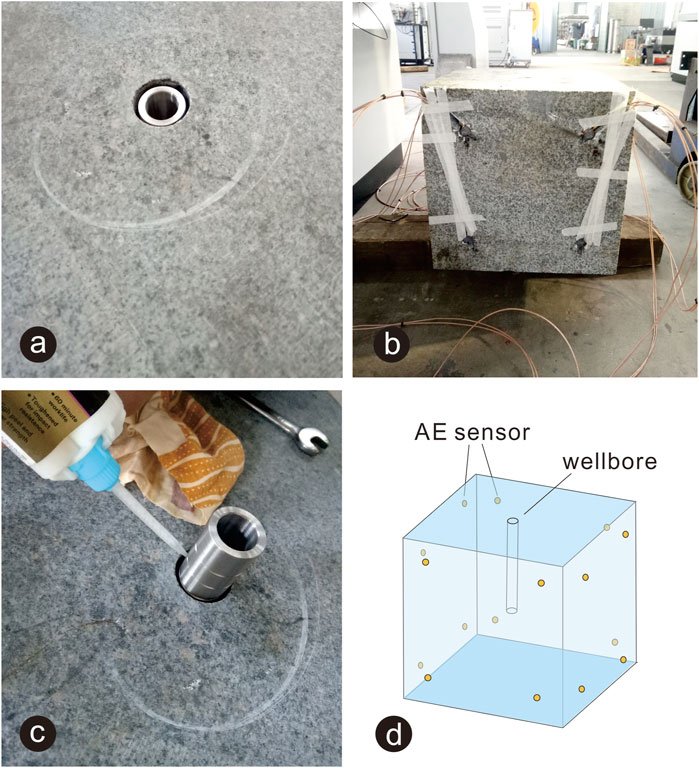
FIGURE 2. Sample preparation (A) intact surface of samples; (B) arrangements of AE sensor; (C) wellbore sealed with glue; (D) AE sensors layout on cubic samples.
2.3 Testing Procedure
Considering that the scale of the rock sample is very small compared to in-situ fracturing, large confining pressure cannot be set for HF when the confining pressure is added in the early stage of the test. The value of the pressure begins to increase gradually, and a relatively large confining pressure difference owing to the strength of the granite, which makes the effect of the confining pressure on the fracture more obvious.
Before the start of the experiment, the confining pressure system, fracturing fluid injection pump, pressure monitoring system, and AE monitoring system were turned on. The target confining pressure value was entered on the display of the confining pressure system, and pressurizing was started. The pressure and AE monitoring start time are recorded and used to adjust the data to the same timeline for corresponding analysis. Comparing with the thermal reservoir condition in the field, an injection rate of 20 ml/min was adopted for the experiment. Different triaxial pressures were applied for each sample (Table 1), which are the equal proportional reduction of the situ geological stresses. We set the vertical confining pressure (Y) as the maximum stress, while there is a difference of 5 MPa between the horizontal confining pressure (X and Z). The value of the confining pressures of the samples are increased in sequence, which is used to simulate the fracture propagation of the field HF process. The experiment was processed under 23°C. i.e., the room temperature in the laboratory. Pressurizing was stopped and maintained after the confining pressure value was stable. Then the injection pressure was started, and simultaneously recording pressure and acoustic emission data. When the injection pressure in the boreholes stabilized, data collection was complete and the experiment was finished.
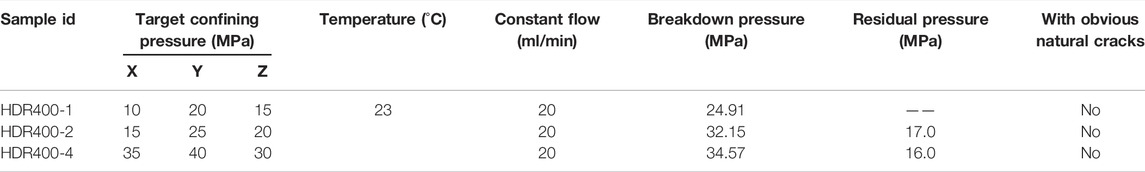
TABLE 1. Experimental programs and results.
2.4 Acoustic Emission Monitoring
The AE signal detecting part includes three eight-channel AE signal processing systems (PCI-2). The AE system is from the American physical acoustics company (PAC), which has an operating frequency range from 20 to 1,500 kHz. The trigger threshold of AE was set to 40 dB. The sensors were separated into four groups, which were adhered to the surrounding surfaces of the samples, respectively (Figure 2D). Sixteen AE sensors are used to enhance source location accuracy in this study. The location coordinates of the AE events were determined by the arrival time differences between different sensors, the sensor arrangement geometry, and the propagation velocity through the granite (Shang et al., 2021). After installation, the probe was connected to the acoustic emission system according to the serial number, and the upper adapter plate, pressure injection joint, and longitudinal pressure pump head. The upper pressure plate was then fixed with a nut.
The detected AE signal was analyzed by the rise time, AE counts, AE amplitude, and AE duration (Mao et al., 2017), which is illustrated in Figure 3. The injection pressure and AE parameters were combined to evaluate the propagation of the hydraulic fracture (Landis and Baillon, 2002).
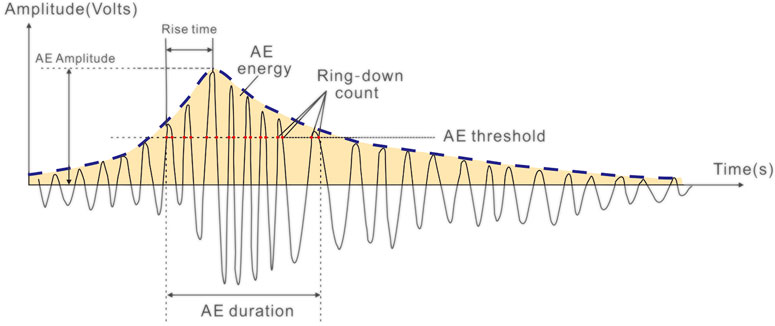
FIGURE 3. AE hit feature extraction [Modified from (Fischer and Guest, 2011)].
3 Results
3.1 Injection Pressure and AE Characterizations
The experiment results are presented in Table 1. The samples showed different HF characteristics under different confining pressure conditions, with the same flow rate and temperature. The confining pressures, AE parameters, and spatial distribution characteristics showed differences during the experimental process. In order to better observe the trend of AE parameters during the hydraulic fracturing experiment, we eliminated several very-high values (>300 aJ) of AE energy events, most of which were occurred once the rock fractured, and the elimination would not influence the distribution trend of AE energy and count.
3.1.1 Sample HDR400-1
The injection pressure of HDR400-1 started to rise rapidly 2 min after the injection began, and reached a breakdown pressure of 24.91 MPa (Figure 4). Once the rock fractured, the injection pressure quickly dropped to 10.57 MPa. During this process, the AE activity increased significantly, and the AE energy and count reached the maximum of the entire experimental process. Dense AE activity still occurred in the case of a sudden drop in the injection pressure. Subsequently, the injection pressure continued to rise at a relatively rapid rate until it reached 21.39 MPa, and breakdown occurred again; the pressure dropped rapidly to 14.43 MPa. During the second fracture process, the AE activity was also dominant, but compared with the first fracture process, the AE energy and count were weakened. Subsequently, the pressure rapidly increased, and the third fracture process occurred. The breakdown pressure was 24.78 MPa, which was remarkably close to the breakdown pressure of the first time, whereas the pressure dropped to 21.75 MPa. During the third fracture process, there was no obvious AE activity, and the AE energy and count were also significantly reduced, indicating that no obvious cracks were formed in the process.
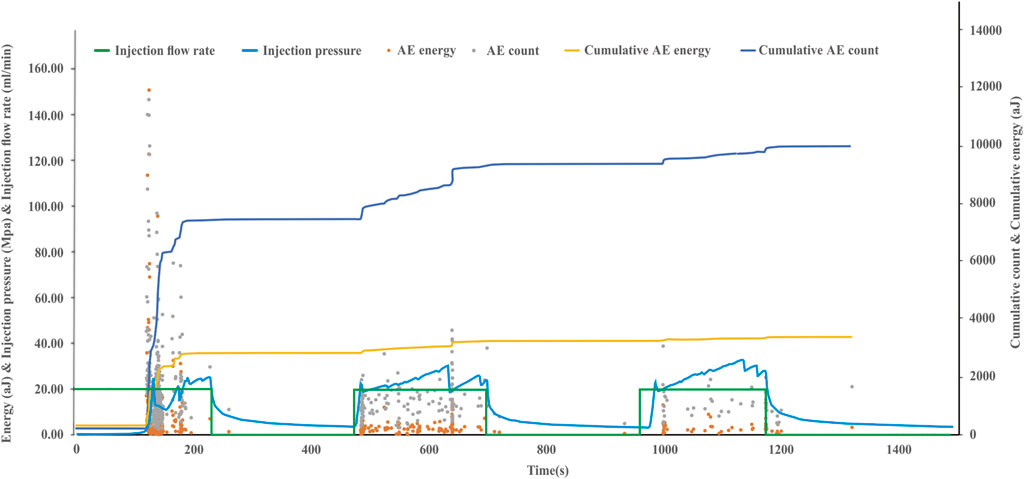
FIGURE 4. Result of the injection pressure and AE energy and count of HDR400-1.
After the pump was filled with water and injection continued, the pressure increased again and reached a breakdown pressure of 22.63 MPa. After re-pumping, the breakdown pressure was lower than the pressure during the first pumping period. After the breakdown, the injection pressure dropped to 18.16 MPa and then slowly increased to 29.86 MPa. During this process, the AE activity continued to appear, which may represent the continuous occurrence of small-scale cracks causing decompression and injection pressurization during the crack extension.
Cracks occurred when the injection pressure dropped sharply, and a large amount of AE activity was generated simultaneously. The pressure drop occurred because the injection water gradually filled the fractures suddenly formed by fracturing, forming a short-time decompression space. When the crack is filled with water, the pressure increases, forcing the cracks to expand. The subsequent breakdown pressure of the second and third pump periods continued to increase, indicating the continuous expansion of the cracks; however, the AE energy and count were less than those of the first pump period. It can be seen from the cumulative AE energy and count that during the first fracture process, more than half of the AE energy accumulation was completed quickly. The accumulation of AE energy and count was relatively smooth during the subsequent pumping periods.
3.1.2 Sample HDR400-2
After the injection started, the injection pressure increased rapidly (Figure 5). The breakdown pressure was 32.15 MPa. Afterwards, the pressure dropped sharply to 17.13 MPa, and the pressure increases to 18.15 MPa. A second fracture occurred, and the pressure dropped to 15.78 MPa. The pressure then increased slowly and steadily, indicating that the continuous water injection after the fracture occurred caused the cracks to propagate. After the pressure increased to 17.15 MPa, the pump refilled water, and the pressure decreased to 2.38 MPa during this process.
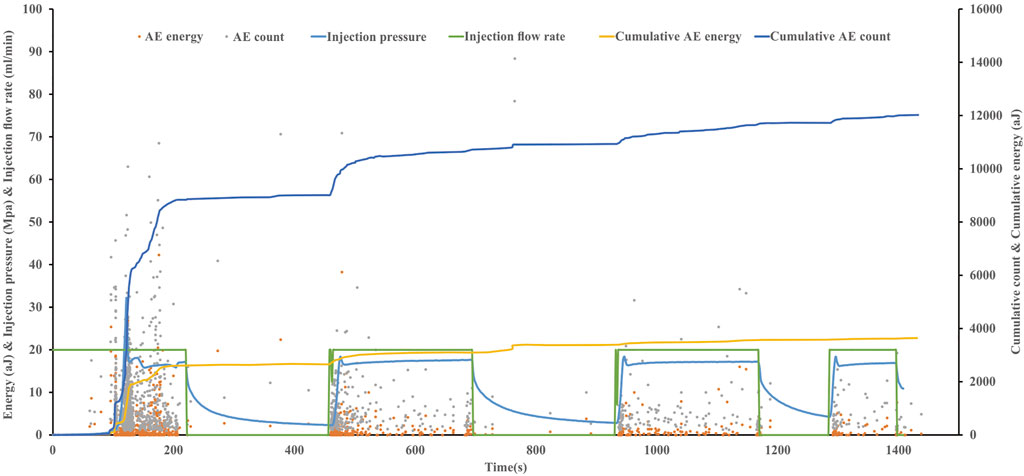
FIGURE 5. Result of the injection pressure and AE energy and count of HDR400-2.
The pressure curves in the 2–4 pump periods were similar. The breakdown pressure is 18.39–18.43 MPa. It can be explained that the required breakdown pressure cannot reach 32.15 MPa because the cracks have been opened before. The injection pressure stabilizes at approximately 17 MPa, which is similar to the 17.15 MPa of the first pump period. This suggests that the very first fracture process is the most important fracture process in the entire hydraulic fracture experiment, and a long extended fracture framework may have been formed. This can be verified by the spatial distribution characteristics of acoustic emission (Figure 5). The fracture expands along the direction of the first fracture process under a stable pressure of 17 MPa during subsequent pump periods.
3.1.3 Sample HDR400-4
After the sample HDR400-4 injected water to fill the wellbore, the injection pressure increased rapidly and fracture occurred (Figure 6). The breakdown pressure was 34.57 MPa. Subsequently, the pressure decreased sharply to 11.86 MPa, and the pressure increased slowly to 14.40 MPa until the pump refilled water, and the pressure decreased to 2.49 MPa.
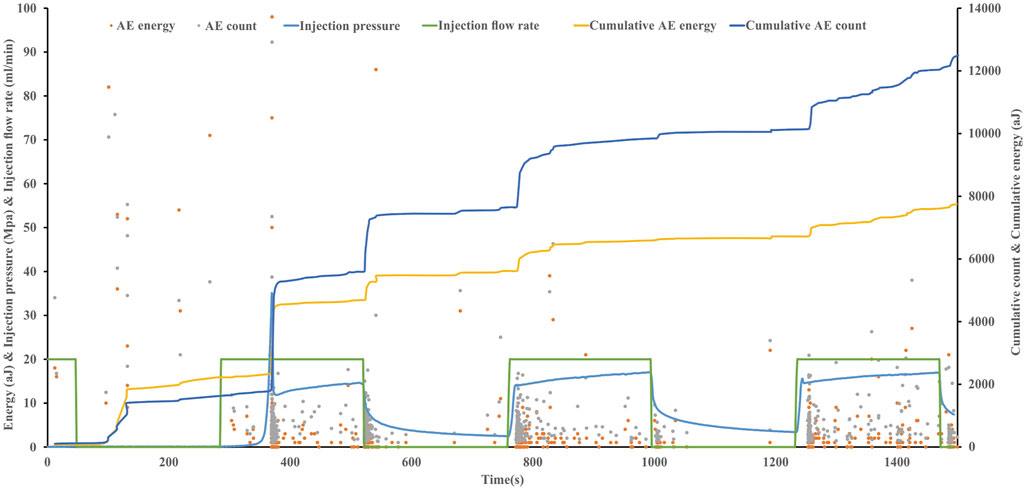
FIGURE 6. Result of the injection pressure and AE energy and count of HDR400-4.
The pressure curve patterns in the 2–3 pumps are similar, and the pressure rises rapidly after re-pumping. As the cracks steadily expand, the injection pressure steadily increases from approximately 14–17 MPa, which is higher than the residual pressure of the first pump at 14.40 MPa. This may be because the injection water was exhausted before the residual pressure increased to 17 MPa.
The cumulative AE energy and count did not show a rapid increase during the first pump period. Instead, there was a rapid increase during the second pump period.
3.2 Spatial Distribution Characteristics of AE
3.2.1 Sample HDR400-1
The AE spatial distribution of sample HDR400-1 shows that the HF produced a main fracture that is parallel to the direction of the maximum principal stress, and projects a relatively concentrated fracture distribution on the XY plane. It can be seen that the locations of the AE events are aligned with the hydraulic fracture (Figure 7A).
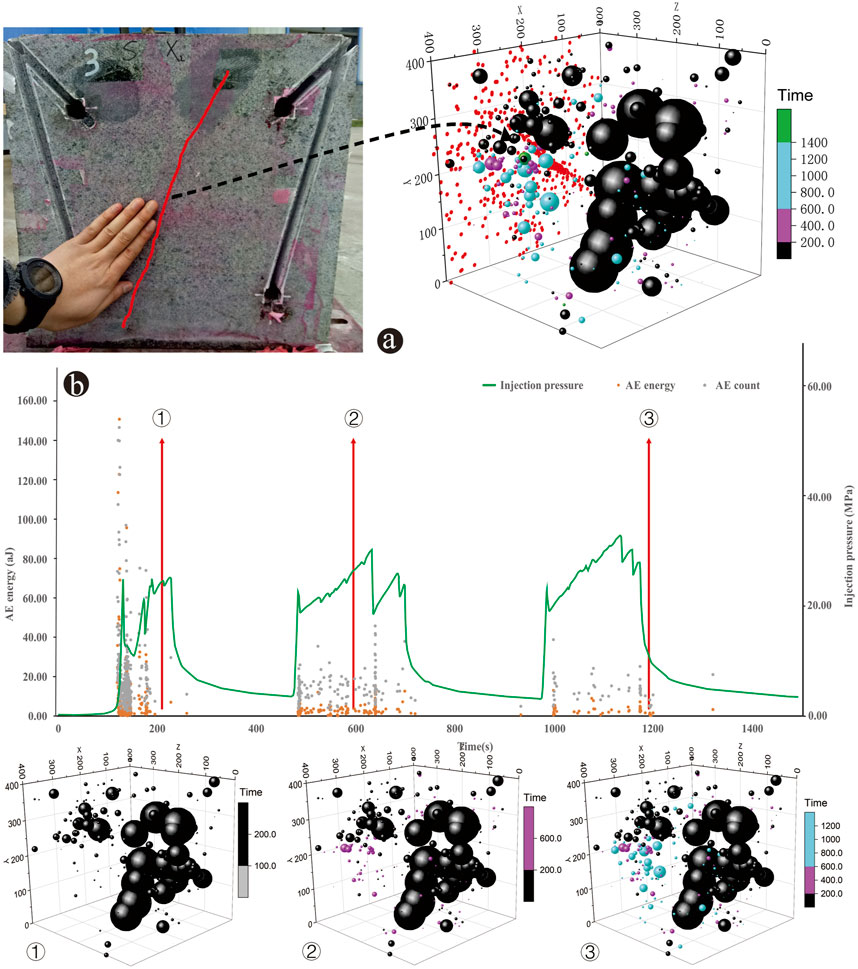
FIGURE 7. AE spatial distribution characteristics of HDR400-1 (A) AE spatial distribution compared with the surface appearance of the sample. Each sphere represents a single AE event, and the size of the spheres represent the value of AE energy. The red scatter points are the projection of the AE events on the X-Y plane; (B) AE spatial distribution of each pump periods, and ①–③ represent the first to third pump periods.
The AE energy and count during the first pump period were high, mainly on one side of the well pipe, and constituted the fracture framework (Figure 7B). The AE energy and count of each subsequent pump period were less than those of the first pump period, and the spatial distribution of AE events extends to the other side of the well pipe, showing a lower energy and denser distribution. Overall, sample HDR400-1 shows that the first pump period formed the main fracture framework.
3.2.2 Sample HDR400-2
The AE spatial distribution of sample HDR400-2 appeared to be relatively dense, and the main fracture direction was parallel to the maximum principal stress direction (Figure 8A). The main fracture channel is projected onto the X-Y plane, with a relatively large fracture width (Figure 8A). From the temporal and spatial distribution of AE, the fracture process during the first pump period was mainly concentrated around the well pipe and formed the main fracture framework (Figure 8B). During the subsequent 2–4 pump injection periods, the cracks gradually spread to the outside. The extended AE events are still mainly in the range of the main fracture, which is equivalent to the extension of the main fracture. Owing to its larger confining pressure compared to HDR400-1, the fracture extension speed is slow, causing the injected water to accumulate in the main fracture.
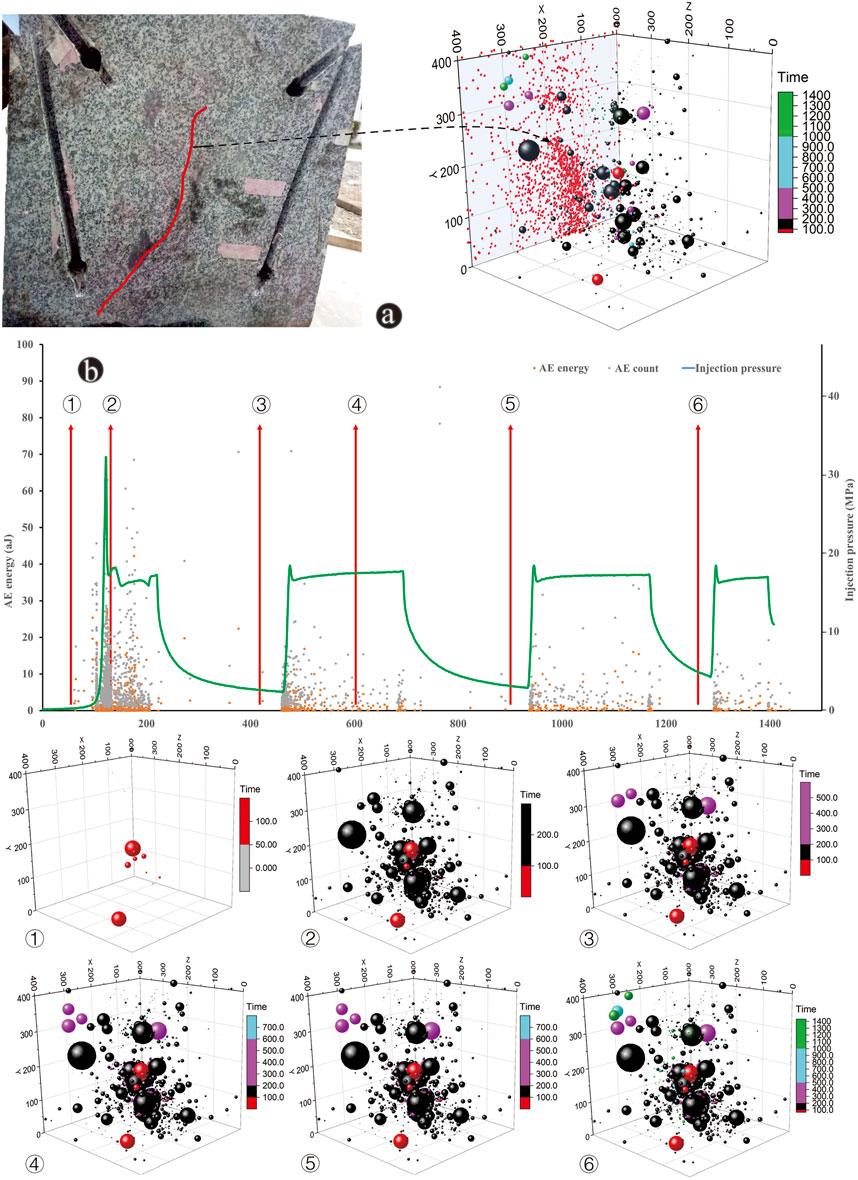
FIGURE 8. AE spatial distribution characteristics of HDR400-2 (A) AE spatial distribution compared with the surface appearance of the sample; (B) AE spatial distribution of each pump period. ①–⑥ represent the spatial distribution characteristics of AE for different section of the pressure curve corresponding to the time increasing. See Figure 7 for detailed figure description.
3.2.3 Sample HDR400-4
The fractures produced by sample HDR400-4 formed a dense main channel (Figure 9A). The AE events with larger energy at the first fracture process are mainly parallel to the direction of the maximum principal stress, whereas the denser small-energy AE events are almost horizontally distributed, approximately perpendicular to the direction of the maximum principal stress, which coincides with the fractures appearing on the surface of the sample. It is possible that this phenomenon is related to the influence of the weak layers inside the rock sample; that is, the larger energy events are new cracks formed by HF, and the nearly horizontal dense AE events may have been formed by the weak layers. Therefore, the energy released by the dense horizontal AE events was relatively small. The fractures formed during the first pump period were mainly concentrated in the vertical and horizontal planes at the bottom of the wellbore (Figure 9B). During the second and third pumping periods, the fractures mainly extended to the plane of the wellbore and slightly upwards, representing the main fractures extending far away.
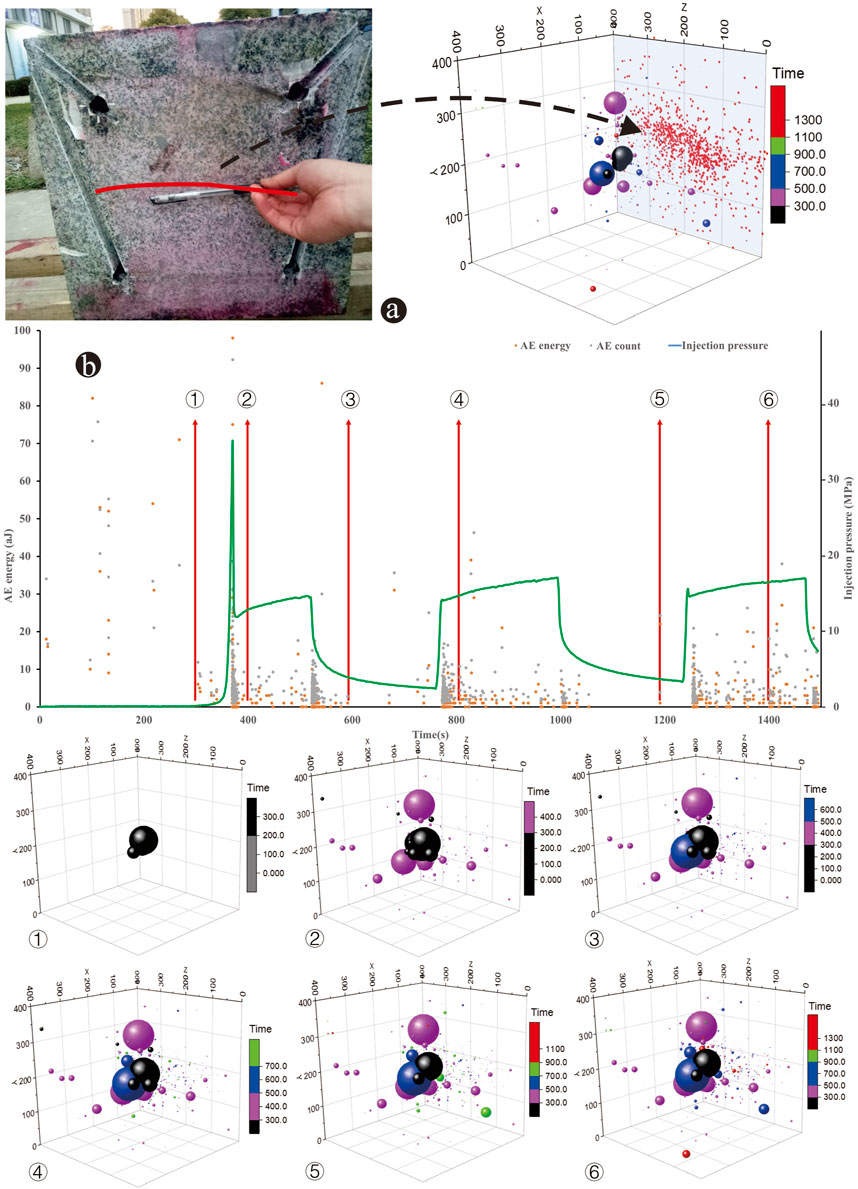
FIGURE 9. AE spatial distribution characteristics of HDR400-4 (A) AE spatial distribution compared with the surface appearance of the sample; (B) AE spatial distribution of each pump periods. See Figure 7 for detailed figure description.
4 Discussion
4.1 Analysis of AE Parameters During Hydraulic Fracturing
4.1.1 AE Events During Hydraulic Fracturing
When the injection pressure drops sharply after the peak pressure, the hydraulic fractures rapidly spread, and many AE events occur in the form of stress waves due to the release of potential strain energy (Lei et al., 2019). Similar situation is reported by Ishida et al. (1997) that after injecting high-pressure water into the granite, with the sudden drop of pressure, the AE count increased sharply and the cracks expanded rapidly (Ishida et al., 1997). A main fracture framework was formed in all three samples during the first fracturing process. Under low confining pressures (e.g., sample HDR400-1), the main fractures relatively extend longer, and in the subsequent pump periods, the formation and expansion of fractures occur in the blank areas where no cracks occurred before. However, for the high confining pressure cases (e.g., samples HDR400-2 and HDR400-4), the propagation of fractures in the subsequent pump periods was the continuous reconstruction of the main fractures. Usually, the direction of fracture propagation is perpendicular to the direction of the minimum principal stress (Shang et al., 2021), however the spatial distribution of the AE events in three samples indicates that the direction of the main fractures does not exactly coincide with the maximum stress directions. We speculate that the reason may be due to the artificial damage inside the rock samples during the transportation to the laboratory and the sample-cutting process.
4.1.2 Accumulative AE Energy and Counts During Hydraulic Fracturing
The cumulative AE energy changes before and after the breakdown pressure shows the energy required for the rock fracturing, and the propagation of the fracture caused a release of energy during the fracturing process. For the samples HDR400-1 and HDR400-2, the AE energy accumulates rapidly during the first pump period, and then slowly increases for the subsequent pump periods (Figure 10), which is consistent with the observations of Xing et al. (Shan et al., 2021). However, the sample HDR400-4 shows a difference variation trend that the accumulated AE energy is small for the first pump period, and then increased progressively during the subsequent pump periods, perhaps indicating that the condition of high confining pressure limits the rock fracturing during the first pump period. Similarly, the variation of cumulative AE count has a good corresponding with the cumulative AE energy (Figure 11).
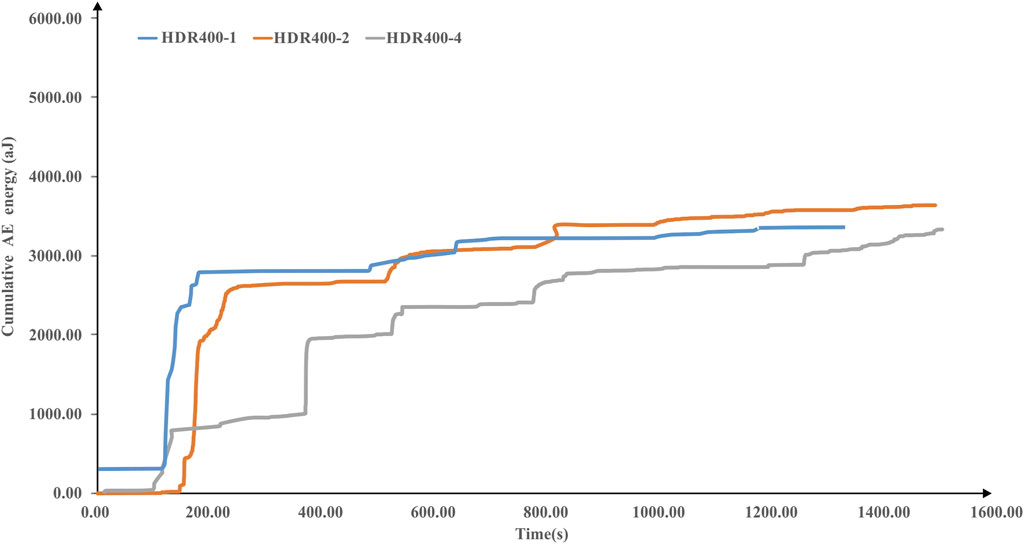
FIGURE 10. Cumulative AE energy over time.
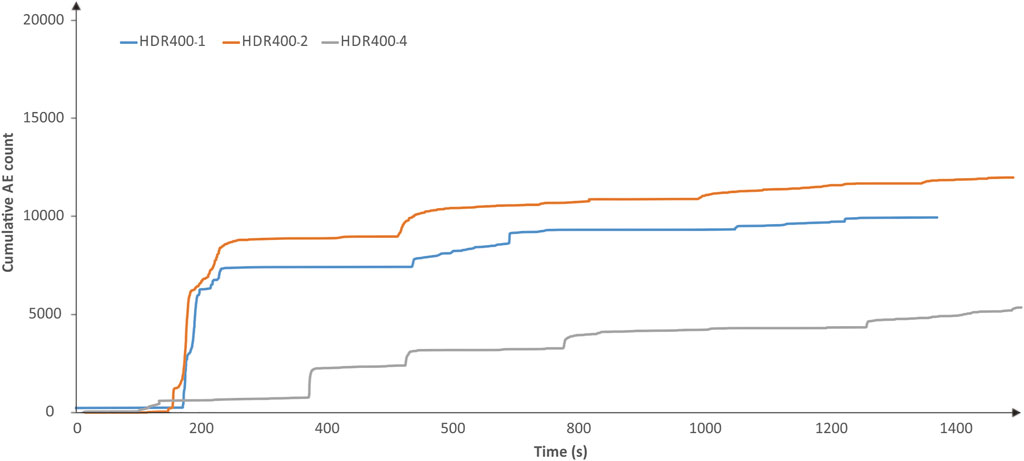
FIGURE 11. Cumulative AE count over time.
4.1.3 Analysis of Failure Mechanism
The characteristics of the AE signals are evaluated primarily by the RA value and the average frequency (AF) (Ohtsu, 2010), which are defined as follows:
The RA value of AE events can be used to distinguish the failure mechanisms, where the RA value of shear failure is generally higher than the RA value of tensile failure (Yue et al., 2019). According to the relationship between the RA value and AF, the detected AE events can be divided into tensile and shear fractures based on the method of JCMS-III B5706 (Ohtsu, 2010; Mao et al., 2017).
As can be seen in Figure 12 that the percentages of tensile events are 96.9, 90.5, and 91.9%, respectively, for the samples HDR400-1, HDR400-2, and HDR400-4. Although it is necessary to note that the approach based on RA value and AF is kind of empirical method, it can be interoperate that tensile crack dominates in all tests [(Zhang et al., 2021) and references therein]. This result was well in accordance with Jiang et al. (2020), which reported tensile crack comprised over 94% of the cracks. It can be explained that tensile cracks are commonly observed in the initial loading and failure preparatory phase (Zhuang and Zang, 2021), which concentrates most of the AE events.
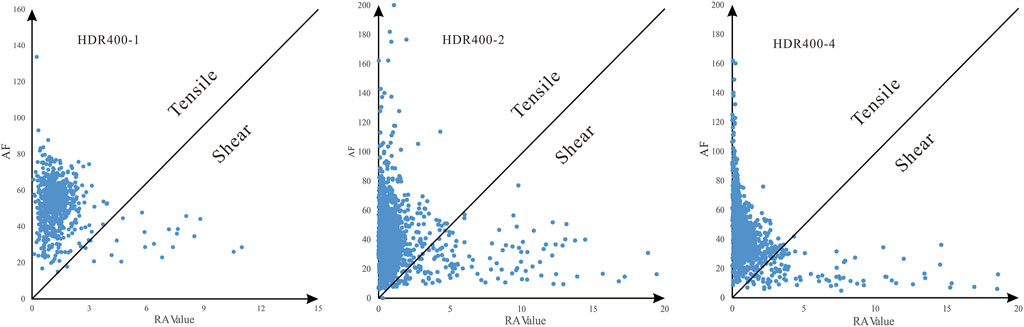
FIGURE 12. Classification of tensile and shear fracture.
4.2 Analysis of Confining Pressure on Hydraulic Fracturing
Through comparing three samples it can be found that the initial breakdown pressure increases correspondingly with the confining pressure increases (Figure 13), indicating that the high confining pressure has a limiting effect on the rock fracturing. Once the rock is fractured, the higher confining pressure caused the increasing of the fracture surface roughness (Hu et al., 2019; Liu et al., 2021). This may contribute to the fracture remaining open, which results in significantly lower breakdown pressure for subsequent pumping. In addition, after the hydraulic fractures occurring, the residual pressure decreases gradually with the increase of confining pressure, indicating the hydraulic pressure required to maintain the fracture propagation is low at high confining pressure. The samples HDR400-2 and HDR400-4 exhibit similar variation trends of breakdown pressure, in which a high breakdown pressure occurs at first and then the pressure rapidly decrease and stabilize in a lower level. In contrast, the variation of the sample HDR400-1 was different that the pressure maintained at a higher level at whole fracturing process (Figure 13). This may be due to the pressure increase caused by the continuous formation of new cracks in the unfractured area during the expansion of the sample HDR400-1.
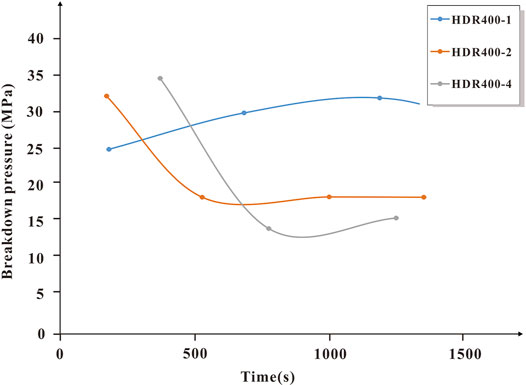
FIGURE 13. Comparison of sample breakdown pressure curves over time.
In order to verify the reliability of the measured breakdown pressure, the empirical equations established by Haimson and Fairhurst (1967) (H&F) and Anderson et al. (1973) were used to calculate the HF breakdown pressures.
Where
The results showed that the breakdown pressures calculated by Eq. 4-3) are relatively high compared with the measured values, while the breakdown pressures calculated by Eq. 4-4) are lower than the measured values. That is, the measured HF breakdown pressures fall in the middle range of the calculated results of these two empirical equations.
We compared with measured values of other studies in Qinghai Province, and the results show consistency (Figure 14). Lei et al. (2019) obtained the HF breakdown pressures of monzogranite at room temperature of 30.6–44.3 MPa. Zhou et al. (2019) reported the HF breakdown pressures of granite of 26.49–26.65 MPa. Cheng et al. (2020) obtained the HF breakdown pressures of 23.07–30.28 with the temperatures range of 30–120°C. Since the measured HF breakdown pressure is influenced by the sample size, confining pressure, injection flow rate, temperature, etc. (Lei et al., 2019; Cheng et al., 2020), we speculate that the deviations between former studies and our results may be due to the different experimental conditions.
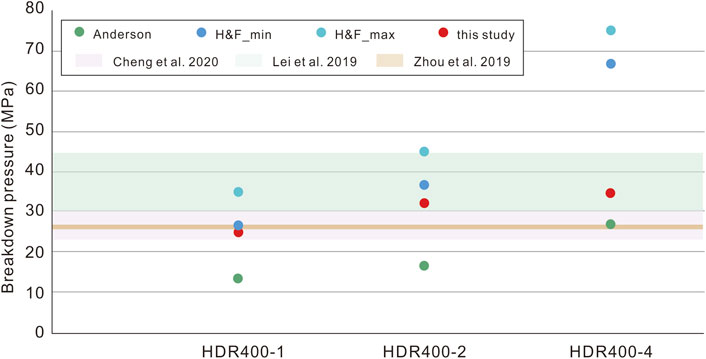
FIGURE 14. Comparison between measured HF breakdown pressure and relative literature results in Qinghai.
4.3 Implication for Field Fracturing
Although the number of samples in our HF test is small, all three samples exhibit the formation of the main fracture framework during the first pumping, which indicates that the initial HF operation would likely has a large impact on field reservoir construction. And high confining pressure will cause the fracture modification to be concentrated near the borehole, but lower confining pressure help to the main fractures to extend longer (Warpinski et al., 1982). This suggests that HF at shallow depths (low confining pressure) may result in greater reservoir space, while the deeper depths (high confining pressure) is likely to create smaller reservoir space, but with more adequate reservoir construction effect. The HF experiments also indicate that selecting a field site with relatively low geological stress is more beneficial for fracture expansion (Cheng et al., 2020). The failure mechanism of all samples revealed a dominate character of tensile crack, suggesting that tensile crack occurs first when HF is processing at field site of Qinghai.
5 Conclusion
We find that a main hydro-fracture was formed during the first fracturing process. Under high confining pressure, a larger breakdown pressure is required for rock fracturing, meanwhile the residual pressure gradually decreased. After the fracture formation, the pressure required to maintain crack extension was lower under higher confining pressure. Many AE events with greater energy occurred during the first pump period. The accumulated energy is slowly and stable at the subsequent pump periods. The proportion of tensile fractures during the hydraulic fracturing ac the effect of HF counted for more than 85% of all fractures. The subsequent fracture extension is mainly concentrated in the wellbore, rather than extending to the distant region to form new fractures. Therefore, we suggest that field engineering should carefully launch the initial HF, which may determine the main fracture framework of the field at the first pump procedure.
Data Availability Statement
The raw data supporting the conclusion of this article will be made available by the authors, without undue reservation.
Author Contributions
WH: Writing original draft. WG: Conceptualization and Investigation. CY: Software and Visualization. LL: Investigation and Methodology. ZZ: Supervision and Methodology. GH: Visualization.
Funding
This work was supported by the National Key Research and Development Program of China (2019YFB1504203), China Geological Survey Project (DD20221676), the Fundamental Research Funds of the Chinese Academy of Geological Sciences Project (SK201906), National Natural Science Foundation of China (41807208), and S&T Program of Hebei (20374201D).
Conflict of Interest
The authors declare that the research was conducted in the absence of any commercial or financial relationships that could be construed as a potential conflict of interest.
Publisher’s Note
All claims expressed in this article are solely those of the authors and do not necessarily represent those of their affiliated organizations, or those of the publisher, the editors and the reviewers. Any product that may be evaluated in this article, or claim that may be made by its manufacturer, is not guaranteed or endorsed by the publisher.
References
Anderson, R. A., Ingram, D. S., and Zanier, A. M. (1973). Determining Fracture Pressure Gradients from Well Logs. J. Pet. Techn. 25, 1259–1268. doi:10.2118/4135-pa
Caulk, R. A., Ghazanfari, E., Perdrial, J. N., and Perdrial, N. (2016). Experimental Investigation of Fracture Aperture and Permeability Change within Enhanced Geothermal Systems. Geothermics 62, 12–21. doi:10.1016/j.geothermics.2016.02.003
Cheng, Y., Zhang, Y., Yu, Z., Hu, Z., and Yang, Y. (2020). An Investigation on Hydraulic Fracturing Characteristics in Granite Geothermal Reservoir. Eng. Fracture Mech. 237, 107252. doi:10.1016/j.engfracmech.2020.107252
Fan, T.-g., and Zhang, G.-q. (2014). Laboratory Investigation of Hydraulic Fracture Networks in Formations with Continuous Orthogonal Fractures. Energy 74, 164–173. doi:10.1016/j.energy.2014.05.037
Fischer, T., and Guest, A. (2011). Shear and Tensile Earthquakes Caused by Fluid Injection. Geophys. Res. Lett. 38, a–n. doi:10.1029/2010GL045447
Guo, L. L. (2016). Test and Model Research of Hydraulic Fracturing and Reservoir Damage Evolution in Enhanced Geothermal System [dissertation]. Jilin: Jilin University. (in Chinese with English abstract).
Haimson, B., and Fairhurst, C. (1967). Initiation and Extension of Hydraulic Fractures in Rocks. Soc. Petrol. Engng J. 7, 310–318. doi:10.2118/1710-pa
Hu, D., Li, J., Zhou, H., Lu, J., Ma, D., and Zhang, F. (2019). Gas Permeability Evolution of Granite under Confining Pressure Unloading Tests. Eur. J. Environ. Civil Eng. 25, 1915–1928. doi:10.1080/19648189.2019.1610073
Ishida, T. (2001). Acoustic Emission Monitoring of Hydraulic Fracturing in Laboratory and Field. Construction Building Mater. 15 (5–6), 283–295. doi:10.1016/S0950-0618(00)00077-5
Ishida, T., Chen, Q., and Mizuta, Y. (1997). Effect of Injected Water on Hydraulic Fracturing Deduced from Acoustic Emission Monitoring. Pure Appl. Geophys. 150, 627–646. doi:10.1007/s000240050096
Jiang, Z., Li, Q., Hu, Q., Liang, Y., Xu, Y., Liu, L., et al. (2020). Acoustic Emission Characteristics in Hydraulic Fracturing of Stratified Rocks: A Laboratory Study. Powder Techn. 371, 267–276. doi:10.1016/j.powtec.2020.05.050
Kolawole, O., and Ispas, I. (2020). Interaction between Hydraulic Fractures and Natural Fractures: Current Status and Prospective Directions. J. Petrol. Explor Prod. Technol. 10 (4), 1613–1634. doi:10.1007/s13202-019-00778-3
Kumari, W. G. P., Ranjith, P. G., Perera, M. S. A., Li, X., Li, L. H., Chen, B. K., et al. (2018). Hydraulic Fracturing under High Temperature and Pressure Conditions with Micro CT Applications: Geothermal Energy from Hot Dry Rocks. Fuel 230, 138–154. doi:10.1016/j.fuel.2018.05.040
Landis, E. N., and Baillon, L. (2002). Experiments to Relate Acoustic Emission Energy to Fracture Energy of Concrete. J. Eng. Mech. 128128 (6), 6986–7702. doi:10.1061/(ASCE)0733-939910.1061/(asce)0733-9399(2002)128:6(698)
Lei, Z., Zhang, Y., Hu, Z., Li, L., Zhang, S., Fu, L., et al. (2019). Application of Water Fracturing in Geothermal Energy Mining: Insights from Experimental Investigations. Energies 12 (11), 2138. doi:10.3390/en12112138
Li, B. Q., and Einstein, H. H. (2019). Direct and Microseismic Observations of Hydraulic Fracturing in Barre Granite and Opalinus Clayshale. J. Geophys. Res. Solid Earth 124 (11), 11900–11916. doi:10.1029/2019JB018376
Liu, X., Feng, B., Liu, Y., and Yuan, Y. (2021). Hydraulic Conductivity Characteristics of Hot Dry Rocks under Different Fracture Modes. Acta Geologica Sinica (Eng) 95 (6), 1915–1925. doi:10.1111/1755-6724.14872
Liu, Z., Wang, S., Zhao, H., Wang, L., Li, W., Geng, Y., et al. (2018). Effect of Random Natural Fractures on Hydraulic Fracture Propagation Geometry in Fractured Carbonate Rocks. Rock Mech. Rock Eng. 51 (2), 491–511. doi:10.1007/s00603-017-1331-y
Lu, S.-M. (2018). A Global Review of Enhanced Geothermal System (EGS). Renew. Sustain. Energ. Rev. 81, 2902–2921. doi:10.1016/j.rser.2017.06.097
Mao, R., Feng, Z., Liu, Z., and Zhao, Y. (2017). Laboratory Hydraulic Fracturing Test on Large-Scale Pre-cracked Granite Specimens. J. Nat. Gas Sci. Eng. 44, 278–286. doi:10.1016/j.jngse.2017.03.037
Matsunaga, I., Kobayashi, H., Sasaki, S., and Ishida, T. (1993). Studying Hydraulic Fracturing Mechanism by Laboratory Experiments with Acoustic Emission Monitoring. Int. J. Rock Mech. Mining Sci. Geomechanics Abstr. 30 (7), 909–912. doi:10.1016/0148-9062(93)90043-D
Mit-Led Report, (2006). The Future of Geothermal Energy: Impact of Enhanced Geothermal System (EGS) on the United States in 21st Century. MIT-led interdisciplinary panel.
Moya, D., Aldás, C., and Kaparaju, P. (2018). Geothermal Energy: Power Plant Technology and Direct Heat Applications. Renew. Sustain. Energ. Rev. 94, 889–901. doi:10.1016/j.rser.2018.06.047
Ohtsu, M. (2010). Recommendation of RILEM TC 212-ACD: Acoustic Emission and Related NDE Techniques for Crack Detection and Damage Evaluation in concrete*. Mater. Struct. 43 (9), 1187–1189. doi:10.1617/s11527-010-9640-6
Shan, K., Zhang, Y., Zheng, Y., Cheng, Y., and Yang, Y. (2021). Effect of Fault Distribution on Hydraulic Fracturing: Insights from the Laboratory. Renew. Energ. 163, 1817–1830. doi:10.1016/j.renene.2020.10.083
Shang, D., Chen, Y., Zhao, Z., Shangguan, S., and Qi, X. (2021). Mechanical Behavior and Acoustic Emission Characteristics of Intact Granite Undergoing Direct Shear. Eng. Fracture Mech. 245, 107581. doi:10.1016/j.engfracmech.2021.107581
State Council Report, (2021). Action Plan for Carbon Dioxide Peaking before 2030. Information on Available at: http://www.gov.cn/zhengce/content/2021-10/26/content_5644984.htm.
Tomac, I., and Sauter, M. (2018). A Review on Challenges in the Assessment of Geomechanical Rock Performance for Deep Geothermal Reservoir Development. Renew. Sustain. Energ. Rev. 82, 3972–3980. doi:10.1016/j.rser.2017.10.076
Warpinski, N. R., Schmidt, R. A., and Northrop, D. A. (1982). In-situ Stresses: the Predominant Influence on Hydraulic Fracture Containment. J. J. Pet. Techn. 34, 653–664. doi:10.2118/8932-pa
Wu, B., Zhang, G., Zhang, X., Jeffrey, R. G., Kear, J., and Zhao, T. (2017). Semi-Analytical Model for a Geothermal System Considering the Effect of Areal Flow between Dipole Wells on Heat Extraction. Energy 138, 290–305. doi:10.1016/j.energy.2017.07.043
Xing, Y., Zhang, G., Luo, T., Jiang, Y., and Ning, S. (2019). Hydraulic Fracturing in High-Temperature Granite Characterized by Acoustic Emission. J. Pet. Sci. Eng. 178, 475–484. doi:10.1016/j.petrol.2019.03.050
Xinhua News Agency is authorized to release (2021).Outline of the 14th Five-Year Plan (2021-2025) for National Economic and Social Development and Vision 2035. Information on Available at: http://www.gov.cn/xinwen/2021-03/13/content_5592681.htm (Accessed March 13, 2021).
Yamamoto, K., Naoi, M., Chen, Y., Nishihara, K., Yano, S., Kawakata, H., et al. (2019). Moment Tensor Analysis of Acoustic Emissions Induced by Laboratory-Based Hydraulic Fracturing in Granite. Geophys. J. Int. 216 (3), 1507–1516. doi:10.1093/gji/ggy493
Yue, Y., Peng, S., Liu, Y., and Xu, J. (2019). Investigation of Acoustic Emission Response and Fracture Morphology of Rock Hydraulic Fracturing under True Triaxial Stress. Acta Geophys. 67 (4), 1017–1024. doi:10.1007/s11600-019-00299-x
Yuyama, S., Li, Z. W., Ito, Y., and Arazoe, M. (1999). Quantitative Analysis of Fracture Process in RC Column Foundation by Moment Tensor Analysis of Acoustic Emission. Construction Building Mater. 13 (1–2), 87–97. doi:10.1016/S0950-0618(99)00011-2
Zhang, Q., Zhang, X.-P., and Sun, W. (2021). A Review of Laboratory Studies and Theoretical Analysis for the Interaction Mode between Induced Hydraulic Fractures and Pre-existing Fractures. J. Nat. Gas Sci. Eng., 86, 103719. doi:10.1016/j.jngse.2020.103719
Zhang, Y., Ma, Y., Hu, Z., Lei, H., Bai, L., Lei, Z., et al. (2019). An Experimental Investigation into the Characteristics of Hydraulic Fracturing and Fracture Permeability after Hydraulic Fracturing in Granite. Renew. Energ. 140, 615–624. doi:10.1016/j.renene.2019.03.096
Zhou, Z., Jin, Y., Zeng, Y. J., Zhang, X. D., Zhou, J., Wang, W. Z., et al. (2019). Experimental Study on Hydraulic Fracturing Physics Simulation, Crack Initiation and Propagation in Hot Dry Rock Geothermal Reservoir in Gonghe Basin, Qinghai. J. Jilin Univ. (Earth Sci. Edition) 49 (5), 1425. doi:10.13278/j.cnki.jjuese.20180204
Zhou, Z., Jin, Y., Zeng, Y., Zhang, X., Zhou, J., Zhuang, L., et al. (2020). Investigation on Fracture Creation in Hot Dry Rock Geothermal Formations of China during Hydraulic Fracturing. Renew. Energ. 153, 301–313. doi:10.1016/j.renene.2020.01.128
Keywords: hydraulic fracturing, enhanced geothermal system, acoustic emission, confining stress, granite
Citation: Wang H, Wang G, Chen Y, Liu L, Zhao Z and Gan H (2022) Laboratory Hydraulic Fracturing of Large-Scale Granite Characterized by Acoustic Emission Under Different Confining Conditions. Front. Earth Sci. 10:885000. doi: 10.3389/feart.2022.885000
Received: 27 February 2022; Accepted: 07 April 2022;
Published: 27 April 2022.
Edited by:
Wenjing Lin, Chinese Academy of Geological Sciences, ChinaCopyright © 2022 Wang, Wang, Chen, Liu, Zhao and Gan. This is an open-access article distributed under the terms of the Creative Commons Attribution License (CC BY). The use, distribution or reproduction in other forums is permitted, provided the original author(s) and the copyright owner(s) are credited and that the original publication in this journal is cited, in accordance with accepted academic practice. No use, distribution or reproduction is permitted which does not comply with these terms.
*Correspondence: Guiling Wang, aWhlZ3dhbmdndWlsaW5nQHNpbmEuY29t