- 1Plateau Atmosphere and Environment Key Laboratory of Sichuan Province, School of Atmospheric Sciences, Chengdu University of Information Technology, Chengdu, China
- 2State Key Laboratory of Severe Weather, Chinese Academy of Meteorological Sciences, Beijing, China
- 3Key Laboratory for Climate Studies, National Climate Center, China Meteorological Administration, Beijing, China
- 4CMA Earth System Modeling and Prediction Centre (CEMC), Beijing, China
The multiyear La Niña (MYLN) is characterized by longer duration, bimodal feature, more continuous circulation anomaly, and different climate impacts compared to the canonical single-peak La Niña. In this study, we focus on the evolving impacts of the MYLN on precipitation in southern China, which mainly occur in boreal winter and summer and correspond to significantly less precipitation and frequency of extreme rainfall. Results show that such impacts have remarkable differences between the first and second half of the MYLN lifecycle. In the first boreal winter when the MYLN reaches its first peak, the precipitation in southern China decreases significantly, while it tends to be insignificantly anomalous in the next winter. In the summer after its first peak, the MYLN has no apparent impact on precipitation in southern China, but when it basically disappears in the next summer, precipitation decreases significantly in southern China. Such seasonally evolving features in the impacts of the MYLN on precipitation in southern China can be mainly interpreted by the patterns of the anomalous cyclonic circulation in northwestern subtropical Pacific during the first peak winter and the decaying summer of the MYLN, which favors an anomalous reduction of moisture supply over southern China.
1 Introduction
The El Niño-Southern Oscillation (ENSO) is the strongest interannual variability in the tropical ocean-atmosphere coupled system. El Niño and La Niña are the warm and cold phases of ENSO which usually last for 1–2 years and have a period of about 2–7 years. ENSO is characterized by strong phase-locking with developing in boreal spring and summer and peaking in winter (Jin, 1996; Neelin et al., 2000; Fang and Zheng, 2021). ENSO is one of the most important precursors that can influence the climate in East Asia, especially the precipitation in China (e.g., Zhang et al., 1996; Wang et al., 2000; Chen, 2002; Zhang et al., 2011). For example, during the developing year of El Niño, the summer and winter precipitation in southern China tends to increase (Zhang et al., 1996; Lim and Kim, 2007; Feng et al., 2010; Feng et al., 2011; Feng and Li, 2011; Zhang et al., 2011; Yuan and Yang, 2012; Li et al., 2016; Xu et al., 2016).
The anomalous Northwest Pacific anticyclone (NWPAC) plays a key role in connecting ENSO with the precipitation in eastern China (Zhang et al., 1996). The southeasterly wind anomalies associated with the NWPAC transport warm and humid air from the South China Sea to eastern China, favoring the positive precipitation anomalies in eastern China. Several theories have been proposed to explain how ENSO excites and maintains an anomalous NWPAC, such as the warm pool atmosphere-ocean interaction mechanism (Zhang et al., 1996; Wang et al., 2000), the Indian Ocean capacitor mechanism (Xie et al., 2009, 2016), the moist enthalpy advection/Rossby wave modulation theory (Wu et al., 2017), and the ENSO-annual cycle combination mode (Stuecker et al., 2013; Stuecker et al., 2015; Zhang et al., 2016). Compared with El Niño, during the mature stage of La Niña, there is an anomalous low-level cyclone in the northwestern subtropical Pacific, which reinforce the East Asian winter monsoon and leads to anomalously dry conditions in East Asia (Huang et al., 2012; Li and Ma, 2012; Zhang R. et al., 2014; Xu et al., 2018). However, some studies have also found that the climate impacts of La Niña over southern China are much weaker than those of El Niño in recent decades, which show clearly asymmetric climate impacts between the two ENSO phases (Zhou et al., 2007).
In recent years, more attention has been paid to the asymmetry between El Niño and La Niña (Ohba and Ueda, 2009; Karori et al., 2013; Zhang R. et al., 2014; Zhang et al., 2015; Guo et al., 2017; Timmermann et al., 2018; Geng et al., 2019; Chen et al., 2022; Song et al., 2022). The El Niño has more super strong events and decays much faster than the La Niña (Song et al., 2022), while the La Niña tends to sustain longer and is more likely to re-intensify after the first peak, i.e., develop to the multiyear La Niña (denoted as MYLN) (Zheng et al., 2015; Okumura et al., 2017). For example, in the most recent 3 years, 2020–2022, there were the 2020/2021 and the following 2021/2022 La Niña events, though the latter is still evolving by now.
As a common type of La Niña, the MYLN is getting more and more attention in recent years and progress has been made on understanding its complex process and dynamic mechanism (Okumura and Deser, 2010; Zheng et al., 2015; Yu and Fang, 2018; Iwakiri and Watanabe, 2021; Kim and An, 2021; Kim and Yu, 2021; Park et al., 2021). Okumura and Deser (2010) suggested that the nonlinear response of atmospheric deep convection to SSTs in the western tropical Pacific, which leads to a westward shift of anomalous precipitation, enhances the duration of local zonal wind anomalies during La Niña and leads to the prolongation of La Niña. Kim and An (2021) attributed the double-peak feature to a strong seasonal modulation of the ENSO growth rate, which results in a seasonal gap of ENSO phase locking and a bifurcation of the peak time of ENSO. Moreover, the preceding strong El Niño, the incursion of off-equatorial subsurface cold water, and the subtropical air-sea coupled forcing are also suggested to be important for increasing the complexity of ENSO evolution and tend to produce MYLN events (Zheng et al., 2015; Yu and Fang, 2018; Iwakiri and Watanabe, 2021; Kim and Yu, 2021; Park et al., 2021).
Though the dynamics of MYLN remains controversial, several studies have focused on the lingering climate impacts of MYLN due to its bimodal feature, long duration, and continuous circulation anomaly, which are different from the single-peak type (Okumura et al., 2017; Prasanna et al., 2019; Raj Deepak et al., 2019; Tokinaga et al., 2019; Iwakiri and Watanabe, 2021). For example: a MYLN event can trigger an Atlantic Niño by enhancing the Walker circulation, but a single-year event cannot establish such a teleconnection (Tokinaga et al., 2019). Compared to the first winter during an MYLN event, the second winter has a strengthened and zonally elongated atmospheric circulation anomalies in the North Pacific and a northeastward shift of United States drought region (Okumura et al., 2017). The East Asian monsoon region is also suggested to have contrary anomalous rainfall patterns in the first and second summers of MYLN events (Raj Deepak et al., 2019), which is a sign indicating that impacts between the first and second years of the MYLN events may be different in southern China where rainfall is highly affected by ENSO (Feng et al., 2010; Feng et al., 2011; Feng and Li, 2011).
In this study, we intend to investigate the seasonally evolving impacts of the MYLN on precipitation in southern China and find out the key factors causing such impacts. The remainder of this paper is organized as follows. The data and methods are introduced in Data and Methods. Characteristics of MYLN and its impacts on precipitation in southern China are investigated in Characteristics of MYLN and Its Impacts on Precipitation in Southern China. Mechanisms of the MYLN impacting precipitation in southern China are analyzed in Mechanisms of the MYLN Impacting Precipitation in Southern China. A summary and a discussion are provided in Summary and Discussion.
2 Data and Methods
In this study, the monthly SST dataset is derived from the Hadley Centre Sea Ice and Sea Surface Temperature dataset (HadISST) spanning from 1980 to 2021 with a horizontal resolution of 1° latitude × 1° longitude (Rayner et al., 2003). The daily precipitation data at 699 Chinese meteorological stations for the period 1980–2020 is from the daily precipitation dataset of the Chinese surface climate data (V3.0) provided by the National Meteorological Information Center of the China Meteorological Administration (CMA). The atmosphere reanalysis data is from the fifth generation of the European Centre for Medium-Range Weather Forecasts (ECMWF) atmospheric reanalysis (ERA5, Hersbach et al., 2020) with a horizontal resolution of 0.25° × 0.25°. The climatology is taken as the period 1980–2020. Anomalies are defined as the departure from the climatological calendar mean and linear trends are removed.
MYLN events are selected according to the criterion in Okumura et al. (2017): when the Niño-3.4 index (5°S–5°N, 170–120°W) falls below −0.75 standard deviations in any month during October (0) to February (1) and remains below −0.5 standard deviations in any month during October (1) to February (2). Here, the Niño-3.4 index has been smoothed with a 3-months running mean and removed the long-term linear trend, the standard deviation is calculated separately for each month, and the year in which La Niña first begins to develop is defined as Year (0). Based on this criterion, four MYLN events after 1980 (1983–1985, 1998–2000, 2007–2009, and 2010–2012) were identified (Figure 1A). For simplicity, we divide the lifecycle of MYLN in half according to the beginning time of the re-developing stage after the first La Niña peak.
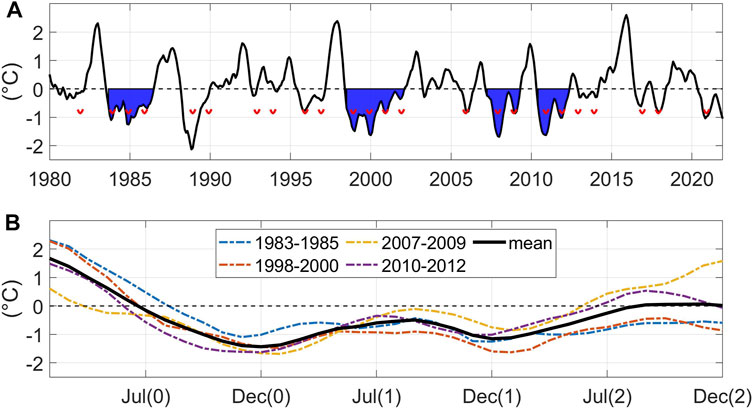
FIGURE 1. (A) Time series of Niño-3.4 index (black line). Red lines are −0.75 standard deviations of Niño-3.4 index for each calendar month from October to February. The blue shadings denote the MYLN events. (B) Evolutions of MYLN events from year (0) to year (2) and their composite.
3 Characteristics of MYLN and its Impacts on Precipitation in Southern China
Composite evolution of the Niño-3.4 index for the four MYLN events (1983–1985, 1998–2000, 2007–2009, and 2010–2012) are shown in Figure 1B (black line). It is obvious that the first peak (–1.43°C) is stronger than the second peak (–1.15°C), which is consistent with previous studies (Okumura and Deser, 2010; Okumura et al., 2017; Tokinaga et al., 2019). The MYLN slowly decays after the first peak in D (0) JF (1) and begins to re-intensify in JJA (1) and develops into the second relatively weak peak in D (1) JF (2). During the time between the first and second peaks, the Niño-3.4 index remains negative, reflecting the long duration of the La Niña state in the equatorial Pacific, which is remarkably different from the conventional ENSO cycle.
Figure 2 shows composites of D (0) JF (1), JJA (1), D (1) JF (2), and JJA (2) SST anomalies of the MYLN. In D (0) JF (1), the MYLN reaches its first peak, the negative SST anomalous center is located at around 165°W in the central equatorial Pacific. A significant positive SST anomalies region extends from the western equatorial Pacific to the north subtropical Pacific continuously. In D (1) JF (2), the MYLN reaches its second peak, the spatial pattern of SST anomalies in the tropical Indian Ocean and Pacific is similar to that at its first peak, but the strength weakens obviously. However, the meridional width of the significant region in the central and eastern equatorial Pacific is much larger than that at the first peak. Besides, there are significant signals in the Indian Ocean and Warm Pool area during the duration of MYLN. The anomalous circulation system in this area plays an important role in affecting the precipitation in southern China (Zhang et al., 2022). In JJA (2), the MYLN basically decays to neutral, but there are significant negative SST anomalies in the surrounding sea areas of northern Southeast Asia.
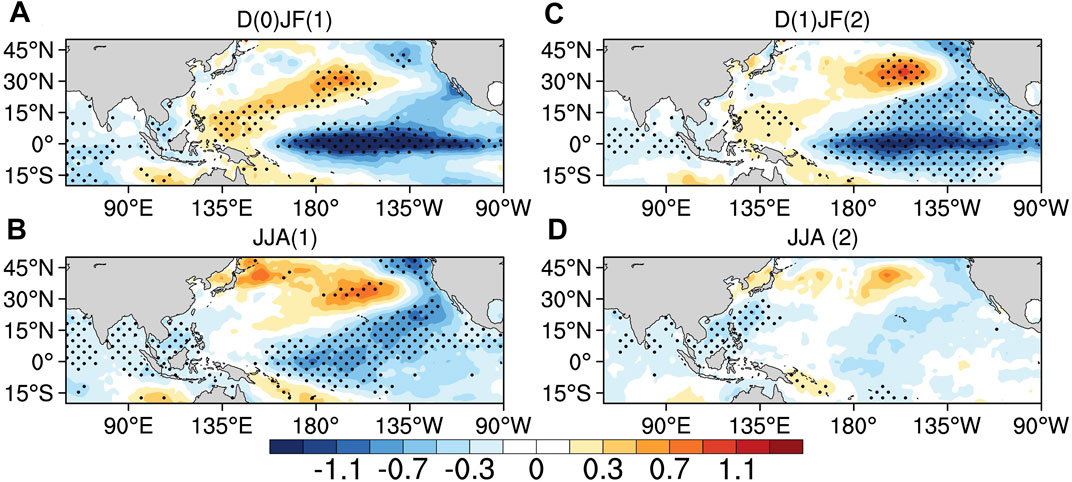
FIGURE 2. Composites of SST anomalies (units: °C) for MYLN in (A) D (0) JF (1), (B) JJA (1), (C) D (1) JF (2), and (D) JJA (2). Dotted areas indicate values exceeding the 90% confidence level determined using a two-tailed Student’s t test.
After the MYLN events had been identified, we further investigated the seasonally evolving impacts of MYLN on precipitation in southern China (Figure 3). Overall, during the duration of MYLN, precipitation in southern China generally decreases, but there are remarkable differences between the first and second half of the MYLN lifecycle. In SON (0), the MYLN is in its developing stage, and precipitation in the area south of the lower reaches of the Yangtze River decreases, which is consistent with the previous study (Zhang W. et al., 2014). While, in SON (1), the re-developing stage of MYLN, the distribution of the precipitation anomalies are insignificant in southern China. In the first boreal winter [D (0) JF (1)], the MYLN reaches its first peak and the precipitation in southern China decreases significantly, while the MYLN seems to be irrelevant to the precipitation in the next winter [D (1) JF (2)]. In the decaying stage after the first peak [MAM (1) and JJA (1)], the precipitation anomalies are insignificant, and so is in MAM (2). In JJA (2), when the MYLN basically disappears, the precipitation in southern China decreases significantly again, which is also the most conspicuous influence among seasons during the second half of the MYLN lifecycle.
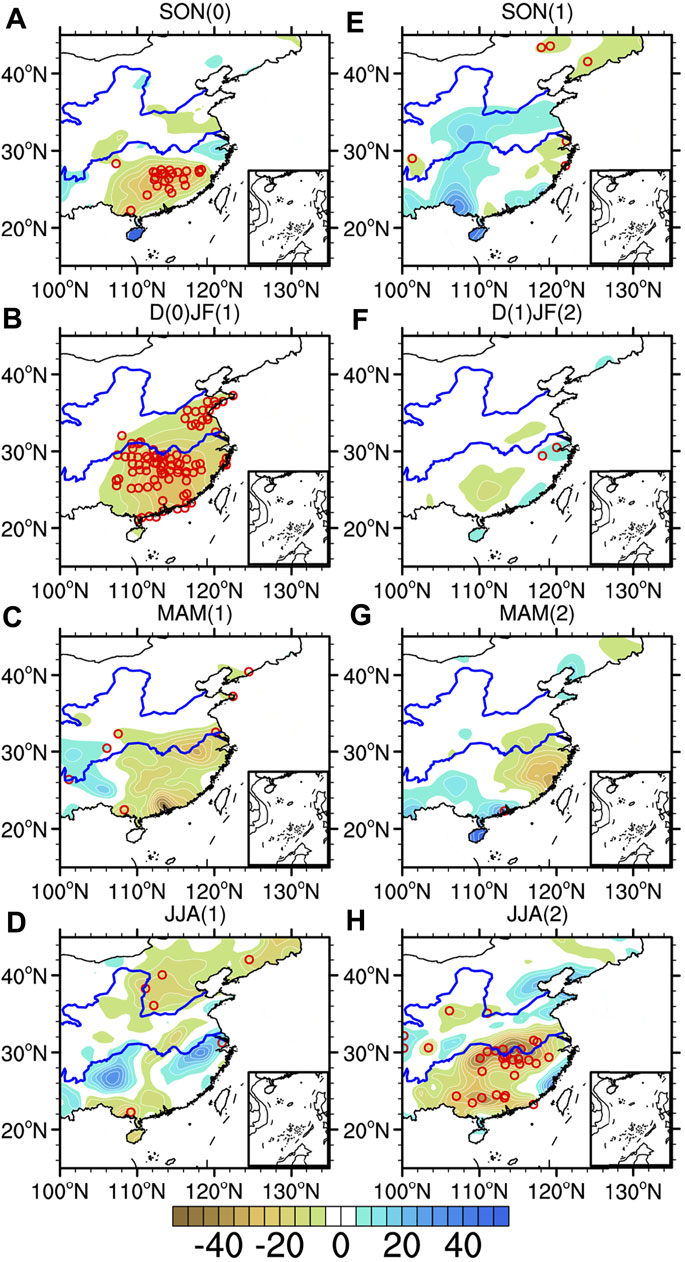
FIGURE 3. Composites of precipitation anomalies (units: mm) in southern China during (A) SON (0), (B) D (0) JF (1), (C) MAM (1), (D) JJA (1), (E) SON (1), (F) D (1) JF (2), (G) MAM (2), and (H) JJA (2). Red circles indicate values at 699 meteorological stations exceeding the 90% confidence level determined using a two-tailed Student’s t test.
In addition, we also investigated whether the MYLN modulates the probability of extreme precipitation days (Figure 4). Following the previous studies (Xiao et al., 2017), we define the historical 95th percentile precipitation for each season as the extreme threshold of this season, and any day with precipitation exceeding the corresponding threshold would be recognized as an extreme precipitation day. Further, the frequency change of extreme precipitation in the MYLN (
Where,
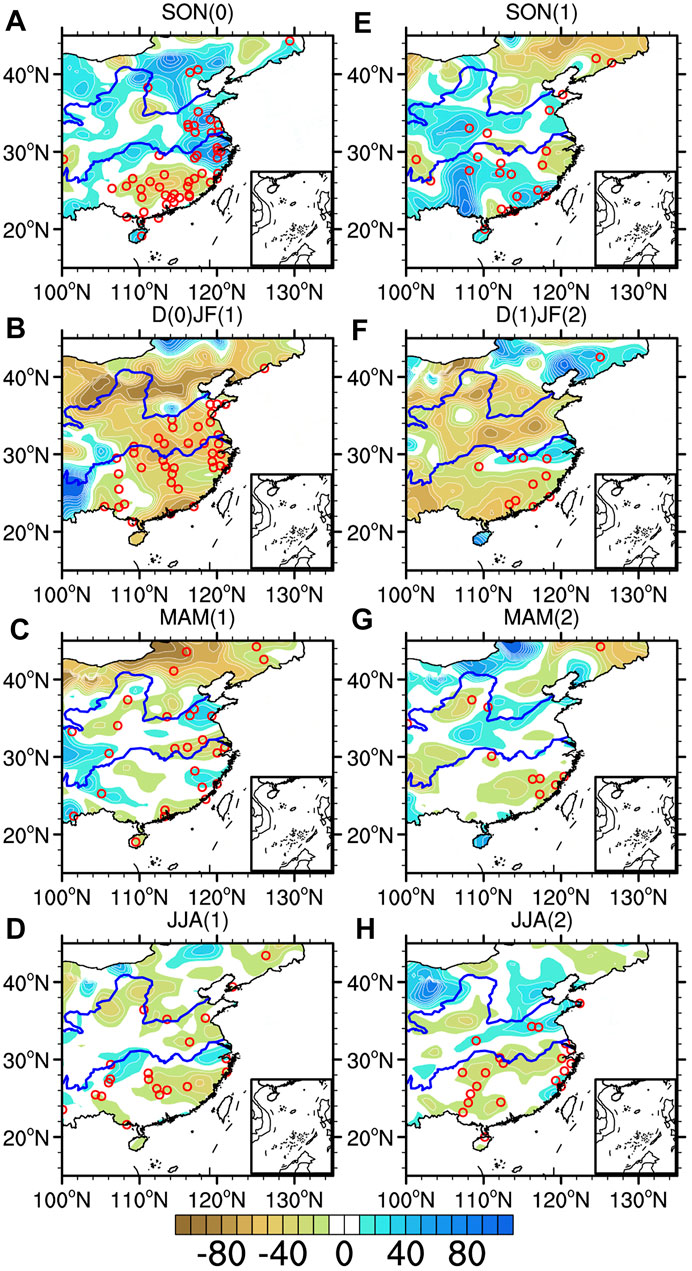
FIGURE 4. Composites of probability changes (units: %) in southern China during (A) SON (0), (B) D (0) JF (1), (C) MAM (1), (D) JJA (1), (E) SON (1), (F) D (1) JF (2), (G) MAM (2), and (H) JJA (2). Red circles indicate values at 699 meteorological stations exceeding the 90% confidence level determined using a two-tailed Student’s t test.
4 Mechanisms of the MYLN Impacting Precipitation in Southern China
Since impacts of MYLN on precipitation in southern China mainly occurs in boreal winter and summer, we further analyzed what causes the differences in the responses of precipitation in southern China to the first and second half of MYLN. In the first mature stage of MYLN [D (0) JF (1)], the negative SST anomalous center is located in the central equatorial Pacific, and positive SST anomalies are located in a belt that stretch from the Maritime Continent to the subtropical central North Pacific (Figure 2A). The easterly 850 hPa wind anomalies in the western and central equatorial Pacific can strengthen the trade winds and enhance the Walker circulation, the convection is suppressed in the eastern tropical Pacific but enhanced in the Indo-Pacific warm pool, and an anticyclonic circulation is formed in the north of the Maritime Continent (Figure 5A). The southwesterly wind anomalies in the northwestern tropical Pacific induced by the equatorial La Niña cold SST anomalies are contrary to the trade winds, which suppress the local evaporation and lead to anomalous SST warming. Eventually, an anomalous lower-tropospheric cyclonic circulation in the northwestern subtropical Pacific is formed at around 30°N, 160°E as a response to the anomalous SST warming (Wang et al., 2000). The northerly wind anomalies on the west side of the anomalous cyclonic circulation are in eastern China, strengthening the East Asian winter monsoon. Therefore, due to the influence of the anomalous cyclonic circulation in the northwestern subtropical Pacific, southern China is drier than usual winter, which has been mentioned in Karori et al. (2013).
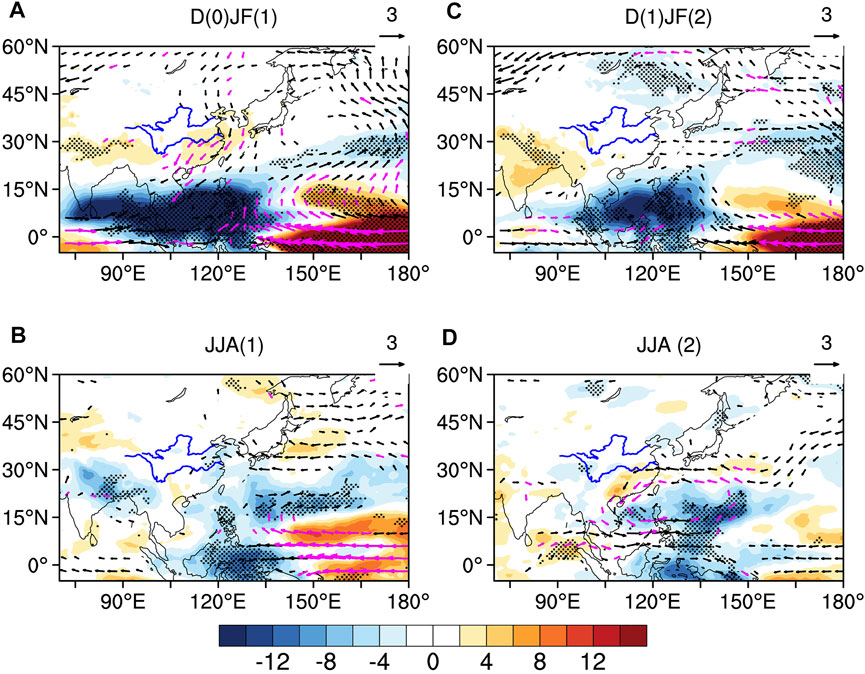
FIGURE 5. Composites of outgoing longwave radiation (shaded, units: W/m2) and 850hPa wind anomalies (vector, units: m/s) during (A) D (0) JF (1), (B) JJA (1), (C) D (1) JF (2), and (D) JJA (2). Dotted areas and purple vectors indicate values exceeding the 90% confidence level determined using a two-tailed Student’s t test.
Figure 6A is the composite of anomalous vertically integrated moisture fluxes (VIMFs, 1000–300 hPa vertically integrated) and their divergence in D (0) JF (1). The distribution of anomalous VIMFs is similar to that of the 850 hPa wind anomalies (Figures 5A, 6A). In the western and central equatorial Pacific, the easterly wind anomalies transport moisture to the west and north. The anomalous divergence of VIMFs is positive in southern China and negative in South China sea. Meanwhile, under the influence of the anomalous cyclonic circulation in the northwestern subtropical Pacific, moisture is transported from the former to the latter, which means that the precipitation in southern China will become less. Figure 7A shows the composite of the zonal circulation over the northern hemispheric Indo-Pacific region (5-20°N) in D (0) JF (1). The ascending motion around 120°E is strong, which reflects the strong large-scale modulation of Walker circulation by matured La Niña. Moreover, the lower-level easterly wind anomalies are in the east of the date line, which suggested that the formation of the anomalous cyclonic circulation in the northwestern subtropical Pacific is closely associated with the off-equatorial Rossby wave response (Wang et al., 2000).
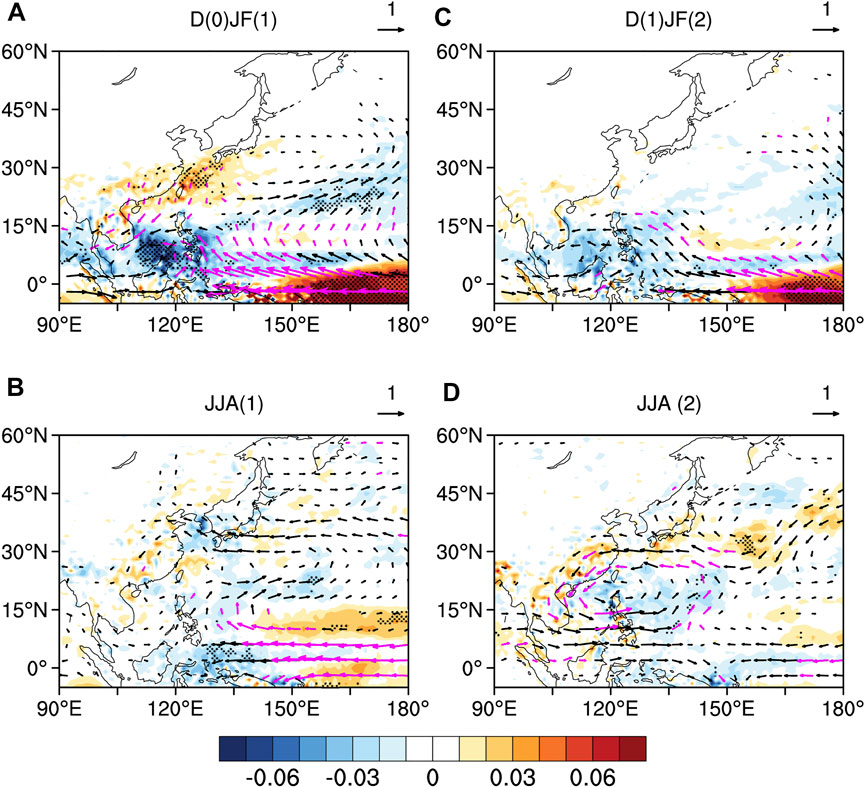
FIGURE 6. Composites of anomalous VIMFs (vector, units: 10−5 g m−1 s−1) and their divergence (shaded, units: 10−5 g m−2 s−1) during (A) D (0) JF (1), (B) JJA (1), (C) D (1) JF (2), and (D) JJA (2). Dotted areas and purple vectors indicate values exceeding the 90% confidence level determined using a two-tailed Student’s t test.
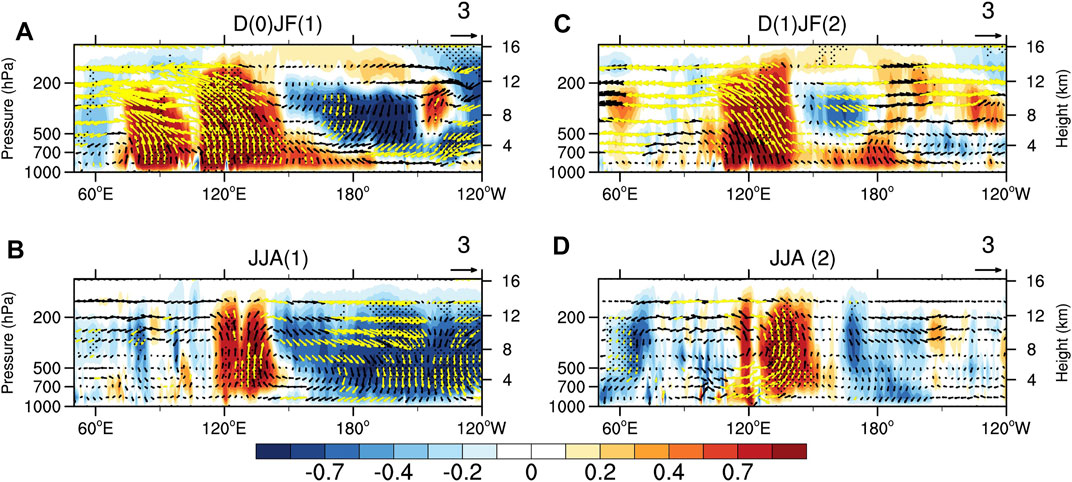
FIGURE 7. Composites of anomalous zonal circulation over the northern hemispheric tropical region (5–20°N) with speed in the vertical direction (shaded, units: m/s) and zonal vertical velocity (vector, units: m/s) during (A) D (0) JF (1), (B) JJA (1), (C) D (1) JF (2), and (D) JJA (2). Dotted areas and yellow vectors indicate values exceeding the 90% confidence level determined using a two-tailed Student’s t test.
Compared with the first La Niña peak in D (0) JF (1), the second peak in D (1) JF (2) has a similar La Niña SST pattern in the tropical Pacific with weaker amplitude (Figures 1B, 2C), and the anomalous zonal circulation in the north of the equatorial Pacific weakens remarkably in D (1) JF (2) (Figure 7C). Furthermore, there are no obvious warming in the northwestern subtropical Pacific, so the local response of the lower-level atmospheric circulation is weak that cannot form a closed anomalous cyclonic circulation (Figure 5C). As a result, there are neither significant northerly wind anomalies nor anomalous VIMFs in eastern China (Figures 5C, 6C), which cannot significantly influence the East Asian winter monsoon. Therefore, the second peak of MYLN cannot significantly affect the precipitation in southern China.
In JJA (1), the positive SST anomalies are disappeared in the western equatorial Pacific, but the negative SST anomalies in the central equatorial Pacific persist (Figure 2B). Easterly wind anomalies are observed in the east of the Maritime Continent (Figure 5B). However, there are almost no significant signals of low-level atmospheric circulation and moisture transport in the off-equatorial northwestern Pacific (Figures 6B, 7B). In addition, the north Indian Ocean is dominated by the easterly wind anomalies and no conspicuous descending motion (Figures 5B, 7B), which has no contributions to the maintenance of the anomalous cyclonic circulation in the northwestern subtropical Pacific.
In JJA (2), the SST anomalies in the equatorial Pacific have almost completely disappeared and the MYLN has decayed to a neutral state (Figure 2D). The easterly wind anomalies in the equatorial Pacific that prevailed during the lifecycle of the MYLN have also become weak (Figure 5D). However, negative SST anomalies in the northern tropical Indian Ocean are still significant. On their east side, the westerly wind anomalies responded to the negative SST anomalies with strong cyclonic shear, forming an anomalous cyclonic circulation over the Philippine sea, which is consistent with the Indian Ocean capacitor theory proposed by Xie et al. (2009). The northerly wind anomalies in the west of the anomalous cyclonic circulation are opposite to the prevailing southerly winds of East Asian summer monsoon, which weakens the latter. Meanwhile, under the influence of the anomalous cycle, moisture diverges in southern China (Figure 6D), resulting in less precipitation in this region. In Figure 7D, the northwest tropical Pacific is characterized by anomalous ascending motion, which forms an anomalous zonal atmospheric circulation with the descending motion in the tropical Indian Ocean, also suggesting the maintenance of the anomalous cyclonic circulation in the north of the Philippines in summer may be closely related to the Indian Ocean capacitor effect (Wu et al., 2009; Xie et al., 2009; Li et al., 2017).
5 Summary and Discussion
In this study, we focused on the seasonally evolving impacts of the MYLN on precipitation in southern China. After 1980, there are four MYLN events (1983–1985, 1998–2000, 2007–2009, and 2010–2012). We found that impacts of MYLN on precipitation in southern China mainly occur in boreal winter and summer and correspond to significantly less precipitation and frequency of extreme rainfall in southern China. Such impacts have remarkable differences between the first and second half of the MYLN lifecycle.
In the first boreal winter [D (0) JF (1)], the MYLN reaches its first peak and the precipitation in southern China decreases significantly, and the probability of extreme precipitation days is also apparently depressed, while the MYLN tends to be irrelevant to the precipitation in the next winter [D (1) JF (2)]. In the first mature stage of MYLN [D (0) JF (1)], the negative SST anomalous center is located in the central equatorial Pacific, and positive SST anomalies are located in a belt that stretch from the Maritime Continent to the subtropical central North Pacific. An anomalous lower-tropospheric cyclonic circulation in the northwestern subtropical Pacific is formed at around 30°N, 160°E as a response to the anomalous SST warming (Wang et al., 2000). The northerly wind anomalies on the west side of the anomalous cyclonic circulation are in eastern China, strengthening the East Asian winter monsoon. Therefore, due to the influence of the anomalous cyclonic circulation in the northwestern subtropical Pacific, moisture is transported from southern China to South China sea, and southern China is drier than usual winter, which has been mentioned in Karori et al. (2013). Compare with the first La Niña peak in D (0) JF (1), the second peak in D (1) JF (2) cannot form a closed anomalous cyclonic circulation in the northwestern subtropical Pacific. As a result, there are no significant northerly wind anomalies in eastern China, which cannot significantly affect the precipitation in southern China.
In the summer after the first La Niña peak [JJA (1)], the MYLN have no significant contributions to the precipitation in southern China, but when the MYLN basically disappears in the last summer [JJA (2)], the precipitation in southern China decreases significantly, which is also the most conspicuous influence among seasons during the second half of the MYLN lifecycle. In JJA (1), the positive SST anomalies disappear in the western equatorial Pacific, but the negative SST anomalies in the central equatorial Pacific persist. However, there are almost no significant signals of low-level atmospheric circulation and moisture transport in the off-equatorial northwestern Pacific. In JJA (2), the SST anomalies in the equatorial Pacific have almost completely disappeared and the MYLN has decayed to a neutral state, while negative SST anomalies in the northern tropical Indian Ocean are still significant. On the east side of the northern tropical Indian Ocean, the westerly wind anomalies responded to the negative SST anomalies, contributing to the deepened convection in the Philippine sea and forming an anomalous cyclonic circulation over the Philippine sea. Meanwhile, the northwest tropical Pacific is characterized by anomalously ascending motion, which forms an anomalous zonal atmospheric circulation with the descending motion in the tropical Indian Ocean, suggesting the maintenance of the anomalous cyclonic circulation in the north of the Philippines in summer may be closely related to the Indian Ocean capacitor effect (Wu et al., 2009; Xie et al., 2009; Li et al., 2017). The northerly wind anomalies in the west of the anomalous cyclonic circulation weaken the prevailing southerly winds of East Asian summer monsoon and correspond to significantly less precipitation in southern China.
The MYLN in its lifecycle mainly depressed the precipitation and frequency of extreme rainfall over southern China, which can be mainly interpreted by the patterns of the anomalous cyclonic circulation in northwestern subtropical Pacific. However, in its first developing stage [SON(0)], the occurrence probability of extreme precipitation days has an increase in the Yangtze-Huaihe Region, but the seasonal mean precipitation in this region has no significant changes, which may be due to the MYLN contributing to the formation of local atmospheric conditions in this region that is conducive to the extreme precipitation. Due to the limited number of MYLN events, the understanding of such type of La Niña in its dynamic processes and evolving impacts is still insufficient, as well as its predictability. Therefore, it is necessary to use coupled ocean-atmosphere models to further analyze mechanisms of the climate impacts of MYLN in future.
Data Availability Statement
Publicly available datasets were analyzed in this study. This data can be found here: ERA5 data is available via https://cds.climate.copernicus.eu/cdsapp#!/dataset/reanalysis-era5-pressure-levels-monthly-means?tab=overview. The daily precipitation dataset of the Chinese surface climate data (V3.0) is available via http://data.cma.cn/. HadISST data is available via https://www.metoffice.gov.uk/hadobs/hadisst/index.html.
Author Contributions
All authors listed have made a substantial, direct, and intellectual contribution to the work and approved it for publication.
Funding
This work was jointly supported by the National Natural Science Foundation of China (42005041, 42105067, 42175015, and 41975094), and the Basic Research and Operational Special Project of CAMS (2021Z007).
Conflict of Interest
The authors declare that the research was conducted in the absence of any commercial or financial relationships that could be construed as a potential conflict of interest.
Publisher’s Note
All claims expressed in this article are solely those of the authors and do not necessarily represent those of their affiliated organizations, or those of the publisher, the editors and the reviewers. Any product that may be evaluated in this article, or claim that may be made by its manufacturer, is not guaranteed or endorsed by the publisher.
References
Chen, N., Fang, X., and Yu, J.-Y. (2022). A Multiscale Model for El Niño Complexity. Npj. Clim. Atmos. Sci. 5, 16. doi:10.1038/s41612-022-00241-x
Chen, W. (2002). Impacts of El Niño and La Niña on the Cycle of the East Asian winter and Summer Monsoon. Chin. J. Atmos. Sci. 26, 595–610. (in Chinese). doi:10.3878/j.issn.1006-9895.2002.05.02
Fang, X.-H., and Zheng, F. (2021). Effect of the Air-Sea Coupled System Change on the ENSO Evolution from Boreal spring. Clim. Dyn. 57, 109–120. doi:10.1007/s00382-021-05697-w
Feng, J., Chen, W., Tam, C.-Y., and Zhou, W. (2011). Different Impacts of El Niño and El Niño Modoki on China Rainfall in the Decaying Phases. Int. J. Climatol. 31, 2091–2101. doi:10.1002/joc.2217
Feng, J., and Li, J. (2011). Influence of El Niño Modoki on spring Rainfall over south China. J. Geophys. Res. 116, D13102. doi:10.1029/2010jd015160
Feng, J., Wang, L., Chen, W., Fong, S. K., and Leong, K. C. (2010). Different Impacts of Two Types of Pacific Ocean Warming on Southeast Asian Rainfall during Boreal winter. J. Geophys. Res. 115, D24122. doi:10.1029/2010jd014761
Geng, T., Cai, W., Wu, L., and Yang, Y. (2019). Atmospheric Convection Dominates Genesis of ENSO Asymmetry. Geophys. Res. Lett. 46, 8387–8396. doi:10.1029/2019gl083213
Guo, Z., Zhou, T., and Wu, B. (2017). The Asymmetric Effects of El Niño and La Niña on the East Asian winter Monsoon and Their Simulation by CMIP5 Atmospheric Models. J. Meteorol. Res. 31, 82–93. doi:10.1007/s13351-017-6095-5
Hersbach, H., Bell, B., Berrisford, P., Hirahara, S., Horányi, A., Muñoz‐Sabater, J., et al. (2020). The ERA5 Global Reanalysis. Q.J.R. Meteorol. Soc. 146, 1999–2049. doi:10.1002/qj.3803
Huang, R., Chen, J., Wang, L., and Lin, Z. (2012). Characteristics, Processes, and Causes of the Spatio-Temporal Variabilities of the East Asian Monsoon System. Adv. Atmos. Sci. 29, 910–942. doi:10.1007/s00376-012-2015-x
Iwakiri, T., and Watanabe, M. (2021). Mechanisms Linking Multi-Year La Niña with Preceding strong El Niño. Sci. Rep. 11, 17465. doi:10.1038/s41598-021-96056-6
Jin, F.-F. (1996). Tropical Ocean-Atmosphere Interaction, the Pacific Cold Tongue, and the El Niño-Southern Oscillation. Science 274, 76–78. doi:10.1126/science.274.5284.76
Karori, M. A., Li, J., and Jin, F.-F. (2013). The Asymmetric Influence of the Two Types of El Niño and La Niña on Summer Rainfall over Southeast China. J. Clim. 26, 4567–4582. doi:10.1175/jcli-d-12-00324.1
Kim, J. W., and Yu, J. Y. (2021). Evolution of Subtropical Pacific‐Onset El Niño: How its Onset Location Controls its Decay Evolution. Geophys. Res. Lett. 48, e2020GL091345. doi:10.1029/2020GL091345
Kim, S.-K., and An, S.-I. (2021). Seasonal Gap Theory for ENSO Phase Locking. J. Clim. 34, 1–44. doi:10.1175/jcli-d-20-0495.1
Li, C., and Ma, H. (2012). Relationship between ENSO and winter Rainfall over Southeast China and its Decadal Variability. Adv. Atmos. Sci. 29, 1129–1141. doi:10.1007/s00376-012-1248-z
Li, T., Wang, B., Wu, B., Zhou, T., Chang, C. P., and Zhang, R. (2017). Theories on Formation of an Anomalous Anticyclone in Western North Pacific During El Niño: A Review.. J. Meteorol. Res. 31, 987–1006. doi:10.1007/s13351-017-7147-6
Lim, Y.-K., and Kim, K.-Y. (2007). ENSO Impact on the Space-Time Evolution of the Regional Asian Summer Monsoons. J. Clim. 20, 2397–2415. doi:10.1175/jcli4120.1
Neelin, J. D., Jin, F.-F., and Syu, H.-H. (2000). Variations in ENSO Phase Locking. J. Clim. 13, 2570–2590. doi:10.1175/1520-0442(2000)013<2570:viepl>2.0.co;2
Ohba, M., and Ueda, H. (2009). Role of Nonlinear Atmospheric Response to SST on the Asymmetric Transition Process of ENSO. J. Clim. 22, 177–192. doi:10.1175/2008jcli2334.1
Okumura, Y. M., and Deser, C. (2010). Asymmetry in the Duration of El Niño and La Niña. J. Clim. 23, 5826–5843. doi:10.1175/2010JCLI3592.1
Okumura, Y. M., DiNezio, P., and Deser, C. (2017). Evolving Impacts of Multiyear La Niña Events on Atmospheric Circulation and U.S. Drought. Geophys. Res. Lett. 44, 11614–11623. doi:10.1002/2017gl075034
Park, J. H., An, S. I., Kug, J. S., Yang, Y. M., Li, T., and Jo, H. S. (2021). Mid‐latitude Leading Double‐dip La Niña. Int. J. Climatol. 41, E1353–E1370. doi:10.1002/joc.6772
Prasanna, K., Singh, P., Chowdary, J. S., Naidu, C. V., Parekh, A., Gnanaseelan, C., et al. (2019). Northeast Monsoon Rainfall Variability over the Southern Peninsular India Associated with Multiyear La Niña Events. Clim. Dyn. 53, 6265–6291. doi:10.1007/s00382-019-04927-6
Raj Deepak, S. N., Chowdary, J. S., Dandi, A. R., Srinivas, G., Parekh, A., Gnanaseelan, C., et al. (2019). Impact of Multiyear La Niña Events on the South and East Asian Summer Monsoon Rainfall in Observations and CMIP5 Models. Clim. Dyn. 52, 6989–7011. doi:10.1007/s00382-018-4561-0
Rayner, N. A., Parker, D. E., Horton, E., Folland, C. K., Alexander, L. V., Rowell, D., et al. (2003). Global Analyses of Sea Surface Temperature, Sea Ice, and Night marine Air Temperature since the Late Nineteenth century. J. Geophys. Res. 108, 4407. doi:10.1029/2002JD002670
Song, X., Zhang, R., and Rong, X. (2022). Dynamic Causes of ENSO Decay and its Asymmetry. J. Clim. 35, 445–462. doi:10.1175/jcli-d-21-0138.1
Stuecker, M. F., Jin, F.-F., Timmermann, A., and McGregor, S. (2015). Combination Mode Dynamics of the Anomalous Northwest Pacific Anticyclone. J. Clim. 28, 1093–1111. doi:10.1175/JCLI-D-14-00225.1
Stuecker, M. F., Timmermann, A., Jin, F.-F., McGregor, S., and Ren, H.-L. (2013). A Combination Mode of the Annual Cycle and the El Niño/Southern Oscillation. Nat. Geosci 6, 540–544. doi:10.1038/ngeo1826
Timmermann, A., An, S.-I., Kug, J.-S., Jin, F.-F., Cai, W., Capotondi, A., et al. (2018). El Niño-Southern Oscillation Complexity. Nature 559, 535–545. doi:10.1038/s41586-018-0252-6
Tokinaga, H., Richter, I., and Kosaka, Y. (2019). ENSO Influence on the Atlantic Niño, Revisited: Multi-Year versus Single-Year ENSO Events. J. Clim. 32, 4585–4600. doi:10.1175/JCLI-D-18-0683.1
Wang, B., Wu, R., and Fu, X. (2000). Pacific-east Asian Teleconnection: How Does ENSO Affect East Asian Climate? J. Clim. 13, 1517–1536. doi:10.1175/1520-0442(2000)013<1517:peathd>2.0.co;2
Wu, B., Zhou, T., and Li, T. (2009). Seasonally Evolving Dominant Interannual Variability Modes of East Asian Climate. J. Cli. 22, 2992–3005. doi:10.1175/2008JCLI2710.1
Wu, B., Zhou, T., and Li, T. (2017). Atmospheric Dynamic and Thermodynamic Processes Driving the Western North Pacific Anomalous Anticyclone during El Niño. Part I: Maintenance Mechanisms. J. Clim. 30, 9621–9635. doi:10.1175/JCLI-D-16-0489.1
Xiao, M., Zhang, Q., and Singh, V. P. (2017). Spatiotemporal Variations of Extreme Precipitation Regimes during 1961-2010 and Possible Teleconnections with Climate Indices across China. Int. J. Climatol. 37, 468–479. doi:10.1002/joc.4719
Xie, S.-P., Hu, K., Hafner, J., Tokinaga, H., Du, Y., Huang, G., et al. (2009). Indian Ocean Capacitor Effect on Indo-Western Pacific Climate during the Summer Following El Niño. J. Clim. 22, 730–747. doi:10.1175/2008jcli2544.1
Xie, S.-P., Kosaka, Y., Du, Y., Hu, K., Chowdary, J. S., and Huang, G. (2016). Indo-western Pacific Ocean Capacitor and Coherent Climate Anomalies in post-ENSO Summer: A Review. Adv. Atmos. Sci. 33, 411–432. doi:10.1007/s00376-015-5192-6
Xu, K., Huang, Q.-L., Tam, C.-Y., Wang, W., Chen, S., and Zhu, C. (2018). Roles of Tropical SST Patterns during Two Types of ENSO in Modulating Wintertime Rainfall over Southern China. Clim. Dyn. 52, 523–538. doi:10.1007/s00382-018-4170-y
Xu, K., Zhu, C., and Wang, W. (2016). The Cooperative Impacts of the El Niño-Southern Oscillation and the Indian Ocean Dipole on the Interannual Variability of Autumn Rainfall in China. Int. J. Climatol. 36, 1987–1999. doi:10.1002/joc.4475
Yu, J. Y., and Fang, S. W. (2018). The Distinct Contributions of the Seasonal Footprinting and Charged‐Discharged Mechanisms to ENSO Complexity. Geophys. Res. Lett. 45, 6611–6618. doi:10.1029/2018gl077664
Yuan, Y., and Yang, S. (2012). Impacts of Different Types of El Niño on the East Asian Climate: Focus on ENSO Cycles. J. Clim. 25, 7702–7722. doi:10.1175/jcli-d-11-00576.1
Zhang, L., Shi, R., Fraedrich, K., and Zhu, X. (2022). Enhanced Joint Tffects of ENSO and IOD on Southeast China Winter Precipitation After 1980s. Clim. Dyn. 58, 277–292. doi:10.1007/s00382-021-05907-5
Zhang, R., Li, T., Wen, M., and Liu, L. (2014). Role of Intraseasonal Oscillation in Asymmetric Impacts of El Niño and La Niña on the Rainfall over Southern China in Boreal winter. Clim. Dyn. 45, 559–567. doi:10.1007/s00382-014-2207-4
Zhang, R., Sumi, A., and Kimoto, M. (1996). Impact of El Niño on the East Asian Monsoon. J. Meteorol. Soc. Jpn. 74, 49–62. doi:10.215/jmsj1965.74.1_4910.2151/jmsj1965.74.1_49
Zhang, W., Jin, F.-F., Li, J., and Ren, H.-L. (2011). Contrasting Impacts of Two-type El Nino over the Western North Pacific during Boreal Autumn. J. Meteorol. Soc. Jpn. 89, 563–569. doi:10.2151/jmsj.2011-510
Zhang, W., Jin, F.-F., and Turner, A. (2014). Increasing Autumn Drought over Southern China Associated with ENSO Regime Shift. Geophys. Res. Lett. 41, 4020–4026. doi:10.1002/2014GL060130
Zhang, W., Li, H., Jin, F.-F., Stuecker, M. F., Turner, A. G., and Klingaman, N. P. (2015). The Annual-Cycle Modulation of Meridional Asymmetry in ENSO's Atmospheric Response and its Dependence on ENSO Zonal Structure. J. Clim. 28, 5795–5812. doi:10.1175/jcli-d-14-00724.1
Zhang, W., Li, H., Stuecker, M. F., Jin, F.-F., and Turner, A. G. (2016). A New Understanding of El Niño's Impact over East Asia: Dominance of the ENSO Combination Mode. J. Clim. 29, 4347–4359. doi:10.1175/jcli-d-15-0104.1
Zhang, W., Li, H., Stuecker, M. F., Jin, F.-F., and Turner, A. G. (2016). A New Understanding of El Niño's Impact over East Asia: Dominance of the ENSO Combination Mode. J. Clim. 29, 4347–4359. doi:10.1175/JCLI-D-15-0104.1
Zheng, F., Feng, L., and Zhu, J. (2015). An Incursion of Off-Equatorial Subsurface Cold Water and its Role in Triggering the "double Dip" La Niña Event of 2011. Adv. Atmos. Sci. 32, 731–742. doi:10.1007/s00376-014-4080-9
Keywords: multiyear La Niña, double-peak, precipitation, southern China, cyclonic circulation
Citation: Huang G, Wang R, Liu J, Gao L, Liu M and Chen Q (2022) Seasonally Evolving Impacts of Multiyear La Niña on Precipitation in Southern China. Front. Earth Sci. 10:884604. doi: 10.3389/feart.2022.884604
Received: 26 February 2022; Accepted: 21 March 2022;
Published: 06 April 2022.
Edited by:
Tao Lian, Ministry of Natural Resources, ChinaReviewed by:
Lin Chen, Nanjing University of Information Science and Technology, ChinaXianghui Fang, Fudan University, China
Copyright © 2022 Huang, Wang, Liu, Gao, Liu and Chen. This is an open-access article distributed under the terms of the Creative Commons Attribution License (CC BY). The use, distribution or reproduction in other forums is permitted, provided the original author(s) and the copyright owner(s) are credited and that the original publication in this journal is cited, in accordance with accepted academic practice. No use, distribution or reproduction is permitted which does not comply with these terms.
*Correspondence: Run Wang, d2FuZ3J1bkBjbWEuZ292LmNu
 Guansheng Huang1
 Run Wang
 Li Gao
 Minghong Liu
 Quanliang Chen