 Huairen Cao
 Deping Zhang
 Xiaoyu Wang1,2
 Deliang Fu
95% of researchers rate our articles as excellent or good
Learn more about the work of our research integrity team to safeguard the quality of each article we publish.
Find out more
ORIGINAL RESEARCH article
Front. Earth Sci. , 27 April 2022
Sec. Geochemistry
Volume 10 - 2022 | https://doi.org/10.3389/feart.2022.884518
This article is part of the Research Topic New Advances in Light Oil/Condensate Geochemistry View all 8 articles
Lacustrine oil-prone shale at the oil-generation stage develops a large number of nanopores; however, the influence of fluid–shale interactions on the nanopores of lacustrine shale is poorly understood. A suite of mature lacustrine shales from the Songliao Basin Qingshankou Formation was performed on sequential organic solvent (petroleum ether and mixture of dichloromethane and methanol) extractions, and nitrogen and carbon dioxide adsorptions, Rock-Eval pyrolysis and field emission scanning electron microscopes (FE-SEM) observation. The sequential extractions show a decrease in total organic matter (TOC) and in the exacted organic matter content of shale, but an increase in the specific area (SBET) and pore volume of the extracted residues. Before and after extractions, the relationships between the extracted amount of OM and SBET, pore volume and their cumulative increments reveal OM as a main factor affecting the development of nanopores in these shales. The reasons are 1) SBET and mesopores are mainly blocked by EOMs in the initial samples, 2) the cumulative increases of SBET and mesopores are dominantly controlled by the extracted amount of hydrocarbons during petroleum ether extraction, and 3) both hydrocarbons and NSOs (resins and asphaltenes) have an influence on the cumulative increases of SBET and mesopores, and kerogen exposed more open porous-organic mesopores after the EOMs in the extracted shales. Here, further work concludes that oils adsorbed on pore surfaces are dominantly distributed on nanopores less than 10 nm, and free oils occur when the threshold of the average pore width in studied shales is over 11.7 nm.
OM-rich shale reservoirs usually develop a large number of nanopores and have received attention because of the exploration potential in residual oils (Chalmers and Bustin, 2007; Loucks et al., 2009; Ross and Bustin, 2009; Jarive, 2012; Wang M. et al., 2019; Liu et al., 2019). Shale has the characteristics of low porosity and low permeability, and its pore structure is characterized by nanoscale (Loucks et al., 2009; Valenza et al., 2013; Zou et al., 2013; Liu et al., 2020). These nanopore networks of shales could control the storage of residual oils and fluid flows, which determine whether the shale can be a reservoir, and is widely used in predicting shale oil production. Previous studies were performed on how nanopore structures were affected by solid OM, thermal maturity, water, lithology, mineralogy, and grain sizes (Chalmers and Bustin, 2007; Loucks et al., 2009; Ross and Bustin, 2009; Curtis et al., 2012; Cheng et al., 2018, 2022; Jiang and Daigle, 2019). Residual oils in these lacustrine shales significantly add more uncertainty to porosity of reservoirs (Qi et al., 2019). Evaluation and exploration of the residual oils from lacustrine shales in China, however, are generally in its infancy (Lu et al., 2017; Wang Y. et al., 2019). Recently, more attention has been paid to fluid–shale interactions altering nanopore development and oil mobility (Valenza et al., 2013; Cao et al., 2016; Distefano et al., 2019; Qi et al., 2019), which is a key to characterize lacustrine shale reservoirs.
The fluid–shale interactions include a series of chemical and physical processes between solvents and the matrix (Hedges and Keil, 1995; Wang M. et al., 2019; Distefano et al., 2019). Solvent extraction is widely used to explore fluid–shale interactions (Qi et al., 2019), and this approach has also been extended to unconventional shale reservoirs, which possess lower porosity and permeability. The mechanism of solvent–pore interaction is that different kinds of solvents can destroy the energy of different chemical or physical association forces in shale. It is thereby a well understood mechanism of interaction by the changes of pore space during solvent contact. To assess true permeability, solvent (such as CO2-toluene) is applied to the reservoir rock to circulate the solvent through the rock multiple times in order to remove the oil blocking the pore entrance (Distefano et al., 2019). The removal of oils clearly change storage spaces due to oil releasing from pore surface areas and volumes within shale (Zhu et al., 2019), and the extracted samples can provide more reliable shale pores (Han et al., 2019). Valenza et al. (2013) proposed that altering the residual oil quantity could cause changes of pore structures, indicating shale pores and throats blocked by residual bitumen, and thus change oil storage capacity. Similar results emerged in shale porosity (Wei et al., 2014; Mohnhoff et al., 2015). Based on extracts from sodium hypochlorite, Kuila et al. (2014) provided an explanation for different porosities between clay and organic matter from the Haynesville and Marcellus shales. Qi et al. (2019) documented the nanopore structures of marine–continental coals and mudstones before and after extraction by low-pressure argon and carbon dioxide adsorptions. Several mechanisms can factually control porosity changes caused by solvent interaction (Radlinski et al., 2000; Geramian et al., 2016; Mohnhoff et al., 2015; Distefano et al., 2016; 2019) as follows: 1) complete removal or breakdown of resins and asphaltenes, 2) process of dissolution and migration for resins and asphaltenes, 3) incomplete or partial breakdown of OMs, 4) kerogen swelling attributed to the removal of alkanes and aromatics, 5) clay layer expansion, and 6) mineral dissolution in the case of hydrochloric acid. These interactions may be further complicated by difference in the oil family composition from mature oil-rich shale. However, there are still few studies on the influence of oil family composition effects on lacustrine shale nanopores.
Chen and Zhang (2017) proposed that free oils were mainly from the first cold extract by n-hexane, and adsorbed oils were extracted by trichloromethane. Although sequential extraction experiments do not show completely distinguishable oil phases, that is, “free oil” and “adsorbed oil,” the method can be sequentially used to obtain various oil family compositions stored in the pore system (Wilhelms and Larter, 1994). Moreover, the non-destructive extraction procedure can maintain the rock in the natural state (Schwark et al., 1997), including maturity, mineral compositions, and grain sizes before and after the experiment. Thus, the sequential extraction is available to analyze oil–rock interaction within the shale.
In order to better understand the effects of solvent extraction on nanopore structure in lacustrine oil-prone shale, we adopted continuous extractions and pyrolysis methods. The occurrence forms of organic matter can be obtained by means of pyrolysis, organic geochemistry, and FE-SEM. Also, the images of shale microstructures were analyzed by FE-SEM. In addition, a series of N2 and CO2 adsorption isotherm experiments were performed on both core shale samples and their sequential extraction residues. The relationships between organic matters or oil family compositions and pore structure distributions were established.
The geological knowledge of the Songliao Basin has gradually increased since the discovery of the Daqing oil field in the late 1950s (Wang et al., 2013; Figure 1A). In the Songliao Basin, the Qingshankou (K2qn) and Nenjiang (K2n) Formations are usually considered as major source rocks (Feng et al., 2010; Bi et al., 2021). Excellent K2qn shales were developed in a semi-deep to deep-lake facies. The area of lake reached its maximum of 87,000 km2 and sedimentary thickness of 60–100 m in the Central Depression zone during the depositions of K2qn (Feng et al., 2010), leading to form the first member of Qingshankou Formation (K2qn1) source rocks. K2qn1 mainly consists of gray, dark gray, and black mudstones interbedded with oil shales and gray sandstones and siltstones (Wang et al., 2013).
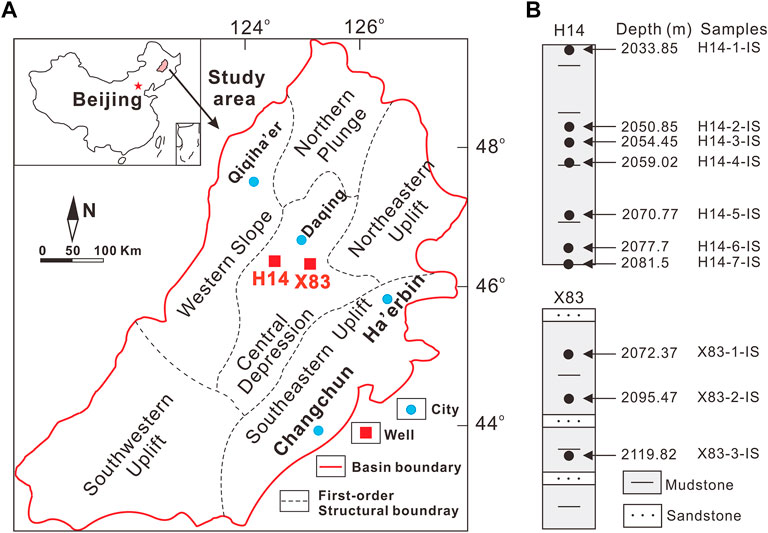
FIGURE 1. (A) Map of the Songliao Basin showing sampling sites from two wells. (B) Lithology and sampling depths are shown.
Ten K2qn1 core samples selected for this study were taken from wells H14 (2 032.5–2 081.5 m, N 46°22′39″, E 124°8′38″) and × 83 (2 051.4–2 139.7 m, N 46°11′55″, E 124°39′24″), located at Central Depression zone of the Halahai fault and nose structure of the Qijia Sag, respectively (Figure 1). The lithology of these sediments is mainly gray to dark shale with interbedded sandstones (Figure 1B; Cao et al., 2017).
Shale core samples were first cleaned, dried at 50°C, and then crushed to 80 mesh (about 180 μm). In process 1, 10 initial samples about 40 g were first extracted with non-polar petroleum ether in Soxhlet extraction, and amounts of extracts 1 and post-extraction residues 1 were obtained (Figure 2), and then, amounts of extracts 2 and residues 2 were obtained from the residues 1 of dichloromethane and methanol (DCM:MeOH, v:v = 9:1) Soxhlet extraction in process 2 (Figure 2). Additionally, 10 initial samples about 40 g were extracted by the mixture of dichloromethane and methanol (DCM:MeOH, v:v = 9:1) using Soxhlet extraction in order to get amounts of chloroform bitumen “A” (as extracts 3) and post-extraction residues 3 (Figure 2). For all the extracts, asphaltenes were first used as precipitate by n-hexane. Then, the n-hexane solvents were separated into aliphatic, aromatic, and polar compositions via silica gel/Al2O3 adsorption chromatography using n-hexane, a mixture of n-hexane and dichloromethane (Hex:DCM, v:v, 1:2) and a mixture of dichloromethane and methanol (DCM:MeOH, v:v, 3:1), respectively. A weighted and quantitative analysis was used for isolates (Figure 2).
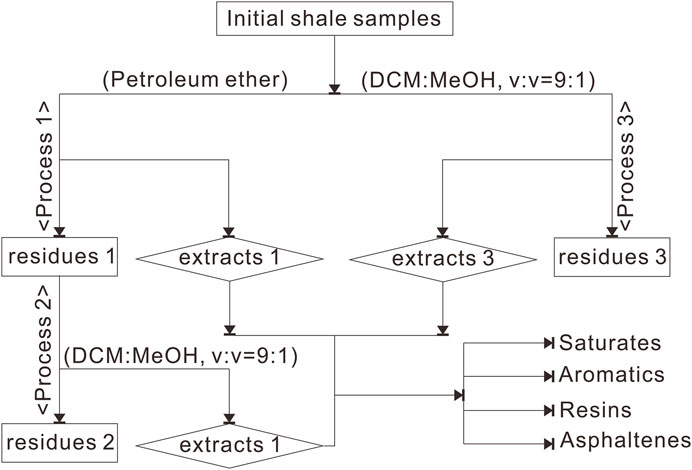
FIGURE 2. Experimental procedure for sequential extraction.
The initial samples, the residues 1 and residues 2 were selected respectively, and ground up to 200 mesh (about 75 μm). For these powders, pyrolysis analyses were carried out using Rock-Eval 6 Technology with standard procedures (Cao et al., 2016). The TOC (wt%), S1 (mg HC/g rock), S2 (mg HC/g rock), and Tmax (temperature at which the S2 peak is the highest, °C) were measured by pyrolysis. Hydrogen index (HI) was calculated by S2×100/TOC.
The FE-SEM images of microstructure were analyzed on the Hitachi S8010 systems prepared by Ar ion milling (IM4000, Hitachi High-Tech) with an accelerating voltage of 3 kV and a milling time of 4 h. Lower accelerating voltages (1–2 kV) with the working distances of 1.5–4 mm is used on these systems to prevent beam damage of the samples (Tian et al., 2015). By shifting a slider with the mouse, the voltage of the Super ExB filter and the conversion electrode is changed, aiming at the adjustment of the SE-BSE signal ratio from a pure SE image.
Analysis of low-pressure N2 adsorption at 77 K and CO2 adsorption at 273.15 K was performed on Micromeritics ASAP 2460. The N2 and CO2 adsorption measurements were performed on samples, including initial samples, residues 1, and residues 2. The procedures of automatic degassing were conducted at 110°C about 12 h in a vacuum chamber to remove the possible adsorption gas, free water, and volatile hydrocarbons. N2 adsorption is generally in the wider range than that of CO2 adsorption in relative pressure (P/P0). In this study, P/P0 is 0.005–0.995 for N2 adsorption and 0.00006–0.03 for CO2 adsorption, respectively. It is interpreted that wider range of N2 adsorption can investigate micro-, meso- and macroporosity for solid materials, but CO2 adsorption is being fit for microporosity (Groen et al., 2003). The free spaces were individually preformed for CO2 adsorption measurements.
The special surface areas of solid powders were calculated by using the Brunauer–Emmett–Teller (BET) method with a restricted P/P0 range of 0.05–0.02 (Rouquerol et al., 1999). It is noted that BET areas are reasonably investigated within the range of 1.3–100 nm (Wei et al., 2016). The special surface areas can be assessed by the BET method (Eq. 1) (Brunauer et al., 1938):
Here, P: gas pressure (Pa); P0: saturation pressure (Pa); V: capacity of adsorbed gas at equilibrium pressure (cm3/g, STP); Vm: capacity of monolayer (cm3/g, STP); and C: BET constant.
International Union of Pure and Applied Chemistry (IUPAC) suggests that shale nanopores could be subdivided into three styles on the basis of pore width micropores (<2 nm), mesopores (2–50 nm), and macropores (>50 nm) (Sing et al., 1985). The mesopore volume can be obtained by the Barrett–Joyner–Halenda (BJH) theory based on N2 adsorption within the pore size range of about 2–100 nm (Barrett et al., 1951).
Micropore volume analysis is widely carried out by the Dubinin–Astakhov theory application of CO2 adsorption experiments (Dubinin and Stoeckli, 1980; Gregg and Sing, 1982). The Dubinin–Astakhov (Eq. 2) follows the relations:
where V: capacity of adsorbed gas at equilibrium pressure (cm3/g, STP); V0: micropore volume; R: universal gas constant; T: experimental temperature (K); and E: characteristic energy (kJ/mol).
It is widely used in density functional theory methods to calculate the pore size or volume of nanometer materials (Wei et al., 2016).
The pyrolysis parameters of K2qn1 shales and their extracted residues are tabulated in Supplementary Table S1. The TOC contents in the initial samples, in the residues 1 and in the residues 2 vary from 1.36 to 2.64 wt%, 1.2 to 2.16 wt%, and 1.12 to 1.83 wt%, respectively. Pyrolysis S1 and oil saturation index (OSI = S1/TOC×100, Jarvie, 2012) in the initial samples range from 0.86 to 3.99 mg/g rock and from 55.15 to 151.14 mg HC/g rock. For the residues 1, the two parameters display various decreasing values, but these values are no obvious reduction for the residues 2 (Supplementary Table S1). The variations of HI and PI [production index, =S1/(S1+S2)] in the extraction process present similar variations comparison to variations of the S1 values and OSI values (Supplementary Table S1). The high Tmax values range from 441 to 449°C in the intial samples, which are not affected by extractions.
In extracts 1, the amount of hydrocarbons significantly varies in the range from 1.21 to 8.58 mg/g rock (Figure 3). For extracts 2, the amount of hydrocarbons is from 0.11 to 0.9 mg/g rock. Apart from the hydrocarbons (>65%), the EOM is composed of polar compounds (between 15 and 30% of EOM) and low amounts of asphaltenes (<5%) in extracts 3. As EOMs consisting of much higher NSOs in extracts 2 than in extracts 1 the results manifest the stronger polar eluent and the more abundant polar extracts. The average percent of NSOs is more than 50% in extracts 2.
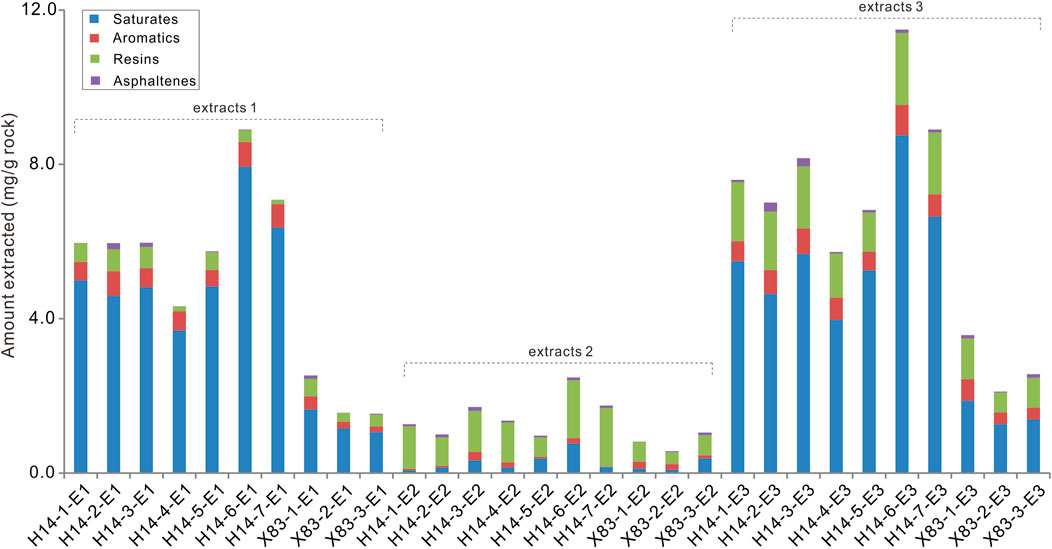
FIGURE 3. Amount of organic matters extracted in the organic solvents.
FE-SEM imaging can provide important information on the pore types within shales (Loucks et al., 2009). The pore types identified in the initial samples mainly include interparticle, intraparticle, organic matter pores, and interlayer fractures (Figure 4). The interparticle pores are mainly observed between organic matters and clay grains (Figure 4), and this is probably related to the shrinking of clay minerals (Chalmers et al., 2012). The shales record a large quantity of intraparticle, most of them located within particles, mainly from clay mineral flakes, organic matters, and coarse detrital particles. These pores are normally approximately 1–3 μm in size. The existence of organic pores is located in organic matters, whereas, the shales studied here and many organic particles do not contain organic pores (Figure 4). In clay aggregates, interlayer fractures can be developed in clay minerals (Figure 4). Illite/smectite-mixed layer minerals were flaky with serrated edges (Figure 4).

FIGURE 4. Field emission scanning electron microscopy showing pore and fracture features of K2qn1 samples.
Figures 5A,B present the N2 adsorption and desorption curves of type IV low-pressure isotherms (inverse “S”) defined by IUPAC (Barrett et al., 1951). At a relatively high pressure (P/P0 > 0.95), amount of quantity adsorbed by the initial samples varies from 14.08 to 24.43 cm3/g and that of residues further increase after solvent extraction (Supplementary Table S1). The hysteresis ring shows unchanged ink bottle-shaped pores before and after extraction (Figures 5A,B).
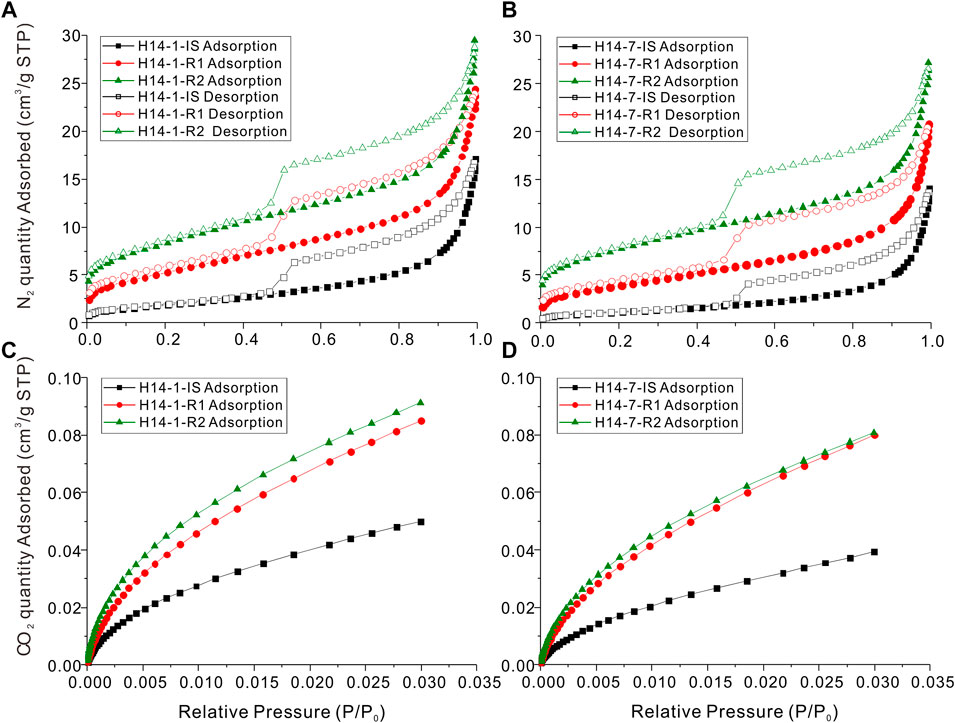
FIGURE 5. Nitrogen and carbon dioxide gas adsorptions and desorption isotherms.
The SBET increased with extraction across solvents for the oil-rich samples, with dichloromethane and methanol extraction causing the greatest increase in the SBET. The SBET for initial samples ranges from 4.18 to 10.97 m2/g (Supplementary Table S1). The extractions cause remarkable changes of the SBET, showing the SBET of residues vary from 14.11 to 25.15 m2/g for residues 1, and that of residues 2 are from 23.88 to 38.38 m2/g (Supplementary Table S1).
The volumes of mesopores (sizes of 2–50 nm) and macropores (sizes of 50–100 nm) calculated by the BJH theory are listed in Supplementary Table S1. The volumes of mesopores and macropores in the initial samples vary from 1.0 to 1.84 cm³/100 g and 0.2 to 0.6 cm³/100 g (Supplementary Table S1), respectively, which increase in residues 1 and residues 2 after suffering two times of extractions (Supplementary Table S1). However, the BJH pore width of the initial shale is in a range from 7.61 to 21.54 nm, displaying a decreasing trend after solvents (Supplementary Table S1).
The CO2 adsorption isotherm curves display significant type I features of microporous materials in Figures 5C,D (Sing et al., 1985). Regardless of whether the relative pressure P/P0 is high or low, the adsorption capacities of the original samples and residues show a sequence of residues 2 > residues 1 > initial samples (Supplementary Table S1; Figures 5C,D).
The micropore volumes (Vmic) of the initial samples calculated by the Dubinin–Astakhov theory vary from 0.66 to 1.58 cm³/100 g. After solvent extractions, the Vmic gradually increases. The Vmic of residues 1 varies from 1.65 to 2.09 cm³/100 g and that of residues 2 is from 1.86 to 2.32 cm³/100 g (Supplementary Table S1).
All the samples fall inside the field characteristic for good oil source rocks in the TOC vs. S2 diagram (Figure 6). All the samples are characterized by Type I/II kerogens, indicating mainly aquatic-derived organic matters (Peters et al., 2005). These organic materials provide important parent materials for the generation of oil and gas in the Songliao Basin (Feng et al., 2010; Cao et al., 2016, 2021).
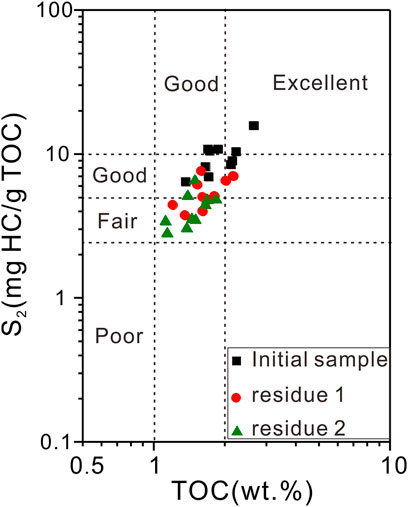
FIGURE 6. Plot of TOC and S2 displays potential of K2qn1 source rocks.
The OM compositions extracted with different solvents present variations as function of solvent properties. According to the principle of similar phase dissolution, petroleum ether, as a non-polar solvent, can extract more portions of weak polar hydrocarbons. This is most clearly shown by the high proportions of alkanes and aromatics isolated from extracts 1 because of similar properties in solubility parameters (calculated as the square root of the heat of vaporization divided by molar volume; Kamlet et al., 1981). Most of the NSOs are characterized by higher polar and hydrophilic, and miscible in mixed solvents of dichloromethane and methanol, which explains the higher extraction amounts in extracts 2. In addition, the initial samples (e.g., H14-6-IS and H14-7-IS) have high content of hydrocarbons (Figure 3), suggesting that small molecules contribute significantly to the amount of free oils in shale. Oils with high fluidity present low-dipole moment and great viscosity for heteroatomic materials. With the increase of NSOs in shale, the oxygen–carbon ratios gradually increase, resulting in the increase of interactions between residual oils and shale reservoirs, and changing flow of fluids.
Three forms of OMs in shales, mainly including non-porous, porous, and extracted OMs, were observed by Walls and Diaz (2011). Loucks et al. (2009) and Curtis et al. (2012) also proposed that one kerogen particle in one sample may contain porous and non-porous OM forms. Factually, the three forms of OMs could be present in shale of the Songliao Basin. As observed by FE-SEM, the porous OMs within the shale have been clearly observed (Figure 4), but not all OMs have nanopores, and the non-porous kerogens exist in shales within “oil window.” Nanoporosity in organic matters could begin to develop at about Ro > 0.6–0.9% (Curtis et al., 2012; Loucks et al., 2012) because kerogen is decomposed to bitumen during the period of oil generation. In addition, the viscous liquids (bitumen) filling in the intergranular and grain contact voids of shale are the typically extracted OMs and non-porous materials. Removing oils can expose porous kerogens (Qi et al., 2019). Although there are no FE-SEM images for post-extraction residues, the solid OMs in residues are possible to be more porous than that of initial shales because their organic pores observed by FE-SEM images are not the whole, and they are blocked.
Kerogen is solid and insoluble in organic solvents, which has the characteristic of the cross-linked macromolecular network with bridging and side functional groups (Ballice, 2003). The kerogen nanopore could be a major shale pore component, which provides a significant portion of nanopore voids (Loucks et al., 2009; Curtis et al., 2012). Oil adsorbed on kerogen is the main occurrence of residual oil in the source rock (Pepper and Corvi, 1995; Li et al., 2016), which exists in the adsorbed state on the internal and external surfaces of OM due to the oil-wet surface (Zou et al., 2013; Wang M. et al., 2019). After the removal of extractable bitumen, the porous kerogen and solid bitumen are exposed (Qi et al., 2019), indicating that these extracts occupy pore surfaces of solid OMs (Valenza et al., 2013). Additionally, the kerogen can also swell extensively when immersed in organic solvents (Ballice, 2003). Thus, three (soluble, porous, and solid) OM forms have different mechanisms on controlling nanopores.
There is a negative correlation (R2 = 0.832) between SBET and TOC in the initial shale (Figure 7A), indicating that the occurrence of organic matter is the key control causing decreased surface areas. The SBET of residues 1 has discrete correlation (R2 = 0.184, Figure 7A) with TOC when hydrocarbons are dominantly extracted by non-polar solvent. The reason is that kerogen swelling can decrease porosity during shale interactions with solvent (Geramian et al., 2016; Distefano et al., 2019; Qi et al., 2019), which can counteract the effect of releasing pore spaces. Additionally, a good positive correlation between these parameters (R2 = 0.830) in residues 2 occur when the samples were extracted by polar solvent (Figure 7A), although other studies have noted such trends at over larger maturity ranges (Ross and Bustin, 2009; Cao et al., 2015). The shales may thus be assumed to contain porous kerogens that possess a high amount of surface area. The cause of surface area increment is that more OM spaces can be released after extractions. This shift demonstrates that the amount of extracted OMs determines the SBET in initial oil-rich lacustrine shales, whereas the solid OMs predominantly control the SBET after polar solvent extraction, and the intermediate form (extracted by non-polar solvent extraction) is controlled by kerogen swelling. Thereby, soluble OM blocking, kerogen swelling, and organic pore development are the key factors leading to the change of surface area variations observed during shale interactions with solvents.
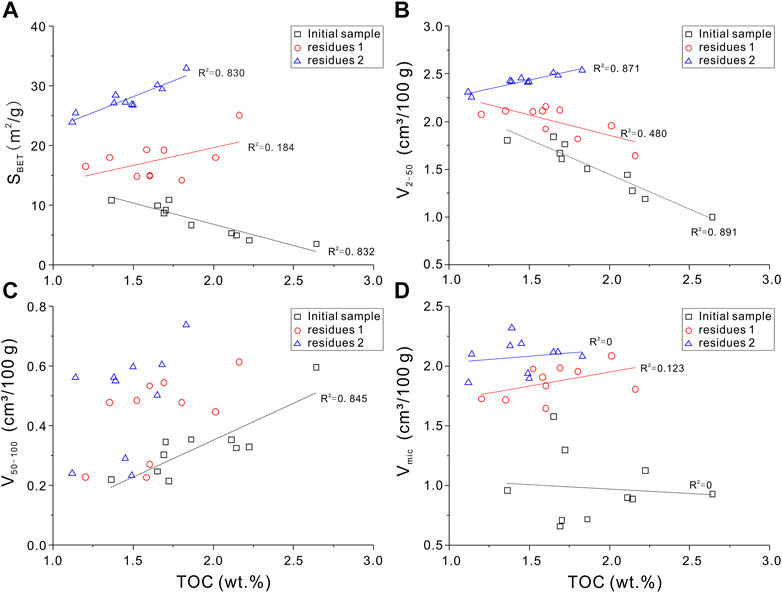
FIGURE 7. Correlation of pore surface areas and pore volumes with the TOC.
Here is a negative correlation (R2 = 0.891) between mesopore volumes and TOC contents for the initial shales, discrete correlation (R2 = 0.480) to post-extraction residues 1, and then positive correlation (R2 = 0.871) to post-extraction residues 2 (Figure 7B). This transformation of correlations is similar to that of SBET and TOC, reflecting organic mesopore from blockage to release. The reason is organic nanopore voids in shales could be filled by generated oils within source rocks (Hedges and Keil, 1995; Wang and Reed, 2009; Romero-Sarmiento et al., 2014), whose molecular size is roughly close to the size of a mesopore, which provides oil storage space (Valenza et al., 2013), and these spaces are released after extractions. Although the mesopores of kerogen in this study were not observed by FE-SEM because of the absent of post-extraction samples, Wang M. et al. (2015) found that abundant organic mesopores of 24–46 nm appeared in K2qn1 shale, which supports our data. The result generally reflects solvent mesopore interactions in lacustrine oil-prone shale.
Particularly, the positive correlation (R2 = 0.845) between macropore volumes and TOC contents present in initial shale (Figure 7C) indicates that organic matter contents have a dominant effect on the macropore voids. However, Wang M. et al. (2015) suggested that macropores within kerogens of K2qn1 source rocks were undeveloped according to the studies of FE-SEM and Hg intrusion. As shown in Figure 4, the macropores may mainly include the free spaces from the clay interlayer fractures filled with solid OMs and illite/smectite-mixed layers (4.4). It is conceivable that if the solid OM (e.g. kerogen) has a dominant contribution to the macropore development in the shale, the positive trend between macropore volumes and TOC contents can be maintained after soluble OM removal. Factually, although soluble OMs may control on macropore development because of the releasing amounts of macropore voids after extractions, the removal of soluble OM shows no correlations in OM with macropore volume (4.2.2). It may be inferred that larger pores or interlayer fractures are physically cut into nanoscale pore by liquid organic matter (e.g. oil molecules in 4.2.2), and formation of macropores could be measured under this experimental condition. The data also support the clogging effect of segregated pores by residual oils (Loucks et al., 2012), consistent with hydrocarbon vapor adsorption experiment of Li et al. (2017).
However, the correlations between micropore volumes and TOC contents for the initial samples or post-extraction residues are weakened and show considerable scatter (Figure 7D). This indicates that the solid OM contributes little to the micropore volume. The reason is possibly because a relatively low matured micropore shows an undeveloped structure(Chen and Xiao, 2014). Nonetheless, comparison of Vmic volumes between initial and extracted samples reveal that occurrence of liquid organic matters has still influence on the micropore volume.
1) Oils releasing from surface areas
As shown in Formula (3), cumulative surface areas (ΔSRe-IS) between SBET-Re and SBET-IS are made.
Here, SBET-IS is the surface area of initial samples. SBET-Re is the surface area of residues. The cumulative surface areas of ΔSa Re-IS and ΔSb Re-IS represent difference between residues 1 and initial samples and difference between residues 2 and initial samples in the surface area, respectively.
To test the possibility that oil family compositions affect surface areas in studied samples, the absolute increase in surface areas is plotted against the amount of extracted hydrocarbons and NSOs (Figure 8). There are well negative correlations between both hydrocarbons and NSOs from amount of extracts 3 and the SBET in initial samples (Figure 8). A comparison was performed by Cao et al. (2015), who demonstrated a strong positive correlation between specific surface areas and pyrolysis parameter S1 values in Silurian shales. Based on the analysis of extracts and N2 adsorption, the removal of extractable compounds obviously caused different changes of specific surface areas. Both the amount of extracted hydrocarbons and NSOs isolated from extracts 1 show positive trend with ΔSa Re-IS (Figure 8). It can be inferred that both hydrocarbons and NSOs adsorbed on surfaces of oil-prone source rocks could control the development of specific surface areas. Compared with the cumulative surface areas of ΔSa Re-IS, the larger change in ΔSb Re-IS may be due to more solvent penetration into samples leading to the breakdown of fluid–pore interactions, including fluid–kerogen and fluid–clay interactions (Valenza et al., 2013; Distefano et al., 2016). However, the correlation coefficient (R2 = 0.641) between ΔSb Re-IS and the amount of extracted hydrocarbons demonstrates well than that of ΔSa Re-IS and the amount of extracted NSOs (R2 = 0). This difference indicates the different degrees between hydrocarbons and NSOs in filling surface areas, attributed to the hydrocarbons, making up the majority of crude oils, and a large amount of surface areas are exposed due to hydrocarbons releasing rather than NSOs releasing. Although the removal of large molecule materials in the extraction process also provide increment of the surface area, the removal of NSOs from pore surface areas attribute to two) or three) processes (Radlinski et al., 2000; Geramian et al., 2016; Mohnhoff et al., 2015; Distefano et al., 2016; 2019). It causes a scattering change of intensity in the pores.
2) Oils within pore voids
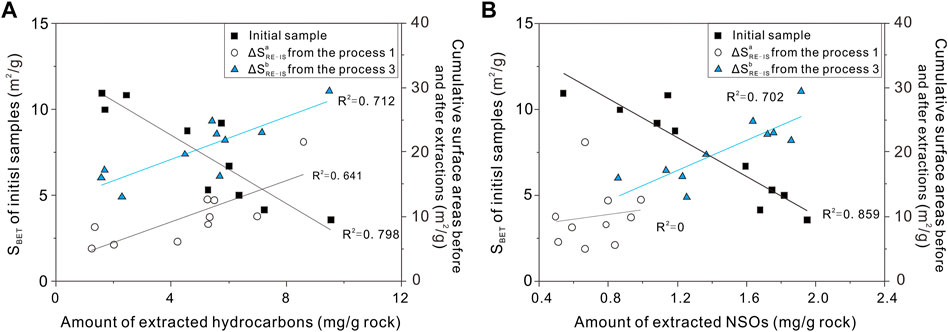
FIGURE 8. (A) Amount of hydrocarbons vs. surface areas in the initial samples and cumulative surface areas, respectively; (B) Amount of NSOs vs. surface areas in the initial samples and cumulative surface areas, respectively.
Beaumont and Foster (1999) concluded that pore throats of reservoirs were generally considered as molecular sieves, allowing small particle to pass but retain lager particle, that is, normal paraffins, aromatic, asphltenes, and methane gas characterized by the diameters of 0.4–10, 0.8–20, 5–40, and 0.38 nm, respectively. Thereby, crude oil inside nanopore of source rocks is dominantly stored in mesopores and macropores.
The cumulative pore volume (ΔVRe-IS) between VRe and VIS is calculated by Formula (4) as follows:
Here, VIS is the pore volume of initial samples. VRe is the pore volume of residues. ΔVa Re-IS and ΔVb Re-IS represent the difference between residues 1 and initial samples and difference between residues 2 and initial samples in the pore volume, respectively.
Extraction of bitumen significantly alters nanopore volumes (Figures 9A–D). We here assess the effect of pore clogging by bitumen based on comparing nanopore volumes measured before and after solvent extraction. There are remarkably negative correlations (R2 = 0.868) between the VIS mesopore volumes of initial samples and amount of extracts 3 (Figures 9A,B), whereas cumulative mesopore volumes of ΔVb Re-IS show positive trends with the amount of extracted hydrocarbons and NSOs. The changes of correlations indicate that mesopore volumes in initial shale are dominantly blocked by oils and are gradually released after extraction, implying the opening pore space. The mesopore volume changes could be explained by the mechanism of incomplete or partial breakdown of organic matter (Distefano et al., 2016). As studied by Li et al. (2016), the OM-hosted pore network is created during the conversion of kerogen to oil, whereas parts of OM pores are synchronously filled by oils generated by kerogen and finally reaching the saturated state. Our samples are mainly within oil windows, and a large number of hydrocarbons generated from solid kerogen but not yet been completely expelled due to hydrocarbon expulsion efficiency lower than 70% for source rocks of the Songliao Basin (Xue et al., 2015). However, after the second extraction, the correlation between cumulative mesopore volumes of ΔVa Re-IS and amount of extracted hydrocarbons is apparently better than that of ΔVa Re-IS and amount of extracted NSOs (Figure 9). The result is consistent with the previous study of oils releasing from surface areas, attribution to dissolution, migration for NSOs, and incomplete breakdown of OMs (Radlinski et al., 2000; Distefano et al., 2016; 2019).
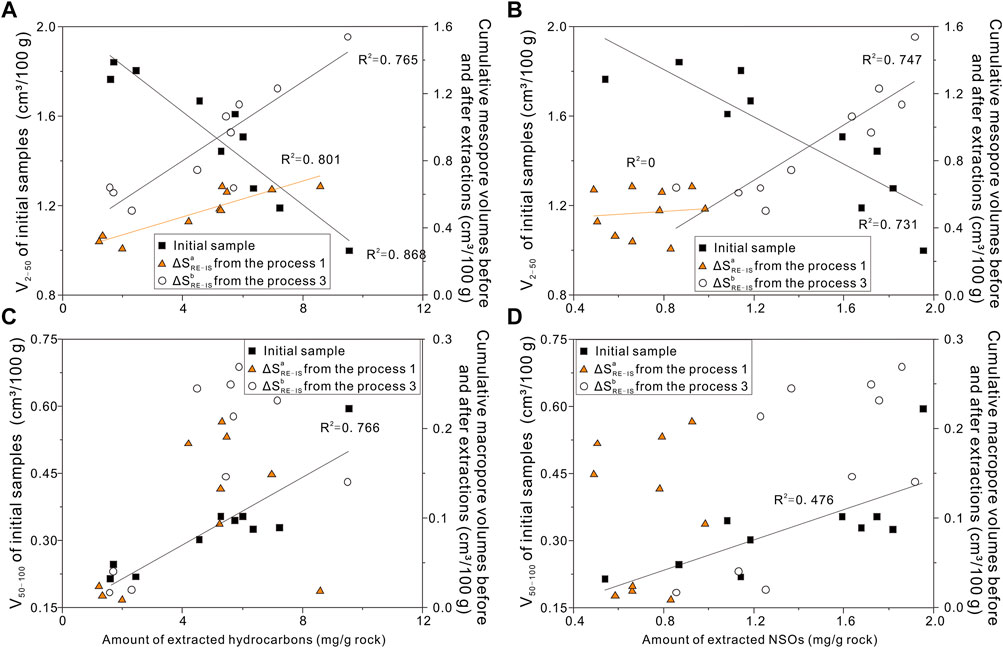
FIGURE 9. (A) Amount of hydrocarbons vs. mesopore volumes in the initial samples and cumulative surface areas, respectively; (B) Amount of NSOs vs. mesopore volumes in the initial samples and cumulative surface areas, respectively; (C) Amount of hydrocarbons vs. macropore volumes in the initial samples and cumulative surface areas, respectively; (D) Amount of NSOs vs. macropore volumes in the initial samples and cumulative surface areas, respectively.
In Figure 9C, there is a positive correlation (R2 = 0.766) between macropore volumes (50–100 nm) and hydrocarbon contents in initial shale. This suggests that the larger pores in mature lacustrine oil-prone shale, the more hydrocarbons it contains. The reason is that some macropores may be derived from larger pores or interlayer fractures cut or segregated by residual oil molecules. Consistent with the study from Wang M. et al. (2019), who suggested the increase of porosity, the proportion of free oil in residual oil increased. After hydrocarbon expulsion, hydrocarbon migration in studied source rocks tends to occur in macropores or fractures due to capillary pressure and buoyancy. However, not all the macropores are filled with oils. Moreover, the amounts of both extracted hydrocarbons and NSOs compounds are not consistent with cumulative macropores volume variations (R2 < 0.5) before and after extractions (Figure 9D). The main cause is that the residual hydrocarbons in shale occupy mesopore volumes dominantly, and it is not possible to distinguish oil with different pore diameters effectively. Thereby, it still needs to perform more research works on oil family compositions to be effective on nanopores.
Maturity could control the development of nanopores during oil/gas generation (Chen and Xiao, 2014; Wu et al., 2015; Jiang et al., 2016). However, this was not any observable trends in nanopore changes with maturity. The reason is that the shale samples are generally within a narrow maturity range, whereas there are great differences of nanopore structure parameters in study samples (Supplementary Table S1). Additionally, as expected, the changes are less pronounced in maturity from each of the extracted samples. Thus, the maturity is not the dominant factor to solvent-nanopore interactions.
The pore size distributions of Qingshankou Formation shales calculated by the BJH model are presented. A plot of the derivative of pore volume with respect to pore diameter (dV/dW vs. W) could be referred to describe the pore volume in any pore width range. Furthermore, if the W-axis is logarithmically expressed, the plot of dV/d(logW) vs. W mainly displayed the pore size distribution of the relative pore volumes between any pore size ranges (Kuila and Prasad, 2013) because the “visual area” from the curve of dV/d(logW) is proportional to the real volume (Wei et al., 2016). Meyer and Klobes (1999) suggested an equation of dV/d(logW) = 2.303 × dV/dW × W, as a result of magnifying concentration of mesopores and macropores application on N2 adsorption (Tian et al., 2015).
The pore size distributions of Qingshankou shales calculated by the BJH model are shown in Figure 10. This pattern clearly demonstrates that the larger pores could contribute more to the total pore volume, consistent with observation by FE-SEM. The reason is that one large pore can have a volume equal to many small pores (Tian et al., 2013). The plot of dV/d(logW) vs. W for the shale pore volumes demonstrate different PSDs for three samples with different organic matter contents or oil capacity (Figures 10A–C). Comparing three initial geological samples, there are generally much finer micropores to mesopores (<10 nm) in low TOC or OSI samples, whereas larger mesopores to macropores (>10 nm) are developed in high TOC or OSI samples (Supplementary Table S1; Figures 10A–C). After organic solvent extraction in succession, average pore width of shale decreases obviously because of petroleum removal from smaller pores, and larger nanopores of free oil-rich samples (high OSI) apparently increase. The observation is consistent with the study by Zhu et al. (2019) who suggested that the threshold of pore diameter for petroleum mobility reaches 12.1 nm in mature Eocene lacustrine shales. Zou et al. (2011) also estimated that the critical pore radii can be about 54 nm for tight oil reservoirs in the Ordos Basin of China. The occurrence of mobile oil can be ascribed to two reasons: the first is hydrocarbon expulsion leading to these residual oils driven out to larger pores or even fractures (Qi et al., 2019), and the second is that the large amount of residual oils can only be concentrated in the available space of its own size based on the molecular sieves effect (Beaumont and Foster, 1999). Comparison of average pore diameters between initial and extracted samples, it is thereby inferred that more free oils (e.g., OSI = 151.14 HC mg/g TOC for the H14-6-IS sample in Supplementary Table S1) mainly occur in rich larger nanopores of lacustrine oil-prone shales. If residual oils in shales are capable of being mobilized when OSI >100 HC mg/g TOC (Jarvie, 2012), the threshold of average pore width in studied shales reaches 11.7 nm (e.g. H14-1-IS sample in Supplementary Table S1). This threshold is slightly lower than 12.1 nm from Zhu et al. (2019), the probable reason is different sediment environments and source-reservoirs for two type shales.
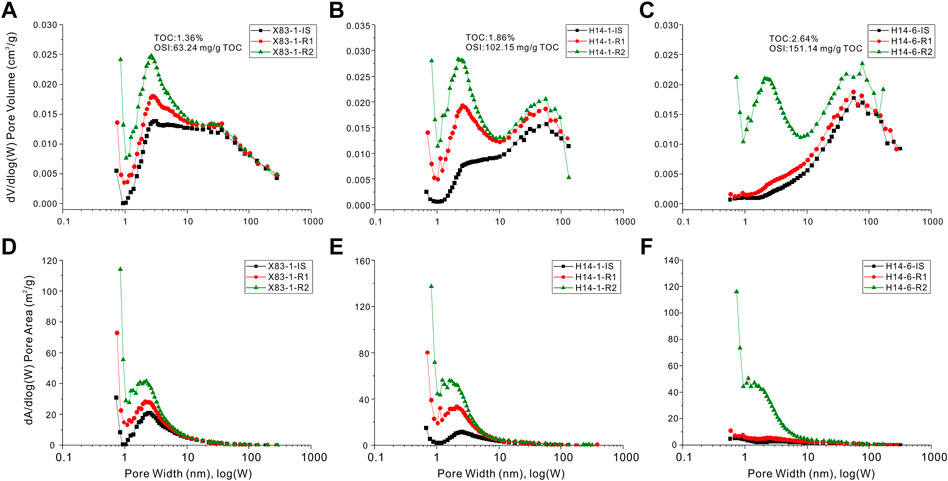
FIGURE 10. Plot showing correlation of pore sizes and special surface area distributions with pore width from N2 adsorption isotherm using BJH model.
For the distributions of the specific surface area with respect to the pore size [(dA/d(logW) vs. W)], the results show dominant pores less than 10 nm respect to pore areas, and the concentrations of these pores decrease with the increasing of the pore size (Figures 10D–F). The relative contributions of micropores, mesopores, and macropores to the surface areas reveal that most of the surface areas are dominantly contributed by micropores and fine mesopores (Figures 10D–F). Xiong et al. (2016) also suggested that growths of pre- and post-extraction nanopores occurred in width of less than 10 nm in Yanchang shales of the Ordos Basin. It can be thereby estimated that more than 60% oil stored in shale could be adsorbed on the surface of pore with size less than 5 nm, and threshold nanopore diameter would enlarge with an enrich content of heavier hydrocarbons (Wang M. et al., 2015). By fully considering the total oil compositions, here we suggest that residual oils distributed on the surface of pores in these lacustrine shales may be predominantly controlled by finer nanopores (<10 nm).
The Songliao Basin lacustrine shales were sequentially extracted with petroleum ether and mixed solvent of dichloromethane and methanol, and nanopores of two solvent-extracted residues and initial samples were analyzed using low-pressure nitrogen and carbon dioxide adsorptions. Combined with the measurement of Rock-Eval, FE-SEM, and geochemical analyses, the results reveal solvent-nanopore interactions on lacustrine oil-prone shale. The following conclusions are drawn from this study:
1) The sequentially soluble OMs contain various oil compositions, showing high content of hydrocarbon from petroleum ether extraction, and high yield of NSOs from dichloromethane and methanol extractions.
2) Organic matter is a primary control on solvent-nanopore interaction in shale–oil systems: generally, the lower TOC content, the greater N2-BET specific areas and nanopore volumes of the shales. Differences in organic matter forms greatly affect nanopore development in organic rich shales. The SBET and mesopores were mainly blocked by soluble OMs. The cumulative increases of SBET and mesopores were significantly controlled by amount-extracted hydrocarbons during petroleum ether extraction, but both hydrocarbons and NSOs have an influence on cumulative increases of SBET and mesopores after all soluble OMs removed. The porous-organic mesopores gradually emerge during sequential extractions, indicating open nanopores in the shales. Additionally, the non-porous and soluble OMs can jointly fill in the interlayer fractures of clay mineral, changing macropores by physically restricting the access of these structures.
3) Consider residual oil composition and pore diameter comprehensively, the oils adsorbed on the pore surface are mainly controlled by nanopores less than 10 nm, and when nanopore is greater than the threshold of 11.7 nm, the residual oils in shale will be likely free.
The raw data supporting the conclusion of this article will be made available by the authors, without undue reservation.
HC contributed to the writing of the manuscript with additional support from XW contributed Figures. DZ and DF collected the samples analyzed and did some preliminary work on it.
This study was financially supported by the Foundation for National Science of China (No. 42103046), Foundation for Natural Science of Gansu Province (21JR7RA502 and 21JR7RA525), and Fundamental Research Funds for the Central Universities (lzujbky-2018-6).
DF was employed by the company Shaanxi Coal Geology Group Co., Ltd.
The remaining authors declare that the research was conducted in the absence of any commercial or financial relationships that could be construed as a potential conflict of interest.
All claims expressed in this article are solely those of the authors and do not necessarily represent those of their affiliated organizations, or those of the publisher, the editors, and the reviewers. Any product that may be evaluated in this article, or claim that may be made by its manufacturer, is not guaranteed or endorsed by the publisher.
The Supplementary Material for this article can be found online at: https://www.frontiersin.org/articles/10.3389/feart.2022.884518/full#supplementary-material
Ballice, L. (2003). Solvent Swelling Studies of Göynük (Kerogen Type-I) and Beypazarı Oil Shales (Kerogen Type-Ii)⋆. Fuel 82, 1317–1321. doi:10.1016/s0016-2361(03)00026-7
Barrett, E. P., Joyner, L. G., and Halenda, P. P. (1951). The Determination of Pore Volume and Area Distributions in Porous Substances. I. Computations from Nitrogen Isotherms. J. Am. Chem. Soc. 73, 373–380. doi:10.1021/ja01145a126
Beaumont, E. A., and Foster, N. H. (1999). Exploring for Oil and Gas Traps. AAPG Bull., 7. doi:10.1306/trhbk624
Bi, H., Li, P., Jiang, Y., Fan, J.-J., and Chen, X.-Y. (2021). Effective Source Rock Selection and Oil-Source Correlation in the Western Slope of the Northern Songliao Basin, China. Pet. Sci. 18, 398–415. doi:10.1007/s12182-021-00554-1
Brunauer, S., Emmett, P. H., and Teller, E. (1938). Adsorption of Gases in Multimolecular Layers. J. Am. Chem. Soc. 60, 309–319. doi:10.1021/ja01269a023
Cao, H., Hu, J., Peng, P. A., Xi, D., Tang, Y., Lei, Y., et al. (2016). Paleoenvironmental Reconstruction of the Late Santonian Songliao Paleo-lake. Palaeogeogr. Palaeoclimatol. Palaeoecol. 457, 290–303. doi:10.1016/j.palaeo.2016.05.027
Cao, H., Lei, Y., Wang, X., Zou, Y.-R., and Peng, P. A. (2021). Molecular Structure Evolution of Type I Kerogen during Pyrolysis: Case Study from the Songliao Basin, NE China. Mar. Pet. Geology. 134, 105338. doi:10.1016/j.marpetgeo.2021.105338
Cao, H., Zou, Y.-R., Lei, Y., Xi, D., Wan, X., and Peng, P. A. (2017). Shale Oil Assessment for the Songliao Basin, Northeastern China, Using Oil Generation-Sorption Method. Energy Fuels 31, 4826–4842. doi:10.1021/acs.energyfuels.7b00098
Cao, T., Song, Z., Wang, S., Cao, X., Li, Y., and Xia, J. (2015). Characterizing the Pore Structure in the Silurian and Permian Shales of the Sichuan Basin, China. Mar. Pet. Geology. 61, 140–150. doi:10.1016/j.marpetgeo.2014.12.007
Chalmers, G. R., Bustin, R. M., and Power, I. M. (2012). Characterization of Gas Shale Pore Systems by Porosimetry, Pycnometry, Surface Area, and Field Emission Scanning Electron Microscopy/transmission Electron Microscopy Image Analyses: Examples from the Barnett, Woodford, Haynesville, Marcellus, and Doig Units. Bulletin 96, 1099–1119. doi:10.1306/10171111052
Chalmers, G. R. L., and Bustin, R. M. (2007). The Organic Matter Distribution and Methane Capacity of the Lower Cretaceous Strata of Northeastern British Columbia, Canada. Int. J. Coal Geology. 70, 223–239. doi:10.1016/j.coal.2006.05.001
Chen, J., and Xiao, X. (2014). Evolution of Nanoporosity in Organic-Rich Shales during thermal Maturation. Fuel 129, 173–181. doi:10.1016/j.fuel.2014.03.058
Chen, X. H., and Zhang, M. (2017). Composition Characteristics of the Saturated Hydrocarbon of the Sequential Extracts from the Oil-Bearing Shales with Different Polarity Reagents. Petrol. Explor Dev. 36, 168–174. (in Chinese with English abstract). doi:10.3969/J.ISSN.1000-3754.2017.03.030
Cheng, P., Xiao, X., Tian, H., Gai, H., Zhou, Q., Li, T., et al. (2022). Differences in the Distribution and Occurrence Phases of Pore Water in Various Nanopores of marine-terrestrial Transitional Shales in the Yangquan Area of the Northeast Qinshui Basin, China. Mar. Pet. Geology. 137, 105510. doi:10.1016/j.marpetgeo.2021.105510
Cheng, P., Xiao, X., Tian, H., and Wang, X. (2018). Water Content and Equilibrium Saturation and Their Influencing Factors of the Lower Paleozoic Overmature Organic-Rich Shales in the Upper Yangtze Region of Southern China. Energy Fuels 32, 11452–11466. doi:10.1021/acs.energyfuels.8b03011
Curtis, M. E., Cardott, B. J., Sondergeld, C. H., and Rai, C. S. (2012). Development of Organic Porosity in the Woodford Shale with Increasing thermal Maturity. Int. J. Coal Geology. 103, 26–31. doi:10.1016/j.coal.2012.08.004
Distefano, V. H., Mcfarlane, J., Anovitz, L. M., Stack, A. G., Gordon, A. D., Littrell, K. C., et al. (2016). Extraction of Organic Compounds from Representative Shales and the Effect on Porosity. J. Nat. Gas Sci. Eng. 35, 646–660. doi:10.1016/j.jngse.2016.08.064
Distefano, V. H., Mcfarlane, J., Stack, A. G., Perfect, E., Mildner, D. F. R., Bleuel, M., et al. (2019). Solvent-pore Interactions in the eagle ford Shale Formation. Fuel 238, 298–311. doi:10.1016/j.fuel.2018.10.010
Geramian, M., Osacky, M., Ivey, D. G., Liu, Q., and Etsell, T. H. (2016). Effect of Swelling Clay Minerals (Montmorillonite and Illite-Smectite) on Nonaqueous Bitumen Extraction from Alberta Oil Sands. Energy Fuels 30, 8083–8090. doi:10.1021/acs.energyfuels.6b01026
Dubinin, M. M., and Stoeckli, H. F. (1980). Homogeneous and Heterogeneous Micropore Structure in Carbona-Ceous Adsorbents. J. Coll. Interface Sci. 75, 34–42. doi:10.1016/0021-9797(80)90346-X
Feng, Z. Q., Jia, C. Z., Xie, X. N., Zhang, S., Feng, Z. H., and Cross, T. A. (2010). Tectonostratigraphic Units and Stratigraphic Sequences of the Nonmarine Songliao Basin, Northeast China. Basin Res. 22, 79–95. doi:10.1111/j.1365-2117.2009.00445.x
Gregg, S. J., and Sing, K. S. W. (1982). Adsorption, Surface Area and Porosity, 2nd ed. New York, NY: Academic Press, 303.
Groen, J. C., Peffer, L. A. A., and Pérez-Ramı́rez, J. (2003). Pore Size Determination in Modified Micro- and Mesoporous Materials. Pitfalls and Limitations in Gas Adsorption Data Analysis. Microporous Mesoporous Mater. 60, 1–17. doi:10.1016/s1387-1811(03)00339-1
Han, H., Guo, C., Zhong, N.-n., Pang, P., Chen, S.-j., Lu, J.-g., et al. (2019). Pore Structure Evolution of Lacustrine Shales Containing Type I Organic Matter from the Upper Cretaceous Qingshankou Formation, Songliao Basin, China: A Study of Artificial Samples from Hydrous Pyrolysis Experiments. Mar. Pet. Geology. 104, 375–388. doi:10.1016/j.marpetgeo.2019.04.001
Hedges, J. I., and Keil, R. G. (1995). Sedimentary Organic Matter Preservation: an Assessment and Speculative Synthesis. Mar. Chem. 49, 81–115. doi:10.1016/0304-4203(95)00008-f
Jarvie, D. M. (2012). “Shale Resource Systems for Oil and Gas: Part 2—Shale-Oil Resource Systems,” in Shale Reservoirs—Giant Resources for the 21st Century. Editor J. A. Breyer (AAPG Memoir), 97, 89–119. doi:10.1306/13321446M973489
Jiang, H., and Daigle, H. (2019). Effects of Fluids Removal and thermal Maturation on Permeability and Pore Structure of Organic-Rich Shale: Results from Pyrolysis Experiments. J. Pet. Sci. Eng. 183, 106453. doi:10.1016/j.petrol.2019.106453
Jiang, Z., Zhang, W., Liang, C., Wang, Y., Liu, H., and Chen, X. (2016). Basic Characteristics and Evaluation of Shale Oil Reservoirs. Pet. Res. 1, 149–163. doi:10.1016/S2096-2495(17)30039-X
Kamlet, M. J., Carr, P. W., Taft, R. W., and Abraham, M. H. (1981). Linear Solvation Energy Relationships. 13. Relationship between the Hildebrand Solubility Parameter, .delta.H, and the Solvatochromic Parameter, .pi.*. J. Am. Chem. Soc. 103, 6062–6066. doi:10.1021/ja00410a013
Kuila, U., Mccarty, D. K., Derkowski, A., Fischer, T. B., Topór, T., and Prasad, M. (2014). Nano-scale Texture and Porosity of Organic Matter and clay Minerals in Organic-Rich Mudrocks. Fuel 135, 359–373. doi:10.1016/j.fuel.2014.06.036
Kuila, U., and Prasad, M. (2013). Specific Surface Area and Pore-Size Distribution in Clays and Shales. Geophys 61, 341–362. doi:10.1111/1365-2478.12028
Li, J., Lu, S., Xie, L., Zhang, J., Xue, H., Zhang, P., et al. (2017). Modeling of Hydrocarbon Adsorption on continental Oil Shale: A Case Study on N-Alkane. Fuel 206, 603–613. doi:10.1016/j.fuel.2017.06.017
Li, Z., Zou, Y.-R., Xu, X.-Y., Sun, J.-N., Li, M., and Peng, P. A. (2016). Adsorption of Mudstone Source Rock for Shale Oil - Experiments, Model and a Case Study. Org. Geochem. 92, 55–62. doi:10.1016/j.orggeochem.2015.12.009
Liu, K. Q., Wang, L., Ostadhassan, M., Zou, J., Bubach, B., and Rezaee, R. (2019). Nanopore Structure Comparison Between Shale Oil and Shale Gas: Examples From the Bakken and Longmaxi Formations. Pet. Sci. 16, 77–93. doi:10.1007/s12182-018-0277-3
Liu, Y., Dong, X., Chen, Z., Hou, Y., Luo, Q., and Chen, Y. (2021). A Novel Experimental Investigation on the Occurrence State of Fluids in Microscale Pores of Tight Reservoirs. J. Pet. Sci. Eng. 196, 107656. doi:10.1016/j.petrol.2020.107656
Loucks, R. G., Reed, R. M., Ruppel, S. C., and Hammes, U. (2012). Spectrum of Pore Types and Networks in Mudrocks and a Descriptive Classification for Matrix-Related Mudrock Pores. Bulletin 96, 1071–1098. doi:10.1306/08171111061
Loucks, R. G., Reed, R. M., Ruppel, S. C., and Jarvie, D. M. (2009). Morphology, Genesis, and Distribution of Nanometer-Scale Pores in Siliceous Mudstones of the Mississippian Barnett Shale. J. Sediment. Res. 79, 848–861. doi:10.2110/jsr.2009.092
Lu, S., Liu, W., Wang, M., Zhang, L., Wang, Z., Chen, G., et al. (2017). Lacustrine Shale Oil Resource Potential of Es 3 L Sub-member of Bonan Sag, Bohai Bay Basin, Eastern China. J. Earth Sci. 28, 996–1005. doi:10.1007/s12583-016-0945-4
Meyer, K., and Klobes, P. (1999). Comparison between Different Presentations of Pore Size Distribution in Porous Materials. Fresenius' J. Anal. Chem. 363, 174–178. doi:10.1007/s002160051166
Mohnhoff, D., Littke, R., Krooss, B. M., and Weniger, P. (2016). Flow-through Extraction of Oil and Gas Shales under Controlled Stress Using Organic Solvents: Implications for Organic Matter-Related Porosity and Permeability Changes with thermal Maturity. Int. J. Coal Geology. 157, 84–99. doi:10.1016/j.coal.2015.09.010
Pepper, A. S., and Corvi, P. J. (1995). Simple Kinetic Models of Petroleum Formation. Part III: Modelling an Open System. Mar. Pet. Geology. 12, 417–452. doi:10.1016/02648-1729(59)69045
Peters, K. E., Walters, C. C., and Moldowan, J. M. (2005). The Biomarker Guide: Interpreting Molecular Fossils in Petroleum and Ancient Sediments. Englewood Cliffs NJ: Prentice-Hall.
Qi, Y., Ju, Y., Cai, J., Gao, Y., Zhu, H., Hunag, C., et al. (2019). The Effects of Solvent Extraction on Nanoporosity of marine-continental Coal and Mudstone. Fuel 235, 72–84. doi:10.1016/j.fuel.2018.07.083
Radlinski, A. P., Boreham, C. J., Lindner, P., Randl, O., Wignall, G. D., Hinde, A., et al. (2000). Small Angle Neutron Scattering Signature of Oil Generation in Artificially and Naturally Matured Hydrocarbon Source Rocks. Org. Geochem. 31, 1–14. doi:10.1016/s0146-6380(99)00128-x
Romero-Sarmiento, M.-F., Rouzaud, J.-N., Bernard, S., Deldicque, D., Thomas, M., and Littke, R. (2014). Evolution of Barnett Shale Organic Carbon Structure and Nanostructure with Increasing Maturation. Org. Geochem. 71, 7–16. doi:10.1016/j.orggeochem.2014.03.008
Ross, D. J. K., and Marc Bustin, R. (2009). The Importance of Shale Composition and Pore Structure upon Gas Storage Potential of Shale Gas Reservoirs. Mar. Pet. Geology. 26, 916–927. doi:10.1016/j.marpetgeo.2008.06.004
Rouquerol, J., Rouquerol, F., and Sing, K. S. W. (1999). Adsorption by Powders and Porous Solids: Principles, Methodology and Applications. Academic Press.
Schwark, L., Stoddart, D., Keuser, C., Spitthoff, B., and Leythaeuser, D. (1997). A Novel Sequential Extraction System for Whole Core Plug Extraction in a Solvent Flow-Through Cell - Application to Extraction of Residual Petroleum from an Intact Pore-System in Secondary Migration Studies. Org. Geochem. 26, 19–31. doi:10.1016/s0146-6380(96)00163-5
Sing, K. S. W., Everett, D. H., Haul, R. A. W., Moscou, L., Pierotti, R. A., Rouquerol, J., et al. (1985). Reporting Physisorption Data for Gas/solid Systems with Special Reference to the Determination of Surface Area and Porosity (Recommendations 1984). Pure Appl. Chem. 57, 603–619. doi:10.1351/pac198557040603
Tian, H., Pan, L., Xiao, X., Wilkins, R. W. T., Meng, Z., and Huang, B. (2013). A Preliminary Study on the Pore Characterization of Lower Silurian Black Shales in the Chuandong Thrust Fold Belt, Southwestern China Using Low Pressure N2 Adsorption and FE-SEM Methods. Mar. Pet. Geology. 48, 8–19. doi:10.1016/j.marpetgeo.2013.07.008
Tian, H., Pan, L., Zhang, T., Xiao, X., Meng, Z., and Huang, B. (2015). Pore Characterization of Organic-Rich Lower Cambrian Shales in Qiannan Depression of Guizhou Province, Southwestern China. Mar. Pet. Geology. 62, 28–43. doi:10.1016/j.marpetgeo.2015.01.004
Valenza, J. J., Drenzek, N., Marques, F., Pagels, M., and Mastalerz, M. (2013). Geochemical Controls on Shale Microstructure. Geology 41, 611–614. doi:10.1130/G33639.1
Walls, D. J., and Diaz, E. (2011). “Shale Reservoir Properties from Digital Rock Physics,” in Canadian Unconventional Conference, Calgary (Canada. CSUG/SPE 14743. doi:10.2118/147435-ms
Wang, C., Feng, Z., Zhang, L., Huang, Y., Cao, K., Wang, P., et al. (2013). Cretaceous Paleogeography and Paleoclimate and the Setting of SKI Borehole Sites in Songliao Basin, Northeast China. Palaeogeogr. Palaeoclimatol. Palaeoecol. 385, 17–30. doi:10.1016/j.palaeo.2012.01.030
Wang, F. P., and Reed, R. M. (2009). “Pore Networks and Fluid Flow in Gas Shales,” in Proceedings, Society of Petroleum Engineers Annual Technical Conference and Exhibition (New Orleans, Louisiana, USA. doi:10.2118/124253-ms
Wang, M., Ma, R., Li, J., Lu, S., Li, C., Guo, Z., et al. (2019a). Occurrence Mechanism of Lacustrine Shale Oil in the Paleogene Shahejie Formation of Jiyang Depression, Bohai bay basin, China. Pet. Exploration Dev. 46, 833–846. doi:10.1016/s1876-3804(19)60242-9
Wang, M., Yang, J., Wang, Z., and Lu, S. (2015a). Nanometer-scale Pore Characteristics of Lacustrine Shale, Songliao basin, Ne china. Plos One 10, e0135252. doi:10.1371/journal.pone.0135252
Wang, Y., Cao, J., Li, X., Zhang, J., and Wang, Y. (2019b). Cretaceous and Paleogene saline Lacustrine Source Rocks Discovered in the Southern Junggar Basin, NW China. J. Asian Earth Sci. 185, 104019. doi:10.1016/j.jseaes.2019.104019
Wei, L., Mastalerz, M., Schimmelmann, A., and Chen, Y. (2014). Influence of Soxhlet-Extractable Bitumen and Oil on Porosity in Thermally Maturing Organic-Rich Shales. Int. J. Coal Geology. 132, 38–50. doi:10.1016/j.coal.2014.08.003
Wei, M., Zhang, L., Xiong, Y., Li, J., and Peng, P. a. (2016). Nanopore Structure Characterization for Organic-Rich Shale Using the Non-local-density Functional Theory by a Combination of N2 and CO2 Adsorption. Microporous Mesoporous Mater. 227, 88–94. doi:10.1016/j.micromeso.2016.02.050
Wilhelms, A., and Larter, S. R. (1994). “The Geochemistry of Tar Mats,” in The Geochemistry of Reservoirs, Geol. Soc. Spec. Publ. No 86. Editors J. M. Cubitt, and W. A. Englanci (London: Geological Society Special PublicationsAcademic), 87–101.
Wu, S. T., Zhu, R. K., Cui, J. G., Bai, B., Zhang, X. X., Jin, X., et al. (2015). Characteristics of Lacustrine Shale Porosity Evolution, Triassic Chang 7 Member, Ordos Basin, NW China. Petrol. Explor Dev. 2, 167–176. doi:10.1016/S1876-3804(15)30005-7
Xiong, F., Jiang, Z., Chen, J., Wang, X., Huang, Z., Liu, G., et al. (2016). The Role of the Residual Bitumen in the Gas Storage Capacity of Mature Lacustrine Shale: A Case Study of the Triassic Yanchang Shale, Ordos basin, China. Mar. Pet. Geology. 69, 205–215. doi:10.1016/j.marpetgeo.2015.10.022
Xue, H. T., Tian, S. S., Lu, S. F., Zhang, W. H., Du, T. T., and Mu, G. D. (2015). Selection and Verification of Key Parameters in the Quantitative Evaluation of Shale Oil: A Case Study at the Qingshankou Formation, Northern Songliao Basin. Bull. Miner Petrol. Geochem. 34, 70–78. (in Chinese with English abstract). doi:10.3969/j.issn.1007-2802.2015.01.008
Zhu, X., Cai, J., Liu, Q., Li, Z., and Zhang, X. (2019). Thresholds of Petroleum Content and Pore Diameter for Petroleum Mobility in Shale. Bulletin 103, 605–617. doi:10.1306/0816181617517009
Zou, C. N., Yang, Z., Cui, J. W., Zhu, R. K., Hou, L. H., Tao, S. Z., et al. (2013). Formation Mechanism, Geological Characteristics and Development Strategy of Nonmarine Shale Oil in China. Petrol. Explor Dev. 1, 14–26. (in Chinese with English abstract). doi:10.1016/S1876-3804(13)60002-6
Keywords: lacustrine shale, extraction, organic matter, nanopore, shale oil
Citation: Cao H, Zhang D, Wang X and Fu D (2022) Extraction of Organic Compounds From Lacustrine Oil-Prone Shales and the Effect on Nanopore. Front. Earth Sci. 10:884518. doi: 10.3389/feart.2022.884518
Received: 26 February 2022; Accepted: 21 March 2022;
Published: 27 April 2022.
Edited by:
Peng Cheng, Guangzhou Institute of Geochemistry (CAS), ChinaReviewed by:
Haifeng Gai, Guangzhou Institute of Geochemistry (CAS), ChinaCopyright © 2022 Cao, Zhang, Wang and Fu. This is an open-access article distributed under the terms of the Creative Commons Attribution License (CC BY). The use, distribution or reproduction in other forums is permitted, provided the original author(s) and the copyright owner(s) are credited and that the original publication in this journal is cited, in accordance with accepted academic practice. No use, distribution or reproduction is permitted which does not comply with these terms.
*Correspondence: Huairen Cao, Y2FvaHJAbHp1LmVkdS5jbg==
Disclaimer: All claims expressed in this article are solely those of the authors and do not necessarily represent those of their affiliated organizations, or those of the publisher, the editors and the reviewers. Any product that may be evaluated in this article or claim that may be made by its manufacturer is not guaranteed or endorsed by the publisher.
Research integrity at Frontiers
Learn more about the work of our research integrity team to safeguard the quality of each article we publish.