 Fang Liu
 Jinqiang Liang1,2*
 Tingwei Li
- 1Guangzhou Marine Geological Survey, Guangzhou, China
- 2Southern Marine Science and Engineering Guangdong Laboratory (Guangzhou), Guangzhou, China
- 3Sinopec Petroleum Exploration and Production Research Institute, Beijing, China
It is found that natural gas hydrate is not only a pore-filling material but also exists in the reservoir in the form of rock skeleton particles. Therefore, the traditional petrophysical simulation method cannot well describe the physical properties of natural gas hydrate reservoir. At the same time, the physical properties of the hydrate layer and its associated free gas layer are quite different, so it is difficult to fit the physical properties of the two media using traditional modeling methods. The two-phase modeling technology used in this paper is the equivalent medium modeling technology based on BK solid substitution theory and Gassmann fluid substitution theory, which simulates hydrate particles in rock skeleton and hydrate filling in pores, respectively. The forward simulation results show that the two-phase simulation technology of natural gas hydrate can well fit the P-wave and S-wave velocity information of the medium. At the same time, the equivalent medium model of the free gas reservoir is established by using only Gassmann fluid substitution theory. The practical application shows that the subsection modeling method can well solve the problem of the too large difference between the two sets of reservoir physical properties and make the calibration results of forward modeling synthetic records more accurate.
1 Introduction
Natural gas hydrate is a new type of clean energy that has been paid attention to since the 20th century. It is widely distributed in the continental shelf, deep-water basin, and permafrost area and has the characteristics of extremely rich resources. In the 1990s (Paull and Matsumoto, 2000; Wood and Ruppel, 2000; Boswell R et al., 2012; Yamamoto K, 2014), China gradually carried out the investigation of natural gas hydrate and completed the leap from exploration to experimental exploitation in more than 20 years (Zhang H Q et al., 2007; Wang X J et al., 2014; Yang et al., 2015; Yang et al., 2017a). Especially in the South China Sea, a large number of natural gas hydrate investigations and two rounds of experimental exploitation have been carried out (Li et al., 2018; Sha et al., 2019; Zhang et al., 2017; Zhang et al., 2018; Zhang et al., 2020a; Zhang et al., 2020b; Su et al., 2020; Yang et al., 2017b; Yang et al., 2020). At present, the investigation method of natural gas hydrate is still dominated by the seismic method, but the seismic exploration method can only describe the possible range and spatial distribution of ore body and cannot quantitatively characterize the distribution characteristics of hydrate saturation in the ore body. It is necessary to establish the mathematical expression relationship between P-wave, S-wave velocity, density, and other physical parameters obtained by seismic data inversion and saturation through the method of petrophysical modeling. In this way, the 1-dimensional gas hydrate physical parameters obtained from logging data are extended to 2-dimensional and 3-dimensional space to complete the prediction of gas hydrate saturation (Worthington, 2008; Huang et al., 2012; Pan et al., 2019; Dong et al., 2020; Liu et al., 2020; Betlem et al., 2021; Yang et al., 2021).
With the development of natural gas hydrate, many petrophysical models suitable for natural gas hydrate have been developed.
Natural gas hydrate in sediments shows the properties of both fluid and solid skeleton, which have been found in laboratory research (Buffett and Zatsepina, 2000). With the efforts of many scholars, a variety of petrophysical theories suitable for simulating hydrate deposition have been proposed, including the weighted empirical formula (Lee et al., 1996), equivalent medium theory (Zhang and Toksoz, 2012), three-phase Biot type theory (Lee 2008), modified Biot Gassmann theory (Lee 2002), etc. The three-phase Biot type equation proposed by Carcione and Tinivella (2000) assumes that the formation is composed of three phases of sediment, hydrate, and pore fluid to calculate the elastic wave velocity in the hydrate stability zone. Lee (2008) introduces parameters to describe pore filling and contact behavior on the basis of the three-phase Biot type; The equivalent medium theory and modified Biot Gassmann theory are essentially pore-filling models for the simulation of natural gas hydrate bearing sediments. Zhang Yuwen et al. (2004) based on Biot’s two-phase medium theory and aiming at the three hydrate deposition models proposed by Ecker, studied the variation law of the velocity and attenuation of fast P-wave, slow P-wave, and S-wave with frequency in hydrate bearing strata with and without dissipation. According to the research results of Dai et al. (2008); Zhang et al. (2011) summarized the hydrate petrophysical models based on equivalent media into five categories, and quantitatively analyzed the relationship between reservoir wave velocity and Poisson’s ratio with hydrate saturation. Gao et al. (2012) used the improved Biot Gassmann (bgtl) model proposed by Lee to estimate the saturation of gas hydrate in well A by using P-wave velocity for the unconsolidated deep-water sedimentary strata with high porosity and silty clay in Shenhu sea area of the South China Sea. Pan et al. (2014) compared the saturation predicted by the effective medium model, the improved boit Gassmann model, and the simplified three-phase equation under the same occurrence state. It is found that the hydrate saturation predicted by the effective medium model and the improved Biot Gassmann model is more reasonable than that predicted by the simple three-phase equation (stpe).
Based on BK solid replacement theory and Gassmann fluid replacement theory, this paper establishes the equivalent medium two-phase modeling technology to characterize the two phase states of fluid filling and rock skeleton of natural gas hydrate respectively. This technology is applied to the natural gas hydrate work area in the Shenhu sea area of the South China Sea. At the same time, the subsection modeling method is used to fit the natural gas hydrate layer and free gas layer. The test shows that this method and technology has good applicability to the petrophysical modeling of natural gas hydrate in the Shenhu sea area, can well characterize the physical properties of natural gas hydrate and free gas reservoir in this work area, and can provide strong support for the quantitative study of natural gas hydrate saturation.
2 Traditional Rock Physical Modeling Methods
There are many types of hydrate petrophysical models. According to the previous research results and the actual situation of the study area, this study attempts to implement the existing model and analyzes the applicability of the existing model according to the actual data.
2.1 Empirical Formula Class (Three-Phase Weight Equation)
Pearson et al. (1983)applied the three-phase time-average equation (Eq. 1) to hydrate bearing rocks and qualitatively explained the acoustic properties of hydrate bearing strata in the consolidation medium:
In Formula 1,
Similar to the three-phase time-average equation given by Pearson (1983), the three-phase equation Wood and Stoffa Pand Shipley (1994) of hydrate bearing sediments can be defined as
In Formula 2,
In 1996, M.W. Lee et al. used the weight method of the three-phase time-average equation and the three-phase Wood equation used by Nobes et al. (1986)to estimate the velocity of deep-sea hydrate bearing sediments, and the three-phase weight equation was written as
In Formula 3,
The higher rock velocities estimated by time-average equations require the artificially lower matrix velocities. Based on the matrix velocity of 4.37 km/s and the assumption that hydrate is not present, the relationship between formation velocity and porosity is obtained by using the three-phase time-average equation, three-phase Wood equation, and three-phase weight equation respectively, as shown in Figure 1. The curve obtained by the weighted equation is located between the time-average equation and the Wood equation.
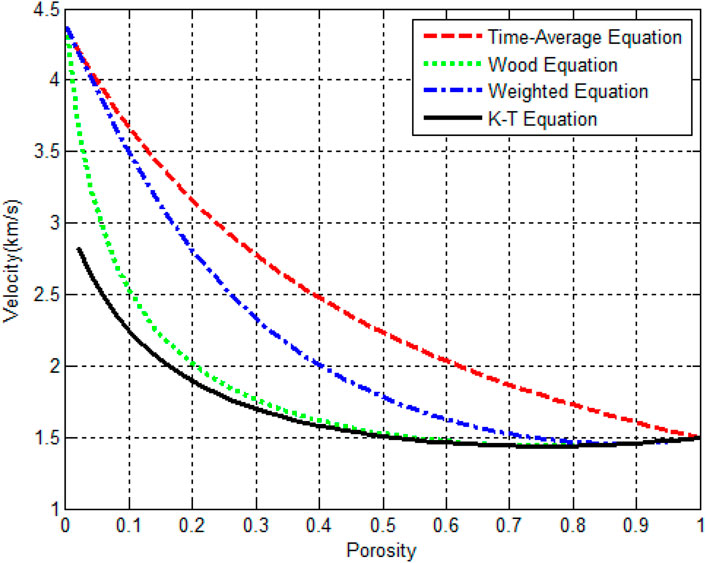
FIGURE 1. Relationship between formation velocity and porosity without hydrate.
When the hydrate saturation is 0, when W > 1, the weighting equation is inclined to Wood’s equation, and when W < 1, the weighting equation is inclined to the time-average equation. Since (1-s)≤1, the weighting equation rapidly approaches the time-average equation as n increases (as shown in Figure 2). Therefore, when applying the three-phase weighting equation, a flexible method is provided by using the weighting factor and the exponential term, which is more suitable for consolidation (the time-average equation is more suitable) or suspension conditions (Wood’s equation is more suitable). The blue dots in Figure 3 are the actual data of a well in the study area. By changing the size of N, different data in different depth sections can be fitted.
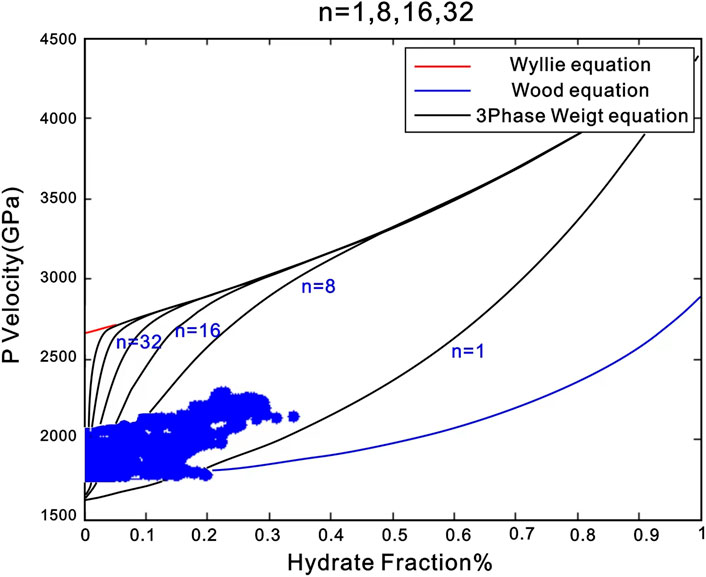
FIGURE 2. Relation between the velocity obtained from the three-phase weight equation and hydrate saturation.
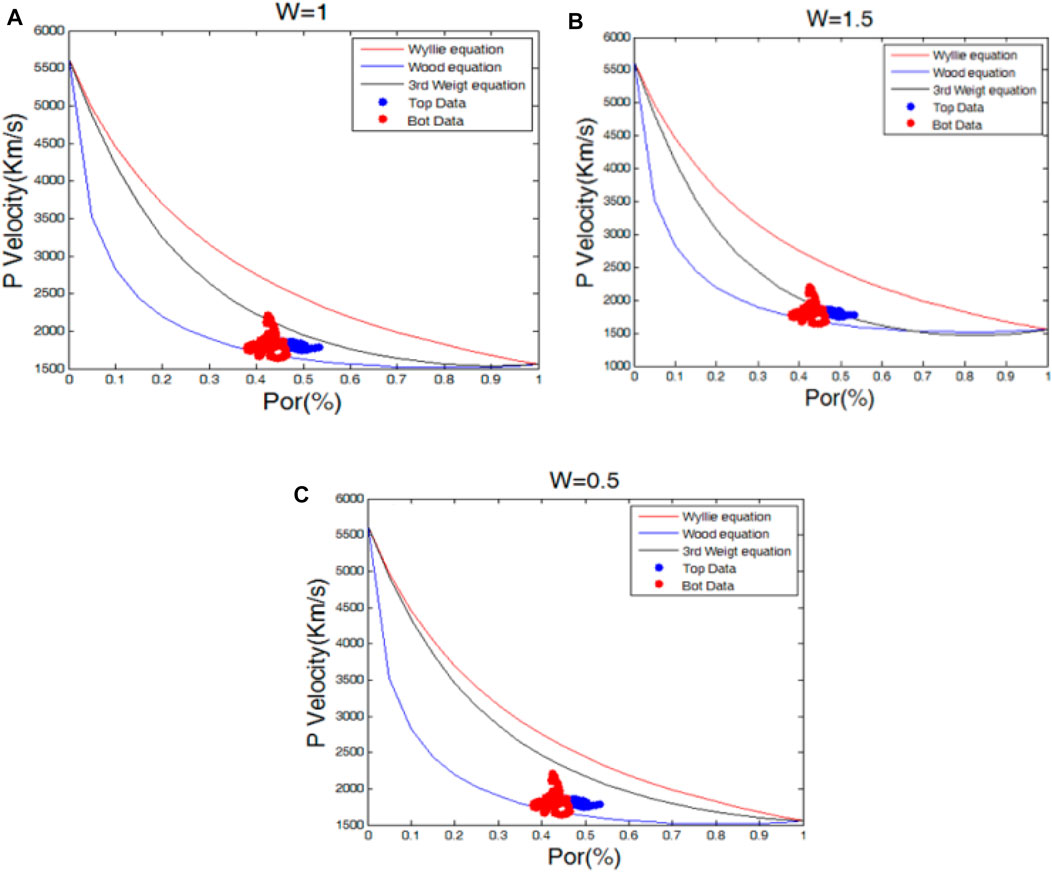
FIGURE 3. Selection of formation consolidation factor W for three-phase weighting equation.
The consolidation factor W, which controls the degree of consolidation, is determined by using the formation data without hydrate and fitting with the forward curve. By comparing the data from Well A, it can be seen that the fitting effect is best when W = 1.5.
Finally, using the W and N obtained by analysis, the P-wave velocity in the study area can be forward modeled, as shown in Figure 4. Among them, the blue curve is the measured curve, and the red curve is the forecast curve. The overall trend is generally consistent, but the prediction error of the free gas layer is large, so further stratified modeling may be needed.

FIGURE 4. P-wave velocity prediction results of well A.
2.2 Equivalent Medium Model (Five Classical Hydrate Models)
As shown above, the most popular hydrate rock physical models are based on the six models proposed by Zhang (2012) (Figure 5). The six models refer to the contact cementation model, particle-enfolded model, skeleton particle support model, pore filling model, nodules fracture filling model, and fracture filling model respectively. In the contact cementation model, rock grains are regarded as freely accumulated spheres, and the hydrates bond the spheres together in contact. In the model of particle-enfolded, the rock particles are regarded as freely accumulated spheres, and the hydrate grows around the particles, acting as cement. In the skeleton particle support model, the hydrate is regarded as the bearing particles on the framework. In the pore filling model, hydrates are treated as particles or fluids to fill pores. In the nodular fissure filling mode, hydrate is deposited or filled in the fissure as nodules, which belongs to uneven distribution. The doping mode is to treat the hydrate as evenly distributed in the rock matrix, similar to the ice layer of the tundra. The filling mode of nodule fracture is to deposit hydrate as a nodule or fill it in the fracture, which belongs to a kind of heterogeneous distribution. However, the fracture filling model is not common in this work area, so the follow-up content has not carried out research on this model.
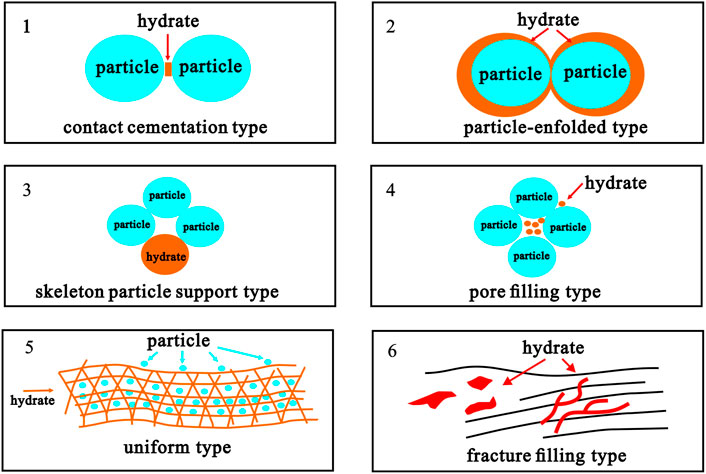
FIGURE 5. Enrichment diagram of five classical hydrate models.
According to the analysis of mineral composition and porosity data of several Wells in the study area, the mineral composition in the study area is relatively single, mainly concentrated in clay (illite), quartz, and calcite. As shown in the multi-well histogram analysis (Figure 6), the porosity ranges from 30% to 55%, illite from 10% to 45%, quartz from 10% to 40%, and calcite from 0% to 15%.
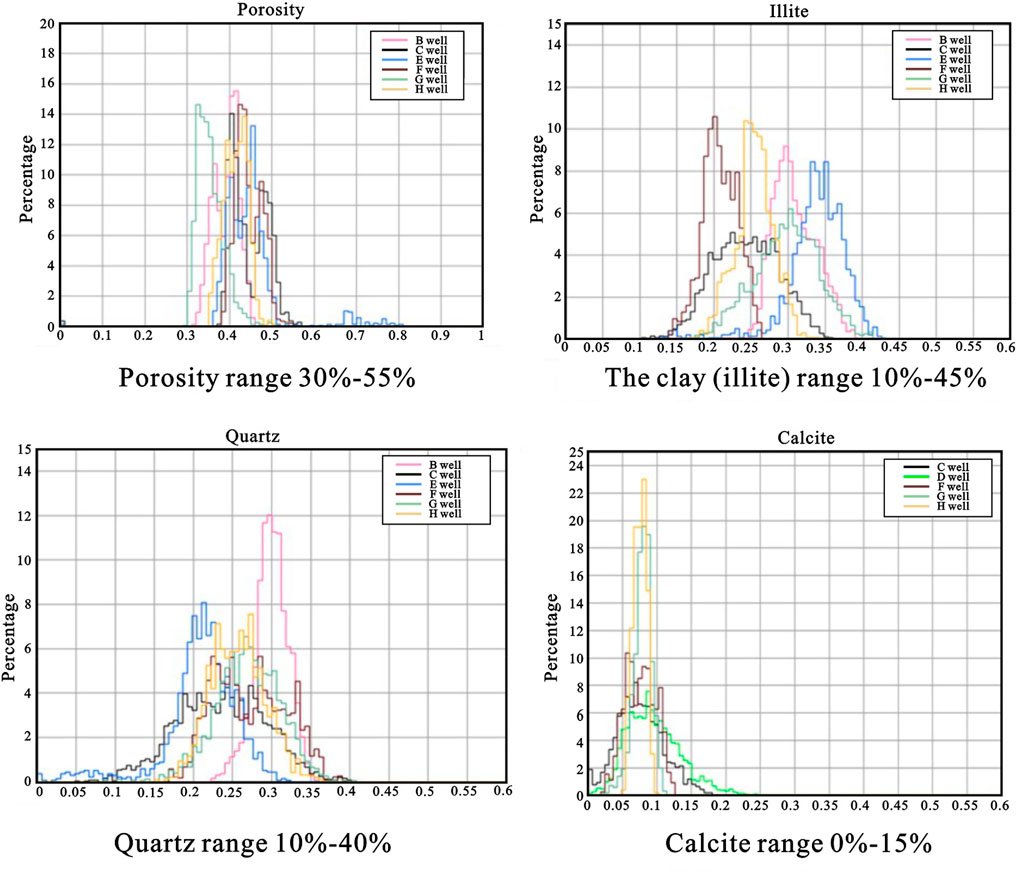
FIGURE 6. Histogram of mineral composition and porosity distribution of multiple Wells in the study area.
Based on the mineral analysis results, we constructed measurement plates of five classical rock physical models and compared them with the actual data (Figure 7).
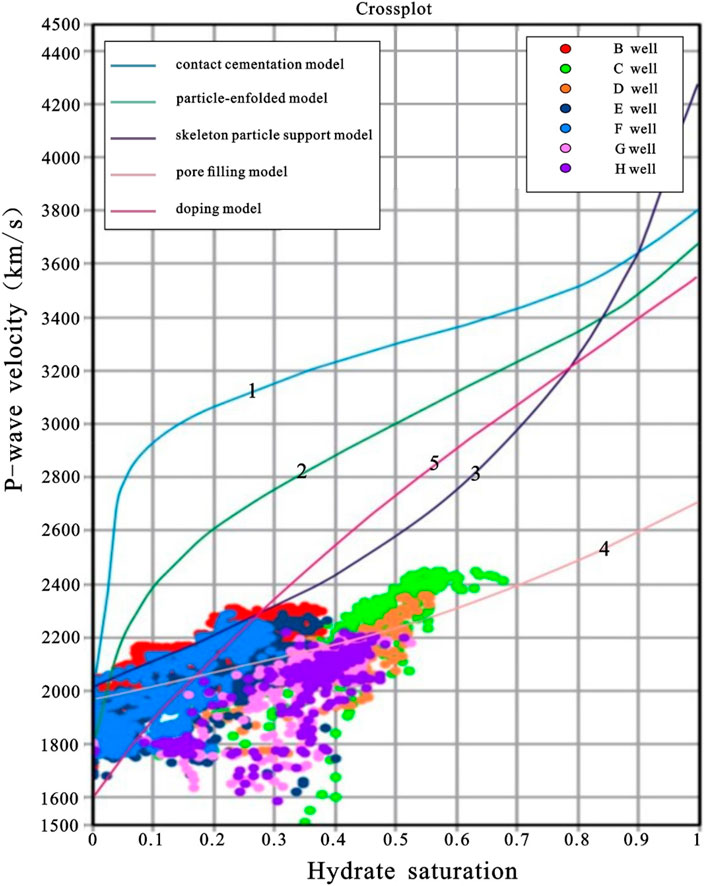
FIGURE 7. Rock physics template for five classic hydrate models.
According to the rock physics template analysis, the hydrate enrichment form in this study area is the most consistent with the trend of the third type (skeleton particle support type) and the fourth type (pore filling type), which confirms the hydrate enrichment form in this area from the side. However, the measured values of longitudinal and S-wave velocity in the study area are slightly lower than the template curve, which may be caused by the incorrect elastic parameters of mineral components.
3 Two-Phase Modeling Technology and Segmented Modeling Method
3.1 Petrophysical Modeling of Dual-Phase Hydrate
According to the previous study, most of the existing petrophysical models can be divided into two categories: one category regards hydrate as pore fluid, and the other category regards hydrate as skeleton mineral. Neither of the two models can well simulate the hydrate enrichment in the study area.
Through inductive analysis, we think that the two kinds of modeling ideas have some disadvantages. When hydrate is completely used as pore fluid, the modeling process uses Gassmann’s theory for fluid replacement, which results in the S-wave velocity of such models not changing with the hydrate content (as shown in Model 4). However, through statistical analysis, the shear modulus of hydrate is 2.57 MPa. It is precise because the shear modulus of hydrate is non-zero that its content must affect the S-wave velocity of the mixture. For the other types of models (for example, Model 3 and Model 5), which treat hydrate as skeleton minerals, the relationship between hydrate and pore fluid is ignored, resulting in an equal proportion of S-wave velocity with the increase of hydrate content. According to the template analysis, the correlation between hydrate saturation and velocity in this study area is between the above two categories. The S-wave velocity increases with the increase of hydrate content, but the increase rate is lower than that of the template of Model three and Model 4. Therefore, the existing hydrate models cannot meet the needs of hydrate modeling in this study area, and how to choose an appropriate equivalent medium theory to simulate hydrate is the core and key of modeling in this study area.
As shown in Figure 8, the two-phase modeling idea constructed in this study is between the existing pore-filled model and the skeleton supported model, which means that part of hydrate exists in the skeleton form, while the other part is enriched in the form of pore fluid. Based on the above ideas, the two-phase rock physical model we constructed is shown in Figure 9. As shown in the virtual frame in the figure, we divided the hydrate into two parts: the skeleton that plays a supporting role and the fluid in the pore. The hydrate, which acts as the skeleton, is combined with calcite, quartz, and illite to form the skeleton of the model, and they are fused by VRH averaging theory to obtain the dry rock skeleton. The hydrates enriched in the pores, together with water and gas, are added to the dry rock skeleton as pore fluid. Based on the above analysis, since the shear modulus of hydrate is non-zero, we use the BK solid substitution theory to simulate hydrate in pores. BK theory has been widely used in the simulation of rock physical model of unconventional shale in recent years, which is used to simulate the kerogen with non-zero shear modulus. In this study, we apply this idea to hydrate simulation. Gas and water are replaced by conventional Gassmann’s theory, and the equivalent hydrate mixture is finally obtained.
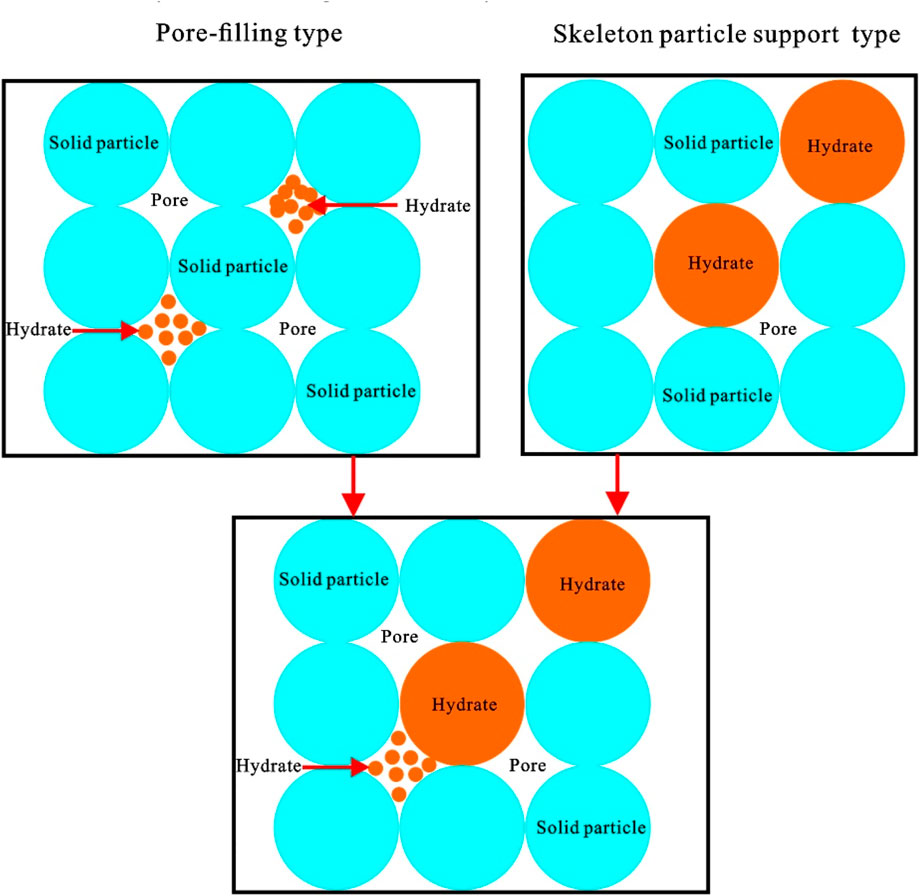
FIGURE 8. Two-phase hydrate modeling diagram.
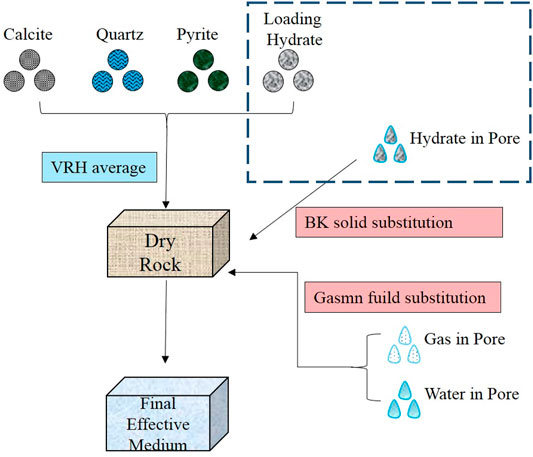
FIGURE 9. Flow chart of two-phase hydrate modeling.
Based on the rock physical model of the two-phase hydrate constructed above, we carried out S-wave velocity prediction on Well E in the study area to test the feasibility of the model. The results are shown in Figure 10. The curve in the figure on the left is the S-wave velocity, the curve on the right is the P-wave velocity, the red curve represents the measured curve, and the blue curve represents the predicted curve. The error between the predicted velocity curve and the measured velocity curve is small, which proves that the rock physical model of double phase hydrate is available.
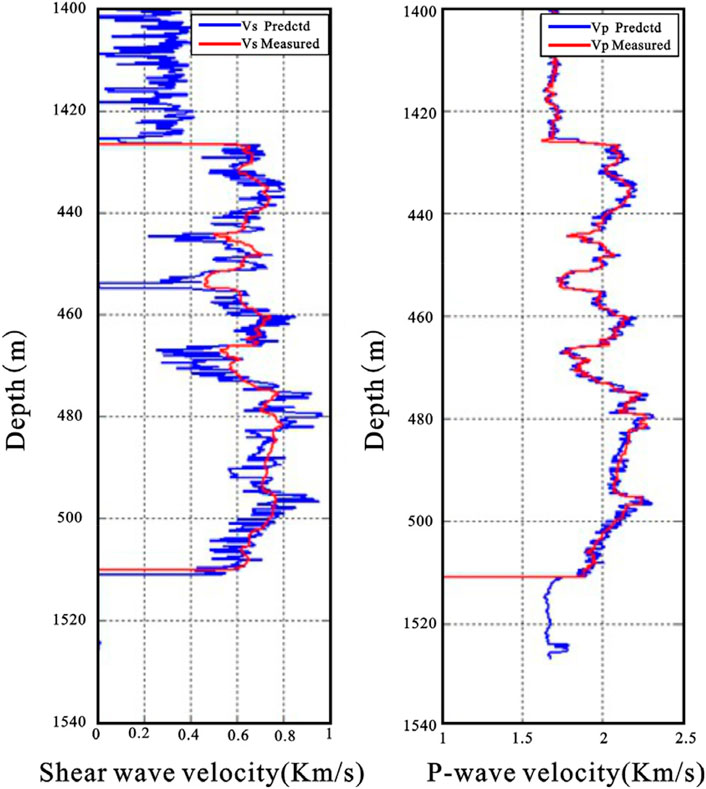
FIGURE 10. Prediction results of S-wave velocity based on dual phase hydrate model.
The main petrophysical model formulas used in this model are as follows:
3.1.1 Voigt–Reuss–Hill Boundary
Voigt–Reuss–Hill boundary is composed of Voigt upper bound, Reuss lower bound, and hill average. Voigt boundary is the upper limit of the VRH boundary, also known as equal strain average. Its results describe the average stress-strain relationship when each phase of the mixture is assumed to have equal strain. The specific formula is as follows:
In the formula,
Reuss average is the lower bound of the VRH average, also known as the equal stress average, which assumes that each phase has the same stress. The specific formula is as follows:
The meaning of each parameter in the formula is the same as that of the Voigt formula.
Hill pointed out that the arithmetic weighting of Voigt and Reuss can be used to predict the equivalent modulus of rock. The specific formula is as follows:
It can be seen that the Voigt upper limit is the arithmetic weight of the elastic parameters of each phase, and the Reuss average is the arithmetic average of the reciprocal of the elastic parameters of each phase. Hill average is to average the equivalent results of the two. This averaging is based on the assumption of stress averaging or strain averaging. Therefore, when applying Voigt–Reuss–Hill upper and lower limits, it is necessary to assume that each component of the mixture is identical and the rock is linear and elastic.
3.1.2 Gassmann Equation
Gassmann's theory describes the propagation of seismic waves in porous media with saturated fluid, which belongs to the low-frequency model. The equation constructs the relationship between seismic wave velocity, pore fluid, and mineral skeleton. Gassmann formula is widely used to calculate the change of elastic modulus caused by the change of fluid in pores (i.e. fluid substitution).
The relationship between the elastic modulus of rock skeleton and the elastic modulus between porosity and matrix is as follows:
In the formula,
In the formula,
In the formula,
which is the basic form of the Gassmann equation. Based on the basic equation, Xu and White (1995) changed the abovementioned formula to
Gassmann equation assumes that the change of pore fluid does not affect the equivalent shear modulus of rock
Using the abovementioned formula, the equivalent elastic modulus of saturated fluid rock can be calculated, and when combined with the density equation, the P-wave velocity and the S-wave velocity of rock can be obtained.
The assumptions that Gassmann's theory needs to meet are as follows:
1) The rock skeleton is homogeneous and isotropic
2) All pores in the rock are interconnected, and there is no chemical reaction between pore fluid and skeleton; that is, fluid and skeleton are two independent systems
3) The model needs to meet the low-frequency assumption; that is, the pore fluid (without viscosity) can flow fully at the half wavelength of seismic wave, and the pore pressure is always in equilibrium
4) The fluid is completely saturated
3.1.3 Brown–Korringa Replacement Model
Gassmann's equation is based on an isotropic assumption, which can not meet the needs of anisotropic shale petrophysical modeling. Brown and Korringa derived the Gassmann equation in anisotropic form. The Brown–Korringa formula can be used to describe the theoretical relationship of the equivalent modulus of an anisotropic rock skeleton when it is saturated with fluid. The specific formula is as follows:
where
Based on the constructed model, we have carried out shear wave velocity prediction for well E in the work area, as shown in Figure 10. The left side is the shear wave velocity, the right side is the longitudinal wave velocity, the red curve is the measured curve, and the blue curve is the predicted curve. The error between the predicted results and the measured results is small, which proves the feasibility of the model.
3.2 Segmented Modeling Method
Then we applied the previously proposed two-phase hydrate petrophysical model to other Wells in the study area, as shown in Figure 11. The predicted S-wave velocities are shown in the figure on the left, with the red curve representing the measured S-wave velocities and the blue curve representing the predicted S-wave velocities. The results show that the fitting effect of the model is good when the target well contains only a hydrate layer. However, when the target well contains not only the hydrate layer but also the free gas layer, the fitting effect of the model is still good for the hydrate layer, but poor for the free gas layer.
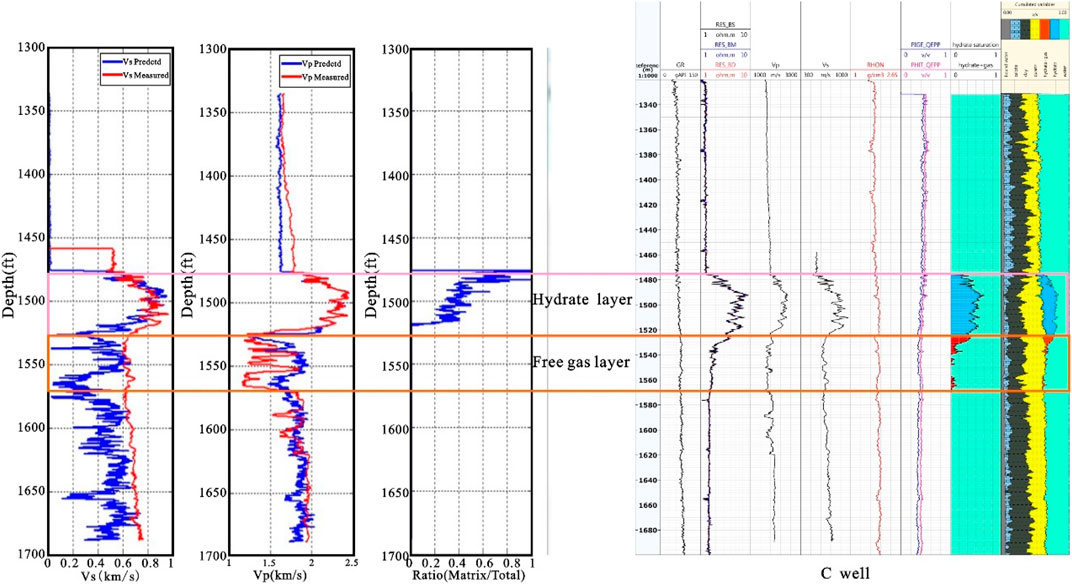
FIGURE 11. S-wave velocity prediction results of well C based on dual phase hydrate petrophysical model.
According to the analysis, the petrophysical model of double phase hydrate mainly focuses on the modeling of hydrate and does not consider the enrichment form of free gas too much. As shown in Figure 12, the longitudinal and S-wave velocity relationship between the hydrate layer and free gas layer was calculated. Red represents the hydrate layer and blue represents the free gas layer. As can be seen from the figure, the S-wave velocities at different depths in the hydrate layer are different, while the S-wave velocities at different depths in the free gas layer have almost no difference. It is verified from the side that hydrate saturation has a direct effect on the S-wave velocity due to its non-zero shear modulus, while free gas saturation has little effect on the S-wave velocity. Therefore, for the free gas layer, we need to build a targeted rock physical model of the free gas layer to improve the prediction accuracy of S-wave velocity.
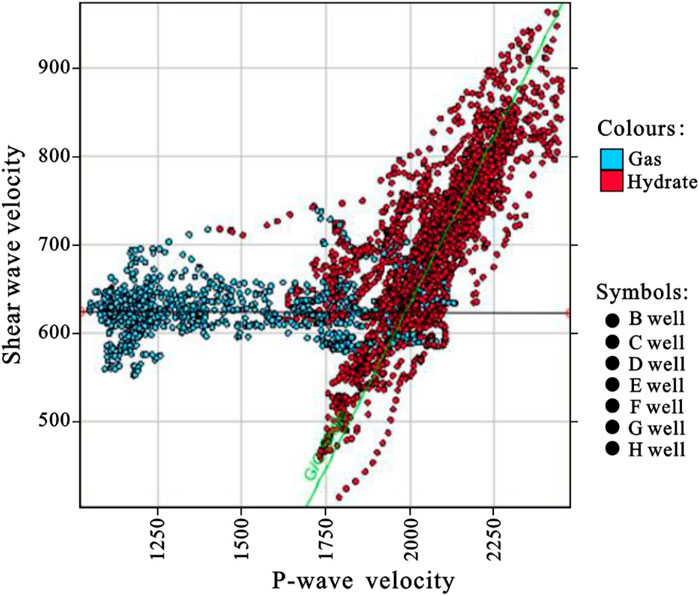
FIGURE 12. Relationship of longitudinal and S-wave velocity between hydrate layer and free gas layer.
Since the physical properties of the free gas layer and hydrate layer are quite different, it is difficult to simulate the characteristics of both by using the same petrophysical model. Therefore, we construct the idea of a segmented modeling method of hydrate + free gas. For the hydrate layer, we also use the rock physical model of double phase hydrate proposed above, while for the free gas layer, we build a new modeling idea. Since the free gas layer does not contain hydrate, we do not need to consider hydrate simulation. The specific idea is as follows: first, the main skeleton minerals such as calcite, quartz, and illite were fused with the VRH average theory to obtain a solid mixture. Then, the empty pores are added to the solid mixture background based on DEM theory. Finally, the Gassmann fluid substitution theory is used to add water and free gas to the dry rock skeleton to obtain the final equivalent medium Figure 13.
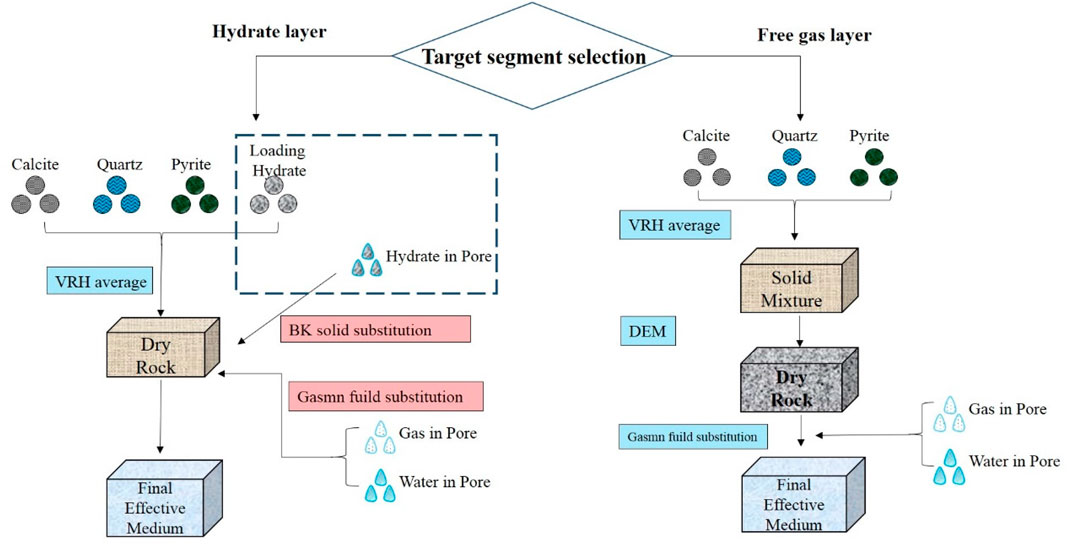
FIGURE 13. Segmental petrophysical modeling process of hydrate and free gas layers.
Based on the idea of piecewise modeling, we used different petrophysical models to predict the S-wave velocity for hydrate and free gas respectively, and then combined the prediction results of different intervals. The prediction results are shown in Figure 14. In the figure, the predicted S-wave curve based on the rock physical model of two-phase hydrate is shown on the left side, and the predicted S-wave curve based on the modeling method for free gas is shown in the middle. The red represents the measured curve, and the blue represents the predicted curve. It can be found that the prediction result of the free gas layer S-wave has been significantly improved by using the segmented modeling method, and the predicted curve is basically consistent with the measured curve.
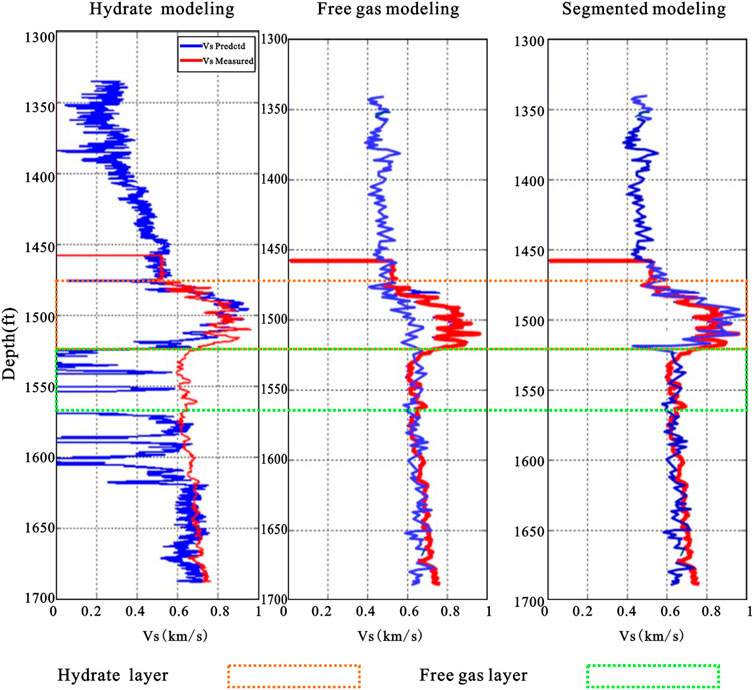
FIGURE 14. S-wave velocity prediction results based on segmented modeling idea.
4 Optimization of Calibrating Downhole Seismic Based on Modeling
Through analysis, it is found that the P-wave velocity of some Wells in the study area is discontinuous. In order to solve this problem, conventional commercial software is used to complete the missing velocity value through the interpolation method, but the prediction accuracy of velocity value based on the interpolation method cannot be guaranteed. Therefore, we tried to use the constructed rock physical model to improve the accuracy of velocity prediction and finally improve the effect of calibrating downhole seismic.
As shown in Figure 15, the logging curve in the left figure shows the absence of P-wave velocity at the boundary between the hydrate and free gas layers. The missing velocity is simply interpolated by commercial software, and the forward trace is calculated based on the interpolation velocity. However, there are some differences between the forward trace and seismic data, which may be caused by inaccurate velocity prediction. On the right of Figure 16 are the P-wave velocities calculated based on the model proposed in this study. Blue represents the predicted velocity and red represents the measured velocity. The synthetic records are obtained by using the velocities calculated by the rock physical model. It can be seen from the figure that in the P-wave velocity missing section, the forward modeling record has been significantly improved, and the reflection interface between the hydrate layer and the free gas layer has been clearly displayed. On the whole, the S-wave velocity prediction based on the rock physical model can improve the incomplete forward logging profile caused by the lack of velocity curve to some extent, and finally improve the precision of calibrating downhole seismic.

FIGURE 15. Diagram of calibrating downhole seismic in Well H (before optimization).
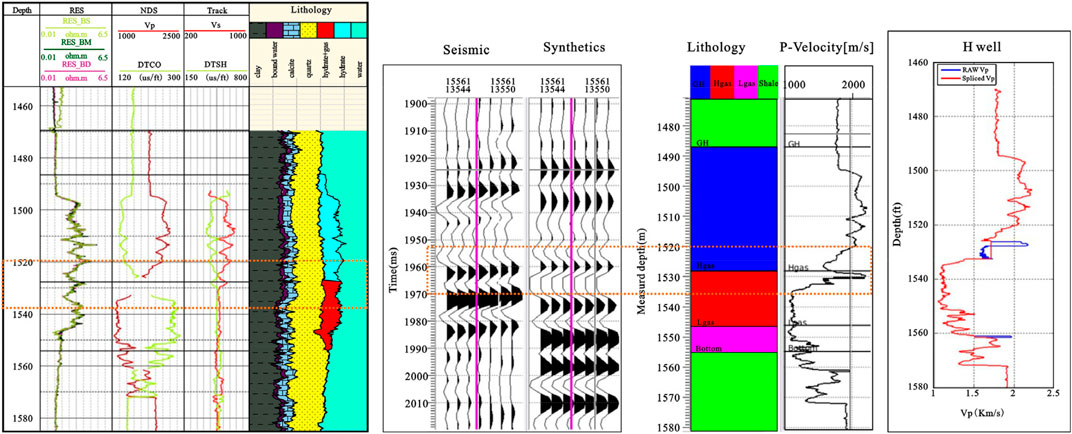
FIGURE 16. Diagram of calibrating downhole seismic in Well H (after optimization).
5 Conclusion
Through the application of actual data, two conclusions can be drawn:
1) The two-phase modeling technology based on BK solid substitution theory and Gassmann fluid substitution theory can take into account both the existing forms of hydrate as rock skeleton particle and pore-filling material. The equivalent medium model obtained by this technology can be used to fit more accurate longitudinal and S-wave velocities.
2) The physical properties of the gas hydrate layer and its associated free gas layer are very different, so the same modeling idea cannot be used. The segmenting modeling method can fully consider the physical properties of the two layers, which can greatly improve the effect of forward synthesis record calibration.
Data Availability Statement
The original contributions presented in the study are included in the article/Supplementary Materials; further inquiries can be directed to the corresponding author.
Author Contributions
FL: Investigation, Formal analysis, Writing—original draft. JL:Review and editing. HL: Supervision. LH: Geophysical interpretation. XW: Investigation and seismic analysis. TL: Logging analysis. FW: Figure drawing.
Funding
This study was funded by the Key Special Project for Introduced Talents Team of Southern Marine Science and Engineering Guangdong Laboratory (Guangzhou) (No. GML2019ZD0102), the Guangdong Province Marine Economic Development (Six Major Marine Industries) Special Fund Project (No. (2021) No. 58), the China National Hydrate Project(DD20190224), and the Open Fund Project of Hubei Key Laboratory of Marine Geological Resources (MGR202002).
Conflict of Interest
The authors declare that the research was conducted in the absence of any commercial or financial relationships that could be construed as a potential conflict of interest.
Publisher’s Note
All claims expressed in this article are solely those of the authors and do not necessarily represent those of their affiliated organizations, or those of the publisher, the editors, and the reviewers. Any product that may be evaluated in this article, or claim that may be made by its manufacturer, is not guaranteed or endorsed by the publisher.
Acknowledgments
The authors are grateful for the linguistic assistance from LetPub (www.letpub.com) during the preparation of this manuscript. In addition, they appreciate the valuable comments and suggestions from Editor Jinan Guan, other editors, and reviewers.
References
Betlem, P., Roy, S., Birchall, T., Hodson, A., Noormets, R., Römer, M., et al. (2021). Modelling of the Gas Hydrate Potential in Svalbard’s Fjords. J. Nat. Gas Sci. Eng. 94, 104127. doi:10.1016/j.jngse.2021.104127
Boswell, R., Frye, M., Shelander, D., Shedd, W., McConnell, D. R., and Cook, A., and (2012). Architecture of Gas-Hydrate-Bearing Sands from Walker Ridge 313, Green Canyon 955, and Alaminos Canyon 21: Northern Deepwater Gulf of Mexico. Mar. Petroleum Geol. Petrol Geol. 34 (1), 134–149. doi:10.1016/j.marpetgeo.2011.08.010
Buffett, B. A., and Zatsepina, O. Y. (2000). Formation of Gas Hydrate from Dissolved Gas in Natural Porous Media. Mar. Geol. 164 (1-2), 69–77. doi:10.1016/s0025-3227(99)00127-9
Carcione, J. M., and Tinivella, U. (2000). Bottom‐simulating Reflectors: Seismic Velocities and AVO Effects. Geophysics 65 (1), 54–67. doi:10.1190/1.1444725
Dai, J., Snyder, F., Gillespie, D., Koesoemadinata, A., and Dutta, N. (2008). Exploration for Gas Hydrates in the Deepwater, Northern Gulf of Mexico: Part I A Seismic Approach Based on Geologic Model, Inversion, and Rock Physics Principles. Mar. Petroleum Geol. 25 (9), 830–844. doi:10.1016/j.marpetgeo.2008.02.006
Dong, H., Sun, J., Arif, M., Golsanami, N., Yan, W., and Zhang, Y. (2020). A Novel Hybrid Method for Gas Hydrate Filling Modes Identification via Digital Rock. Mar. Petroleum Geol. 115, 104255. doi:10.1016/j.marpetgeo.2020.104255
Gao, H. Y., Zhong, G. F., Liang, J. Q., and Guo, Y. Q. (2012). Estimation of Gas Hydrate Saturation with Modified Biot-Gassmann Theory: a Case from Northern South China Sea. Mar. Geol. Quat. Geol. 32 (4), 83-89. doi:10.3724/sp.j.1140.2012.04083
Huang, J.-W., Bellefleur, G., and Milkereit, B. (2012). Application of Conditional Simulation of Heterogeneous Rock Properties to Seismic Scattering and Attenuation Analysis in Gas Hydrate Reservoirs. J. Appl. Geophys. 77, 83–96. doi:10.1016/j.jappgeo.2011.12.002
Lee, M. W.(2008). Models for Gas Hydrate-Bearing Sediments Inferred from Hydraulic Permeability and Elastic Velocities. U. S. Geophysical Survey Scientific Investigations. Report 2008-5219.
Lee, M. W. (2002). Modified Biot-Gassmann Theory for Calculating Elastic Velocities for Unconsolidated and Consolidated Sediments. Mar. Geophys. Res. 23 (5-6), 403–412. doi:10.1023/b:mari.0000018195.75858.12
Lee, M. W., Hutchinson, D. R., Collett, T. S., and Dillon, W. P. (1996). Seismic Velocities for Hydrate-Bearing Sediments Using Weighted Equation. J. Geophys. Res. 101 (9), 20347–20358. doi:10.1029/96jb01886
Li, J.-f., Ye, J. L., Ye, J.-l., Qin, X.-w., Qiu, H.-j., Wu, N.-y., et al. (2018). The First Offshore Natural Gas Hydrate Production Test in South China Sea. China Geol. 1 (1), 5–16. doi:10.31035/cg2018003
Liu, X. Q., Liu, H. S., Xing, L., Qin, Z. L., Ma, B. J., and Wang, M. (2020). Sensitivity Analysis of Petrophysical Parameters for Estimating Hydrate Saturation in the Shenhu Area. Appl. Geophys. 17 (5), 649–659. doi:10.1007/s11770-018-0718-1
Nobes, D. C., Villinger, H., Davis, E. E., and Law, L. K. (1986). Estimation of Marine Sediment Bulk Physical Properties at Depth from Seafloor Geophysical Measurements. J. Geophys. Res. 91 (B14), 14033–14043. doi:10.1029/jb091ib14p14033
Pan, H. J., Liu, T. Y., Wu, L., Wang, H. T., and Xue, M. M. (2014). Morphology Identification and Saturation Estimation of Gas Hydrate. Prog. Geophys. 29 (4), 1735–1740. doi:10.6038/pg20150666
Pan, H., Li, H. B., Li, H., Zhang, Y., Chen, J., Cai, S., et al. (2019). Joint Interpretation of Elastic and Electrical Data for Petrophysical Properties of Gas-Hydrate-Bearing Sediments Using Inverse Rock Physics Modeling Method. Petro S Journ. 60 (6), 854–871. doi:10.30632/pjv60n6-2019a9
Paull, C. K., and Matsumoto, R.(2000). Leg 164 Overview[C], Proceedings of the Ocean Drilling Program:Scientific Resultsollege Station, Ocean Drilling Program, TX, 164
Pearson, C. F., Halleck, P. M., Mcguire, P. L., Hermes, R., and Mathews, M. (1983). Natural Gas Hydrate Deposits: a Review of In Situ Properties. J. Phys. Chem. 87 (21), 4180–4185. doi:10.1021/j100244a041
Sha, Z. B., Xu, Z. Q., Fu, S. Y., Liang, J. Q., Zhang, W., Su, P. B., et al. (2019). Gas Sources and its Implications for Hydrate Accumulation in the Eastern Pearl River Mouth Basin. Mar. Geol. Quat. Geol. 39 (4), 116–125. doi:10.16562/j.cnki.0256-1492.2019010902
Su, P. B., Liang, J. Q., Zhang, W., Liu, F., Wang, F. F., Li, T. W., et al. (2020). Natural Gas Hydrate Accumulation System in the Shenhu Sea Area of the Northern South China Sea. Nat. Gas. Ind. 40 (8), 77–89. doi:10.3787/j.issn.1000-0976.2020.08.006
Wang, X., Collett, T. S., Lee, M. W., Yang, S., Guo, Y., and Wu, S. (2014). Geological Controls on the Occurrence of Gas Hydrate from Core, Downhole Log, and Seismic Data in the Shenhu Area, South China Sea. Mar. Geol. 357, 272–292. doi:10.1016/j.margeo.2014.09.040
Wood, W., and Stoffa Pand Shipley, T. (1994). Quantitative Detection of Methane Hydrate through High-Resolution Seismic Velocity Analysis. J. Geophys. Res. 99 (5), 9681–9695. doi:10.1029/94jb00238
Wood, W. T., and Ruppel, C.(2000). Seismic and Thermal Investigations of the Blake Ridge Gas Hydrate Area:a Synthesis[C], Proceedings of the Ocean Drilling Program:Scientific Results College Station, Ocean Drilling Program, TX 164:253 - 264
Worthington, P.(2008). Petrophysical Evaluation of Gas Hydrate Formations. International Petroleum Technology Conference, Kuala Lumpur, Malaysia, December 03 2008. doi:10.3997/2214-4609-pdb.148.iptc12610
Xu, S., and White, R. E. (1995). A New Velocity Model for Clay‐sand Mixtures 1. Geophys. Prospect. 43, 91–118. doi:10.1111/j.1365-2478.1995.tb00126.x
Yamamoto, K. (2014). Methane Hydrate Offshore Production Test in the Eastern Nankai Trough; A Milestone on the Path to Real Energy Resource. Proceedings of the 8th International Conference on Gas Hydrates ( ICGH 2014), Beijing, ICGH. T3–T153
Yang, C. Z., Luo, K. W., Liang, J. Q., Lin, Z. X., Zhang, B. D., Liu, F., et al. (2020). Control Effect of Shallow-Burial Deepwater Deposits on Natural Gas Hydrate Accumulation in the Shenhu Sea Area of the Northern South China Sea. Nat. Gas. Ind. 40 (8), 68–76.
Yang, S. X., Lei, Y., and Liang, J. Q. (2017a). Concentrated Gas Hydrate in the Shenhu Area, South China Sea: Results from Drilling Expeditions GMGS3 & GMGS4[C], Proceedings of 9th International Conference on Gas Hydrates, Denver, Colorado, USA, June 25 – 30, 2017
Yang, S. X., Liang, J. Q., Liu, C. L., and Sha, Z. B. (2017b). Progresses of Gas Hydrate Resources Exploration in Sea Area. Geol. Surv. China. 4 (2), 1–8. doi:10.19388/j.zgdzdc.2017.02.01
Yang, S. X., Zhang, M., and Liang, J. Q. (2015). Preliminary Results of China’s Third Gas Hydrate Drilling Expedition: A Critical Step from Discovery to Development in the South China Sea. Fire Ice. 15 (2), 1–21.
Yang, W. Q., Zong, Z. Y., Jiang, M., and Liu, X. X. (2021). Rock Physics Modeling Method of Natural Gas Hydrate Based on Equivalent Medium Theory. Oil Geophys. Prospect. 56 (3), 528–535. doi:10.13810/j.cnki.issn.1000-7210.2021.03.011
Zhang, H. Q., Yang, S. X., and Wu, N. Y. (2007). Successful and Surprising Results for China’s First Gas Hydrate Drilling Expedition. Fire in the Ice. Methane hydrate Newsl. Natl. Energy Technol. Laboratory, U. S. Dep. Energy., 6–9.
Zhang, W. D., Wang, R. H., Ren, S. R., Ma, Q. T., and Li, Y. (2011). A Study on Physical Models of Gas Hydrate Reservoirs. ACTA Pet. Sin. 5, 866–871.
Zhang, W., Liang, J. Q., He, J. X., Cong, X. R., Su, P. B., Lin, L., et al. (2018). Differences in Natural Gas Hydrate Migration and Accumulation between GMGS1 and GMGS3 Drilling Areas in the Shenhu Area, Northern South China Sea. Nat. Gas. Ind. 38 (3), 138–149. doi:10.3787/j.issn.1000-0976.2018.03.017
Zhang, W., Liang, J. Q., Lu, J. A., Wei, J. G., Su, P. B., Fang, Y. X., et al. (2017). Accumulation Features and Mechanisms of High Saturation Natural Gas Hydrate in Shenhu Area, Northern South China Sea. Petroleum Explor. Dev. 44 (5), 670–680. doi:10.1016/s1876-3804(17)30082-4
Zhang, W., Liang, J. Q., Lu, J. A., Meng, M. M., He, Y. L., Deng, W., et al. (2020a). Characteristics and Controlling Mechanism of Typical Leakage Gas Hydrate Reservoir Forming System in the Qiongdongnan Basin, Northern South China Sea. Nat. Gas. Ind. 40 (8), 90–99. doi:10.3787/j.issn.1000-0976.2020.08.007
Zhang, W., Liang, J., Wei, J., Lu, J. a., Su, P., Lin, L., et al. (2020b). Geological and Geophysical Features of and Controls on Occurrence and Accumulation of Gas Hydrates in the First Offshore Gas-Hydrate Production Test Region in the Shenhu Area, Northern South China Sea. Mar. Petroleum Geol. 114, 104191. doi:10.1016/j.marpetgeo.2019.104191
Zhang, Y. W., Liu, X. W., and Jin, Y. J. (2004). Study of Velocity and Attenuation for Gas-Bearing Hydrate Formation. Oil Geophys. Prospect. 39 (2), 205–214.
Keywords: gas hydrate, two-phase petrophysical modeling, segmented modeling method, Shenhu area, Gassmann fluid substitution
Citation: Liu F, Liang J, Lai H, Han L, Wang X, Li T and Wang F (2022) Two-Phase Modeling Technology and Subsection Modeling Method of Natural Gas Hydrate: A Case Study in the Shenhu Sea Area. Front. Earth Sci. 10:884375. doi: 10.3389/feart.2022.884375
Received: 26 February 2022; Accepted: 09 May 2022;
Published: 23 June 2022.
Edited by:
Jinan Guan, Guangzhou Institute of Energy Conversion (CAS), ChinaReviewed by:
Jiaxin Sun, China University of Geosciences Wuhan, ChinaBo Liu, Hebei University of Engineering, China
Haiteng Zhuo, Sun Yat-sen University, China
Copyright © 2022 Liu, Liang, Lai, Han, Wang, Li and Wang. This is an open-access article distributed under the terms of the Creative Commons Attribution License (CC BY). The use, distribution or reproduction in other forums is permitted, provided the original author(s) and the copyright owner(s) are credited and that the original publication in this journal is cited, in accordance with accepted academic practice. No use, distribution or reproduction is permitted which does not comply with these terms.
*Correspondence: Jinqiang Liang, bGppbnFpYW5nQHBldGFsbWFpbC5jb20=