 Senlin Yin
 Lei Zhao2*
95% of researchers rate our articles as excellent or good
Learn more about the work of our research integrity team to safeguard the quality of each article we publish.
Find out more
ORIGINAL RESEARCH article
Front. Earth Sci. , 12 April 2022
Sec. Structural Geology and Tectonics
Volume 10 - 2022 | https://doi.org/10.3389/feart.2022.882499
This article is part of the Research Topic Quantitative Characterization and Engineering Application of Pores and Fractures of Different Scales in Unconventional Reservoirs View all 24 articles
Aiming at the problem of insufficient data acquisition for steep carbonate outcrops, we used unmanned aerial vehicle oblique photogrammetry to quantitatively evaluate Jiantianba outcrops from a global perspective. This method can quickly and flexibly acquire, process and interpret outcrop data, establish the three-dimensional digital outcrop model and quantitative reservoir geological knowledge database. Through the fine analysis and comparative study of multiple outcrop sections, we use lithofacies combination, hierarchical interface, sequential indicator stochastic simulation and multiple-point geostatistical simulation methods to establish a three-dimensional multi-point statistical model of the outcrop area. The results show that the model of the Jiantianba carbonate outcrop has three-dimensional coordinates that correspond to oblique photograph image data, allowing for both the accurate location of any point and the measurement of the rock body, and thus providing a base for studying the stratigraphic architecture of the outcrop. Through fine-scale geological and statistical analyses of the geological parameters of three geologic sections, we established a database and model of a typical outcrop, including the types, continuity and scale of lithology, as well as different lithological combinations and the geological evolution of the region. And we established a geological model and quantitative geological database via sequential indicator simulation, using virtual well location, lithological combination, stratigraphic correlation, three-dimensional stratigraphic and lithological models of a typical outcrop. Subsequently, we analyzed the training images of different microfacies based on these models combined with the outcrop geometry. Finally, we established a three-dimensional geological model of reef–shoal facies that is more in line with our current understanding of the geology of the outcrop area by multi-point geostatistical simulations.
Reef–shoal deposits serve as important carbonate oil and gas reservoirs, and large-scale gas fields, such as Puguang, Longgang and Yuanba, have been discovered in Permian bioherm reservoirs in China (Ma et al., 2006, 2014; Fan et al., 1996, 1982). The petrological characteristics of reefs (Fan and Wu, 2002; Jody et al., 2004), their genesis, distribution and the characteristics of reef reservoir development (Wang et al., 1997; Robert, 2002; Abbey et al., 2013; Zhu et al., 2013; Ji et al., 2016; Xu et al., 2017) and the generative mechanism of reef gas reservoirs (Ma et al., 2005) has previously been explored via outcrop surveys (Hu et al., 2012; Qin et al., 2018; Li et al., 2019; Martin et al., 2005; Rong et al., 2009; Shen and Chen, 2001), reservoir predictions based on seismic data (Cai, 2011; Long et al., 2015; Wu et al., 2017), three-dimensional (3-D) geological modelling (Zhang et al., 2017; Zhou et al., 2018; Hao et al., 2019; Hu et al., 2002) and well logging (Yang et al., 2017; Wang et al., 2019). However, the use of traditional manual photography, stratigraphic scale measurements, sampling and two-dimensional (2-D) irregular sections to characterize outcrops are gradually being replaced by more accurate instruments (Guo, 2001; Hu et al., 2012). Gamma meters that characterise outcrop lithology and large-scale geological analyses via Google Earth (Shi et al., 2012; Zhang et al., 2017), as well as small-scale field outcrop structural characterisation based on 3-D laser scanning (Zhu et al., 2013; Fan et al., 2020) are now being employed.
In order to better understand the internal architecture of sand bodies, more advanced technologies, such as ground-penetrating radar, have been widely used (Woodward, et al., 2003; Yan et al., 2018; Yu et al., 2017; Zhang et al., 2015; Zhang et al., 2017). Constant technological updates have enabled researchers to obtain increasingly rich and accurate geological information. However, even as the data acquisition, transmission, processing and interpretation continue to develop rapidly, the methods remain limited. For example, 3-D laser scanning technology is an important method to study the internal architecture of sandy outcrops, but many carbonate outcrops located in large difference of elevation (>500 m), long profile (>1,000 m) and irregular profile surfaces. Additionally, trees and protruding rocks in some outcrop areas can block laser transmission, rendering the measurement from laser scanners inaccurate. In essence, laser scanning still only provides irregular, 2-D profile measurements. These indicate that outcrop characterization is not a complete 3-D digital outcrop.
Surveying field work from outcrops is the foundation of geological research, and the partitioning of outcrops has the advantages of directness and high precision. Compared with many clastic rock profiles, carbonate outcrops are commonly seen in high mountains and valleys with rugged terrain, making them more difficult to characterise. Meanwhile, 3-D geological modelling technologies have progressed greatly, evolving from deterministic to stochastic models and more recently, to multi-point geostatistical simulations (MPSs) (Wu and Li, 2005; Feng et al., 2019), which integrate multidisciplinary information and algorithms to build models approaching geological reality (Zhao et al., 2017). However, the amount of data information needed in this process has been a key factor in determining the accuracy of such models.
Even though the amount of data in field outcrop profiles is abundant, the lack of accurate profile locality information with which to quantitatively characterise 2-D, non-regularly associated outcrop sections make it difficult to fully utilise the data. The traditional method of outcrop characterisation is observation, description, 2-D representation and modelling of typical sections (Yin et al., 2013; Picke et al., 2015; Wang et al., 2001). For reef–flat outcrops, it is more difficult to convert profile information into planar and there has been no millimetre or centimetre-scale, 3-D geological model for reef flats available so far (Yin et al., 2011; Yang et al., 2017; Duan et al., 2019; Zhang et al., 2020; Qie et al., 2017).
Some researchers have tried to characterise and build genetic models of clastic reservoirs based on unmanned aerial vehicle (UAV) oblique photogrammetry (Yin et al., 2018a; 2018b, 2021); however, such characterisation of carbonate reef–shoal reservoirs have rarely been reported. Oblique photogrammetry has been proposed to develop georeferenced panoramic images and 3-D models using panoramic image projection algorithms. With the continued development of UAV capabilities, larger, higher and steeper slope sections have been captured than in previous terrestrial photogrammetric studies (Buckley et al., 2008; Jamie et al., 2019). Generally, there are three steps involved in dealing with oblique photogrammetry data, including obtaining a dense point cloud, generating 3-D reconstructions in real scenes and a digital surface model (DSM) (Remondino and Gerke, 2015; Svennevig et al., 2015; Carvajal-Ramírez et al., 2019). Owing to the advancement of spatial data acquisition (Buckley et al., 2008; Jamie, et al., 2019; Shan et al., 2021), oblique photogrammetric technologies have been applied in many studies of chalky sea cliffs, Hellenistic architecture, the identification of ruts and potholes and landslide processes, among other issues (Jamie, et al., 2019; Azri and Khairul, 2019; Mirko et al., 2019; Yahya et al., 2020).
In view of the shortcomings of more traditional for reef-flat outcrops, digital outcrop characterisation via oblique photogrammetry technology (OPT) was introduced in this study. Thus far, OPT has been used effectively in military (Bao and Wang, 2017), agricultural and forestry (Yang, et al., 2017), urban planning (Mi, et al., 2017) and other application (Bi et al., 2015; Wang, 2017). Here, we applied OPT to understand the stratigraphic architecture of an area of reef–shoal outcrops in China.
The field outcrop area is located in Lichuan Prefecture, Enshi City in western Hubei Province (Figures 1A,B). During the late Permian period, the Jiantianba area was located at the north-eastern margin of the Yangtze Block, with the Exi Rift to the east and the Guangwang–Liangping Trough to the west. The Changxing Formation is complete in this section and exhibits a thickness of ∼250 m. The sequence divisions in this area are closely related to the development of the reef body. The Changxing Formation here conformably contacts the underlying Longtan Formation and the overlying upper Triassic Feixianguan Formation (Figure 1C).
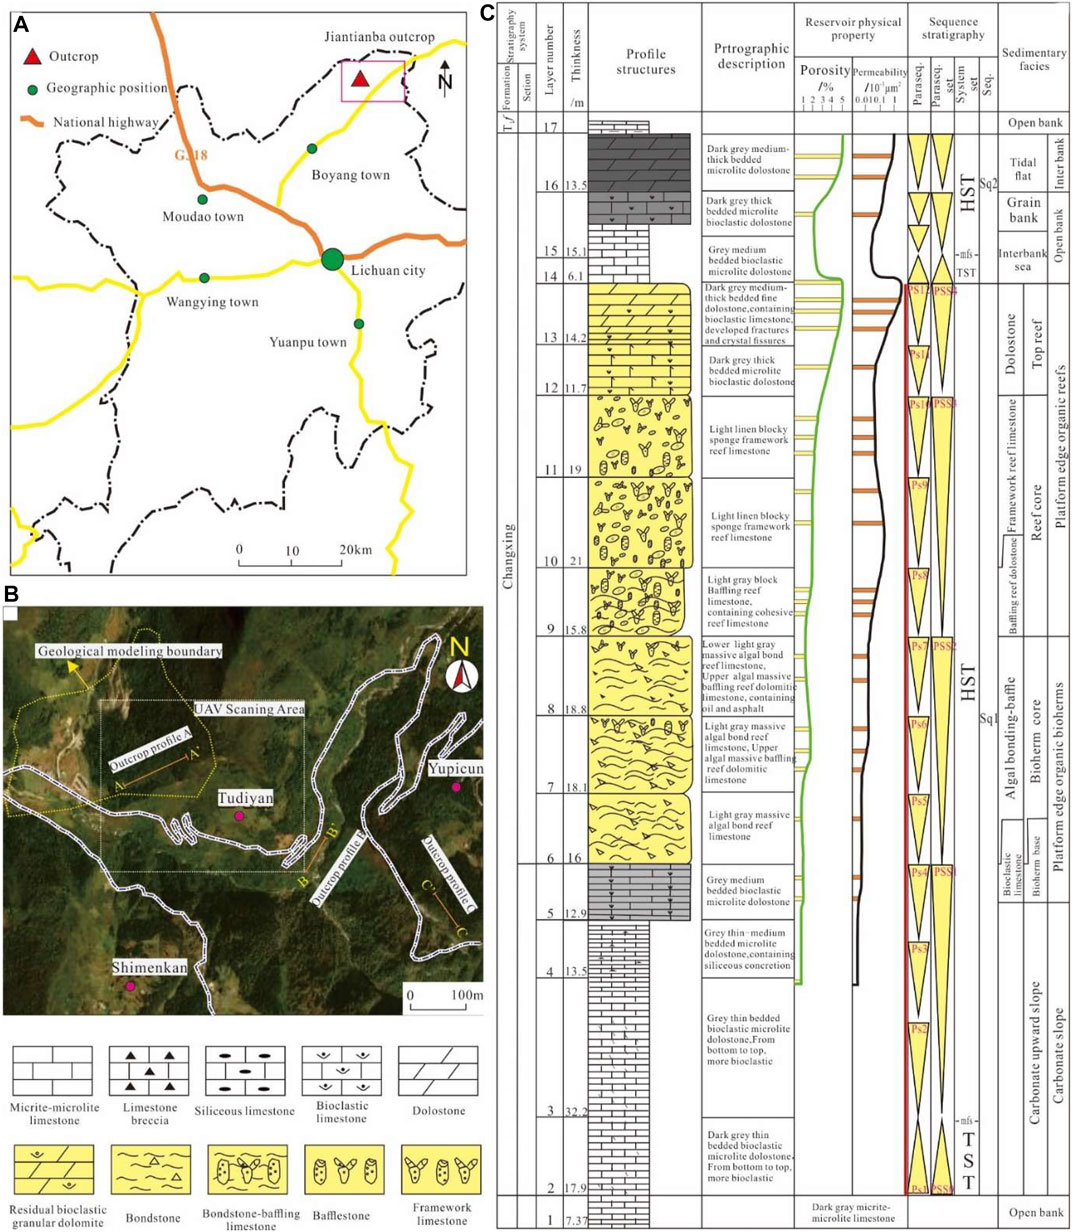
FIGURE 1. Location of study area and sedimentary facies-sequence stratigraphy of the Changxing Formation. (A) Location of study area; (B) detailed profile about outcrop; (C) sedimentary facies-sequence stratigraphy of the Changxing Formation reef bank section in Jiantanba, Lichuan (Modified after Hu M. Y., 2012).
The Changxing Formation is divided into two third-order sequences; the bottom surface of Sq1 lies between the upper Permian Longtan Formation and the Changxing Formation. Below this surface is the grey, thinly bedded micritic limestone of the Longtan Formation, while above is the dark grey, thinly bedded, bioclast-micritic limestone of the slope facies at the bottom of the Changxing Formation (Figure 1C). The bottom surface of Sq2 is located within the Changxing Formation. Below it lies a set of light grey, medium–thickly bedded, fine-grained dolomite and residual bioclastic grey dolomite. Above this surface is a grey, medium–thickly bedded micritic limestone and there are signs of local exposure dissolution near the surface (Figure 1C). The high stand systems tract (HSST) of Sq1 of the Changxing Formation in the study area is a complete set of reefs–shoal sediments, including five microfacies (reef base, reef core, reef beach, reef top beach and reef top tidal flat) (Figure 1C), which are the foci of this study.
This study is based on traditional field work and outcrop data collection via UAV OPT, processing and interpretation. Approximately 20 field sites were surveyed, among which typical outcrop sections of six key sites were surveyed manually, and ∼200 photos of the outcrops were taken. Additionally, the Jiantianba outcrop area was scanned using five UAV-mounted photo sensors (Figures 2A,B), with 1.5 km2 of 3-D outcrop data of the study area collected. The maximum elevation difference is nearly 300 m (Figure 2C). The collected data included 3-D point cloud data and a large amount of oblique photo data (∼5,000 images). Subsequently, the collected data were processed using Context Capture v. 2.0 (Bentley System, Inc., United States) and a 3-D digital model of a typical field outcrop with coordinates corresponding to the images was established.
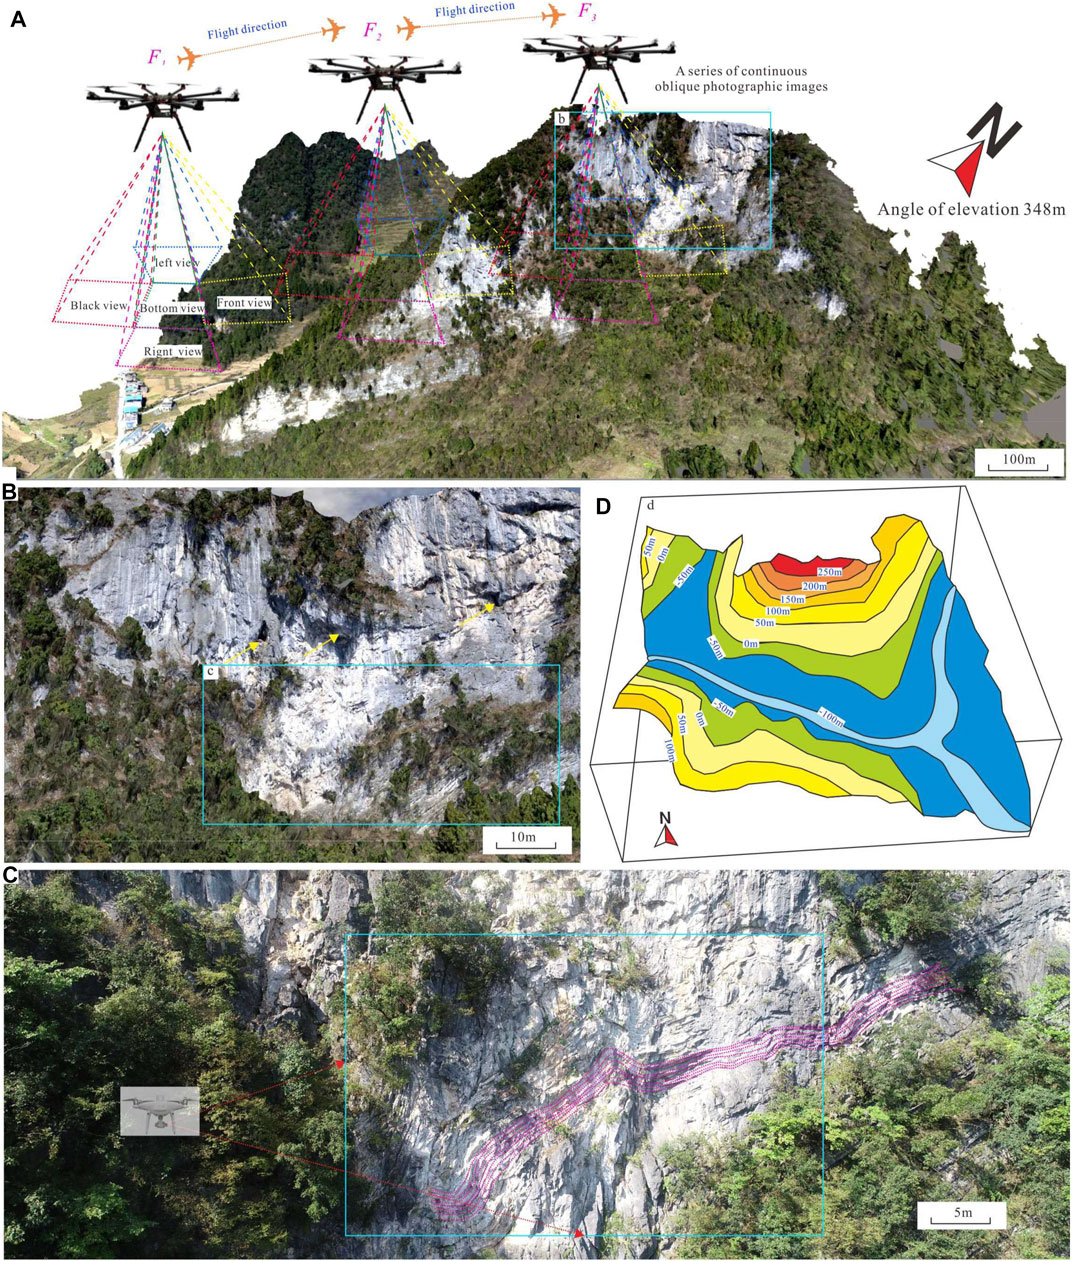
FIGURE 2. Technology of UAV oblique photographic and outcrop area elevation contour map. (A) A series of continuous oblique photographic images; (B) pictures obtained by UAV oblique photographic; (C) pictures obtained by UAV oblique photographic with deposition details; (D) elevation contour map obtained by UAV.
Making use of a global, systematic and continuous 3-D digital model of the outcrop, 17 virtual wells were established in the processed model of Jiantianba to analyze the geologic structure of the reef flat in combination with another two outcrop profiles of the study area (Figure 1B). A 3-D geological model of the outcrop area with data collected by UAV was then constructed. The main 3-D geological modelling process included skeletal mesh and grid model establishment, the random simulation of a lithological variogram and MPS. The model employed sequential indicator simulation (SIS) to explore the distribution of lithologies across the outcrop area before attempting to convert the profile data of the outcrop area into planar data. Based on the contour map of the lithological composition of the reef flat outcrop, a lithological plane constraint range was established, and different facies belts were used in different training images to perform MPSs of the study area (Figure 3).
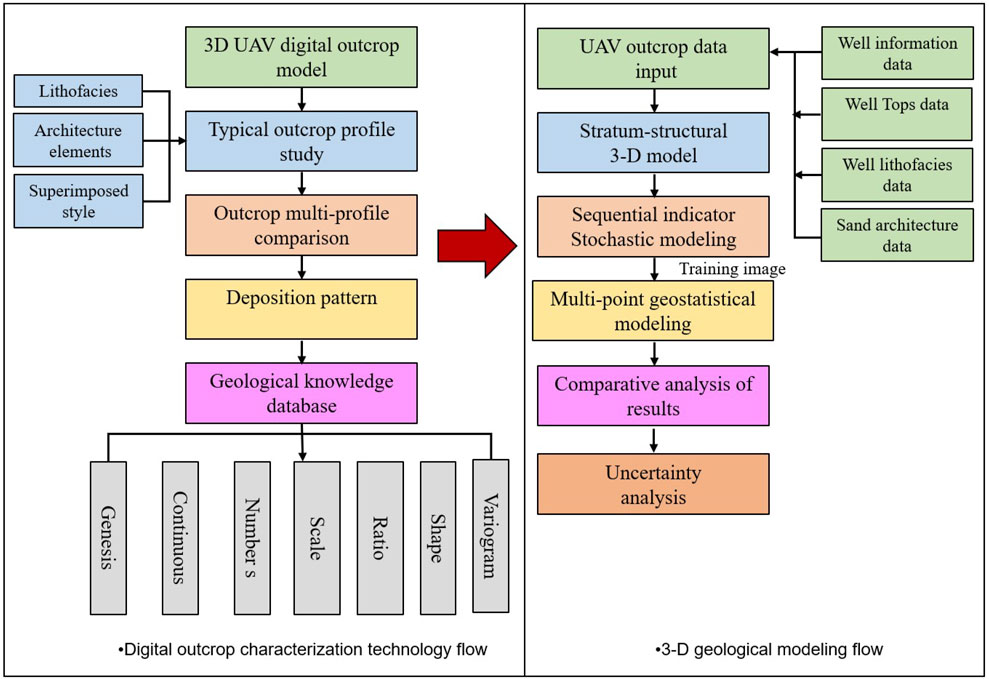
FIGURE 3. Digital outcrop characterization technology and 3-D geological modeling flow chart.
In the typical outcrop profiles of the Jiantianba area, a variety of lithologies may be identified, including:
• Algal-bound reef limestones primarily composed of 65% blue-green algae (Figures 4A,B);
• Algal-bound sponge reef limestone with a 25% sponge content, 35% blue-green algae and a conspicuously algal-bound structure (Figures 4C,D);
• Algal-bound limestone and algal-bound sponge bafflestone with poor layering at the top;
• Sponge reef limestone, with an obvious skeletal structure in which reef-building organisms mainly include ∼60% string sponge and fiber sponge reef (Figure 4E).
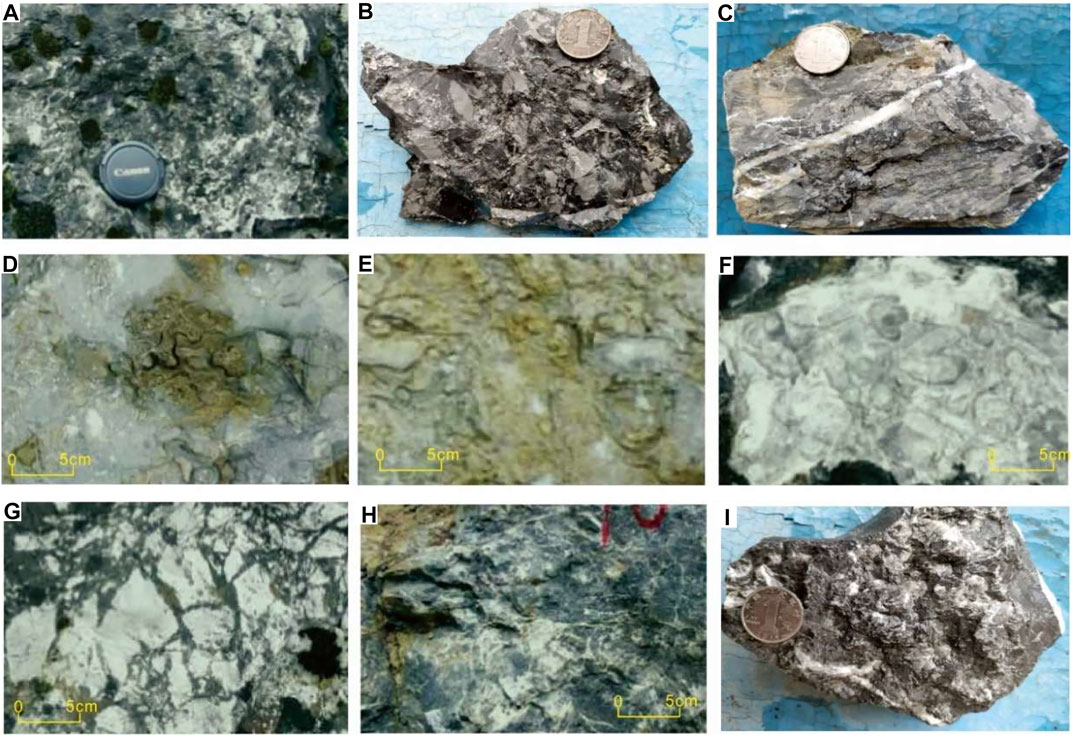
FIGURE 4. Lithology and biology of Changxing Formation reef in outcrop of Jiantianba. (A,B) Algal reef limestone, mainly composed of blue-green algae, content up to 65%; (C,D) algal bonded sponge reef limestone, with about 25% sponge content and 35% blue-green algae content, has obvious algal bonded—barrier structure; (E) sponge skeleton reef limestone, with obvious barrier—skeleton structure, reef-building organisms are mainly string sponges and fiber sponges, the content of which is about 60%; (F) skeleton reef limestone, with biological skeleton structure, reef-building organisms are mainly string sponges, fiber sponges, etc., (G) limestone breccia, breccia for angular, for the collapse of the reef formation; (H,I) light grey blocky dolomitic reef limestone, fracture and dissolution of the geode is developed well.
Different stratigraphic positions are dominated by different species, with blue-green algae dominating at the bottom of the section and sponges at the top. The structure of the skeletal reef limestone is mainly composed of string sponges and fiber sponges reef as reef-building organisms (Figure 4F); in the lateral extension of the bottom of the Jiantianba section, a large amount of skeletal reef limestone was found. Limestone breccia, which was formed due to the collapse of the reef (Figure 4G); dark grey, thickly bedded dolomite, with visible cracks and dissolution vugs (Figures 4H,I) and caves that exceeded 10 m were also observed.
Different types of lithologies corresponded to different sedimentary microfacies in the study area. Bioclastic reef limestone, shoal facies and sand debris constituted the reef-based microfacies, while sponge skeletal and algal-bound rocks comprised the block reef core. Dolomite was interbedded with echinoderm limestone, micritic dolostone and stratified dolomite, in which there were abundant epigenetic dissolution pores in a layered distribution. Some of these pores have been filled by asphaltene and calcite. The reef top microfacies, which undulates and protrudes upward, is a favourable reservoir.
Several outcrop sections were surveyed and analysed in this study. The A–A’ section of Jiantianba was in the eastern part of the study area (Figure 1B). The section is ∼300-m-long from north to south, 400-m-long from east to west and has a strike of N70°E. The exposed part of the profile corresponds to the reef core and reef base microfacies and to the PSS2 and PSS1 quasi-sequence groups in the stratigraphic sequence (Figure 5A). At the bottom of the section, there is an ∼75-m-thick, dark grey, thin–medium bedded micritic limestone, in which single layers are ∼0.15-m-thick and ∼0.1 m at a minimum. The micritic limestone transitions upward into bioclast–micritic limestone that is ∼150-m-thick, with layers of ∼0.2 m and at least 0.15 m in thickness. The bioclast content gradually increases from the bottom to the top and there are local occurrences of grey, medium-bedded bioclast–micritic limestone. There are only a few types of organisms represented, mainly brachiopods, echinoderms and algae, none of which are abundant. The chrysanthemum reef is visible at the bottom, indicating a deep-water low-energy environment at the time of its deposition. In the middle of the section, the lithology transition from a micritic limestone to an algal-bound reef limestone that is ∼43-m-thick; the mean thickness of individual layers is ∼2–3 m.
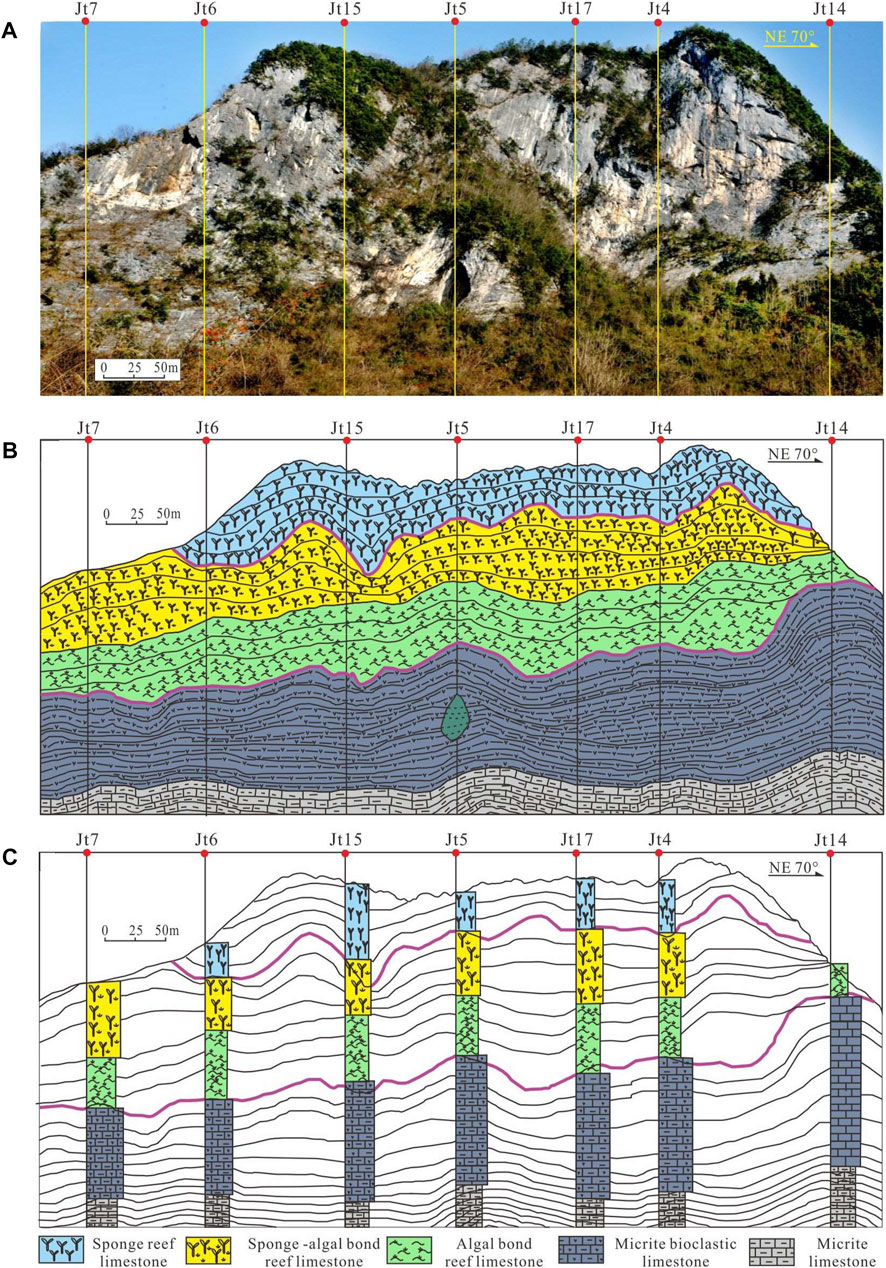
FIGURE 5. Architecture geological model of Jiantianba AA’ section, Lichuan. (A) Field outcrop picture; (B) outcrop profile sketch; (C) architecture geological model.
On the algal-bound limestone, a set of sponge reef limestones is ∼35-m-thick and exhibits poor layering. A set of sponge skeletal bafflestones also occur at the top of the section, in which the main reef-building organisms are string sponges and fiber sponge reef. These rocks contain abundant algae and sponge but extremely poor layering, exhibiting a massive structure, with a small amount of visible asphaltene (Figure 5B). The profile worsens in layering from the bottom to the top and the fine, horizontal strata are mostly concentrated in the bottom of the outcrop area, with good continuity and characteristics typical of reef base sediments (Figure 5C).
The B–B’ section in Jiantianba (Figure 1B) is located in the southeast of a typical outcrop area, Yupi Village, with a strike of S60°E. The vertical sequence mainly corresponds to the PSS1 quasi-sequence group, on which the reef base microfacies in the sedimentary facies belt crops out, and the bioherm core microfacies is visible at the top. Except for the top, which is covered by vegetation, the rock mass is fully exposed (Figure 6A). At the bottom of the section is an ∼40-m-thick micritic limestone, which appears in evenly distributed layers of ∼0.25 m and at least 0.15 m in thickness. This limestone has localised silicate nodules and is lithological stable overall and large in its lateral extent. Above this layer is am ∼200-m-thick bioclast–micritic limestone. This rock comes contains layers of ∼0.3 m in thickness (minimum: ∼0.2 m) and has local silicate nodules. At the top of the section is a small amount of algal-bound limestone (∼25-m-thick), with poor layering, but a blocky structure and clustered distribution (Figure 6B). From the bottom to the top of the profile, micritic limestone, bioclast–micritic limestone and algal-bound limestones appear sequentially. The lithological transition between the bioclast–micritic limestone and algal-bound limestone corresponds to the boundary between the quasi-sequence groups PSS1 and PSS2. Having been subjected to later geological reworking, the top of the reef limestone varies in thickness at different locations (Figure 6C).
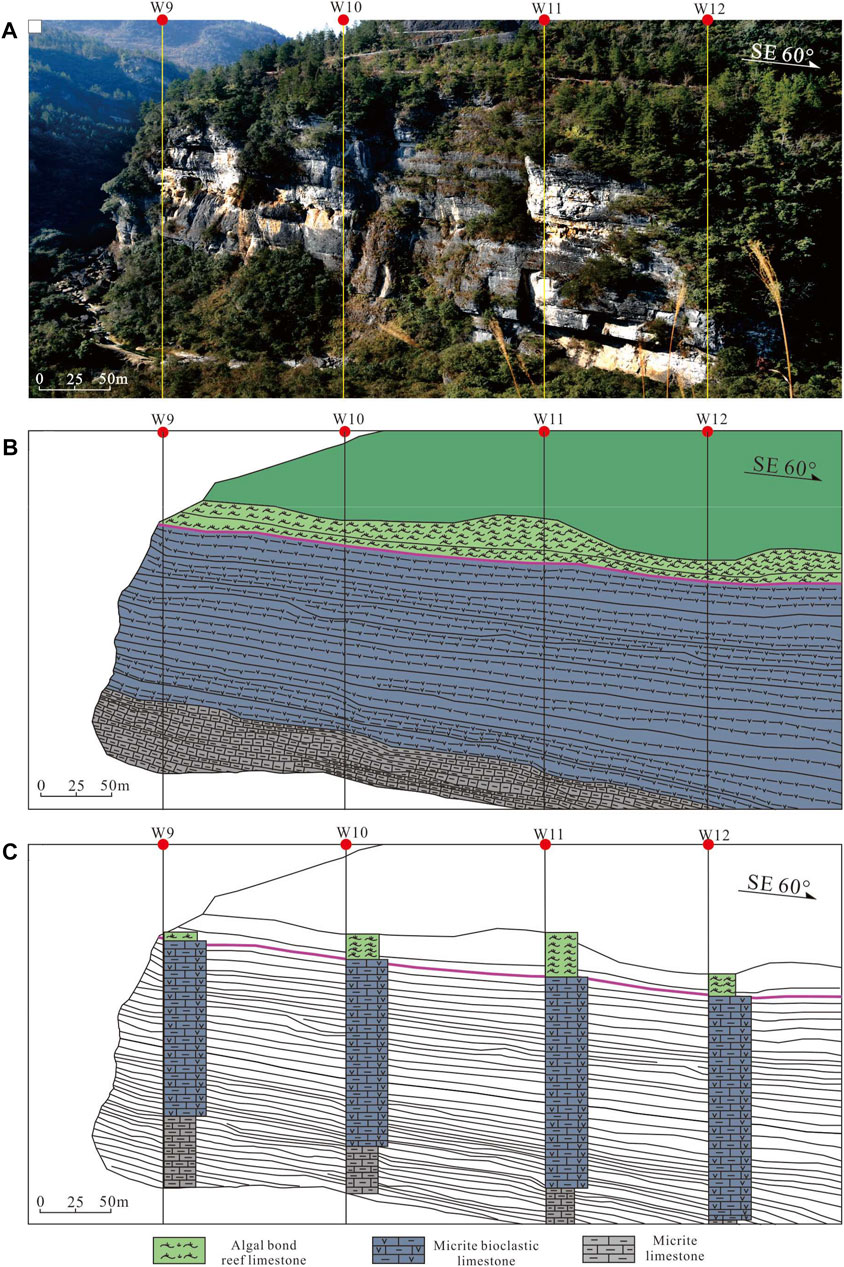
FIGURE 6. Architecture geological model of Jiantianba BB’ section, Lichuan. (A) Field outcrop picture; (B) outcrop profile sketch; (C) architecture geological model.
The C–C’ section in Jiantianba (Figure 1B) is 500 m southeast of the typical outcrop area in Village. The section exhibits a “V” shape in top view, stretching from the middle to both sides, with the rock walls on two sides striking N60°W and N55°E, respectively. The section has a middle bulge and is small in scale. The reef base, bioherm and reef core microfacies in the reef facies are completely exposed and the vertical sequence corresponds to three quasi-sequence groups (PS S3, PSS2, and PSS1) (Figure 7A). At the bottom of the section is am ∼15-m-thick micritic limestone distributed in even layers of ∼0.2 m and at minimum 0.1 m in thickness. Above the micritic limestone is a layer of bioclast–micritic limestone that is ∼25-m-thick, with layers of ∼0.3 m and a minimum of 0.2 m in thickness. Overlying the bioclast–micritic limestone lies a set of algal-bound reef limestones that are generally ∼15-m-thick and poorly layered at the top (Figure 7B). From the bottom to the top of the section, micritic limestone, bioclast–micritic limestone and algal-bound limestone occur in succession. Mudrocks are laterally consistent in content and stable. The lithologic transition between the bioclast–micritic limestone and algal-bound limestone corresponds to the boundary between the PSS1 and PSS2 quasi-sequence groups. Having been affected by later geological reworking, the top reef limestone is large in scale in the middle of the section and smaller in on the two flanks. The reef varies somewhat in thickness at different locations (Figure 7C). Based on the field survey and comparison of the sections, the quantitative parameters of the stratigraphic architecture of the aforementioned five sections were analysed (Table 1).
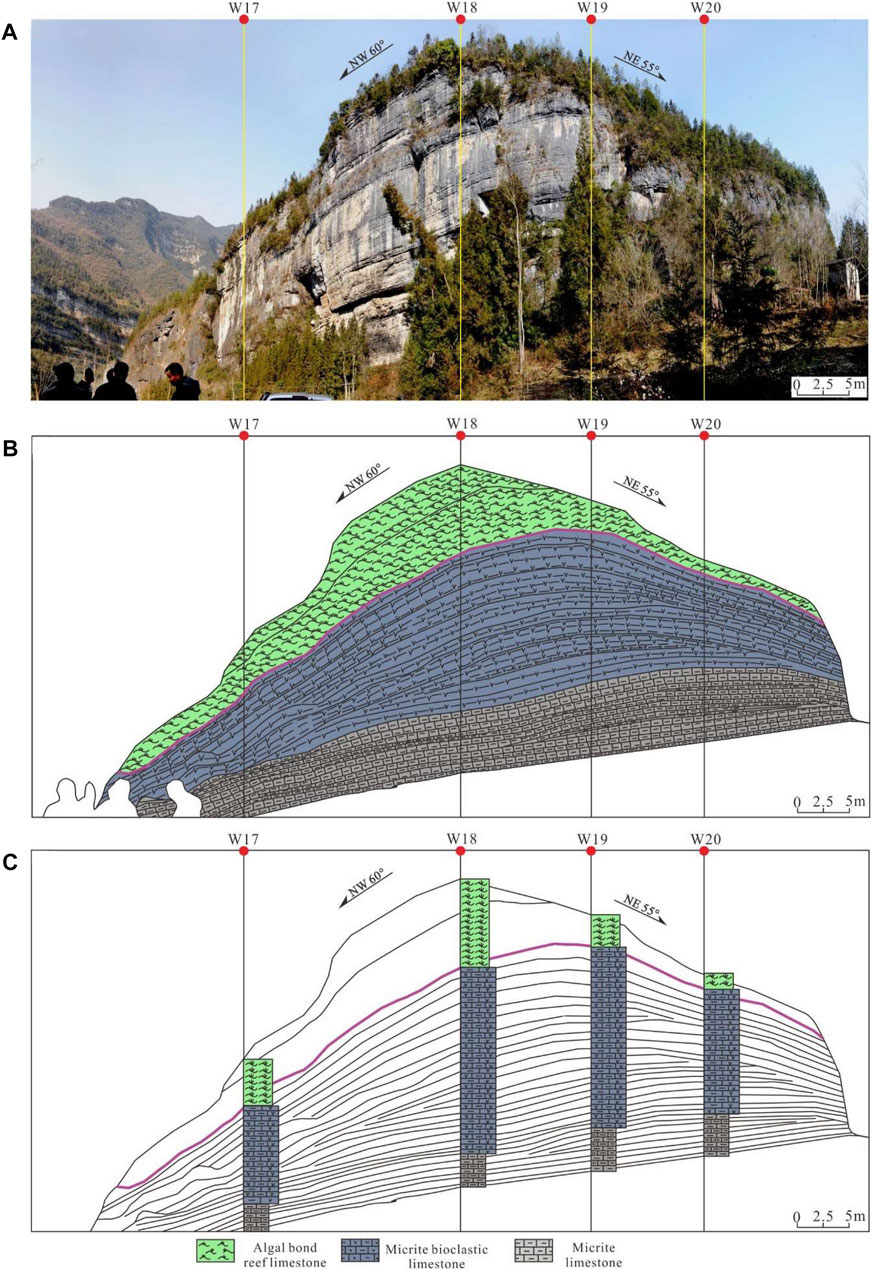
FIGURE 7. Architecture geological model of Jiantianba CC’ section, Lichuan. (A) Field outcrop picture; (B) outcrop profile sketch; (C) architecture geological model.
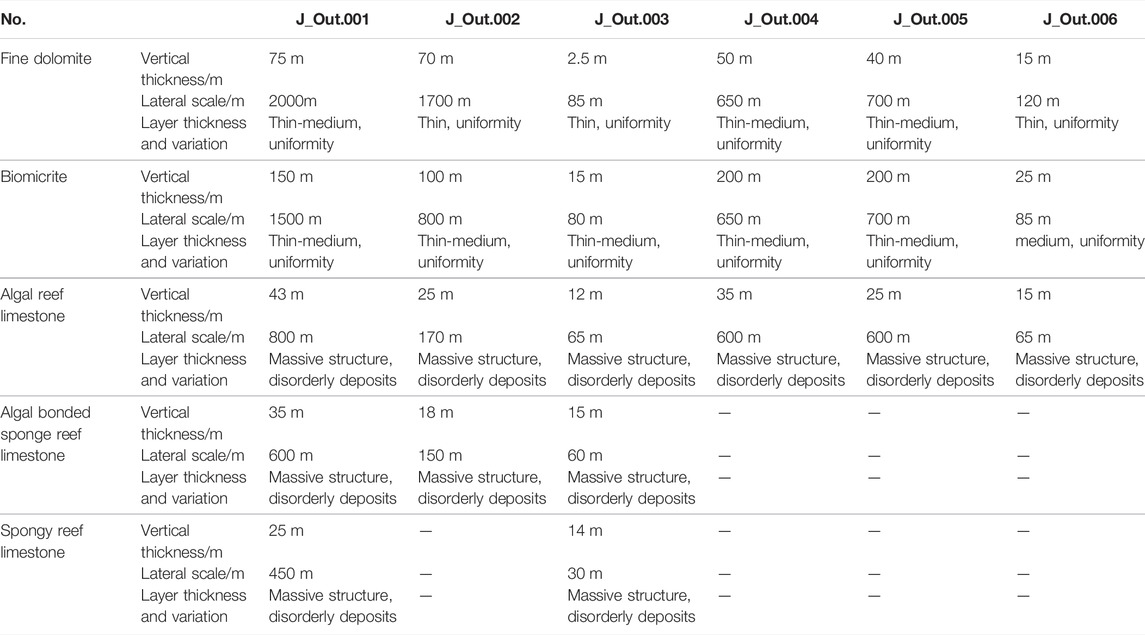
TABLE 1. Quantitative parameters of lithofacies architecture in the outcrop area.
The UAV, combined with OPT, allowed for the rectangular spatial coordinates of any point on the image to be accurately obtained. In this survey, an eight-rotor UAV (Tiantu, China) was flown in parallel according to the planned cruising route. The aerial folding range was ∼40%. During flight, a Share-200 (Motoar Sky, China) oblique camera carried by the UAV continuously acquired image information from five angles according to the set exposure mode (Figure 2A, Figure 8). The UAV was also equipped with a positioning and orientation system (POS) that accurately recorded the real-time rectangular spatial coordinates of each point during flight. The POS and image information were continuously accepted by the ground sensor and imported into the ground terminal operating platform. After aerial photography, the ground terminal platform was used to guide the vehicle to return safely and data collection in the study area was completed.
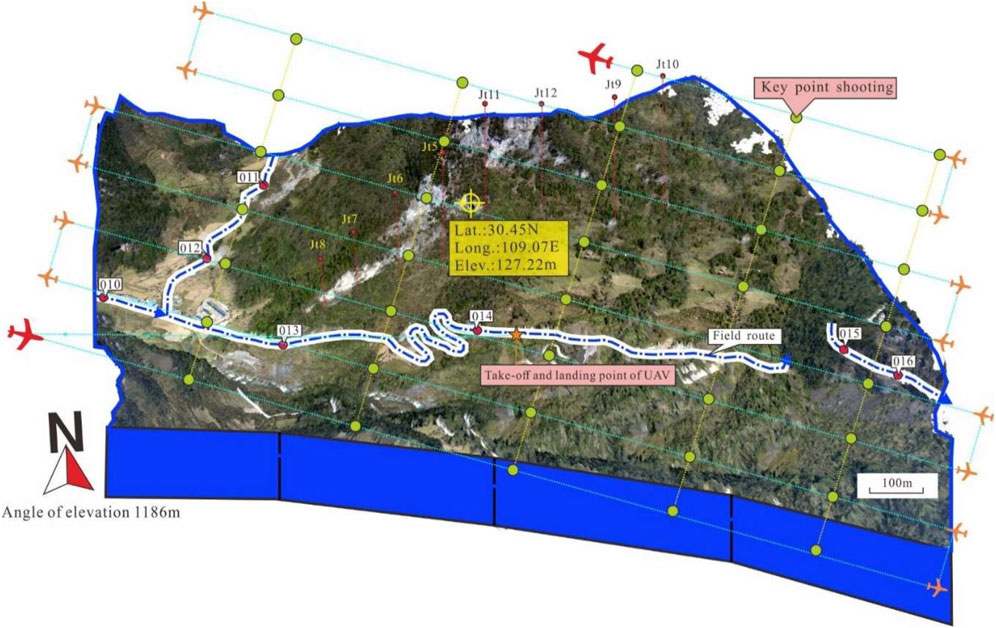
FIGURE 8. 3D digital outcrop model processed by UAV oblique photography, outcrop of Jiantianba. The maximum resolution of a local image was ∼10–20 cm. Cruise line automatic set-up by POS system. The UAV take off from start point to the end then achieved outcrop scanning and taking pictures.
The data were integrated using Context Capture v. 2.0 (Bentley System, Inc., United States) to construct a 3-D model of the Jiantianba outcrop area with coordinates (Figure 1B, Figure 5), which can reflect the real geological conditions in the field very well. The coordinates of any point can be obtained directly and the spatial distributions of the geological bodies in the model were well expressed. The scanning model built can satisfy 360° observation and can zoom in and display local parts of an image. The maximum resolution of a local image was ∼10–20 cm. By changing camera or adjusting the flying height, the resolution can be further improved (Figure 8). The model had a large range, covering many remote and dangerous areas that cannot be safely reached by humans; this kind of data acquisition is much more efficient than manual inspection. The data acquired also provides a solid geological foundation for quantitative modelling.
Virtual well data. Traditional outcrop investigations cannot connect the information from continuous points, limiting the interpretability of the research to some extent, especially when the geographical coordinates of the research block cannot be continuously obtained. The UAV OPT accurately matches the image and geographic coordinate information of any point in the study area. In this study, we selected the x-coordinates, y-coordinates and elevation, z (Table 2), of 17 wells in the outcrop field, which laid the foundation for 3-D geological modelling.
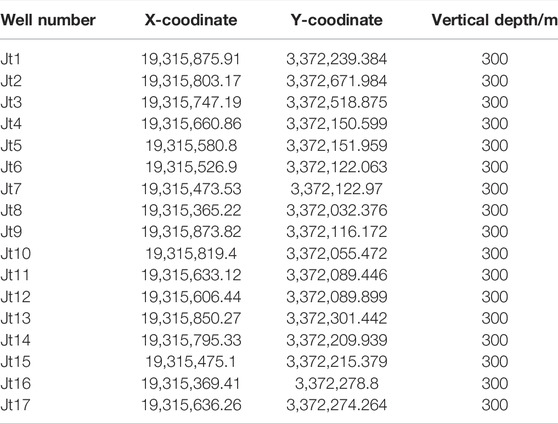
TABLE 2. Coordinate data information of virtual wells of outcrop, Jiantianba.
Lithological data. After determining the coordinates of well positions, by analysing the collected rock samples, combined with the aforementioned field analysis and lithological calibration results, the lithologies of different depth sections of atypical outcrop of Jiantianba was calibrated. In consideration of the subsequent modelling, lithotypes, including crystal–fine-grained dolomite, bioclast–dolomitic limestone, sponge skeletal reef limestone, algal-bound sponge reef limestone, algal-bound reef limestone, bioclast–micritic limestone and mudstone, were identified and represented by corresponding codes. The lithotypes and corresponding codes for different well depths were determined and taken as input data during modelling (Table 3).
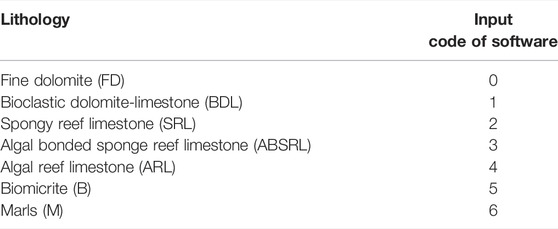
TABLE 3. 3-D modeling lithology data and input code which used in simulation software, Jiantianba.
Well top data. According to the field research, there are typical reef base, bioherm core, reef core and reef top sedimentary microfacies from the bottom to the top of the Jiantianba outcrop, with obvious lithological interfaces. Therefore, in the subsequent 3-D geological model, the section was divided into five single layers (PSS0, PSS1, PSS2, PSS3 and PSS4) based on the top bedding plane. The stratigraphic divisions for the five layers in the corresponding wells were obtained from UAV elevation data to lay a foundation for 3-D reservoir modelling.
After inputting the converted geological information (i.e., wells, seven lithologies and well top data) into Petrel V.2009 (Schlumberger, United States), the 3-D gridding model (Figure 9A) and stratigraphic model of the study area were built using Pillar gridding, horizon and layering modules (Figure 9B). The model was composed of 637,880 grids sized 1 m × 1 m × 0.25 m.
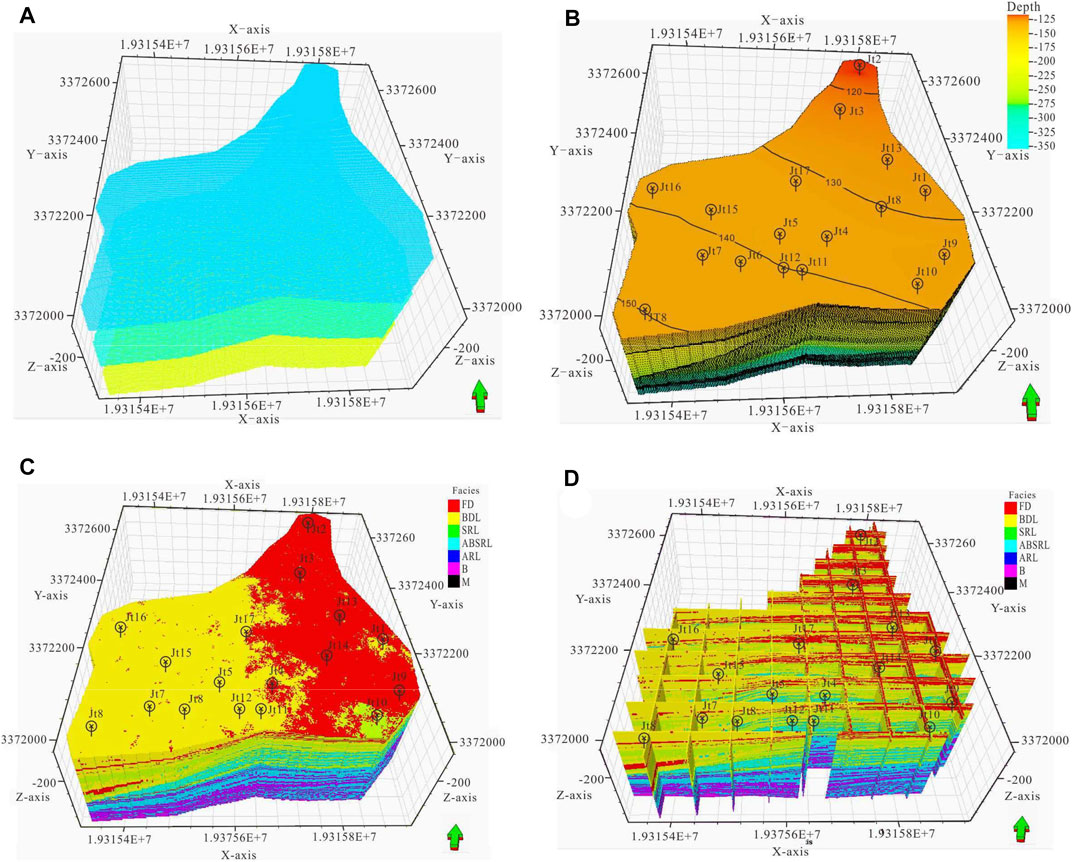
FIGURE 9. 3-D stratigraphic structural model of typical outcrop area of Jiantianba. (A) 3-D griding model; (B) 3-D stratigraphic structural model; (C) 3-D lithological model; (D) palisade 3-D grids display about lithological model.
Based on the field research and UAV OPT data, including the thickness, spatial relationships and extensional direction of various lithofacies, and using lithological, well and well top data as constraints (Table 4), geological modelling was carried out using the “Data Analysis” and “Facies Modeling” modules in Petrel V.2009 (Schlumberger, United States). An SIS algorithm based on a variogram function was used to run 50 random simulations of the lithology of the Jiantianba outcrop area. The geological models obtained were compared and the reasonable model was finally selected (Figure 9C). This model was in line with the known geological understanding of the area. Based on the SIS model of the lithofacies, a map of the planar distribution of lithofacies was obtained using the “properties” function in Petrel (Figure 9D). Analysing the facies distribution, the sedimentary units generally show a lithological transition from micritic limestone to reef limestone to limy dolomite from the bottom to the top.
TABLE 4. Part of well tops data about virtual wells of outcrop, Jiantanba.
The contour map showing the lithological distribution from the SIS was combined with the geological outcrop profile analyses as the prototype model for the 3-D training image and MPS was carried out. The geometric shape of the training image in the study area was obtained from the lithological contour map. A darker colour (purple) and larger mean numerical code indicated that the lithology of the region was closer to that of the reef base. Conversely, a lighter (orange) colour and smaller numerical code indicated that the lithology of the area was closer to that of the reef top, if at the top of the reef, a higher degree of dolomite development was observed.
The lithofacies distribution shows that the sedimentary units evolved from a micritic limestone to a reef limestone to a limy dolomite from the bottom to the top. The dolomitic limestone in the reef top transitioned from a continuous distribution to an isolated, point-like distribution. In contrast, the reef limestone exhibited good overall continuity and a local point-like distribution (Figures 10A,B). Observing the reef core microfacies reveals that the reef-forming facies mainly occur in isolated points, and the algal-bound reef limestone is more abundant in content in the southwest (Figure 10C). Observation of the bioherm microfacies further reveals that the reef-forming facies were in the northwest region. Algal-bound and bioclast–micritic limestones occurred in layers, with high content locally (Figure 10D). By observing the reef base microfacies, it was found that the algal-bound reef limestone and bioclast–micritic limestone were continuous. The reef core microfacies, which are mainly algal-bound and bioclast–micritic limestones exhibit isolated, point-like distributions. The main reef base bodies (yellow) are in the northeast and southwest of the area (Figures 10E,F).
FIGURE 10. Pattern of lithological distribution realized by the first SIS modeling. (A–B) local point-like distribution reef limestone; (C) rich algal reef limestone; (D) high content locally; (E) point-like distribution in the northwest; (F) point-like distribution in the southwest.
In order to improve the accuracy and quantitative capacity of the training images, the four single layers controlled by the five lithological interfaces were processed in detail. According to the vertical and planar facies sequences, the functions of the “Facies” module in Petrel were used to re-adjust the spatial distributions and quantitative relationships of various lithologies, and to obtain 3-D models of different reef shoal microfacies, including reef base, bioherm, reef core and reef top (Figures 11A–D). The results of the first depositional SIS were edited in Petrel. It can be seen from the 3-D grid diagram that the spatial contacts between the facies belts maintained the results of the original deposit and the mesh size of the training image matched that in the subsequent MPS, ensuring the accuracy and precision of the 3-D spatial search. The 3-D training image model reflects the variations of various lithologies in the vertical and horizontal directions quite well.
FIGURE 11. 3-D training image model of each lithological microfacies. (A) Reef crest; (B) reef core; (C) bioherm; (D) reef base.
Multi-point geostatistical simulations were based on the Petrel software platform, using the fairly mature single normal equation simulation (SNESIM) algorithm. Based on the well lithofacies data, MPSs under the constraint of lithofacies was conducted to simulate the distribution of six lithologies in different layers of the reef base, bioherm, reef core and reef top microfacies. The SIS method was used to simulate the 3-D sedimentary microfacies of the reef base (Figure 12B), which was composed of argillaceous limestone, bioclast–micritic limestone and a small amount of algal-bound limestone. The results of the primary SIS showed that the micritic limestone and bioclastic limestone were unevenly distributed, while also existing as continuous pieces, with no geometric regularity. After MPS under the constraint of the training image (Figure 12A), it was found that the micritic limestone and bioclast–micritic limestone alternated. That is, the bioclasts exhibited multi-period distributions that roughly paralleled the direction of the coastline. The geological connotation of the training image is well expressed and the lithological relationships are more in line with the understanding of the reef base microfacies (Figures 12C,D).
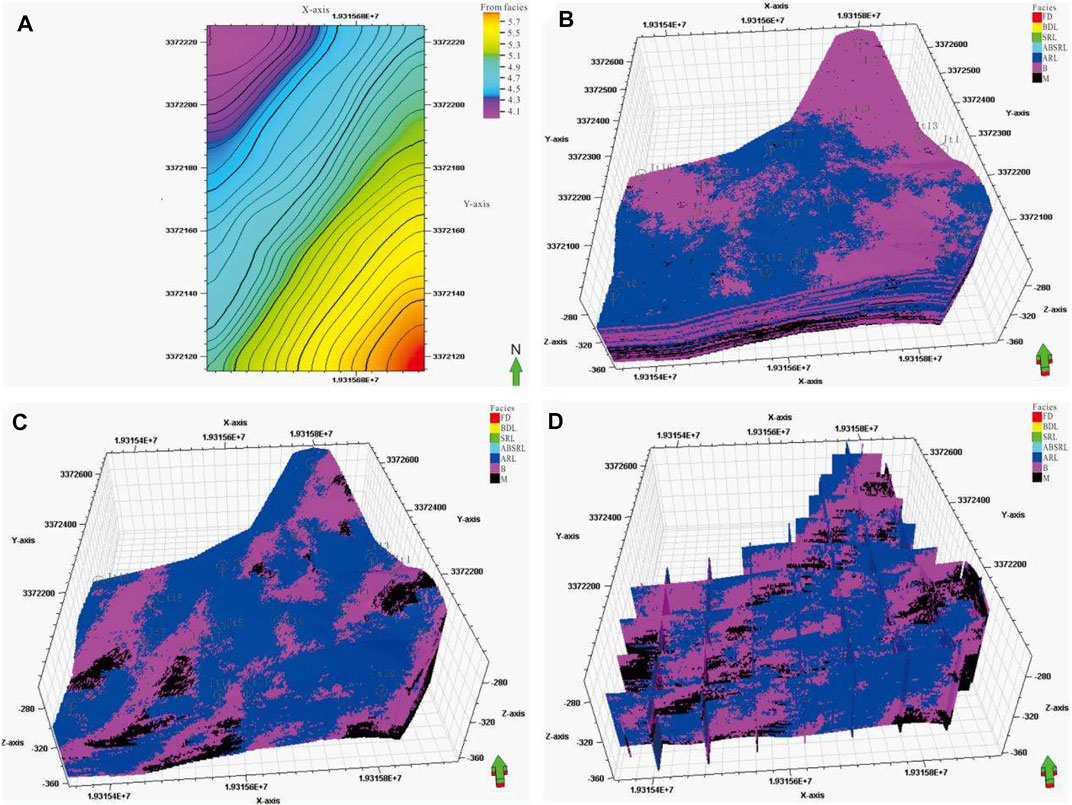
FIGURE 12. 3-D outcrop modeling of reef base microfacies, which are restraint by training image pattern. (A) Reef base training image obtained by SIS, which deposited carbonate lithofacies gradually to bioherm; (B) the SIS Lithological modeling; (C) MPS realization; (D) palisade 3-D grids display about the multipoint geostatistics model.
The bioherm was mainly composed of bioclast–micritic limestone, algal-bound limestone and a small amount of sponge skeletal rock with an algal-bound structure. The results of primary SIS revealed that the algal-bound limestone and sponge skeletal rock were in a continuous piece with no obvious geometric distribution (Figure 13B). In the secondary MPS, under the constraint of the training image (Figure 13A), the planar trend and vertical variation in lithologies were strongly regulated. The results of MPS showed that the bioclastic limestone and algal-bound limestone were interbedded, largely in layers, but also as discrete points. The stratigraphic sequence was also more in line with our understand of bioherm core microfacies (Figures 13C, D).
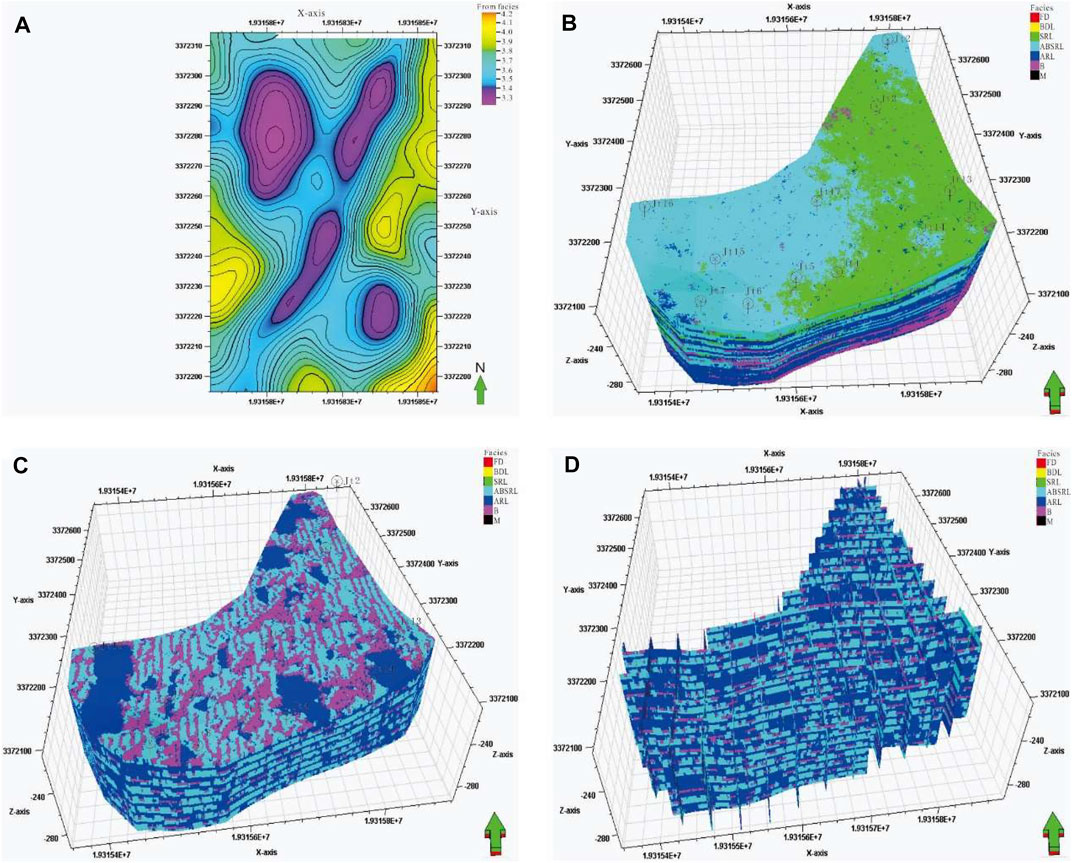
FIGURE 13. 3-D outcrop modeling of bioherm microfacies, which are restraint by training image pattern. (A) Bioherm training image obtained by SIS, which deposited carbonate lithofacies suddenly to reef core; (B) the SIS lithological modeling; (C) MPS realization; (D) palisade 3-D grids display about the multipoint geostatistics model.
The main lithologies of the reef core microfacies included a sponge reef limestone with an algal-bound structure, sponge skeletal bafflestone, bioclastic limestone and a small amount of fine-grained dolomite. The results of primary SIS showed that the contacts between the different lithologies were irregular, and the fine-grained dolomite at the reef top was continuously distributed (Figure 14B). After the secondary MPS, under the constraint of the training image (Figure 14A), it was found the bioclast–dolomitic limestone and the sponge skeletal reef limestone were heterogeneous in distribution. Overall, the algal-bound limestone was scattered and evenly distributed, while the sponge skeletal limestone appeared in layers in striking northeast–southwest, which is more consistent with the geospatial distribution of a linear reef. Locally, the content of the reef increased, which is presumed to represent single-point reefs on the seaward side. The lithologic relationships are also more in line with the understanding of reef core microfacies (Figures 14C, D).
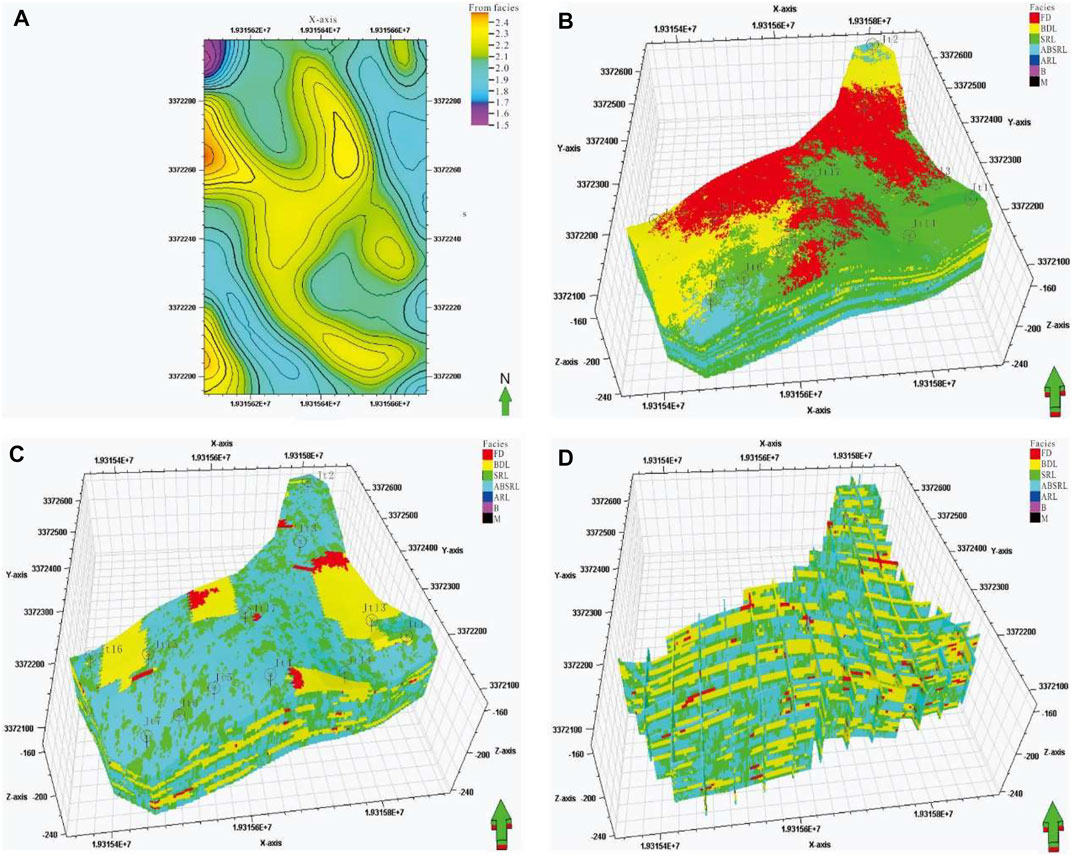
FIGURE14. 3-D outcrop modeling of reef core microfacies, which are restraint by training image pattern. (A) Reef core training image obtained by SIS, which deposited carbonate lithofacies but poor continuity; (B) the SIS lithological modeling; (C) MPS realization; (D) palisade 3-D grids display about the multipoint geostatistics model.
The main lithologies of the reef top microfacies included a sponge reef limestone with an algal-bound structure, sponge skeletal bafflestone, bioclast–dolomitic limestone and a small amount of fine-grained dolomite. The SIS results showed that the fine-grained dolomite was concentrated in the eastern part of the model and was continuously distributed, while the bioclast–dolomitic limestone was concentrated in the west (Figure 15B). The planar distribution differs from the lithologic distribution of the reef–shoal facies considerably. The MPS, under the constraints of the training image, showed that the fine-grained dolomite and bioclastic limy dolomite were well regulated (Figure 15A). The amount of fine-grained dolomite was greatly reduced and shifted to the northwest. The sponge skeletal reef limestone appeared in layers approximately parallel to the coastline. The stratigraphic relationships observed are more consistent with the understanding of the reef top microfacies (Figures 15C,D).
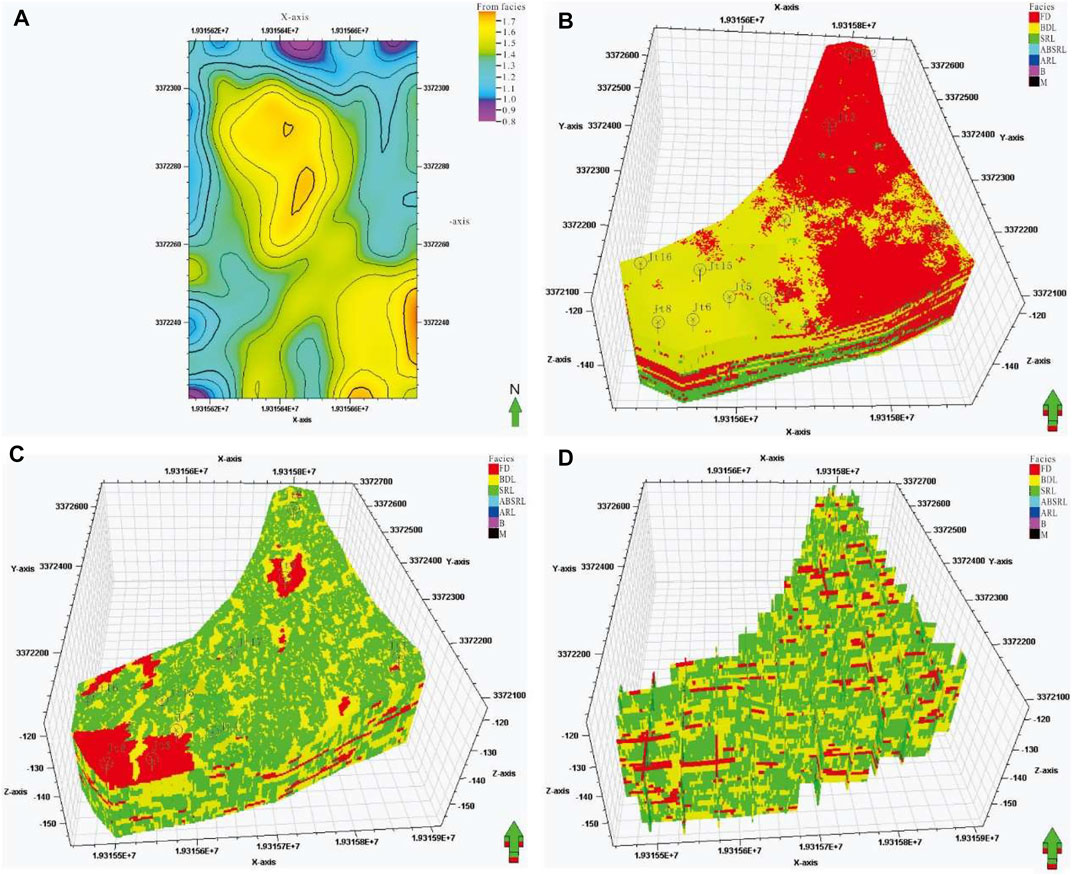
FIGURE15. 3-D outcrop modeling of reef crest microfacies, which are restraint by training image pattern. (A) Reef crest training image, which deposited carbonate lithofacies but very poor continuity; (B) the SIS lithological modeling; (C) MPS realization; (D) palisade 3-D grids display about the multipoint geostatistics model.
Through comparing the morphologies and lithological distributions of different microfacies in the models, we found that in the MPS under the constraint of lithofacies, the training image controlled the spatial distribution of the lithofacies quite well. Compared with the SIS, the lithologies of the MPS displayed better regularity in both vertical and lateral distributions, which is more in line with the current geological understanding of the reef–shoal facies in the Jiantianba outcrop area. Combining field research and modelling, the parameters of the SIS and MPS were statistically compared. It was found that the geological knowledge effectively constrained the data for each lithofacies in the MPS. The difference between the results of the MPS parameters and the statistical results from the geological knowledge based on field surveys was small (Table 5), with the difference in lithology reaching a maximum of 15.2% and a minimum of 0%, which indicates that the model is generally reliable.
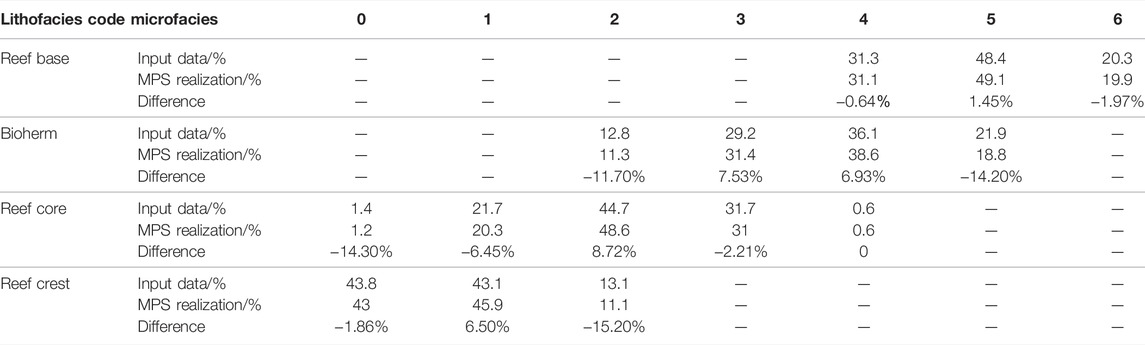
TABLE 5. Comparison of lithology model data to input.
The improvement of current geological knowledge and 3-D geologic modelling-based data collected via UAV can be promoted in similar reservoirs in this and other study areas. Under the same sedimentary system, based on the OPT of the UAV, an outcrop can be used as a prototype model (Zhang et al., 2017; Zhao et al., 2017). The 3-D geological model of the outcrop can then be established, which can guide the oil development and production and reduce the risks of developing similar reservoirs (Yin et al., 2018a; 2018b, 2021).
To make the 3-D geological model established approach reality, modelers aim to have planar geological information to assist the 3-D simulation by acting as a constraint (Wu and Li, 2005). However, it is difficult to realise the conversion of geologically associated irregular profile data into planar data via traditional field-based approaches, which greatly impair the application of high-precision and visual data of the field outcrops in 3-D geological models (Yin et al., 2013; Picke et al., 2015). Meanwhile, the accuracy of the model is closely related to the modeler’s experience with the geological setting of the study area. In recent years, our geological knowledge has made great progresses in two aspects: the acquisition technologies used for quantitative data in geological databases and the algorithm of inter-well reservoir predictions (Duan et al., 2019). In particular, the MPS method has developed rapidly. How to obtain training images more reasonably and lay the foundation for establishing model libraries has become an important research topic (Zhao et al., 2017; Yin et al., 2021). The essence of this is still to quantify geological knowledge. The UAV with OPT opens a new window for data acquisition of training images.
The results of this study show that outcrop 3-D modelling based on UAV OPT has following advantages compared to conventional surveys:
It enhances the quantification of data and provides a spatial framework for 3-D outcrop modelling; Coordinates and lithology may be unfed in the 3-D digital outcrop model, improving upon the original manual recording mode of outcrop surveys, providing quantitative data for the continuous characterisation of the geological body and making it possible to display the irregular shape of such units more vividly and the prototype model more reliable; Transforming profiles into planar information and enhancing the input data of the model, provide an important and reliable constraint.
The outcrop 3-D modelling technology based on UAV oblique photogrammetry should be improved. Specifically, the image and automatic lithological conversion and recognition technology should be enhancing, as the field outcrop data acquired by UAV cruise are large in volume and it is unrealistic to manually calibrate the lithologies and stratigraphic contacts. Therefore, it is necessary to further improve the automatic conversion of images to lithotypes to quickly identify the lithology of the 3-D digital outcrop area. Additionally, the nature of the UAV OPT outcrop model is only a 2-D irregular surface model and the model must to be transformed into a 3-D mesh to realise the characterisation of geological features in the outcrop area at an arbitrary precision. Finally, the training images of the study area must be improved by enhancing model algorithms and making use of the quantification and visualisation advantages of data acquisition; the MPS theory and methods must also be deepened.
A model of the carbonate outcrop data of Jiantianba has been generated from UAV OPT; the 3-D coordinates and corresponding image information of the model are highly accurate, making it possible to locate and measure the coordinates of any position accurately. This lays a base for researching the stratigraphic architecture of carbonate deposits and establishing an accurate reservoir database.
Meanwhile,the type, continuity and scale of lithofacies, vertical lithological sequences and evolutionary characteristics of typical outcrops in the field were compared, and the model parameters included an algal-bound reef limestone, algal-bound sponge reef limestone, sponge skeletal reef limestone, skeletal reef limestone, limestone breccia, and crystal–fine-grained dolomite, making up the reef top, reef core, bioherm core and reef base microfacies in the reef flat facies of the study area. The micritic limestone was stably distributed for 800–2000 m across and 15–40 m thick in thin layers. Bioclast–micritic limestone was distributed stably for 650–1,500 m across and 100–200 m in thickness, with uniform thin–medium bedded layers. Finally, the algal-bound reef limestone, sponge–algal-bound reef limestone and sponge skeletal reef limestone were similar in their unstable distributions, which ranged from 600 to 800 m across about 15–35 m in thickness, and exhibited a blocky structure.
Based on geological analyses, a 3-D stratigraphic model and two lithologic models of the typical outcrop section were established. Comparison of the models revealed that the MPS included reefs in different facies zones, which was essentially consistent with our understanding based on field surveys and better shows the combination and stratigraphic succession of different reef flat microfacies.
The original contributions presented in the study are included in the article/Supplementary Material, further inquiries can be directed to the corresponding author.
Conceptualization, SY; methodology, LZ validation, BZ; formal analysis, JZ; investigation, BZ; data curation LC; writing—original draft preparation, SY.
This study was supported by the Open Foundation of Top Disciplines in Yangtze University (Grant No. 2019KFJJ0818022), the National Natural Science Foundation of China (Grant No. 41502126) and the National Science and Technology Major Project (Grant No. 2017ZX05008-006-004-002).
YL was employed by the company China National Petroleum Corp Bureau of Geophysical Prospecting Inc.
The remaining authors declare that the research was conducted in the absence of any commercial or financial relationships that could be construed as a potential conflict of interest.
All claims expressed in this article are solely those of the authors and do not necessarily represent those of their affiliated organizations, or those of the publisher, the editors and the reviewers. Any product that may be evaluated in this article, or claim that may be made by its manufacturer, is not guaranteed or endorsed by the publisher.
Abbey, E., Webster, J. M., Braga, J. C., Jacobsen, G. E., Thorogood, G., Thomas, A. L., et al. (2013). Deglacial Mesophotic Reef Demise on the Great Barrier Reef. Palaeogeogr. Palaeoclimatol. Palaeoecol. 392, 473–494. doi:10.1016/j.palaeo.2013.09.032
Azri, M. S., and Khairul, N. T. (2019). Identification of Rut and Pothole by Using Multirotor Unmanned Aerial Vehicle (UAV). Measurement 137, 647–654. doi:10.1016/j.measurement.2019.01.093
Bao, Z., and Wang, S. W. (2017). Research on Generating the Cooperative Operational Ability of the Manned/Unmanned Aerial Vehicles. Natl. Defense Sci. Technology 38 (3), 76–79. doi:10.13943/j.issn1671-4547.2017.03.12
Bi, K., Li, Y. C., Ding, X. B., and Liu, F. (2015). Aerial Photogrammetric Technology of Light Small UAV: Status and Trend of Development. Bull. Surv. Mapp. 60 (3), 27–31. doi:10.13474/j.cnki.11-2246.2015.0068
Buckley, S. J., Howell, J. A., Enge, H. D., and Kurz, T. H., 2008, Terrestrial Laser Scanning in Geology: Data Acquisition, Processing and Accuracy Considerations: J. Geol. Soc., 165, 625–638.doi:10.1144/0016-76492007-100
Cai, X. Y. (2011). The Subtly Method of Reservoir and Exploration Effects on the Organic Reef-beach Body of Changxing Formation. Yuanba Area, Northeast. Sichuan: Eng. Sci. 13 (10), 28–33.
Carvajal-Ramírez, F., Navarro-Ortega, A. D., Agüera-Vega, F., Martínez-Carricondo, P., and Mancini, F. (2019). Virtual Reconstruction of Damaged Archaeological Sites Based on Unmanned Aerial Vehicle Photogrammetry and 3D Modelling. Study Case of a southeastern Iberia Production Area in the Bronze Age. Measurement 136, 225–236. doi:10.1016/j.measurement.2018.12.092
Duan, T. Z., Wang, G. F., Lian, P. Q., and Zhang, W. B. (2019). Quantitative Geological Modeling of Oil and Gas Reservoirs and Application. Beijing, China: Petroleum Industry Press, 1–20.
Fan, C., Li, H., Qin, Q., He, S., and Zhong, C. (2020). Geological Conditions and Exploration Potential of Shale Gas Reservoir in Wufeng and Longmaxi Formation of southeastern Sichuan Basin, China. J. Pet. Sci. Eng. 191, 107138. doi:10.1016/j.petrol.2020.107138
Fan, J. S., and Wu, Y. S. (2002). Restudies on Permian Reefs in Eastern Sichuan, China. Oil Gas Geology. 23 (1), 12–18.
Fan, J. S., Zhang, W., Ma, X., and Zhang, Y. B. (1982). The Upper Permian Reefs in Lichuan Area West Hubei. Scientia Geologica Sinica 17 (3), 274–282.
Feng, W. J., Yin, Y. S., Zhang, C. M., Duan, T. Z., Zhang, W. B., Hou, G., et al. (2019). A Training Image Optimal Selecting Method Based on Composite Correlation Coefficient Ranking for Multiple-point Geostatistics. J. Pet. Sci. Eng. 179, 321–327. doi:10.1016/j.petrol.2019.04.046
Guo, Z. H. (2001). Some Problems of Height Surveying and Setting-Out with Total Station. Bull. Surv. Mapp. 12, 39–40.
Hao, T., Kershaw, S., Tan, X. C., Liu, H., Li, F., Shen, C., et al. (2019). Sedimentology of Reefal Buildups of the Xiannüdong Formation (Cambrian Series 2):SW China. J. Palaeogeogr. 8 (2), 170–180. doi:10.1186/s425010190022x
Hu, M., Hu, Z., Qiu, X., Zhao, E., and Wang, D. (2012). Platform Edge Reef and Bank Structure and Depositional Model of Changxing Formation in Panlongdong Section, Xuanhan, Northeastern Sichuan. J. Earth Sci. 23 (4), 431–441. doi:10.1007/s12583-012-0266-1
Hu, M. Y., D Zhu, Z., He, P., Zhang, J., and Wang, Q. C. (2002). Ordovician Reef in Lunan-Bachu Area and Their Reservoir Characteristics. Oil Gas Geology. 23 (2), 179–182.
Hu, M. Y., Wei, H., Qiu, X. S., and Zhao, E. Z. (2012). Reef Composition and Their Forming Models of Changxing Formation in Jiantianba Section of Lichuan, Western Hubei. Acta Sedimentologica Sinica 30 (1), 33–42.
Jamie, G., Barlow, J., and Moore, R. (2019). Detection and Analysis of Mass Wasting Events in Chalk Sea Cliffs Using UAV Photogrammetry. Eng. Geology. 250, 101–112. doi:10.1016/j.enggeo.2019.01.013
Ji, X. J., Hou, J. G., Liu, H. L., Chen, J., and Liu, X. (2016). Quantitative Characterization of Plane Heterogeneity of Reef Bank Reservoir. Geol. Rev. 62 (5), 1315–1328. doi:10.16509/j.georeview.2016.05.015
Jody, M. W., Wallace, L., Silver, E., Potts, D., Bragac, J. C., Renema, W., et al. (2004). Coralgal Composition of Drowned Carbonate Platforms in the Huon Gulf, Papua New Guinea: Implications for Lowstand Reef Development and Drowning. Mar. Geology. 204, 59–89. doi:10.1016/S0025-3227(03)00356-6
Leinfelder, R. R., Schlagintweit, F., Werner, W., et al. (2005). Significance of Stromatoporoids in Jurassic Reefs and Carbonate Platforms—Concepts and Implications. Facies 51 (1), 288–326. doi:10.1007/s10347-005-0055-8
Li, H., Tang, H., Qin, Q., Zhou, J., Qin, Z., Fan, C., et al. (2019). Characteristics, Formation Periods and Genetic Mechanisms of Tectonic Fractures in the Tight Gas Sandstones Reservoir: A Case Study of Xujiahe Formation in YB Area, Sichuan Basin, China. J. Pet. Sci. Eng. 178, 723–735. doi:10.1016/j.petrol.2019.04.007
Long, S. X., You, Y. C., Liu, G. P., and Feng, Q. (2015). Fine Characterization of Ultra-deep Reef-Shoal Reservoirs of Ramp-type in Changxing Formation in Yuanba Gas field,Sichuan Basin. Oil Gas Geology. 36 (6), 994–1000. doi:10.11743/ogg20150614
Ma, Y. S., Cai, X. Y., and Zhao, P. R. (2014). Characteristics and Formation Mechanisms of Reef-Shoal Carbonate Reservoirs of Changxing-Feixianguan Formation, Yuanba Gas Field. Acta Petrolei Sinica 35 (6), 1001–1011.
Ma, Y. S., Fu, Q., Guo, T. L., Yang, F. L., and Zhou, Z. Y. (2005). Pool Forming Pattern and Process of the Upper Permian-Lower Triassic, Puguang Gas Field, Northeast Sichuan Basin, China. Pet. Geology. Exp. 27 (5), 455–460.
Ma, Y. S., Mu, C. L., Guo, X. S., and Zhao, P. Y. (2006). Characteristic and Framework of the Changxingian Sedimentation in the Northeastern Sichuan Basin. Geol. Rev. 52 (1), 25–29. doi:10.16509/j.georeview.2006.01.006
Mi, Y. H., Zhang, X. P., and Li, Y. J. (2017). Research on 3D City Modeling Based on Oblique Photography. Geomatics Spat. Inf. Technology 40 (1), 215–217.
Mirko, F., Simone, M., Stead, D., Sciarra, N., Mataloni, G., and Calamita, F. (2019). A New Fast and Low-Cost Photogrammetry Method for the Engineering Characterization of Rock Slopes. Remote Sensing 11 (11), 1267–1290. doi:10.3390/rs11111267
Picke, A., Frechette, J. D., Comunian, A., and Weissmann, G. S. (2015). Building a Training Image with Digital Outcrop Models. J. Hydrol. 531, 5–361. doi:10.1016/j.jhydrol.2015.08.049
Qie, L., Shi, Y. N., and Liu, J. G. (2021). Experimental Study on Grouting Diffusion of Gangue Solid Filling Bulk Materials. J. Min. Strata Control Eng. 3 (2), 023011. doi:10.13532/j.jmsce.cn10-1638/td.20201111.001
Qin, P., Hu, Z. G., Wu, S. Y., Zuo, M. T., and Han, L. (2018). Vertical Heterogeneity and Formation Mechanism of the Platform Edge Reef and Bank Reservoir in Changxing Formation of Eastern Sichuan Basin. Acta Petrologica et Mineralogica 37 (1), 61–74.
Remondino, F., and Gerke, M. (2015). “Oblique Aerial Imagery - a Review,” in Photogrammetric Week 2015 (Stuttgart, Germany: Wichmann/VDE Verlag), 75–83.
Robert, R. (2002). Structure and Composition of Organic Reefs and Carbonate Mud mounds: Concepts and Categories. Earth-Science Rev. 58, 163–231. doi:10.1016/S0012-8252(01)00089-7
Rong, H., Jiao, Y. Q., Wu, L. Q., Li, R., Wang, R., Wang, S. H., et al. (2009). Organic Bioherms and Their Forming Models of Changxing Formation in Manyue-Ganquan Section of Kaix-Ian, Northeast Sichuan. Acta Sedimentologica Sinica 27 (1), 9–17.
Shan, S. C., Wu, Y. Z., Fu, Y. K., and Zhou, P. H. (2021). Shear Mechanical Properties of Anchored Rock Mass under Impact Load. J. Min. Strata Control.Eng. 3 (4), 043034. doi:10.13532/j.jmsce.cn10-1638/td.20211014.001
Shen, A. J., and Chen, Z. E. (2001). Genetic Type of Permian Reefs and its Application to Prediction of Buried Reefs in Nanpanjiang. Pet. Exploration Development 28 (3), 29–34.
Shi, S. Y., Hu, S. Y., Feng, W. J., and Liu, W. (2012). Building Geological Knowledge Database Based on Google Earth Software. Acta Sedimentologica Sinica 30 (5), 869–878. doi:10.14027/j.cnki.cjxb.2012.05.003
Svennevig, K., Guarnieri, P., and Stemmerik, L. (2015). From Oblique Photogrammetry to a 3D Model - Structural Modeling of Kilen, Eastern North Greenland. Comput. Geosciences 83, 120–126. doi:10.1016/j.cageo.2015.07.008
Wang, H. (2017). Research on the Path Planning and Positioning Navigation System of UAV. Hangzhou, China: Master's thesis of Zhejiang University, 20–35.
Wang, L. X., Yin, Y. S., Feng, W. J., Duan, T. Z., Zhao, L., and Zhang, W. B. (2019). Training Image Optimization Method in Multipoint Geostatistics and its Application in Geological Modeling. Pet. Exploration Development 46 (3), 1–7. doi:10.1016/s1876-3804(19)60231-4
Wang, Y. B., Xu, G. R., Lin, Q. X., and Gong, S. Y. (2001). Depositional Model of Early Per-Mian Reef-Island in Eastern Kunlun. Sci. China: Ser. D 31 (3), 243–249. doi:10.1007/BF02907093
Wang, Y. B., Xu, G. R., and Lin, Q. X. (1997). Paleoecological Relations between Coral Reef and Sponge Reef of Late Permian in Cili Area, West Hunan Province. Earth Sci. J. China Univ. Geosciences 22 (2), 135–138.
Woodward, J., Ashworth, P. J., Best, J. L., Sambrook Smith, G. H., and Simpson, C. J. (2003). The Use and Application of GPR in sandy Fluvial Environments: Methodological Considerations. Geol. Soc. Lond. Spec. Publications 211, 127–142. doi:10.1144/gsl.sp.2001.211.01.11
Wu, H. Z., Wu, Y. J., and Ke, G. M. (2017). Bioherm Development Model and Reservoir Prediction of Changxing Formation in Yuanba Area, Northeastern Sichuan Basin. Oil Gas Geology. 38 (4), 645–657.
Wu, S. H., and Li, W. K. (2005). Multiple-point Geostatistics :theory , Application and Perspective. J. Palaeogeogr. 7 (1), 137–144.
Xu, S. C., Li, G. R., Zhang, X. Q., Wu, Y. J., Jing, X. Y., and Liu, Y. Y. (2017). Genetic Mechanism of Reefal Dolostones of the Changxing Formation in Yuanba Area, Northeastern Sichuan Basin. Oil Gas Geology. 38 (4), 729–740.
Yahya, A., El-Khalili, M., Almasri, E., Bala’awi, F., and Al-Massarweh, A. (2020). Heritage Documentation Using Laser Scanner and Photogrammetry: The Case Study of Qasr Al-Abidit, Jordan. Digital Appl. Archaeology Cult. Heritage 16, e00133. doi:10.1016/j.daach.2019.e00133
Yan, Z. L., Xing, F. C., Duan, J. B., Hu, H. R., and Wu, S. Y. (2018). Sedimentary Texture and Reservoir Distribution of Platform Margin Reef Flat Zone in Changxing Formation of Northeastern Sichuan Basin. Xinjiang Pet. Geology. 39 (3), 311–317.
Yang, L. B., Den, W. L., Xu, S. C., Wang, J., Liu, Y. Y., and Ke, G. M. (2017). Geological Characteristics of Sedimentary Microfacies in Reef Flat of Changxin Formation in Guangyuan Gas Reservoir and its Well Logging Identification Method. Well Logging Technology 41 (5), 538–543. doi:10.16489/j.issn.1004-1338.2017.05.008
Yang, L. Q., Guo, L., Zhu, J. F., Gao, Z. C., Zhou, T. Q., Yu, Z. R., et al. (2017). The Development Situation and prospect of Agricultural UAV in China. J. Agric. Mechanization Res. 8, 6–11. doi:10.13427/j.cnki.njyi.2017.08.002
Yin, S. L., Chen, G. Y., Liu, Z. L., Feng, W., and Liu, Y. (2018a). 3D Digital Outcrop Characterization Technology Based on Unmanned Aerial Vehicle Oblique Photography. Acta Sedimentologica Sinica 36 (1), 72–80. doi:10.3969/j.issn.1000-0550.2018.009
Yin, S. L., Gao, Y., Hu, Z. M., Xiong, T., Feng, W. J., Zhao, J. W., et al. (2021). Multiple-point Geostatistical Simulation of Outcrop Based on UAV Oblique Photographic Data: a Case Study of Shihezi Formation in Pingtou Township, Lvliang City, Shanxi. Acta Petrolei Sinica 42 (2), 198–216. doi:10.7623/syxb202102005
Yin, S. L., Tan, Y. Y., Zhang, L., Feng, W., Liu, S. Y., and Jing, J. (2018b). 3D Outcrop Geological Modeling Based on UAV Oblique Photography Data: A Case Study of Pingtouxiang Section in Lüliang City, Shanxi Province. J. Paleogeography 20 (5), 909–924.
Yin, S. L., Wu, S. H., Feng, W. J., Tang, W., Hu, Z. M., and Ren, X. (2013). Variogram Analysis and Simulation on Sedimentary Outcrop Profile of Braided River. J. Cent. South Univ. (Science Technology) 44 (12), 4988–4994. doi:10.1016/j.injury.2013.09.005
Yin, Y. S., Zhang, C. M., Li, J. Y., and Shi, S. Y. (2011). Progress and prospect of Multiple-point Geostatistics. J. Palaeogeogr. 13 (2), 245–252. doi:10.7605/gdlxb.2018.05.064
Yu, S. Y., Li, S. H., Wang, D. P., Wang, J., Zhang, Y. G., and Yu, J. B. (2017). Multipoint Geo-Statistical Modeling Algorithm Based on P-Stable LSH. Acta Petrolei Sinica 38 (12), 1425–1433.
Zhang, C. M., Zhu, R., Zhao, K., Hu, W., Yin, Y. S., Li, S. H., et al. (2017). From End Member to Continuum: Review of Fluvial Facies Model Research. Acta Sedimentologica Sinica 35 (5), 926–944.
Zhang, W. B., Duan, T. Z., Zheng, L., Liu, Z. Q., Xu, H. M., and Zhao, L. (2015). Generation and Application of Three-Dimensional MPS Training Images Based on Shallow Seismic Data. Oil Gas Geology. 36 (6), 1030–1037.
Zhang, W. B., Duan, T. Z., Liu, Y. F., Xu, R., Yang, Z. C., and Zhang, D. M. (2017). Integrated Sedimentary Forward Modeling and Multipoint Geostatistics in Carbonate Platform Simulation : a Case Study of Jupiter Oilfield in Brazil. Acta Petrolei Sinica 38 (8), 925–934.
Zhang, X., Zhao, P., Hu, Q., Ai, M., Hu, D., and Li, J. (2020). A UAV-Based Panoramic Oblique Photogrammetry (POP) Approach Using Spherical Projection. ISPRS J. Photogrammetry Remote Sensing 159, 198–219. doi:10.1016/j.isprsjprs.2019.11.016
Zhao, L., Ke, L., Shang, X. F., and He, T. T. (2017). The Alluvial Fan Reservoir Modeling Based on Seismic Inversion Data and Multiple Information Constraint. J. Northeast Pet. Univ. 41 (1), 63–72.
Zhou, J. N., Tian, J. H., Fan, T. E., Cai, W. T., and Ni, J. E. (2018). Velocity Modeling Method in Reef Reservoir. Prog. Geophys. 33 (1), 347–352.
Zhu, R, K., Bai, B., Yuan, X. J., Luo, Z., Wang, P., Gao, Z. Y., et al. (2013). A New Approach for Outcrop Characterization and Geostatistical Analysis of Meandering Channels Sandbodies within a delta plain Setting Using Digital Outcrop Models: Upper Triassic Yanchang Tight sandstone Formation, Yanhe Outcrop, Ordos Basin. Acta Sedimentologica Sinica 31 (5), 867–877.
Keywords: UAV, 3-D model, outcrop, carbonate reef, shoal facies
Citation: Yin S, Zhao L, Lin Y, Zhu B, Zhao J and Cheng L (2022) Quantitative 3-D Model of Carbonate Reef and Shoal Facies Based on UAV Oblique Photogrammetry Data: A Case Study of the Jiantanba Outcrop in West Hubei, China. Front. Earth Sci. 10:882499. doi: 10.3389/feart.2022.882499
Received: 23 February 2022; Accepted: 11 March 2022;
Published: 12 April 2022.
Edited by:
Hu Li, Southwest Petroleum University, ChinaReviewed by:
Hui Han, Southwest Petroleum University, ChinaCopyright © 2022 Yin, Zhao, Lin, Zhu, Zhao and Cheng. This is an open-access article distributed under the terms of the Creative Commons Attribution License (CC BY). The use, distribution or reproduction in other forums is permitted, provided the original author(s) and the copyright owner(s) are credited and that the original publication in this journal is cited, in accordance with accepted academic practice. No use, distribution or reproduction is permitted which does not comply with these terms.
*Correspondence: Senlin Yin, eWlueGlhbmdfbG92ZUBxcS5jb20=; Lei Zhao, cmF5LXpoYW9AMTYzLmNvbQ==
Disclaimer: All claims expressed in this article are solely those of the authors and do not necessarily represent those of their affiliated organizations, or those of the publisher, the editors and the reviewers. Any product that may be evaluated in this article or claim that may be made by its manufacturer is not guaranteed or endorsed by the publisher.
Research integrity at Frontiers
Learn more about the work of our research integrity team to safeguard the quality of each article we publish.