
94% of researchers rate our articles as excellent or good
Learn more about the work of our research integrity team to safeguard the quality of each article we publish.
Find out more
ORIGINAL RESEARCH article
Front. Earth Sci., 04 July 2022
Sec. Atmospheric Science
Volume 10 - 2022 | https://doi.org/10.3389/feart.2022.881579
This article is part of the Research TopicExtreme Precipitation Events: Spatio-Temporal Connections, Forecasting, Generation, Impact Analysis, Vulnerability and Risk AssessmentView all 13 articles
In this study, the impact of water vapor on the improvement of precipitation simulation in a supercell event over eastern China is investigated by assimilating lightning data into the weather research and forecast (WRF) three-dimensional variational system. The results indicate that the vertical distribution of vapor plays a crucial role in convection precipitation simulation. The WRF alone fails to capture the vertical distribution of vapor, especially at higher altitudes, and vapor simulation is often weak in WRF. Assimilation of lightning data enhances the range and intensity of precipitation forecasts; assimilation of pseudo water vapor transformed from lightning data improves the convection intensification and updraft height of supercells by rectifying the vertical moisture profile. Lightning data assimilation can efficiently compensate for the paucity of observations during supercell growth, and the benefits of lightning data assimilation are concentrated in areas where lightning data is accessible. Further, the importance of microscale water vapor variations, which can be well represented by assimilating pseudo-water vapor, in representing the supercell’s range and intensity is highlighted.
Supercells are strong convective storms with deep and continuous rotating updrafts (Davies-Jones, 2015), accompanied by high-impact weather, such as strong winds, local rainstorms, hails, downbursts, and even tornadoes (Thompson et al., 2003; Bluestein et al., 2019; van Den Broeke 2020; Montopoli et al., 2021), which can cause loss to life and property. Despite major advances in numerical weather prediction, supercell forecast remains challenging due to their local, abrupt, high-intensity, small-scale, fast moving speed, brief lifetime, and other characteristics. It is challenging to comprehend the occurrence and evolution of supercells and increase the forecasting performance.
In the current stage, because of the insufficient physical details of mesoscale weather, especially for cumulus-scale processes, as well as the limitation of model resolution and parameterization, assimilation of different types of observation data to improve the model’s initial conditions is a primary approach for improving the mesoscale weather system forecast performance. In general, radar data, which can capture finer features of mesoscale weather, are assimilated into the model to improve mesoscale weather simulation and forecasting in operating systems and can be applied to nowcasting systems (Yang et al., 2012). Assimilating satellite data can effectively improve the prediction performance of the general circulation models (Bauer et al., 2015). However, conventional observations have coarse spatial and temporal resolutions and are influenced by clouds and aerosols; radar observations generally represent local information in a lower atmosphere and are easily influenced by terrain height; satellite radiances are assimilated in the models as their contributions to the forecast improvement are generally better for atmospheric temperature than for precipitation, and the associated effects are limited to the lower atmosphere owing to their source being the upper atmosphere. Therefore, for supercells with shorter (several hours) lifecycle convection systems, how to achieve maximum improvement effects by data assimilation needs to be further explored in both technical and theoretical aspects.
Lightning can identify areas of deep, mixed-phase convection because it is an important phenomenon that occurs within thunderstorm clouds (Mansell et al., 2007). Studies have indicated that assimilating lightning data is a promising approach to improve forecasts of severe convective precipitation events. For instance, based on an empirical lightning-convective rainfall relationship, Pessi and Businger (2009) showed that the assimilation of lightning data generally improved the simulation of the evolution of a winter storm. Lightning data assimilation can reproduce the observed cold pools during forecast initialization (Mansell et al., 2010). The results of Fierro et al. (2012) showed that the assimilation of lightning data can significantly improve the forecast of tornado outbreaks with respect to the timing and structures of convection (Qie et al., 2014). showed that the representation of convection is markedly improved when lightning data are assimilated.
Lightning data are non-conventional observations; they are generally assimilated into a model by transforming them into other model variables, such as temperature and moisture. Studies have suggested that lightning data can be assimilated into a model by transforming the data into vertical velocity (e.g., Gan et al., 2021), proxy radar reflectivity (e.g., Yang et al., 2015; Chen et al., 2020), ice-phase particles or graupel content (e.g., Allen et al., 2016; Wang et al., 2018; Chen et al., 2019; Kong et al., 2020), and rainfall. The relationship between lightning and model variables is not universal and is sensitive to storm location and climatic state. When vertical velocity, proxy radar reflectivity are used as a proxy variable of lightning, they are easily influenced by local climate and convective intensity, thus may not suitable for lightning data assimilation.
In general, the assimilation of lightning data has a shorter impact time on the forecast because it lacks the adjustment for the water vapor environment. Our recent results suggest that lightning data can be transformed into pseudo water vapor observations (Liu et al., 2021a; Liu et al., 2021b) and has been proven to be a potential approach to improve the forecast performance of convection. Therefore, investigating the water vapor characteristics of convective system by assimilating lightning data with the correct vapor condition could be a potential approach to improve supercell forecasts. The Lightning Mapping Imager (LMI) onboard FengYun-4A (FY-4A) geostationary satellites continuously measures the total lightning activity on high spatial and temporal resolution (Yang et al., 2017). LMI is able to effectively detect lightning events that occur during severe convective events over China (Liu et al., 2020; Chen et al., 2021).
In this study, the lightning data were assimilated into the weather research and forecasting (WRF) model by transforming it into pseudo water vapor observations to reproduce supercell precipitation. The impact and mechanism of lightning data assimilation were also investigated, focusing on the effects of water vapor on the forecast improvement of supercells. We primarily addressed two issues: 1) what changes in water vapor in supercells after lightning data assimilation? Second, what is the mechanism for the improvement of the representation of the supercell? Understanding these issues can be beneficial for deepening our understanding of convection processes.
Two numerical experiments were conducted on a supercell event in eastern China. The next section introduces the model, data, and experimental design as well as gives an overview of a supercell event. The validation of the lightning data assimilation against observations is presented in Section 3. The impact of lightning data assimilation on the forecast is discussed in Section 4. The concluding remarks are presented in the final section.
The supercell case selected in this study occurred near Beijing City in eastern China, which was active from 1000 UTC to 1300 UTC on 9 August 2021, with a maximum wind speed of 21 m s−1 and a maximum gust of 29 m s−1, accompanied by heavy rainfall (over 30 mm h−1) and hail. The strongest precipitation occurred at 1200 UTC, with an in situ observed maximum hourly precipitation of 34.4 mm. Figure 1 shows the evolution of radar reflectivity from 1000 UTC to 1300 UTC. Results show that this was a typical supercell weather case, with the characteristics of high intensity (the strongest echo lasts for 50 dBZ), high speed (speed of approximately 30 km h−1), and a small range (the range of echo intensity exceeding 45 dBZ is approximately 30 km), and it moved from north to south.
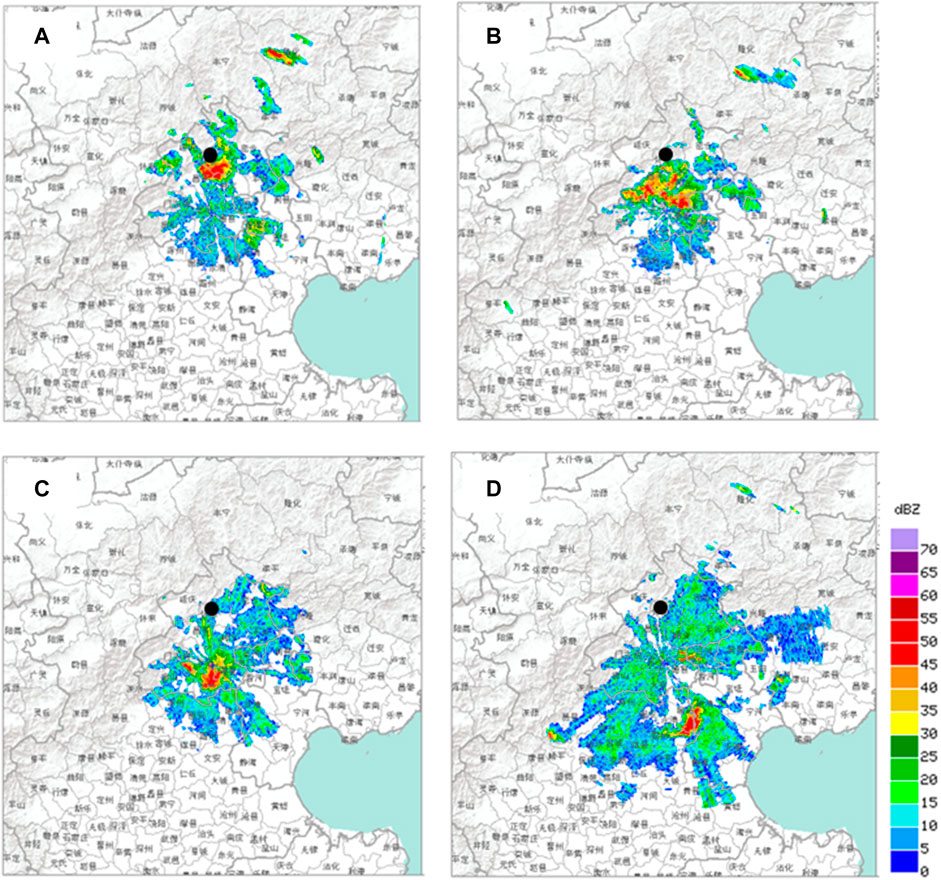
FIGURE 1. Observed radar reflectivity (unit: dBZ) at (A) 1000 UTC, (B) 1100 UTC, (C) 1200 UTC, and (D) 1300 UTC on 9 August 2021.
Figure 2 shows the synoptic weather situation at 1200 UTC on August 9, when the supercell was the strongest. The supercell occurred at a trough extending to the southeast at 500 hPa, with obvious cold advection (Figure 2A). At 750 hPa (Figure 2B), a cyclonic vortex is active in the supercell’s northeastern direction, facilitating the passage of warm, moist air from southern China and maintaining unstable stratification. The near-surface data showed that (Figures 2C,D), in the region of Beijing city, cold dry air from the northwest and warm moist air from the southeast met, promoting the accumulation of convective unstable energy with high convective available potential energy.
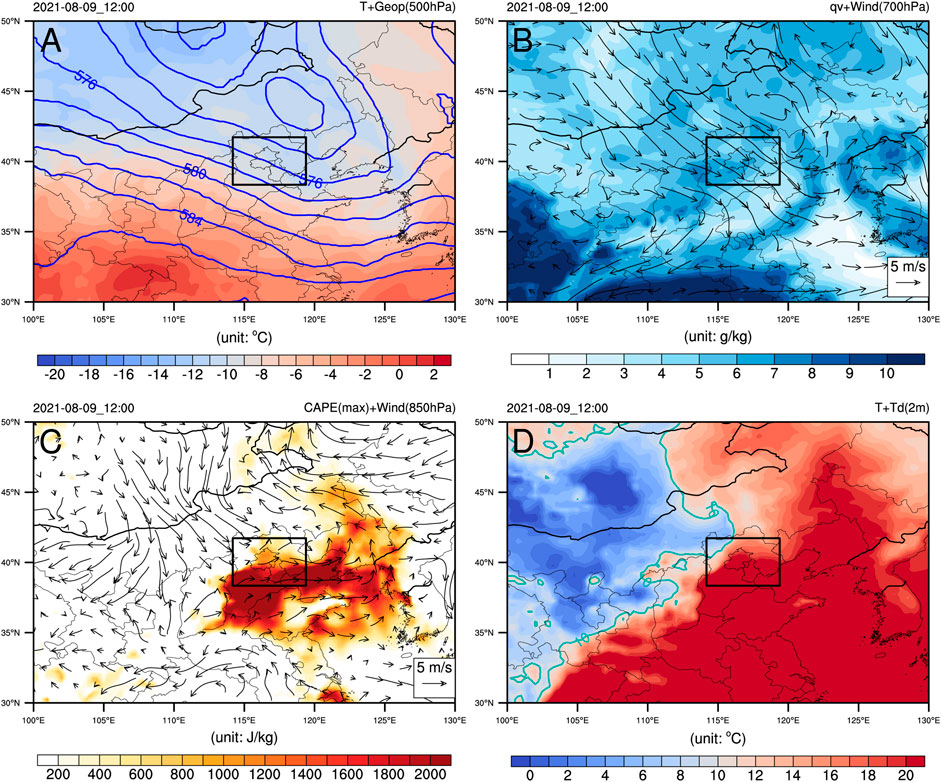
FIGURE 2. Background of general circulation of supercell at 1200 UTC 9 August in terms of (A) geopotential height (blue contours, unit: gpm) and temperature (shaded colors, unit: °C) at 500 hPa, (B) specific humidity (shaded colors, unit: g kg−1) and wind (vectors, unit: m s−1) at 750 hPa, (C) convective available potential energy (shaded colors, unit: J kg−1) and near-surface wind (vectors, unit: m s−1), and (D) near-surface temperature (shaded color, unit: °C) and dew temperature (green contours, unit: °C). The black box denotes the regions where the supercell was active.
An advanced research version of the weather research and forecasting (WRF ARW) model (Skamarock et al., 2008) version 4.2 was employed to simulate this case. Two domains in a two-way nested procedure were used, with grid spacing of 9 and 3 km (Figure 3A), and the innermost domain covers the main activity region of this supercell. A terrain-following (
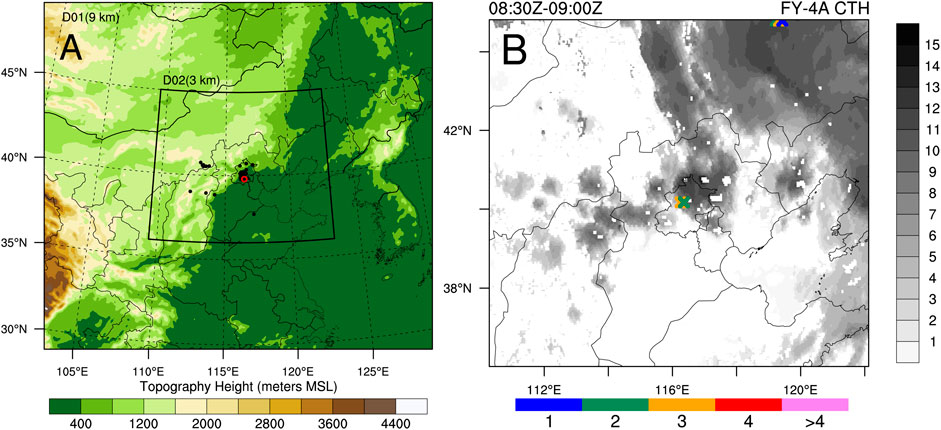
FIGURE 3. (A) Configuration of the two nested weather research and forecasting (WRF) simulation domains in Lambert conformal projection, and the terrain height (shaded colors, unit: m). (B) The accumulated lightning frequency (colored cross signs) from 0,830 to 0900 UTC 9 August and the height of cloud top (gray shaded colors, unit: km). The black and red dots in panel (A) represent in-situ observed surface and sounding stations.
The initial and boundary conditions were derived from the Global Forecast System (GFS), with a temporal resolution of 3 h and a horizontal resolution of 0.25° × 0.25°. Observations used in this study include atmospheric soundings, LMI lightning data from the FY-4A geostationary satellite, in-situ observed precipitation, and radar reflectivity image products. The data were obtained from the China Meteorological Administration (CMA). The ERA5 reanalysis data were used to analyze the synoptic weather conditions, as shown in Figure 2. Note that the simulation and observation data were interpolated at the same grid resolution during the comparison.
The “control” experiment (referred as CTL) simulates from 0600 UTC 9 August to 1200 UTC 9 August 2021 without any data assimilation, whereas the “lightning data assimilation” experiment (referred as LDA) simulates pseudo water vapor created from FY-4A lightning data. In the lightning data assimilation experiment, assimilation was performed only in the innermost domain. The pseudo-water vapor between the lifting condensation level (LCL) and cloud top was first derived from the lightning frequency and then assimilated using the three-dimensional variational (3DVAR) system. The lightning frequency accumulated over 30 min from 0,830 to 0900 UTC. In the assimilation widow, when the observed lightning frequency per grid cell exceeds zero, then the relative humidity of the column in the background field less than 90% will be adjusted to 90%. The adjusted relative humidity field constitutes a three-dimensional pseudo-water vapor observation (Liu et al., 2020). The assimilation window was set from 0,830 to 0900 UTC, and the first 3 h were regarded as the model spin-up period and thus excluded.
Figure 3B shows the accumulated lightning frequency in the assimilation window from 0,830 to 0900 UTC, as well as the height of the cloud top derived from the FY-4A satellite. The data from FY-4A satellite indicated that the supercell is accompanied by vigorous convection, with a mean cloud top above 15 km. More importantly, several lightning events within the supercell were captured using the FY-4A satellite. Because atmospheric sounding data are only available at 0000 UTC and 1200 UTC, lightning data effectively compensates for the lack of observation during this time period and may be useful in improving the model’s initial conditions.
The prediction performance of supercell precipitation is evaluated using forecast skill scores, including equitable threat score (ETS), the probability of detection (POD), false alarm ratio (FAR), and frequency bias (FBI) (Clark et al., 2010). The forecast skill scores are computed by hits (correct forecast of an event), misses (observed but not forecast event), false alarms (forecast but not observed event), and correct negatives (correct forecast of nonevent). Forecast skill scores are defined as follows:
where,
The larger ETS, POD and smaller FAR, the better of the forecast skills. ETS = 1, POD = 1 and FAR = 0 indicate a perfect forecast, while ETS = 0, POD = 0 and FAR = 1 stand for no forecast skill. FBI >1 indicates wet bias and FBI <1 indicates dry bias.
To evaluate the supercell and its precipitation forecast improvement by assimilating lightning data, Figure 4 compares the spatial distribution of hourly precipitation between simulations and observations at 0,900–1000 UTC, 1,000–1100 UTC, and 1,100–1200 UTC. The observation result shows that the observed hourly precipitation gradually strengthened from 0,900 UTC−1200 UTC in Beijing City (Figures 4A,D,G). Although the control-run accurately predicted the position of the observed maximum precipitation, the precipitation was underestimated (Figures 4B,E,H). The maximum precipitation, precipitation range, and their evolution are better portrayed and are closer to observations with the incorporation of lightning data (Figures 4C,F,I), implying that by incorporating lightning data into the model, the model’s performance at simulating supercell precipitation can be improved.
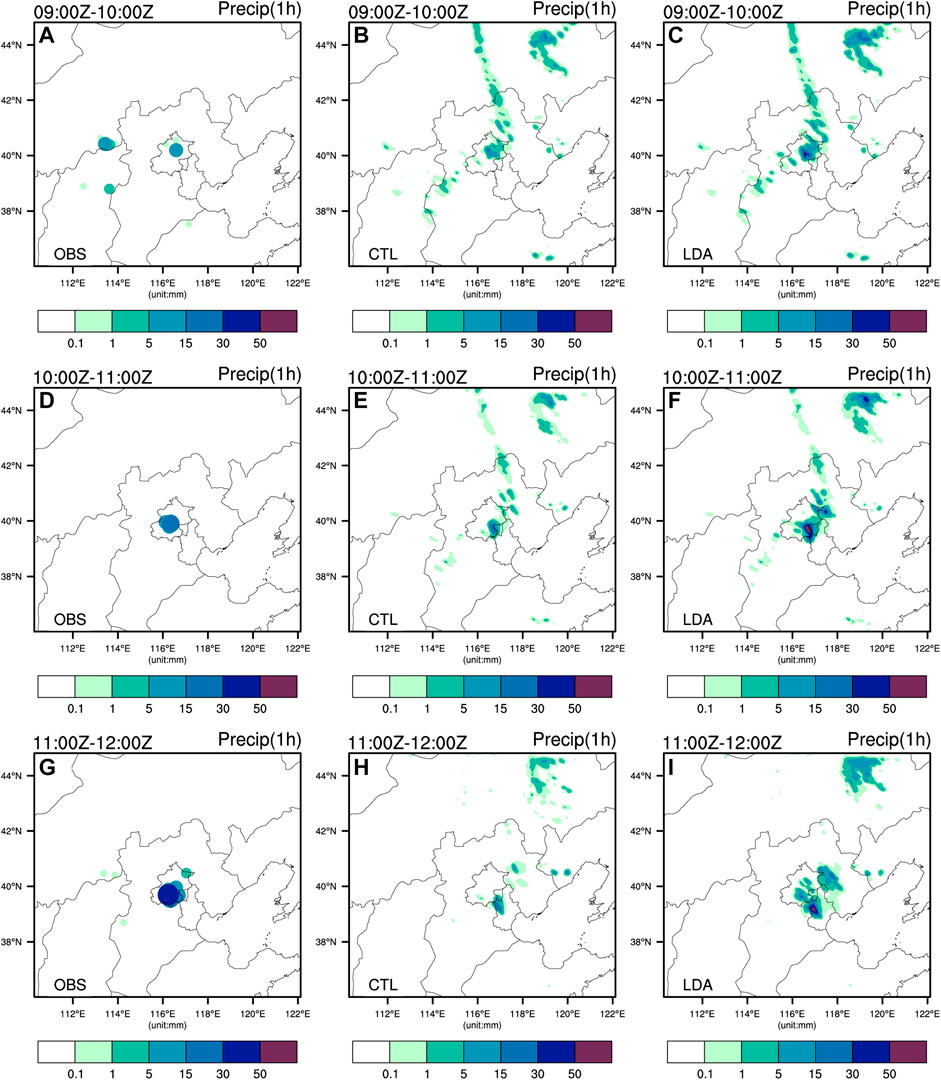
FIGURE 4. Hourly precipitation from (A–C) 0,900 to 1000 UTC (D–f) 1,000 to 1100 UTC, and (G–I) 1,100 to 1200 UTC in (A,D,G) observations (B,E,H) control experiments, and (C,F,I) assimilation experiment.
Figure 5 depicts the performance of the precipitation forecast following lightning data assimilation using an ETS. Table 1 compares the forecast skill scores of POD, FAR and FBI between the CTL experiment and LDA experiment. The result indicates that although the forecast performances were comparable between the two experiments during 0,900–1000 UTC, the control run achieved no forecast skill at different thresholds during 1,000–1100 UTC and 1,100–1200 UTC. With the assimilation of lightning data, the ETS and POD becomes larger at almost all times of the respective threshold, the FAR becomes smaller and FBI closes 1, indicating that lightning data assimilation outperforms the control run. Moreover, the forecast improvement of lightning data assimilation is most obvious for the 1 mm threshold, followed by the 3 and 5 mm thresholds.

FIGURE 5. Comparison of equitable threat score (ETS) for hourly precipitation between different experiment at the threshold of (A) 1 mm, (B) 3 mm, and (C) 5 mm. The gray and blue bars indicate control experiment and assimilation experiment, respectively.
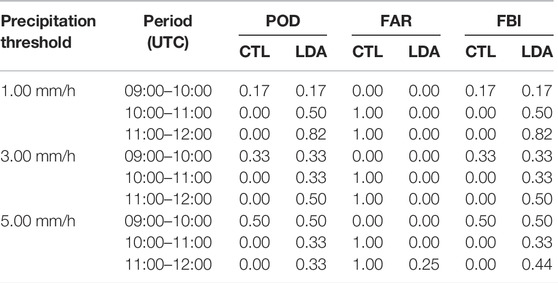
TABLE 1. Forecast skill scores of accumulative precipitation forecast at different thresholds for the control experiment (CTL) and the lightning assimilation experiment (LDA), respectively.
Furthermore, Figure 6 compares the simulated radar reflectivity between the two experiments at 1200 UTC 9 August when the observed supercell convection was the strongest. The result shows that the two simulations accurately simulated the location of the observed radar reflectivity (Figure 1C), and the simulated wind fields are similar to the ERA5 reanalysis. Compared to the control experiment, the simulated radar reflectivity with the assimilation of lightning data has a bigger extent and intensity, which is closer to observations made. In addition, the forecast improvement is positioned mainly within the supercell itself, indicating that the range of influence of lightning data assimilation is limited.
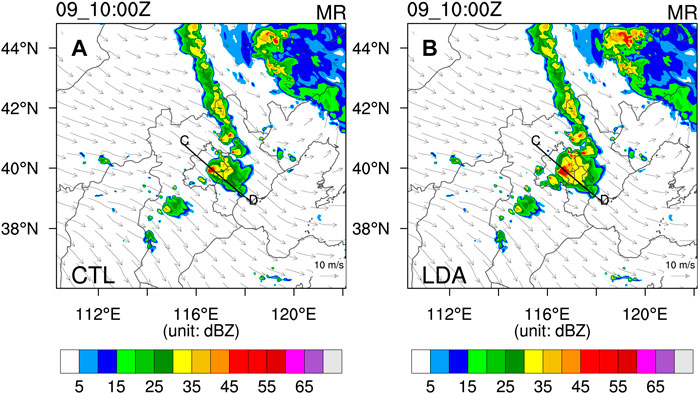
FIGURE 6. Comparison of radar reflectivity (shaded color, unit: dBZ) and wind at 5 km above ground level (vectors, unit: m s−1) at 1200 UTC 9 August between (A) control experiment and (B) assimilation experiment. The black line will be used for cross-section in Figures 9C,D.
The above results indicate that compared to the control run, the assimilation of lightning data evidently improves the range and intensity of the precipitation simulation. Due to satellite-based lightning data is transformed to pseudo water vapor in the assimilation experiment, which means that assimilation of lightning data presumably has a direct impact on moisture conditions.
To better understand the causes of improvement in the supercell event simulation, Figure 7 compares the skew-T sounding results at 1200 UTC 9 August between observations and simulations. The observed result shows that (Figure 7A) a shear line is obvious in the lower atmosphere, where northeastlies exist below 850 hPa and southwestlies exist in a higher atmosphere, providing suitable dynamic conditions for the development of supercells. In addition, the atmosphere between 700 hPa and 500 hPa was almost saturated, suggesting that precipitation formed mainly in these layers. It is also notable that the dew depression (temperature minus dew temperature) is small above 500 hPa, suggesting that clouds are vigorous in higher atmosphere. A comparison of the simulation results in Figure 7B indicates that the assimilation of the lightning data improves the representation of the thermodynamic structure of the entire atmosphere when the supercell is active. Noticeable improvement is evident, especially in atmospheres above 500 hPa, where the simulated dry bias in the control run is alleviated by the incorporting lightning data. Figure 7 also indicates that the most pronounced simulation discrepancies between the two experiments are the thermodynamic structures in the upper troposphere. The assimilation of lightning data reduces the RMSE of temperature and relative humidity (Table 2). The assimilation of lightning data results in a wetter environment at higher altitudes, which encourages the formation of precipitation.
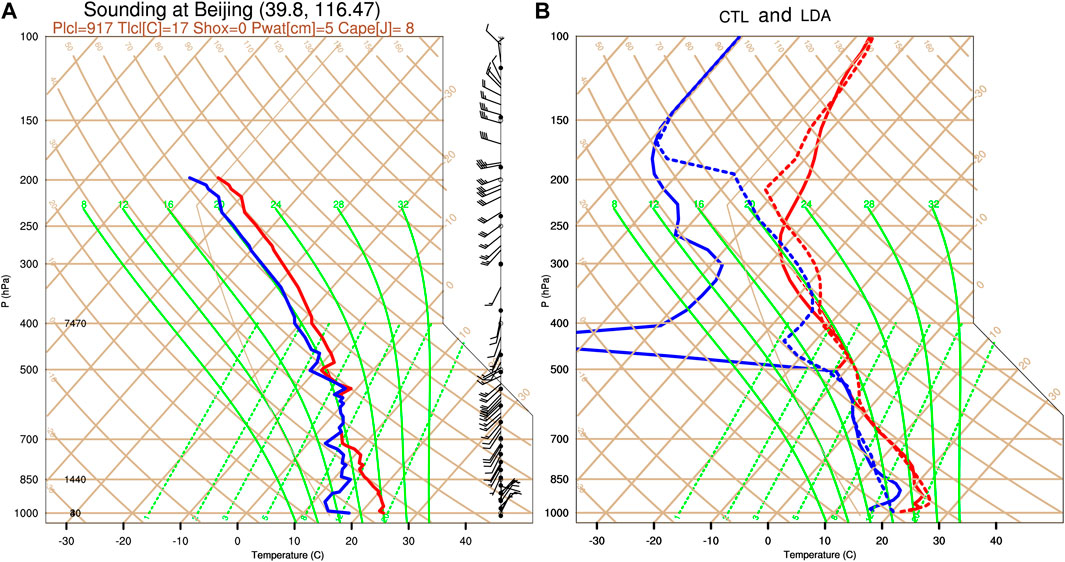
FIGURE 7. Comparison of in-situ soundings at 1200 UTC 9 August between (A) observations and (B) simulations. The solid and dash lines in panel (B) represents control experiment and assimilation experiment, respectively.

TABLE 2. The root mean squared error (RMSE) of temperature and relative humidity in control experiment (CTL) and lightning data assimilation experiment (LDA).
Further comparison of the convective quantities in Table 3 also indicates that, assimilation of lightning data produces weaker convective available potential energy (CAPE) and lower lifting condensation level (LCL) that are closer to observations.

TABLE 3. Comparison of pressure of lifting condensational level (PLCL, unit: hPa) and convective available potential energy (CAPE, unit: J kg−1) between in-situ sounding and simulations of control experiment (CTL) and lightning data assimilation experiment (LDA).
To further examine the improvement in moisture in the supercell by assimilating lightning data, Figure 8 compares the spatial distribution of relative humidity at 300 hPa between the control and assimilation experiments. The results indicate that assimilating lightning data amplifies the range and intensity of humidity in the vicinity of the supercell center (Beijing City). In addition, changes in the assimilation experiment are located within the supercell itself (Figure 8C), indicating that assimilating pseudo-water vapor can increase the water vapor content in the supercell.
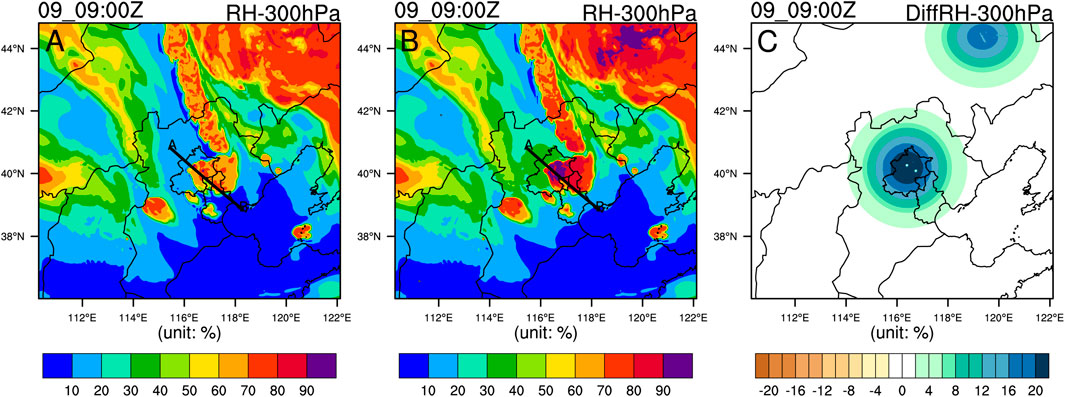
FIGURE 8. Comparison of relative humidity (unit: %) at 300 hPa at 0900 UTC 9 August between (A) control experiment, (B) assimilation experiment, and (C) differences between control experiment and assimilation experiment. The solid lines represent cross-section in Figures 9A,B.
Furthermore, the vertical cross-section of the simulated relative humidity and radar reflectivity between the control and assimilation experiments (Figure 9) indicates that the simulated relative humidity and radar reflectivity are very similar below 6 km; however, the assimilation of lightning data produces a more humid atmosphere and stronger radar reflectivity above 6 km. In general, the cumulonimbus top is approximately 12–15 km, which illustrates that this supercell is high and deep, while control experiment simulates a lower supercell height, and assimilation improves the supercell’s convection height. Observational studies have indicated that the maximum cumulus cloud base in eastern China can reach up to approximately 2,500 m in summer (Liu et al., 2016), implying that lightning data assimilation changes the thermodynamic profile in the whole cumulonimbus, i.e., it improves the supercell vertical structure and intensity.
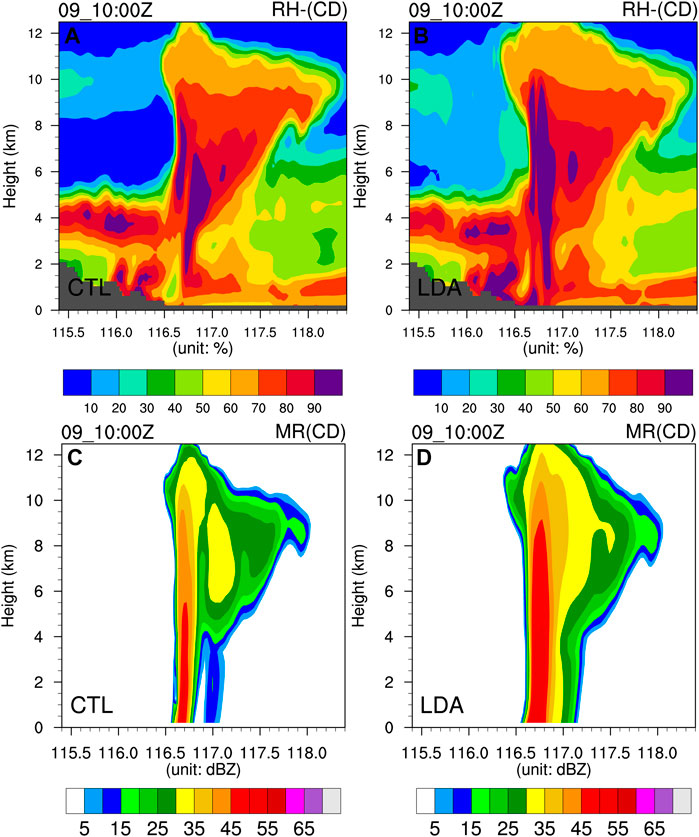
FIGURE 9. Height vs. position cross-section of (A,B) relative humidity (unit: %) and (C,D) radar reflectivity (unit: dBZ) at 1000 UTC 9 August in (A,C) control experiment and (B,D) assimilation experiment.
A comparison of Figure 7−9 indicates that the simulation improvement of the supercell by assimilating lightning data occurs in the higher troposphere, and the simulation improvement of moisture is most distinct, which improves the convection intensity and updraft height. In other words, pseudo-water vapor assimilation improves the simulation of convection intensity and updraft height by enhancing the water vapor content and vertical distribution, especially in the upper part of the supercell, which is more favorable for convection development due to near-saturated water vapor conditions.
Currently, either ground-based or satellite-based lightning observation systems, mainly observe the location of lightning and the intensity of discharge radiation. Therefore, lightning observations, which are not model variables, are difficult to assimilate directly into numerical models. A suitable lightning proxy variable is crucial for the assimilation of lightning observations. Studies have indicated that vertical velocity (Gan et al., 2021), ice-phase particles or graupel content (Qie et al., 2014), and proxy radar reflectivity (Wang et al., 2014; Chen et al., 2020) can be used as lightning proxy variable for lightning assimilation. Papadopoulos et al. (2005) and Mansell et al. (2007) used lightning data to adjust the water vapor content in convective parameterization scheme to active convection. However, this lightning data assimilation method relies on convective parameterization scheme, and is not applicable to convective-scale assimilation. Based on a Nudging method, an empirical formula was proposed to increase the water vapor content at the location of lightning occurrence (Fierro et al., 2015, 2016; Federico et al., 2019; Torcasio et al., 2021); although this is also an effective way to improve model’s moisture field, however, uncertainties exist because of the empirical formula is not suitable for different climatic state and convective intensities. Results of our study indicate that, assimilating lightning data by transforming it to pseudo-water vapor within clouds is an effective approach to improve supercell prediction. Specifically, it is emphasized that suitable water vapor conditions in upper atmosphere are also important for convective system development. In theory, when water vapor is used as a lightning proxy variable, it requires a relative longer spin-up period because of the initialization of convection through the physical parameterization scheme, which can be seen in the limited improvement of lightning data assimilation in the first forecasting hour.
The framework proposed in this study is expected to be useful for understanding the role of water vapor in the upper atmosphere in the development of a supercell. Although the findings of this study are based on only one case study, when compared to the findings of other studies, it is affirmative that assimilating lightning data can distinctly improve the water vapor in convections. Long-term verification or additional cases are undoubtedly required to acquire more reliable results. Besides, assimilation of water vapor in combination with other proxy variables (vertical velocity, ice-phase particles, etc.) could be the potential way to improve supercell simulation.
Based on the assimilation of lightning data derived from FY-4A satellite, this study investigates the potential benefit of water vapor characteristics and their associated changes in convective scale event (supercell). Furthermore, the mechanism of improving supercell simulation by assimilation was also investigated. The major results are summarized as follows:
The mesoscale model generally fails to reproduce precipitation during convection events. In this case, the vertical distribution of water vapor has prominent biases in both its intensity and location. These biases can be rectified by assimilating lightning data if they are readily transformed into pseudo water vapor. Therefore, assimilating lightning data has potential benefits for convection forecasting in the numerical weather prediction.
Forecast improvement of supercells by assimilating satellite-based lightning data is most prominent for thermodynamic profiles in the atmospheres above 3 km (700 hPa), with the maximum improvement above 7 km (400 hPa). In particular, the improvement in the moisture profile is most distinct, which means that lightning data can effectively detect the bottom of convective clouds, assimilation of satellite data can improve the vertical profile of the convective system, and improve the forecasting of the supercell accordingly.
Satellite-based lightning data offers abundant moisture information. Assimilation of lightning data can considerably improve the range and intensity of convective scale precipitation simulations. These improvements are obvious in regions where lightning data are available, demonstrating that the effects of lightning data assimilation are localized.
In the early stage of a thunderstorm, lightning can be detected by satellite. In our case, the lightning data is assimilated when supercell was developing; therefore, assimilating lightning data by transforming lightning to pseudo-water vapor is a potential approach for improving the forecast of convective weather events from its genesis stage to strongest stage, such as supercells. The forecast improvement is closely related to the improvement of water vapor content and its vertical distribution, which implies that moisture in the upper level of a convection event is important, and assimilating lightning data by transforming it into pseudo water vapor observation can rectify the moisture bias in the upper level.
The raw data supporting the conclusions of this article will be made available by the authors, without undue reservation.
HW designed the experiment, conducted the analysis and wrote the initial manuscript; ZH discussed and contributed to the idea; PL processed the data and figures; FZ improved the manuscript.
This study is supported by the Natural Science Foundation of Gansu Province of China (Nos. 20JR10RA654 and 20JR5RA309), and the Fundamental Research Funds for the Central Universities (lzujbky-2021-kb24).
The authors declare that the research was conducted in the absence of any commercial or financial relationships that could be construed as a potential conflict of interest.
All claims expressed in this article are solely those of the authors and do not necessarily represent those of their affiliated organizations, or those of the publisher, the editors and the reviewers. Any product that may be evaluated in this article, or claim that may be made by its manufacturer, is not guaranteed or endorsed by the publisher.
Authors are grateful for efforts by the National Center for Atmospheric Research (NCAR) in making the community research version of the WRF model available on the public website. Computational support by Supercomputing Center of Lanzhou University is also appreciated.
Allen, B. J., Mansell, E. R., Dowell, D. C., and Deierling, W. (2016). Assimilation of Pseudo-GLM Data Using the Ensemble Kalman Filter. Mon. Wea. Rev. 144, 3465–3486. doi:10.1175/mwr-d-16-0117.1
Bauer, P., Thorpe, A., and Brunet, G. (2015). The Quiet Revolution of Numerical Weather Prediction. Nature 525, 47–55. doi:10.1038/nature14956
Bluestein, H. B., Thiem, K. J., Snyder, J. C., and Houser, J. B. (2019). Tornadogenesis and Early Tornado Evolution in the El Reno, Oklahoma, Supercell on 31 May 2013. Mon. Wea. Rev. 147, 2045–2066. doi:10.1175/mwr-d-18-0338.1
Bouttier, F., and Kelly, G. (2001). Observing-system Experiments in the ECMWF 4D-Var Data Assimilation System. Q.J R. Met. Soc. 127 (574), 1469–1488. doi:10.1002/qj.49712757419
Chen, F., and Dudhia, J. (2001). Coupling an Advanced Land Surface-Hydrology Model with the Penn State-NCAR MM5 Modeling System. Part I: Model Implementation and Sensitivity. Mon. Wea. Rev. 129, 569–585. doi:10.1175/1520-0493(2001)129<0569:caalsh>2.0.co;2
Chen, Y., Yu, Z., Han, W., He, J., and Chen, M. (2020). Case Study of a Retrieval Method of 3D Proxy Reflectivity from FY-4A Lightning Data and its Impact on the Assimilation and Forecasting for Severe Rainfall Storms. Remote Sens. 12, 1165. doi:10.3390/rs12071165
Chen, Z., Qie, X., Liu, D., and Xiong, Y. (2019). Lightning Data Assimilation with Comprehensively Nudging Water Contents at Cloud-Resolving Scale Using WRF Model. Atmos. Res. 221, 72–87. doi:10.1016/j.atmosres.2019.02.001
Chen, Z., Qie, X., Sun, J., Xiao, X., Zhang, Y., Cao, D., et al. (2021). Evaluation of Fengyun-4A Lightning Mapping Imager (LMI) Performance during Multiple Convective Episodes over Beijing. Remote Sens. 13, 1746. doi:10.3390/rs13091746
Clark, A. J., Gallus, W. A., and Weisman, M. L. (2010). Neighborhood-Based Verification of Precipitation Forecasts from Convection-Allowing NCAR WRF Model Simulations and the Operational Nam. Weather Forecast. 25 (5), 1495–1509. doi:10.1175/2010waf2222404.1
Davies-Jones, R. (2015). A Review of Supercell and Tornado Dynamics. Atmos. Res. 158-159, 274–291. doi:10.1016/j.atmosres.2014.04.007
Dudhia, J. (1989). Numerical Study of Convection Observed during the Winter Monsoon Experiment Using a Mesoscale Two-Dimensional Model. J. Atmos. Sci. 46, 3077–3107. doi:10.1175/1520-0469(1989)046<3077:nsocod>2.0.co;2
Federico, S., Torcasio, R. C., Avolio, E., Caumont, O., Montopoli, M., Baldini, L., et al. (2019). The Impact of Lightning and Radar Reflectivity Factor Data Assimilation on the Very Short-Term Rainfall Forecasts of RAMS@ISAC: Application to Two Case Studies in Italy. Nat. Hazards Earth Syst. Sci. 19 (8), 1839–1864. doi:10.5194/nhess-19-1839-2019
Fierro, A. O., Clark, A. J., Mansell, E. R., MacGorman, D. R., Dembek, S. R., and Ziegler, C. L. (2015). Impact of Storm-Scale Lightning Data Assimilation on WRF-ARW Precipitation Forecasts during the 2013 Warm Season over the Contiguous United States. Weather Rev. 143, 757–777. doi:10.1175/mwr-d-14-00183.1
Fierro, A. O., Gao, J., Ziegler, C. L., Calhoun, K. M., Mansell, E. R., and MacGorman, D. R. (2016). Assimilation of Flash Extent Data in the Variational Framework at Convection-Allowing Scales: Proof-Of-Concept and Evaluation for the Short-Term Forecast of the 24 May 2011 Tornado Outbreak. Mon. Wea. Rev. 144, 4373–4393. doi:10.1175/mwr-d-16-0053.1
Fierro, A. O., Mansell, E. R., Ziegler, C. L., and MacGorman, D. R. (2012). Application of a Lightning Data Assimilation Technique in the WRF-ARW Model at Cloud-Resolving Scales for the Tornado Outbreak of 24 May 2011. Mon. Weather Rev. 140, 2609–2627. doi:10.1175/mwr-d-11-00299.1
Gan, R., Yang, Y., Qiu, X., Wang, R., Qiu, X., and Zhu, L. (2021). Assimilation of the Maximum Vertical Velocity Converted from Total Lightning Data through the EnSRF Method. J. Geophys. Res. Atmos. 126, e2020JD034300. doi:10.1029/2020jd034300
Jiménez, A. P., Dudhia, J., Gonzalez-Rouco, J. F., Navarro, J., Juan, P., and Garcia-Bustamante, E. (2012). A Revised Scheme for the WRF Surface Layer Formulation. Mon. Wea. Rev. 140, 898–918. doi:10.1175/MWR-D-11-00056.1
Kain, J. S. (2004). The Kain-Fritsch Convective Parameterization: An Update. J. Appl. Meteor. 43, 170–181. doi:10.1175/1520-0450(2004)043<0170:tkcpau>2.0.co;2
Kong, R., Xue, M., Fierro, A. O., Jung, Y., Liu, C., Mansell, E. R., et al. (2020). Assimilation of GOES-R Geostationary Lightning Mapper Flash Extent Density Data in GSI EnKF for the Analysis and Short-Term Forecast of a Mesoscale Convective System. Mon. Weather Rev. 148, 2111–2133. doi:10.1175/mwr-d-19-0192.1
Liu, P., Yang, Y., Gao, J., Wang, Y., and Wang, C. (2020). An Approach for Assimilating FY4 Lightning and Cloud Top Height Data Using 3DVAR. Front. Earth Sci. 8, 288. doi:10.3389/feart.2020.00288
Liu, P., Yang, Y., Lai, A., Wang, Y., Fierro, A. O., Gao, J., et al. (2021a). Assimilating FY-4A Lightning and Radar Data for Improving Short-Term Forecasts of a High-Impact Convective Event with a Dual-Resolution Hybrid 3DEnVAR Method. Remote Sens. 13, 3090. doi:10.3390/rs13163090
Liu, P., Yang, Y., Xin, Y., and Wang, C. (2021b). Impact of Lightning Data Assimilation on Forecasts of a Leeward Slope Precipitation Event in the Western Margin of the Junggar Basin. Remote Sens. 13, 3584. doi:10.3390/rs13183584
Liu, X. M., Zhang, M. J., Wang, S. J., Zhao, P. P., Wang, J., and Zhou, P. P. (2016). Estimation and Analysis of Precipitation Cloud Base Height in China. Meteoro. Mon. 42 (9), 1135. doi:10.7519/j.issn.1000-0526.2016.09.011
Liu, Y., Wang, H., Li, Z., and Wang, Z. (2021). A Verification of the Lightning Detection Data from FY-4A LMI as Compared with ADTD-2. Atmos. Res. 248, 105163. doi:10.1016/j.atmosres.2020.105163
Mansell, E. R., Ziegler, C. L., and MacGorman, D. R. (2007). A Lightning Data Assimilation Technique for Mesoscale Forecast Models. Mon. Wea. Rev. 135, 1732–1748. doi:10.1175/mwr3387.1
Montopoli, M., Picciotti, E., and Baldini, L. (2021). Gazing inside a Giant-Hail-Bearing Mediterranean Supercell by Dual-Polarization Doppler Weather Radar. Atmos. Res. 264, 105852. doi:10.1016/j.atmosres.2021.105852
Papadopoulos, A., Chronis, T. G., and Anagnostou, E. N. (2005). Improving Convective Precipitation Forecasting through Assimilation of Regional Lightning Measurements in a Mesoscale Model. Mon. Weather Rev. 133, 1961–1977. doi:10.1175/mwr2957.1
Pessi, A. T., and Businger, S. (2009). The Impact of Lightning Data Assimilation on a Winter Storm Simulation over the North Pacific Ocean. Mon. Wea. Rev. 137 (10), 3177–3195. doi:10.1175/2009mwr2765.1
Pleim, J. E. (2007). A Combined Local and Nonlocal Closure Model for the Atmospheric Boundary Layer. Part I: Model Description and Testing. J. Appl. Meteor. Climatol. 46, 1383–1395. doi:10.1175/jam2539.1
Qie, X., Zhu, R., Yuan, T., Wu, X., Li, W., and Liu, D. (2014). Application of Total-Lightning Data Assimilation in a Mesoscale Convective System Based on the WRF Model. Atmos. Res. 145-146, 255–266. doi:10.1016/j.atmosres.2014.04.012
Skamarock, W. C., Klemp, J. B., Dudhia, J., Grill, D. O., Barker, D. M., Duda, M. G., et al. (2008). A Description of the Advanced Research WRF Version 3. Boulder, Colorado, USA: NCAR. NCAR/TN-475+STR.125.
Thompson, R. L., Edwards, R., Hart, J. A., Elmore, K. L., and Markowski, P. (2003). Close Proximity Soundings within Supercell Environments Obtained from the Rapid Update Cycle. Wea. Forecast. 18, 1243–1261. doi:10.1175/1520-0434(2003)018<1243:cpswse>2.0.co;2
Torcasio, R. C., Federico, S., Comellas Prat, A., Panegrossi, G., D'Adderio, L. P., and Dietrich, S. (2021). Impact of Lightning Data Assimilation on the Short-Term Precipitation Forecast over the Central Mediterranean Sea. Remote Sens. 13, 682. doi:10.3390/rs13040682
Van Den Broeke, M. (2020). Disdrometer, Polarimetric Radar, and Condensation Nuclei Observations of Supercell and Multicell Storms on 11 June 2018 in Eastern Nebraska. Atmosphere 11, 770. doi:10.3390/atmos11070770
Wang, H., Liu, Y., Zhao, T., Liu, Y., Xu, M., Shen, S., et al. (2018). Continuous Assimilation of Lightning Data Using Time-Lagged Ensembles for a Convection-Allowing Numerical Weather Prediction Model. J. Geophys. Res. Atmos. 123, 9652–9673. doi:10.1029/2018jd028494
Wang, Y., Yang, Y., and Wang, C. (2014). Improving Forecasting of Strong Convection by Assimilating Cloud-To-Ground Lightning Data Using the Physical Initialization Method. Atmos. Res. 150, 31–41. doi:10.1016/j.atmosres.2014.06.017
Yang, J., Zhang, Z., Wei, C., Lu, F., and Guo, Q. (2017). Introducing the New Generation of Chinese Geostationary Weather Satellites, Fengyun-4. Bull. Am. Meteorol. Soc. 98, 1637–1658. doi:10.1175/bams-d-16-0065.1
Keywords: supercell forecast, lightning, data assimilation, pseudo water vapor, modelling
Citation: Wang H, Hu Z, Liu P and Zhang F (2022) Impact of Water Vapor on the Development of a Supercell Over Eastern China. Front. Earth Sci. 10:881579. doi: 10.3389/feart.2022.881579
Received: 22 February 2022; Accepted: 13 June 2022;
Published: 04 July 2022.
Edited by:
Sanjeev Kumar Jha, Indian Institute of Science Education and Research, Bhopal, IndiaReviewed by:
Yoav Yosef Yair, Interdisciplinary Center Herzliya, IsraelCopyright © 2022 Wang, Hu, Liu and Zhang. This is an open-access article distributed under the terms of the Creative Commons Attribution License (CC BY). The use, distribution or reproduction in other forums is permitted, provided the original author(s) and the copyright owner(s) are credited and that the original publication in this journal is cited, in accordance with accepted academic practice. No use, distribution or reproduction is permitted which does not comply with these terms.
*Correspondence: Hao Wang, d2FuZ2hhbzIxNEBtYWlscy51Y2FzLmFjLmNu
Disclaimer: All claims expressed in this article are solely those of the authors and do not necessarily represent those of their affiliated organizations, or those of the publisher, the editors and the reviewers. Any product that may be evaluated in this article or claim that may be made by its manufacturer is not guaranteed or endorsed by the publisher.
Research integrity at Frontiers

Learn more about the work of our research integrity team to safeguard the quality of each article we publish.