 Qi Wang
 Hongyu Duan2
 Yuan Zhang
 Xiaojun Yao
94% of researchers rate our articles as excellent or good
Learn more about the work of our research integrity team to safeguard the quality of each article we publish.
Find out more
ORIGINAL RESEARCH article
Front. Earth Sci., 06 September 2022
Sec. Cryospheric Sciences
Volume 10 - 2022 | https://doi.org/10.3389/feart.2022.881285
Glacial lake outburst floods (GLOFs) are a serious potential threat to the safety of life and property in downstream areas. In this study, moraine-dammed glacial lakes in the Yi’ong Zangbo River basin were recognized based on Landsat ETM+/TM/OLI images in 2000 and 2019. Also, GLOFs for the Jionglaco, the largest glacial lake in this basin, were simulated using the one-dimensional hydrodynamic model. The results show that the total number and area of moraine-dammed glacial lakes in this basin increased by 10 (10.52%) and 5.49 km2 (48.24%) from 2000 to 2019, respectively, in which the area of the Jionglaco increased by 3.22 km2. The peak discharge at the breach outlet for five scenarios with different combinations of breach width (80 and 120 m), depth (2.5 and 5 m), and flood time (1.5 and 3 h) are 489 , 1,327.43, 444.32, 617.47, and 1,570.61 m3/s. With the addition of baseflow in the river, the peak discharge at bridge site 15,138.93 km from Jionglaco, is 1,040.89, 1,724.00, 1,024.85, 1,162.25, and 1,990.52 m3/s. The combination of baseflow in river and the GLOF discharge results in an increasing peak discharge in the further downstream region. However, the arrival of peak discharge in downstream areas is delayed, which increases the chances of people escaping.
Glaciated regions are highly sensitive to climate change (Xu et al., 2009; Chevallier et al., 2011; Shrestha and Aryal, 2011; Haeberli et al., 2013; Mool et al., 2015; Wang and Zhou, 2019), and recent global warming has led to an overwhelming retreat of glaciers and an increase in glacial meltwater, which potentially results in development of supraglacial lakes that coalesce to form proglacial lakes (Maskey et al., 2020). Some glacial lakes are extremely dangerous because of the unstable slopes around them (Maskey et al., 2020). As the dams of these glacial lakes tend to be loose and unstable, the combination of external factors, such as the entry of ice/rock/snow avalanches and landslides, may lead to collapse of the dam and release of water, forming glacial lake outburst floods (GLOFs). Consisting of a mixture of water and sediment, GLOFs can travel at speeds more than tens of kilometers per hour for more than 100 km (Worni et al., 2014). Due to the high volume of emissions and long operational distances, lives and properties in downstream areas would generally suffer heavy losses (Maskey et al., 2020).
There were 5,701 glacial lakes, each with an area above 0.003 km2 in the Qinghai–Tibet Plateau in 2015 (Zhang et al., 2015), and 246 potential dangerous glacial lakes with a total area of 78.38 km2 (Wang et al., 2020). Those glacial lakes with very high and high integrated risk of GLOF disasters are concentrated on the central Himalayas, the central-eastern Nyainqentanglha range, and the southern Tanggula mountains (Yao et al., 2014; Liu et al., 2021). The Yi’ong Zangbo River basin located on the southeastern Qinghai–Tibet Plateau witnessed three GLOF events from 2009–2021, all of which caused significant damage to the downstream area due to high potential energy (Sun et al., 2014; Yao et al., 2014; Liu et al., 2021). Also, a total of 48 glacial lakes had medium–high–very high GLOF susceptibility (Duan et al., 2020). Glacial lakes that broke in the Yi’ong Zangbo River basin belong to moraine-dammed glacial lake, which is similar to that in the Himalayas (Yao et al., 2018). Under climate warming, the recession of glaciers leads to formation of new glacial lakes and expansion of existing glacial lakes, especially for moraine-dammed glacial lakes (Wang et al., 2016; Duan et al., 2020). The quick capacity increase of moraine-dammed glacial lakes can not only enhance hydrostatic pressure to dam, resulting in more vulnerability, but also cause more destruction to infrastructures and lives in the downstream area. Currently, both the early construction of several hydropower plants and continuous improvement of underdeveloped ethnic minority communities need prevention of GLOFs in the Yi’ong Zangbo River basin. In this study, we investigate the change of moraine-dammed glacial lakes in 2000–2019 and simulate the outburst flood of Jionglaco, the largest moraine-dammed glacial lake in the Yi’ong Zangbo River basin, which can provide data support and theoretical basis for GLOF prevention and mitigation in this region.
The Yi’ong Zangbo River basin (30°05′–31°03′ N, 92°52′–95°19′ E), situated in the southern aspect of the Nyainqêntanglha range, is fed by the Yi’ong Zangbo River and covers an area of 13,533 km2 (Figure 1A). The terrain is high in the west and low in the east, with an average altitude of over 4,000 m (Figure 1B). The average annual precipitation is 958 mm, and the peak precipitation occurs in the Indian monsoon season from May to September, which accounts for 74.9% of the annual total precipitation according to records from the nearest (∼151 km) meteorological station in Bomi. The mean annual temperature is 8.8°C, with average temperatures of 16.7°C in July and 0.28°C in January (Ke et al., 2013, 2014). The topographic landforms of high mountains and deep valleys together with Indian monsoons lead to development of distinct temperate valley glaciers and a substantial number of glacial lakes by glacial actions (Figure 1C). Jionglaco (30˚39′44″ N, 94˚29′01″ E), located in the Jinling Township, Bianba County, is a typical moraine-dammed glacial lake fed by a huge maritime glacier (Figure 1C). The glacier melted dramatically, and the glacial lake expanded rapidly toward the glacier terminus with the area of 5.68 km2 in 2020. Meanwhile, there are many villages and bridges located in the downstream area of the glacial lake (Figure 1C).
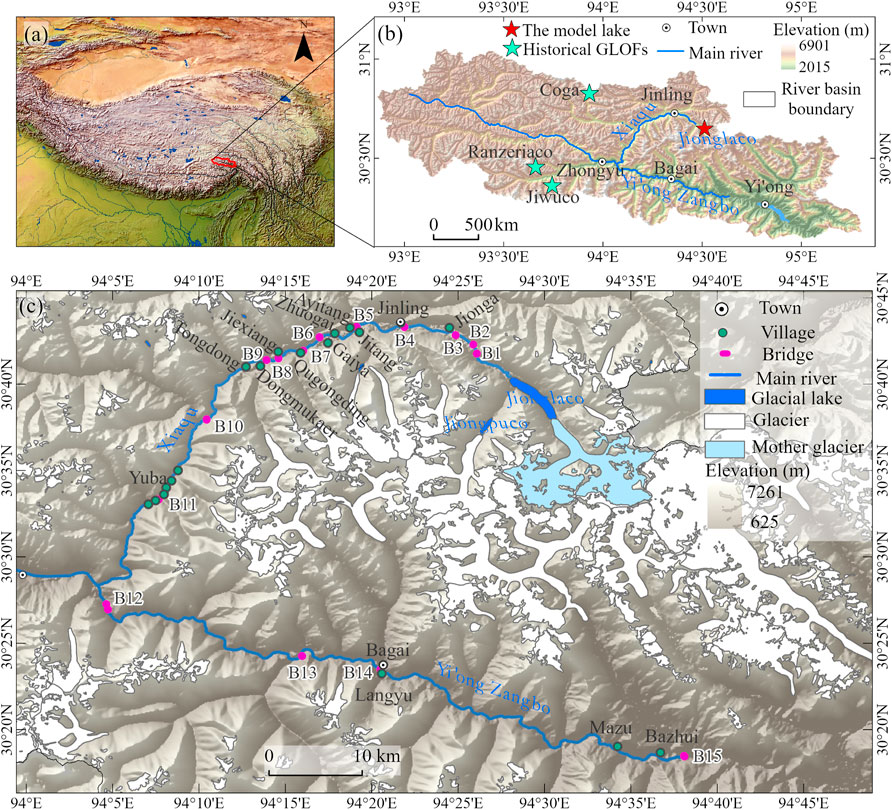
FIGURE 1. Study area showing the (A) location of the Yi’ong Zangbo River basin in the Qinghai–Tibet Plateau, (B) historical GLOFs and Jionglaco, and (C) towns, villages, and bridges along the downstream river of Jionglaco.
As the primary source of medium-spatial resolution Earth observations, the Landsat series images are an important data source for studying glacier and glacial lake changes (Woodcock et al., 2008; Chander et al., 2009). In this study, a total of six scenes of Landsat TM/ETM+/OLI images with little snow and cloud cover, downloaded from the United States Geological Survey (USGS) (http://glovis.usgs.gov/), were used to delineate glacial lakes in the Yi’ong Zangbo River basin in 2000 and 2019 (Table 1). The spatial resolution of Landsat TM is 30 m. Landsat ETM+/OLI images are available in the multi-spectral band of 30 m and panchromatic band of 15 m, fusing the two data results in multi-spectral data with a spatial resolution of 15 m, which is beneficial for accurate extraction of the glacial lake boundary. Also, one scene of GaoFen-6 (GF-6) image downloaded from the Chinese High-Resolution Earth Observation System (CHEOS) (https://login.cheosgrid.org.cn/) was used to delineate Jionglaco and its mother glacier in 2020, the downstream river channel, and the sections from the left bank to right bank. The spatial resolution of the multi-spectral band and panchromatic band for GF-6 images is 4 and 2 m, respectively. After the same processing as Landsat ETM+/OLI, the multi-spectral image with a spatial resolution of 2 m was obtained, which clearly shows the outlines of the Jionglaco glacier and river channel. Because the GF-6 image does not match well with the Landsat image, it was orthorectified using ALOS PALSAR DEM data, with a spatial resolution of 12.5 m.
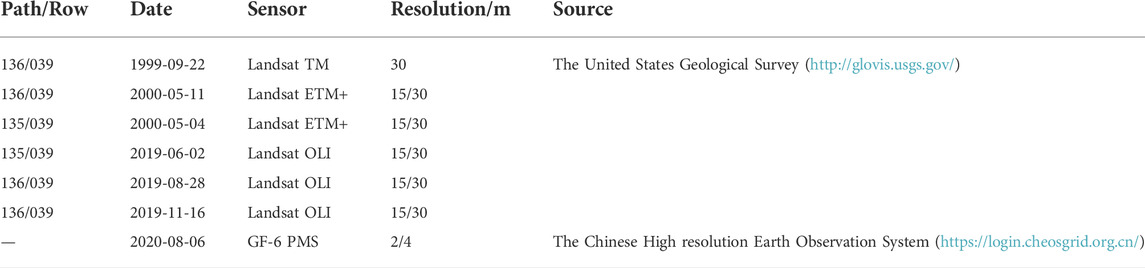
TABLE 1. Remote sensing images used in this study.
Glacial lakes are generally small in area and scattered in the overall region, confusing them easily with the surrounding mountain shadows and snow and other feature information when automated extraction is undertaken. Ultimately, abundant manual checking and revision work after automated extraction is essential (Yang C. et al., 2019). In contrast, manual visual interpretation can flexibly adapt to vectorization of glacial lakes of complex background information and large differences in image quality. Meanwhile, expert empirical knowledge is good at controlling the impact of adverse factors such as shadow, snow, and cloud cover on glacial lake extraction (Yang R. et al., 2019). Therefore, in this study, a manual visual interpretation method was used for extraction of glacial lake outlines, and the area error was controlled within one mixed pixel. Finally, glacial lakes, except for the moraine-dammed lakes, were eliminated based on the classification system of glacial lakes proposed by Yao et al. (2018).
MIKE11 is a specialized software developed by the Danish Hydraulic Institute (DHI) for one-dimensional hydrodynamics, flood forecasting, and dam failure (MIKE11 User Manual, 2003). Jain et al. (2012) carried out GLOF simulation using a one-dimensional MIKE11 model for the largest glacial lake of a river basin in the Garwhal Himalaya, India. Thakur et al. (2016) carried out GLOF simulation for the six hydroelectric power projects in the Dhauliganga river of the Alaknanda Basin based on the MIKE11 model. Mir et al. (2018) used the MIKE11 model to generate the peak hydrographs at the lake and other vulnerable sites downstream. The abovementioned studies demonstrate that Hydrodynamics and Dam Breach modules of the MIKE11 model have powerful capabilities for numerical simulation of rivers and replication and calculation of dam breaching processes. Therefore, the MIKE11 model was used for simulation of GLOFs in this study. The Hydrodynamics module (HD) and Dam Failure module of MIKE11 contains an implicit, finite difference computation of unsteady flows in river and has powerful functions for numerical river simulation and dam failure process calculation (Jain et al., 2012). The model is built with six files: simulation file, river network file, section file, boundary file, parameter file, time-series file, and result file (Table 2).
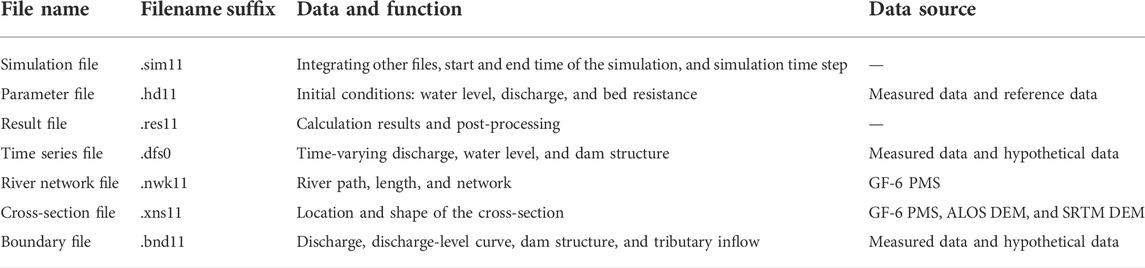
TABLE 2. Description of MIKE11HD modeling files.
A river network is used to define the modeling flood path, which was represented by the manually extracted river centerline from GF-6 PMS images (Figure 2A). Cross-sections are used to reflect the topography of the river channel, which determine the state and calculation of the flood evolution process (Figure 2B). The thalweg reflects the longitudinal specific drop of the simulated river channel, which impacts the travel speed and potential energy of the flood (Figure 2C).
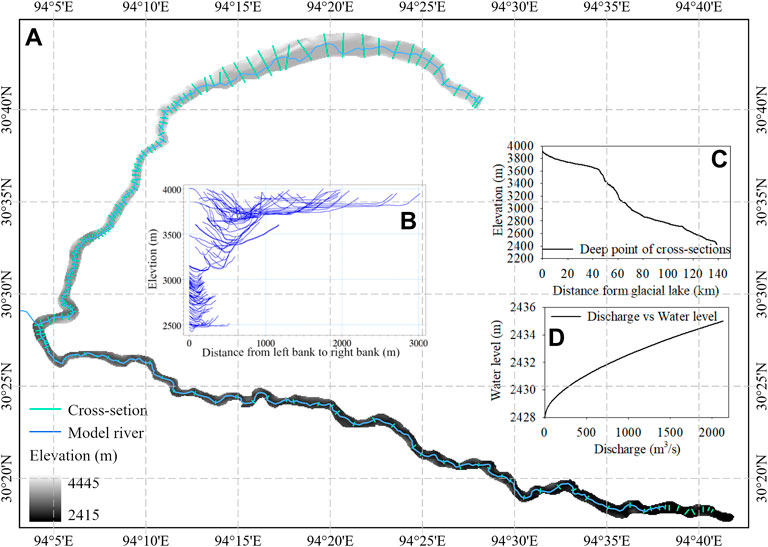
FIGURE 2. River channel, cross-sections, and downstream open boundary of the study area. (A) is simulated channel, (B) is the shape of all cross-sections, (C) indicates the gradient of the river channel, (D) is the downstream boundary condition.
Cross-section data having the greatest impact on the model can usually be obtained from actual measurements and DEM data. The former is more accurate but time-consuming and labor-intensive. By contrast, the latter is easy to obtain, but the accuracy is influenced by the accuracy of the adopted DEM data. Both the measured cross-sections (in the Yi’ong Zangbo River) and DEM-based cross-sections (by the ALOS PULSAR Digital Elevation Model (DEM)) with a spatial resolution of 12.5 m (in the Xiaqu River) are included in this study. The DEM-based cross-sections are extracted roughly every 500–1,000 m along the Xiaqu River (Figures 1B,C).
The boundary file defines the interaction between the model and the external environment, which is divided into two types: open boundary and additional boundary (MIKE11 User Manual, 2003). In this study, the upstream open boundary of the model is the glacial meltwater entering the glacial lake, and because the discharge is relatively small and has an insignificant influence on the model, a steady flow of 1 m3/s was observed. The downstream open boundary is the field-measured water level-discharge relationship at the bridge location downstream of the Bazhui village (Figure 1C and Figure 2D). In addition, five lateral entry flows were set as internal boundaries in this model, representing the baseflow of the river channel consisting of confluent tributaries which is 637.5 m3/s during the flood season (May to October) according to the monitoring data.
The friction of the river channel to a given flow is determined by Manning’s roughness coefficient (Coon, 1998), which is dependent on land use and land cover (LULC) and the roughness of the sediment load of the modeling river channel in the study area. In the study, the value of Manning’s N of cross-sections was obtained from the GLC10 LULC product (http://data.ess.tsinghua.edu.cn/fromglc10_2017v01.html) with a spatial resolution of 10 m. The extent to which all transect widths had covered along the river channel was recorded for the analysis of LULC types in this region. A total of nine types were identified in the potential flood area, of which forest holds the highest proportion of 51.43%, followed by grassland of 21.6% and bare land of 17%. Manning’s N values for them are 0.035, 0.034, and 0.04, respectively. Westoby et al. (2015) stated the value of 0.05 as a global Manning’s N for a flood plain setting consisting of pebbles, cobbles, and boulders. In this study, we took a weighted average of the Manning’s N value for different LULC types based on their area percentages, and finally the value of 0.035 was chosen as the global Manning’s N value for the given flow area.
Lake bathymetric data are the most crucial parameters in the dynamic modeling of GLOFs (Westoby et al., 2014). However, glacial lakes are usually distributed in relatively inaccessible environments, making field studies complicated. Hindered by turbidity, the derivation of reflectance–depth relationships of a lake from satellite sensors has not yet been reliably achieved (Box and Ski, 2007). Consequently, most studies adopted an empirical approach to calculate the volume or depth of a glacial lake (Evans, 1986; O’Connor et al., 2001; Huggel et al., 2002; Yao et al., 2012; Loriaux and Casassa, 2013; Carrivick and Quincey, 2014). In this study, the most widely used relationship proposed by Huggel et al. (2002) was used to estimate the water storage and depth of the Jionglaco.
where V is the volume (m3) and D is the mean depth of a glacial lake (m), and A is the surface area of a glacial lake (m2).
Triggers such as ice/snow avalanches, rock fall, or calving processes usually generate impulse waves, initiating an overtopping of the dam or breach of the moraine, ultimately leading to a GLOF event (Satter et al., 2019). In addition, extreme weather conditions with heavy precipitation or sudden warming can cause the water level of the glacial lake to rapidly rise and even overflow. Based on high-resolution imagery and 3D terrain rendering scene view of ArcGIS Earth software, the mean water level of the Jionglaco was measured as 3,915.5 m and the width of the dam as about 394 m. The moraine dam is flat, and there is a water outlet of about 40 m width on the right side. The dam rises slowly from the outlet to both the ends, reaching a maximum height of approximately 3,920.5 m. Assuming that the breach depth of the dam is half (2.5 m) and full (5 m) of the elevation difference between the highest point of the dam and both the lake surface and the outlet river, the breach width of the dam is twice (80 m) and triple (120 m) the width of the outlet, and the time of the peak flood is 1.5 and 3 h, respectively. Thus, five breach scenarios were designed to simulate the flood process (Table 3).
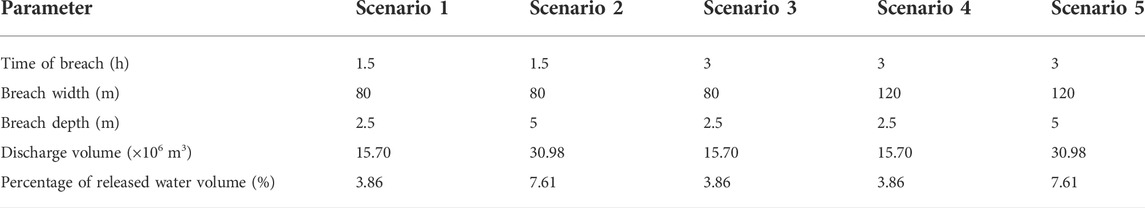
TABLE 3. Model parameters for different GLOF scenarios.
There were 95 moraine-dammed glacial lakes with a total area of 11.38 km2 in the Yi’ong Zangbo River basin in 2000 and 105 moraine-dammed glacial lakes with a total area of 16.87 km2 in the same basin in 2019, with an increasing ratio in the number and area of 10.52 and 48.24% (Table 4), respectively. In 2000, there were three glacial lakes with an area larger than 1.00 km2, corresponding to the total area of 4.58 km2. In 2019, the number of glacial lakes larger than 1.00 km2 remained three; however, the total area has increased to 8.38 km2 (82.97%). The number and total area of glacial lakes in area intervals of 0.10–1.00 km2 and 0.01–0.10 km2 were both increased. However, the number and total area of glacial lakes smaller than 0.01 km2 both decreased during the past decade, which does not indicate that the growth of glacial lakes has stagnated or regressed, but rather that the smaller lakes have been subsumed into other larger-size intervals due to their expansion. As the largest moraine-dammed glacial lake, the Jionglaco’s area has increased from 2.47 km2 in 2000 to 5.69 km2 in 2020, with the average rate of 0.16 km2/a.
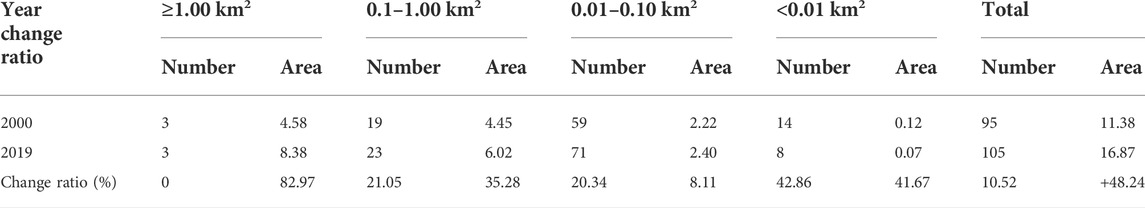
TABLE 4. Number and area of moraine-dammed glacial lakes in 2000 and 2019.
There were three historical GLOF events in the Yi’ong Zangbo River basin, of which glacial lakes are Coga (GLOF date: 2009-07-29, Yao et al., 2014), Ranzeriaco (GLOF date: 2013-07-05, Sun et al., 2014), and Jiwuco (GLOF date: 2020-06-26, Liu et al., 2021),. The areas of the abovementioned three lakes before and after the outburst were 0.42, 0.58, and 0.58 km2 as well as 0.29, 0.25, and 0.27 km2, respectively. At present, the areas for three glacial lakes are 0.36, 0.28, and 0.27 km2, respectively. The area of Coga increases rapidly (24.14%), reaching 85.71% of the area before the GLOF event. In contrast, Ranzeriaco has a little increase (12%) and Jiwuco has a stable area due to the relatively recent time of the GLOF event.
Many bridge sites and villages are distributed in the downstream valley of the Jionglaco. Based on Google Earth imagery and ArcGIS Earth imagery, a total of 15 bridge sites and 20 villages were identified in the study river channel. We only devised statistic for GLOF hydrological processes at the 15 bridge sites, including peak flow, flooding of breach, water level, and flood propagation time. Depending on the height of the dam and the width of the outlet of the Jionglaco, five different scenarios with different combinations of breach width (80 and 120 m), depth (2.5 and 5 m), and flood peak time (1.5 and 3 h) were simulated (Table 3). Each scenario produces a different magnitude of flood peak at the breach outlet (Figure 3). The results show that scenario 5 produces the maximum GLOF peak discharge of 1,570.61 m3/s at the conditions of flood peak time of 3 h and breach width and depth of 120 and 5 m, respectively. Scenario 2 produces the second maximum GLOF peak discharge of 1,327.43 m3/s and has the same breach depth of 5 m. However, the flood peak time and breach width are 1.5 h and 80 m, respectively. Scenario 3 produces the minimum GLOF peak discharge of 444.32 m3/s with condition of the flood peak time of 3 h and breach width and depth of 80 and 2.5 m, respectively.
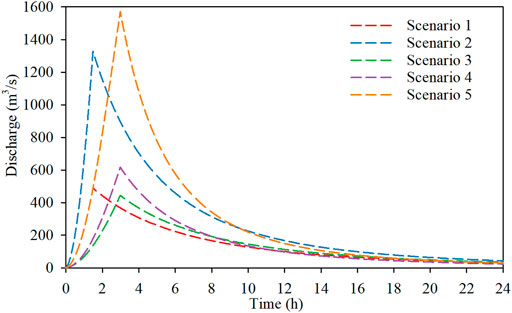
FIGURE 3. GLOF hydrographs of different scenarios at the breach outlet.
The GLOF peak discharge, flood propagation time, water depth, and flow hydrograph at the downstream bridge sites were generated for five scenarios (Supplementary Table SA1 and Figure 4). Considering only the peak discharge caused by GLOFs, it decreases further away from the lake due to surface frictional resistance and head loss along the river path. From the breach outlet to bridge site 15, the peak discharge of five scenarios decreased from 489.00, 1,327.43, 444.32, 617.47, and 1,570.61 m3/s to 403.39, 1,086.5, 387.35, 524.75, and 1,353.02 m3/s, with the reduction ratios of 17.50, 18.15, 12.82,15.02, and 13.85%, respectively (Supplementary Table SA1). However, different bridge sites from upstream to downstream show different change trends due to the dual effects of lateral runoff and flooding. From bridge site 1 to bridge site 4, the peak discharge of five scenarios were reduced from 473.37, 1,285.58, 433.78, 600.72, and 1,532.71 m3/s to 455.17, 1,227.7, 421.72, 580.25, and 1,479.28 m3/s, respectively (Supplementary Table SA1 and Figure 4). However, because of a lateral runoff between bridge site 4 and bridge site 5, the peak discharge at the bridge site 5 of five scenarios were, respectively, increased to 521.35, 1,272.44, 491.72, 644.69, and 1,523.35 m3/s. From bridge site 5 to bridge site 9, the peak discharge gradually decreased from upstream to downstream, and they were 512.68, 1,228.08, 488.44, 632.22, and 1,470.96 m3/s at bridge site 9 for the five scenarios (Supplementary Table SA1 and Figure 4). From bridge site 9 to bridge site 15, the peak discharge flow increases continuously due to addition of lateral runoff, with peak discharges of 1,040.89, 1724.00, 1,024.85, 1,162.25, and 1990.25 m3/s for the five scenarios (Supplementary Table SA1 and Figure 4).
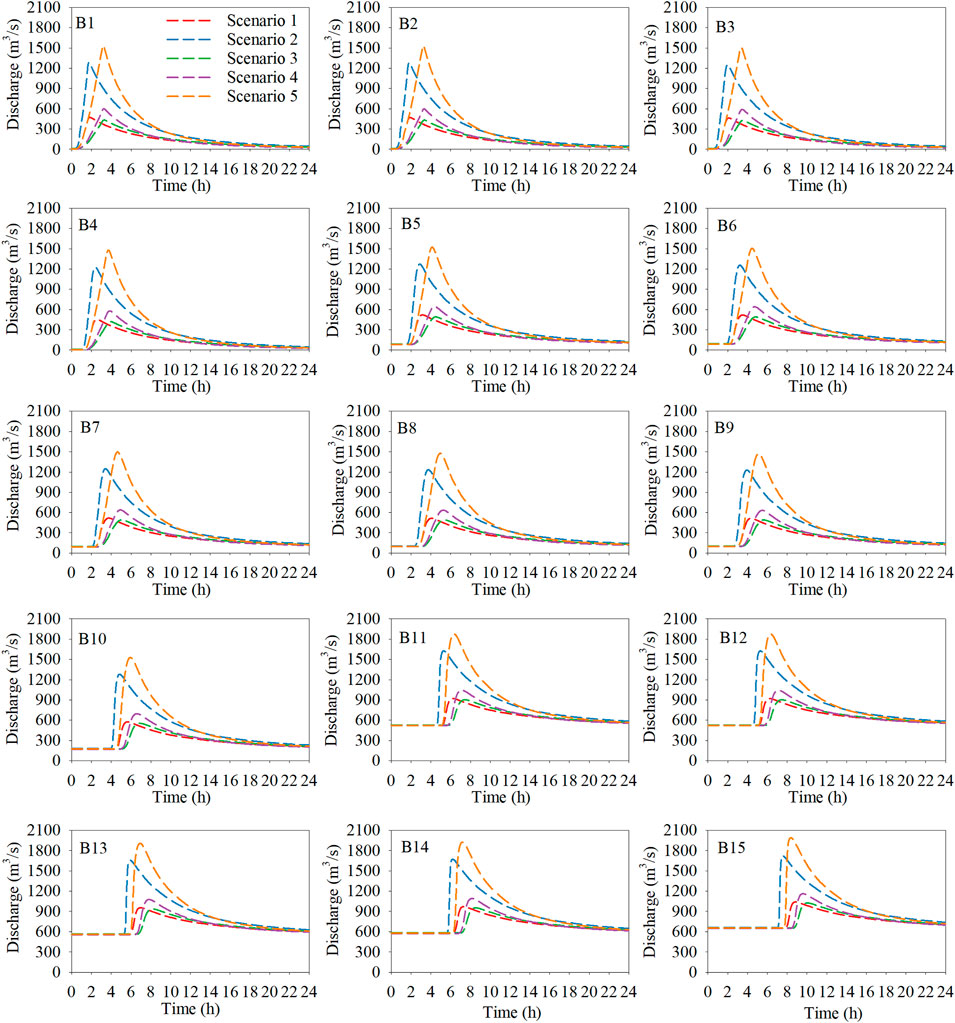
FIGURE 4. GLOF hydrographs of different scenarios at 15 bridge sites.
Bridge sites 3, 5, 9, 11, 14, and 15 are the locations with a high density of settlements (Figure 1C). In the scenario with the maximum peak discharge (1,570.61 m3/s) at the breach outlet, the peak discharges at the abovementioned bridge sites are 1,505.31, 1,523.35, 1,470.96, 1874.61, 1924.24, and 1990.52 m3/s, respectively (Supplementary Table SA1). The peak discharge decreases between bridge site 5 and bridge site 9, after which all show an increasing trend. The flood propagation times for the abovementioned bridge sites are 23 min, 1 h and 8 min, 2 h and 8 min, 3 h and 20 min, 4 h and 11 min, and 5 h and 23 min, respectively (Supplementary Table SA1). Although the peak discharge in the upstream area is smaller than that of the downstream area, flood propagation time is short, leaving insufficient time for people’s transfer. However, longer flood propagation time in downstream areas provides sufficient time for people to move to safe areas if timely warnings are received from upstream areas.
The modelled water depth is prone to uncertainty due to variations in data between the observed water level measured from the mean sea level and the modelled water level based on the WGS-84 data (Thakur et al., 2016). The DEM data used to extract the cross-sections also affect the accuracy of the water depth, and if the DEM data are of high accuracy, the error will be relatively small. The deepest water depth is at bridge site 15, and the shallowest is at bridge site 3, which is influenced both by the shape of the cross-section and the depth of baseflow. A deeper and narrower cross-section as well as more discharge can lead to deeper water depths. In this study, the 6.73 m increase of water level at bridge site 15 is in the extreme scenario (Supplementary Table SA1), whereas at bridge 3, the rise is only 2.55 m.
Glacial lakes with high risk of breaching usually have the following characteristics: 1) being terminal moraine-dammed glacial lakes (Chen et al., 2004; Cui et al., 2008) with the loose material and ice cores comprised as well as unstable and steep structured dam (Xu et al., 1989); 2) having a relatively large area, area change, and steep slopes on both sides (Richardson and Reynolds, 2000); 3) being close to or directly connected to the termini of its mother glacier which has steep slopes in the tongue section and fast change rate (Cheng et al., 2003; Cheng et al., 2008; Cheng et al., 2010); and 4) having a low freeboard. Jionglaco is a typical terminal moraine-dammed glacial lake with a huge area of 5.69 km2 in 2020, which is close to the maximum size of the glacial lake in the Qinghai–Tibet Plateau in 2015 (Yang C. et al., 2019). The Jionglaco is directly connected to its mother glacier, which has retreated rapidly in conjunction with the lake expansion. It has intact lake basin topography, and the average height difference between the water level and dam is only 5 m. These conditions confer a potential risk of GLOFs. Therefore, the Jionglaco was identified as a potentially hazardous glacial lake by Duan et al. (2020) and Wang et al. (2020). However, the dam of the Jionglaco is very flat, and a natural outlet of 40 m in width has formed, which is a favorable condition for maintaining the water balance of the glacial lake and reduces the impact of hydrostatic pressure on the dam. In addition, the dam has been reinforced by the local government to prevent a breach disaster. The presence or absence of ice cores within the moraine dams cannot be determined at present, and further fieldwork is required. The slope in the mother glacier snout is smaller than 10°, which lowers the possibility of ice avalanche into the lake.
The main direct causes of GLOFs on the Qinghai–Tibet Plateau includes (1) ice body, glacier tongue, and mountain slope collapse into the lake, causing surges that overflow the dam and lead to dam failure (Clague and Evans, 2000); 2) a sudden large increase in glacial meltwater or a sudden precipitation event that causes the lake level to rise and overtop the dam, leading to the dam breaking (Richardson and Reynolds, 2000); and 3) melting ice cores in the dam body and infiltration water erosion, leading to the expansion of the pipe surge and eventually the failure of the dam (Yang R. et al., 2019). The main causes of GLOFs in the south-eastern Qinghai–Tibet Plateau are ice avalanches and ice slides, followed by pipe surges (Pu et al., 2004). In contrast, GLOFs in the Himalayas are mainly caused by ice avalanches and ice slides (Richardson and Reynolds, 2000). For the Jionglaco, the possibility of ice avalanche-caused GLOFs is relatively low due to the gentle-sloped glacier tongue. Although the steep slope of the surrounding area may cause landslide material to enter the lake, the huge area of the glacial lake has the stronger bearing capacity for the mass entering the lake. Therefore, the Jionglaco is more resistant to disturbances caused by substances entering it, reducing the pressure on the dam from water fluctuations (Wang et al., 2016). However, the occurrence of GLOFs cannot be ruled out in extreme cases due to the injection of large volumes of water, which may be caused by the large increased meltwater from the mother glacier due to abnormally high temperatures and extensive basin inflow due to extreme precipitation and inflow from other GLOFs. A high-risk glacial lake, Jiongpuco, is located to the southwest of the Jionglaco, which has also undergone an area expansion in the past 20 years (Duan et al., 2020; Wang et al., 2020). Jiongpuco’s outflow directly injects into the Jionglaco; therefore, the hypothetical GLOF of Jiongpuco will probably produce a large disturbance to the Jionglaco, thus triggering the occurrence of GLOFs in the Jionglaco. In addition, there is a lot of floating ice on the lake in the summer of some years, which may collect at the estuary and then block the lake outlet and increase the water level of glacial lake, and eventually cause the overflow of the lake.
The water level–surface area relationship is a critical input parameter of the simulation, which is the data representation of the breaching glacial lake and was calculated by an empirical formula in this study. The empirical formula used to calculate the depth and volume of a glacial lake is a regression function of its area. Due to the huge surface area, the depth and volume of the Jionglaco are likely to be overestimated. However, the use of empirical formulas to calculate volume and depth is the only means when the actual measurement data are lacking. In the future, the measured lake depth data will help improve the accuracy of the simulation.
Currently, there is a lack of adequate grasp of the mechanism of glacial lake outburst flood and the formation of the breaching outlet. The simulation of GLOFs is an approximate physical phenomenon and is carried out according to certain parameters, such as the width, depth of the outlet, and duration of the breach discharge reaching the maximum value. Therefore, these parameters determine the magnitude of the peak discharge of the breach. In this study, the width of the breach is assumed to be twice and thrice the current flow outlet, the depth of the breach is assumed half and full of the current average height of the dam, and the outburst duration is assumed to be 1.5 and 3 h referencing to an already GLOF event of 2.5 h in this basin.
In addition, the evolution of flood in the downstream area is influenced by the shape of the cross-sections, which is the reflection of the downstream river topography. The accuracy of the cross-sections is determined by the accuracy of field measurements or the accuracy of the DEM data. High-quality cross-section data are a guarantee of high-quality simulations. The measured cross-section data have a high degree of accuracy, but the DEM-based data can only reflect the topography above the water surface.
Despite the difficulty in accessing of data, we simulated five GLOF scenarios based on different breach width, depth, and flood peak time using a one-dimensional model. Meanwhile, the flood characteristics at the breach outlet and the 15 bridge sites in the downstream area were analyzed. Generally, the study can provide some reference for the subsequent prevention, mitigation, and control of flood in the region.
The increase in number and area of glacial lakes caused by glacier retreat in context of global warming also increases the likelihood of GLOFs, which pose a huge threat to lives and properties in downstream areas. We delineated 95 moraine-dammed glacial lakes with a total area of 11.38 km2 in 2000 and 105 moraine-dammed glacial lakes with a total area of 16.87 km2 in 2019 in the Yi’ong Zangbo River basin. The largest glacial lake in the basin, the Jionglaco, has experienced a dramatic expansion over the past 20 years, with an area increase of 3.22 km2. When the breach width, depth, and flood peak time is set as 120 m, 5 m, and 3 h, the peak discharge of 1,570.61 m3/s at the breach outlet is the largest. Also, the smallest peak discharge at the breach outlet occurs at the breach width of 80 m, breach depth of 2.5 m, and the flood peak time of 3 h.
In the scenario of the largest peak discharge (1,570.61 m3/s) at the breach outlet, the peak discharges at bridge sites 3, 5, 9, 11, 14, and 15, where the downstream settlements are densely distributed, are 1,505.31, 1,523.35, 1,470.96, 1874.61, 1924.24, and 1990.52 m3/s with the flood propagation times of 23 min, 1 h and 8 min, 2 h and 8 min, 3 h and 20 min, 4 h and 11 min, and 5 h and 23 min, respectively. Compared with downstream areas, the upstream area is at higher risk due to the shorter flood propagation time. If there is early warning communication, the loss of life and property of people in the downstream area will be greatly reduced. Although based on scenario simulations with assumed parameters, this study provides a meaningful reference for understanding GLOFs in the region.
The original contributions presented in the study are included in the article/Supplementary Material. Further inquiries can be directed to the corresponding author.
NL designed this research and improved the manuscript. QW and HD conducted the analysis and wrote this manuscript. All authors contributed to the article and approved this submission.
National Key Research and Development Program of China (No. 2019YFE0127700); The “Innovation Star” of Outstanding Graduate Student Program in Gansu Province (No. 2021-CXZX-215); Northwest Normal University’s 2020 Graduate Research Grant Program (No. 2020KYZZ001012).
Authors appreciate the USGS, CHEOS, ESA, and NASA for their freely available satellite images. The Zhongyu Hydrological Station is also acknowledged for providing us with the measured hydrological data during the outburst. QW and HD thanks all other authors for their technical help and detailed guidance and advice during the preparation of this article.
Authors QW, NL, ZD, PW, BY, JX, and JH are employed by Northwest Engineering Cooperation Limited, Power China.
The remaining authors declare that the research was conducted in the absence of any commercial or financial relationships that could be construed as a potential conflict of interest.
All claims expressed in this article are solely those of the authors and do not necessarily represent those of their affiliated organizations, or those of the publisher, the editors, and the reviewers. Any product that may be evaluated in this article, or claim that may be made by its manufacturer, is not guaranteed or endorsed by the publisher.
The Supplementary Material for this article can be found online at: https://www.frontiersin.org/articles/10.3389/feart.2022.881285/full#supplementary-material
Box, J. E., and Ski, K. (2007). Remote sounding of Greenland supraglacial melt lakes, implications for subglacial hydraulics. J. Glaciol. 53, 257–265. doi:10.3189/172756507782202883
Carrivick, J. L., and Quincey, D. J. (2014). Progressive increase in number and volume of ice-marginal lakes on the western margin of the Greenland ice sheet. Glob. Planet. Change 116, 156–163. doi:10.1016/j.gloplacha.2014.02.009
Chander, G., Markham, B. L., and Helder, D. L. (2009). Summary of current radiometric calibration coefficients for Landsat MSS, TM, ETM+, and EO-1 ALI sensors. Remote Sens. Environ. 113, 893–903. doi:10.1016/j.rse.2009.01.007
Chen, X., Chen, N., and Cui, P. (2004). Calculation of discharge of debris flow induced by glacier lake outburst. J. Glaciol. Geocryol. 26, 357–362. doi:10.1016/S0960-0779(03)00420-X
Cheng, Z., Liu, J., and Liu, J. (2010). Debris flow induced by glacial lake break in southeast tibet. WIT Trans. Eng. Sci. 67, 101–111. doi:10.2495/DEB100091
Cheng, Z., Zhu, P., Dang, C., and Liu, J. (2008). Hazards of debris flow due to glacier lake outburst in southeastern tibet. J. Glaciol. Geocryol. 30, 954–959. 1000-0240(2008).06-0954-06.
Cheng, Z., Zhu, P., and Gong, Y. (2003). Typical debris flow triggered by ice-lake break. J. Mt. Res. 21, 5. doi:10.3969/j.issn.1008-2786.2003.06.013
Chevallier, P., Pouyaud, B., Suarez, W., and Condom, T. (2011). Climate change threats to environment in the tropical andes, glaciers and water resources. Reg. Environ. Change 11, 179–187. doi:10.1007/s10113-010-0177-6
Clague, J. J., and Evans, S. G. (2000). A review of catastrophic drainage of moraine-dammed lakes in British columbia. Quat. Sci. Rev. 19, 1763–1783. doi:10.1016/S0277-3791(00)00090-1
Coon, W. F. (1998). Estimation of roughness coefficients for natural stream channels with vegetated banks. U. S. Geol. Surv. Water Supply Pap. 2441, 1–133. doi:10.3133/wsp2441
Cui, P., Ma, D., and Chen, N. (2008). The initiation, motion and mitigation of debris flow caused by a glacial lake outburst flood, western Norway. Landslides 5, 271–280. doi:10.1016/S0955-2219(02)00073-0
Duan, H., Yao, X., Zhang, D., Qi, M., and Liu, J. (2020). glacial lake changes and identification of potentially dangerous Glacial Lakes in the Yi’ong Zangbo River basin. Water 12, 538. doi:10.3390/w12020538
Evans, S. G. (1986). Landslide damming in the cordillera of western Canada. ASCE: Geotechnical Special Publ n 3, 111–130.
Haeberli, W., Huggel, C., Paul, F., and Zemp, M. (2013). 13.10 glacial responses to climate change. Treatise Geomorphol. 13, 152–175. doi:10.1016/B978-0-12-374739-6.00350-X
Huggel, C., Kääb, A., Haeberli, W., Teysseire, P., and Paul, F. (2002). Remote sensing based assessment of hazards from glacier lake outbursts, A case study in the Swiss alps. Can. Geotech. J. 39, 316–330. doi:10.1139/t01-099
Jain, S. K., Lohani, A. K., Singh, R. D., Chaudhary, A., and Thakural, L. N. (2012). Glacial Lakes and glacial lake outburst flood in a himalayan basin using Remote sensing and GIS. Nat. Hazards (Dordr). 62, 887–899. doi:10.1007/s11069-012-0120-x
Ke, C., Han, Y., and Kou, C. (2014). “Glacier change in the yigong zangbu basin, tibet, China (1988 to 2010),” in Dragon 3mid term results.
Ke, C., Kou, C., Ludwig, R., and Qin, X. (2013). Glacier velocity measurements in the eastern yigong Zangbo basin, tibet, China. J. Glaciol. 59, 1060–1068. doi:10.3189/2013JoG12J234
Liu, J., Zhou, L., Zhang, J., and Zhao, W. (2021). Characteristics of mechanism of jiwengco glacial lake flood outburst in tibet. Geol. Rev. 67, 17–18. doi:10.16509/j.georeview.2021.s1.007
Loriaux, T., and Casassa, G. (2013). Evolution of glacial lakes from the northern patagonia icefield and terrestrial water storage in a sea-level rise context. Glob. Planet. Change 102, 33–40. doi:10.1016/j.gloplacha.2012.12.012
Maskey, S., Kayastha, R. B., and Kayastha, R. (2020). Glacial lakes outburst floods (GLOFs) modelling of thulagi and lower barun glacial lakes of Nepalese Himalaya. Prog. Disaster Sci. 7, 100106–100113. doi:10.1016/j.pdisas.2020.100106
MIKE11 User Manual (2003). MIKE11 user manual. Available at: https://www.tu-braunschweig.de/Medien-DB/geooekologie/mike-11-short-introduction-tutoria.
Mir, R. A., Jain, S. K., Lohani, A. K., and Saraf, A. K. (2018). Glacier recession and glacial lake outburst flood studies in Zanskar basin, western Himalaya. J. Hydrol. 564, 376–396. doi:10.1016/j.jhydrol.2018.05.031
Mool, P. K., Maskey, P. R., Koirala, A., Joshi, S. P., Wu, L., and Shrestha, A. B. (2015). Glacial lakes and glacial lake outburst floods in Nepal. Kathmandu: ICIMOD.
O’Connor, J. E., Hardison, J. H., and Costa, J. E. (2001). Debris flows from failures of neoglacial-age moraine dams in the three sisters and mount jefferson wilderness areas, Oregon. U. S. Geol. Surv. Prof. Pap. 4, 1–93.
Pu, J., Yao, T., Wang, N., Su, Z., and Shen, Y. (2004). Fluctuations of the glaciers on the Qinghai-Tibetan plateau during the past century. J. Glaciol. Geocryol. 26, 517–522.
Richardson, S. D., and Reynolds, J. M. (2000). An overview of glacial hazards in the Himalayas. Quat. Int. 65–66, 31–47. doi:10.1016/S1040-6182(99)00035-X
Sattar, A., Goswami, A., and Kulkarni, A. V. (2019). Hydrodynamic moraine-breach modeling and outburst flood routing - a hazard assessment of the south lhonak lake, Sikkim. Sci. Total Environ. 668, 362–378. doi:10.1016/j.scitotenv.2019.02.388
Shrestha, A. B., and Aryal, R. (2011). Climate change in Nepal and its impact on himalayan glaciers. Reg. Environ. Change 11, 65–77. doi:10.1007/s10113-010-0174-9
Sun, M., Liu, S., Yao, X., and Li, L. (2014). The cause and potential hazard of glacial lake outburst flood occurred on july 5, 2013 in jiali county, tibet. J. Glaciol. Geocryol. 36, 158–165. doi:10.7522/j.issn.1000-0240.2014.0020
Thakur, P. K., Aggarwal, S., Aggarwal, S. P., and Jain, S. K. (2016). One-dimensional hydrodynamic modeling of GLOF and impact on hydropower projects in Dhauliganga river using Remote sensing and GIS applications. Nat. Hazards 83, 1057–1075. doi:10.1007/s11069-016-2363-4
Wang, S., Che, Y., and Xing, M. (2020). Integrated risk assessment of glacier lake outburst flood (GLOF) disaster over the Qinghai–Tibetan plateau (QTP). Landslides 17, 2849–2863. doi:10.1007/s10346-020-01443-1
Wang, S., and Zhou, L. (2019). Integrated impacts of climate change on glacier tourism. Adv. Clim. Change Res. 10, 71–79. doi:10.1016/j.accre.2019.06.006
Wang, X., Liu, Q., Liu, S., Wei, J., and Jiang, Z. (2016). Heterogeneity of glacial lake expansion and its contrasting signals with climate change in Tarim Basin , Central Asia. Environ. Earth Sci. 75, 1–11. doi:10.1007/s12665-016-5498-4
Westoby, M. J., Brasington, J., Glasser, N. F., Hambrey, M. J., Lowe, A., Hassan, M. A. A. M., et al. (2015). Numerical modelling of glacial lake outburst floods using physically based dam-breach models. Earth Surf. Dynam. 3, 171–199. doi:10.5194/esurf-3-171-2015
Westoby, M. J., Glasser, N. F., Brasington, J., Hambrey, M. J., Quincey, D. J., and Reynolds, J. M. (2014). Modelling outburst floods from moraine-dammed glacial lakes. Earth. Sci. Rev. 134, 137–159. doi:10.1016/j.earscirev.2014.03.009
Woodcock, C. E., Allen, R., Anderson, M., Belward, A., Bindschadler, R., Cohen, W., et al. (2008). Free access to Landsat imagery. Science 320, 1011. doi:10.1126/science.320.5879.1011a
Worni, R., Huggel, C., Clague, J. J., Schaub, Y., and Stoffel, M. (2014). Coupling glacial lake impact, dam breach, and flood processes-A modeling perspective. Geomorphology 224, 161–176. doi:10.1016/j.geomorph.2014.06.031
Xu, D., Liu, C., and Feng, Q. (1989). Dangerous glacial lake and outburst features in xizang Himalayas. Acta Geogr. Sin. 44, 343–352.
Xu, J., Grumbine, R. E., Shrestha, A., Eriksson, M., Yang, X., Wang, Y., et al. (2009). The melting Himalayas, cascading effects of climate change on water, biodiversity, and livelihoods. Conserv. Biol. 23, 520–530. doi:10.1111/j.1523-1739.2009.01237.x
Yang, C., Wang, X., Wei, J., Liu, Q., Lu, A., Zhang, Y., et al. (2019a). Chinese glacial lake inventory based on 3S technology method. Dili Xuebao/Acta Geogr. Sin. 74, 544–556. doi:10.11821/dlxb201903011
Yang, R., Zhang, T., Zhu, L., and Ju, J. (2019b). Laigu glacial lake variation and its outburst flood risk in southeast Tibetan plateau. Quat. Sci. 39, 1171–1180. doi:10.11928/j.issn.1001-7410.2019.05.09
Yao, X., Liu, S., Han, L., Sun, M., and Zhao, L. (2018). Definition and classification system of glacial lake for inventory and hazards study. J. Geogr. Sci. 28, 193–205. doi:10.1007/s11442-018-1467-z
Yao, X., Liu, S., Sun, M., Wei, J., and Guo, W. (2012). Volume calculation and analysis of the changes in moraine-dammed lakes in the north himalaya-A case study of longbasaba lake. J. Glaciol. 58, 753–760. doi:10.3189/2012JoG11J048
Yao, X., Liu, S., Sun, M., and Zhang, X. (2014). Study on the glacial lake outburst flood events in tibet since the 20th century. J. Nat. Resour. 29, 1377–1390. doi:10.11849/zrzyxb.2014.08.010
Keywords: glacial lake, GLOF, hydrodynamic modeling, MIKE 11, Qinghai–Tibet Plateau
Citation: Wang Q, Duan H, Liu N, Du Z, Wang P, Yi B, Xu J, Huang J, Zhang Y and Yao X (2022) Change of moraine-dammed glacial lakes and simulation of glacial lake outburst flood in the Yi’ong Zangbo River basin. Front. Earth Sci. 10:881285. doi: 10.3389/feart.2022.881285
Received: 22 February 2022; Accepted: 20 July 2022;
Published: 06 September 2022.
Edited by:
Davide Tiranti, Agenzia Regionale per la Protezione Ambientale del Piemonte (Arpa Piemonte), ItalyReviewed by:
Franco Salerno, National Research Council (CNR), ItalyCopyright © 2022 Wang, Duan, Liu, Du, Wang, Yi, Xu, Huang, Zhang and Yao. This is an open-access article distributed under the terms of the Creative Commons Attribution License (CC BY). The use, distribution or reproduction in other forums is permitted, provided the original author(s) and the copyright owner(s) are credited and that the original publication in this journal is cited, in accordance with accepted academic practice. No use, distribution or reproduction is permitted which does not comply with these terms.
*Correspondence: Pan Wang, d2FuZ3BhbkBud2guY24=
Disclaimer: All claims expressed in this article are solely those of the authors and do not necessarily represent those of their affiliated organizations, or those of the publisher, the editors and the reviewers. Any product that may be evaluated in this article or claim that may be made by its manufacturer is not guaranteed or endorsed by the publisher.
Research integrity at Frontiers
Learn more about the work of our research integrity team to safeguard the quality of each article we publish.