 Yingrui Song
 Yuhong Lei1,2*
 Chao Li
- 1Key Laboratory of Petroleum Resources Research, Institute of Geology and Geophysics, Chinese Academy of Sciences, Beijing, China
- 2Innovation Academy for Earth Science, Chinese Academy of Sciences, Beijing, China
- 3University of Chinese Academy of Sciences, Beijing, China
The current study examines the methane gas hydrate stability zone (GHSZ) in the Shenhu area in the northern South China Sea (SCS) as an example to calculate the thickness of the GHSZ and reconstruct its evolution since 8.2 Ma. Two mechanisms for typical double BSRs in the Shenhu area are shown, and the relationship between the evolving thickness of the GHSZ and the dynamic accumulation of NGHs at typical stations in the Shenhu area is clarified. The results show that the thickness of the GHSZ varies over time with overall thickening in the Shenhu area. The current thickness of the GHSZ is between 160.98 and 267.94 m. Two mechanisms of double BSRs in the Shenhu area are summarized: the double BSRs pattern based on changes in formation temperature, pressure and other conditions and the double BSRs pattern based on differences in gas source and composition. The formation process and occurrence characteristics of double BSRs and hydrate at site SH-W07-2016 in the Shenhu area are also closely related to the changes in thickness of the GHSZ. In addition, the age when gas source first enters the GHSZ has a considerable influence on the dynamic accumulation process of hydrate. Since the formation of hydrate above the BSR at site SH-W07-2016, the GHSZ has experienced up to two periods of thickening and two periods of thinning at this site. With the changes in the thickness of the GHSZ, up to two stages of hydrate formation and at most two stages of hydrate decomposition have occurred. This paper is of great value for understanding the formation of multiple bottom-simulating reflectors (BSRs) as well as the migration, accumulation and dissipation of natural gas hydrate (NGH) during the dynamic accumulation process.
1 Introduction
The gas hydrate stability zone (GHSZ) is the zone of thermodynamic equilibrium of three-phase compounds composed of natural gas hydrate (NGH), water, and gas (Rempel and Buffett, 1997). The thickness of the GHSZ not only determines the maximum possible range of hydrates but is also an important index for NGH exploration and resource evaluation, and it has received extensive attention in recent decades (Kvenvolden, 1993; Sloan and Koh, 2008; Collett, 2009).
The spatial-temporal variability of GSHZ is important for understanding the dynamic accumulation process of hydrate The thickness and spatial distribution characteristics of the GHSZ are very sensitive to temperature and pressure and are also affected by gas composition and pore water salinity (Holder et al., 1987; Collett, 2009). Factors such as geothermal gradient, bottom water temperature (BWT), and climate cause changes in temperature and pressure conditions (Foucher et al., 2000; Zander et al., 2017; Lei et al., 2021); tectonic uplift and folding cause changes in seawater depth (Bangs et al., 2005; Haacke et al., 2007); and differences in hydrate gas source components (Posewang and Mienert, 1999; Andreassen et al., 2000; Lei et al., 2021) may lead to changes in the thickness and spatial distribution of the GHSZ. These changes will lead to a change in GHSZ, which affects the decomposition, migration, and accumulation or dissipation of hydrate, that is the dynamic accumulation process of hydrate (Foucher et al., 2000; Auguy et al., 2017; Pecher et al., 2017; Zander et al., 2017).
Bottom-simulating reflectors (BSRs) are strong impedance contrasts in seismic sections caused by upper hydrate-bearing sediments and lower water- or gas-bearing sediments (Ecker et al., 2000). BSRs are often used as a marker of the lowest formation of hydrate to search for marine gas hydrate (Ruppel et al., 2008; Mosher, 2011; Boswell et al., 2012; Phrampus and Hornbach, 2012). The dynamic accumulation process of hydrate will cause double/multiple BSRs. Clarifying the relationship between multiple BSRs and hydrate is of great significance for improving the success rate of marine hydrate exploration based on BSRs. However, there is not a one-to-one correspondence between the BSR and NGHs (Majumdar et al., 2016; Liu et al., 2017). NGHs were encountered in only 12 out of 35 sites with significant BSRs from 788 sites in the Gulf of Mexico (Majumdar et al., 2016). Moreover, BSR still lacks accuracy in identifying high-saturation hydrates (Majumdar et al., 2016; Liu et al., 2017); NGHs were discovered in 104 (14%) of 753 sites in the Gulf of Mexico without a BSR (Majumdar et al., 2016). The phenomenon of double BSRs or multiple BSRs is found in many hydrate occurrence areas. These include the Storegga Slide area west of Norway (Posewang and Mienert, 1999), the Nankai trough of Japan (Foucher et al., 2000; Baba and Yamada, 2004), the accretionary wedge of the Manila subduction zone (Wu et al., 2005), the southern Hydrate ridge offshore of Oregon (Bangs et al., 2005), the Danube deep-sea fan of the Black Sea (Popescu et al., 2006; Zander et al., 2017), the Kutei Basin offshore of Indonesia (Zhang and Wright, 2017), the Shenhu area on the northern slope of the South China Sea (SCS) (Liang et al., 2017; Wei et al., 2018) and the Dongsha area of the SCS (Li et al., 2015; Jin et al., 2020b). In these previous studies, double/multiple BSRs can be caused by differences in gas components (Posewang and Mienert, 1999; Andreassen et al., 2000; Liang et al., 2017), changes in stratigraphic lithology or mineral composition (Foucher et al., 2000; Martin et al., 2004; Musgrave et al., 2006), or an increased BWT, the pressure drop when the sea level drops, tectonic uplift, seafloor erosion and other factors leading to the change in the GHSZ (Foucher et al., 2000; Bangs et al., 2005; Haacke et al., 2007; Pecher et al., 2017; Zander et al., 2017; Jin et al., 2020b).
The South China Sea (SCS) is rich in NGH resources (Wu et al., 2010; Liang et al., 2014; Zhang et al., 2017). Geophysical exploration and drilling results reveal that double BSRs are common in the SCS, such as at sites SH7, SH-W07-2016 and W17 in the Shenhu area of the Pearl River Mouth Basin (Liang et al., 2017; Qian et al., 2018; Sun et al., 2018; Zhang et al., 2020b). The phenomenon of double BSRs may be related to the dynamic accumulation of hydrate, but is essentially caused by changes in the GHSZ. However, the existing studies on the spatial-temporal evolution of the GHSZ and its relationships with the formation of double BSRs and the dynamic migration, accumulation and dissipation of hydrate are not comprehensive.
The spatial-temporal evolution of the GHSZ can be used to better understand the dynamic decomposition, migration, accumulation and dissipation of gas hydrates and to analyse the formation mechanism of double and multiple BSRs. In view of this, this paper selected the Shenhu area on the northern continental slope of the SCS as the research object, where geophysical and logging while drilling (LWD) data are abundant. In this paper, the evolution and spatial distribution characteristics of the GHSZ in the Shenhu area are simulated, and the relationships between the evolution of the GHSZ and the formation of double BSRs and the dynamic accumulation of hydrates in the Shenhu area are discussed. This work can provide a reference and insights for understanding the distribution of gas hydrate accumulation and clarifying the relationship between BSRs and NGHs in the Shenhu area.
2 Geological Background
The Shenhu area is located in the middle of the Baiyun Sag of the Pearl River Mouth Basin in the northern SCS, which is located in a passive continental margin zone (Figure 1). The Pearl River Mouth Basin has experienced two tectonic evolution stages: Eocene–Oligocene rifting and Neogene-Quaternary postrift depression (He et al., 2017). Cenozoic marine and continental transitional sediments dominated by clay and silt have been deposited from bottom to top (Pang et al., 2007; Zhang et al., 2014). The present depth of the Shenhu area is approximately 800–1700 m (Liang et al., 2014; Zhang et al., 2017, Zhang et al., 2020a; ETOPO1 data), the seabed pressure ranges from approximately 11–14 MPa, the heat flow value ranges from 74 mW/m2 to 78 mW/m2, the geothermal gradient is 45°C/km to 67°C/km, and the temperature of the seawater at the seabed is between 2 and 6°C; thus, these temperature and pressure conditions are suitable for the generation of gas hydrates (Zhang et al., 2017).
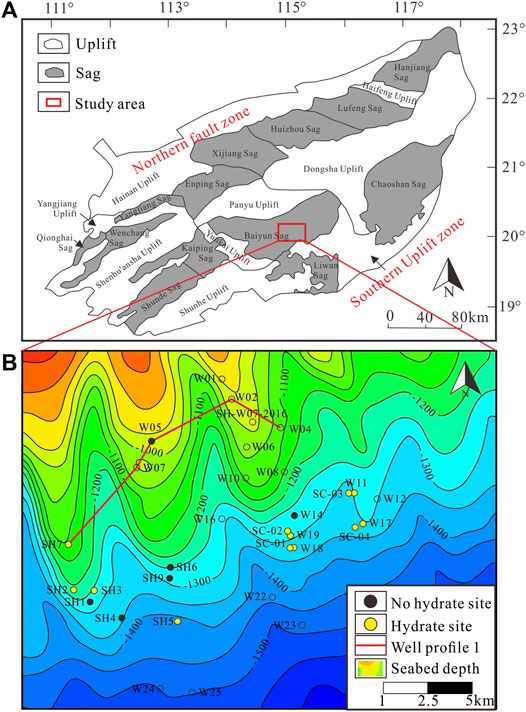
FIGURE 1. The geographical location and well location characteristics of the Shenhu area: (A) Tectonic unit of the Pearl River Mouth Basin; (B) The location and profile of the coring well in this study (the data came from Liang et al., 2014; Zhang et al., 2017).
Three sets of source rocks are developed in the Shenhu area. The Eocene–Oligocene Wenchang and Enping Formations are the main source rocks of thermogenic gas in the Baiyun Sag (Li et al., 2015). The total organic carbon (TOC) of the Wenchang Formation ranges from 0.53% to 6.10%, with an average of 2.63%, and the TOC of the Enping Formation ranges from 0.46% to 1.57%, with an average of 0.89% (Niu et al., 2019). The source rocks of the Wenchang Formation and Enping Formation are in the mature to high-maturity stage, the Ro of the Wenchang Formation ranges from 0.52% to 0.69%, and the Ro of the Enping Formation ranges from 0.55% to 0.88% (Niu et al., 2019). Pliocene and Quaternary marine sedimentary strata are the main source rocks of biogenic gas in the Baiyun sag. Although the abundance of organic matter in Pliocene and Quaternary marine sediments is low, with a TOC ranging from 0.51% to 1.83%, at the immature to low-maturity stage, the organic matter in these strata can also generate a large amount of biogenic gas (He et al., 2013), which provides a sufficient gas source for hydrate formation in the Shenhu area. Faults, fluid diapirs and microfractures are well developed in the Shenhu area. Some faults and diapir structures connect the deep source rocks of the Wenchang and Enping Formations, and a large number of small faults and diapir structures are also developed in the shallow strata (He et al., 2013). These faults, diapirs and fractures are important channels allowing thermal gas from deep strata and biogenic gas from shallow source rocks to move to the GHSZ and provide enough natural gas for the formation of gas hydrate (Su et al., 2017; Zhang et al., 2018). The sufficient gas sources, widely distributed gas migration channels and suitable temperature and pressure conditions all indicate that the Shenhu area is a favourable exploration area for NGHs (Wu et al., 2010; Liang et al., 2014; Su et al., 2016; Zhang et al., 2017).
Starting in the 21st century, China has carried out a series of scientific research and exploration activities for gas hydrates in the SCS and obtained a series of drilling data, including data from a large number of 2D and 3D seismic explorations (Yang et al., 2015, Yang et al., 2017 J.; Zhang et al., 2017; Qian et al., 2018; Sun et al., 2018; Zhang et al., 2020a; Zhang et al., 2020b), hydrate LWD data (Li et al., 2018; Ye et al., 2018, 2020) and data from massive pore-filling gas hydrate-bearing cores (Wang et al., 2014; Su et al., 2016; Yang S. X. et al., 2017; Zhang et al., 2017; Su et al., 2018; Wei et al., 2018; Zhang et al., 2019; Zhang et al., 2020a; Zhang et al., 2020b). From 2007 to 2016, a total of 31 hydrate sites were drilled in the Shenhu area, of which 12 operations encountered hydrate layers. The thickness of the hydrate layer was between 10 and 47 m (Zhang et al., 2007; Wu et al., 2011; Wang et al., 2014; Zhang et al., 2020a; Zhang et al., 2020b), and the porosity of the sediments was between 55% and 65%. Hydrate saturation was approximately 220%–80% (Wang et al., 2014; Yang et al., 2015; Su et al., 2016; Yang J. et al., 2017; Yang S. X. et al., 2017; Zhang et al., 2017; Zhang et al., 2020a; Zhang et al., 2020b). In 2017 and 2020, the Guangzhou Marine Geological Survey (GMGS) carried out hydrate mining experiments in the Shenhu area twice and achieved great success in the 60-day production test (Li et al., 2018; Ye et al., 2018; Ye et al., 2020). The geological and geophysical data and drilling and gas hydrate exploration results all show that the Shenhu area has great gas hydrate exploration and development prospects (Zhang et al., 2007; Wang et al., 2014; Yang et al., 2015; Su et al., 2016; Zhang et al., 2017; Su et al., 2018; Zhang et al., 2019; Zhang et al., 2020a; Zhang et al., 2020b).
3 Methodology and Data
3.1 Method
The GHSZ is the interval in which the three phases of NGH, water and gas reach thermodynamic equilibrium under certain temperature and pressure conditions. NGH in this range is thermodynamically stable (Kvenvolden, 1993; Rempel and Buffett, 1997). The intersection point of the geothermal gradient and the temperature-pressure phase equilibrium boundary below the sea bottom is the bottom boundary of the GHSZ, the seafloor is the top boundary of the GHSZ, and the vertical distance between the top boundary and the bottom boundary is the thickness of the GHSZ. Therefore, the thickness of the GHSZ can be calculated by using the temperature and pressure phase equilibrium equation of gas hydrate combined with the geothermal gradient curve (Dickens and Quinby-Hunt, 1994; Miles, 1995; Brown et al., 1996; Bishnoi and Dholabhai, 1999; Peltzer and Brewer, 2003; Sloan, 2008). The upper BSR usually represents the bottom boundary of the methane GHSZ. To verify the rationality of the simulation results, methane GHSZ was selected for calculation in this research. The calculation method of the theoretical model is as follows:
The methane hydrate phase diagram shows the methane GHSZ as a function of pressure and temperature. By measuring the temperature (T) and pressure (P) of the stability field of methane hydrate in seawater in the laboratory, Miles’s (1995) fourth-order polynomial phase equilibrium equation of temperature (T) and pressure (P) Eq. 1 is more suitable for the calculation of GHSZ thickness in continental margin areas:
where P is the pressure, MPa; T is temperature, K; C is the constant term of the fitting relation, with a value of 2.8074023. m1, m2, m3 and m4 denote fitting coefficients of polynomials under different conditions, with values of m1 = 1.559474 × 10⁻¹, m2 = 4.8275 × 10⁻², m3 = −2.78083 × 10⁻³, and m4 = 1.5922 × 10⁻⁴.
In the calculation, the range of the GHSZ is calculated by assuming that the gas consists entirely of methane. The transformation relationship between pressure (P) and depth (
where
The calculation equation of the geothermal gradient (
where
When temperature is taken as the varied parameter, the functional relations (4) and (5) with temperature as the independent variable and
When Eqs 4, 5 are equal, the value of h is the thickness of the GHSZ.
3.2 Data
3.2.1 Seawater Depth Data
The present seawater depth (D) is an important parameter in calculating the thickness of the present GHSZ. The present seawater depth in the Shenhu area varies from 730 m in the northwest to 1,650 m in the southeast (Figure 1).
The paleo-seawater depth is the main parameter involved in calculating the paleo-GHSZ, and the paleo-seawater depth (
where
Pang et al. (2007) studied the deep-water fan system of the Pearl River Mouth Basin in the SCS. The history of relative sea level change in the Pearl River Mouth Basin was established by analysing the coupled relationship between the large continental shelf delta and the Pearl River Mouth Basin deep-water fan system on the slope. The relative sea level change data over time in this study (△H1) refer to the research results of Pang et al. (2007) (Figure 2A).
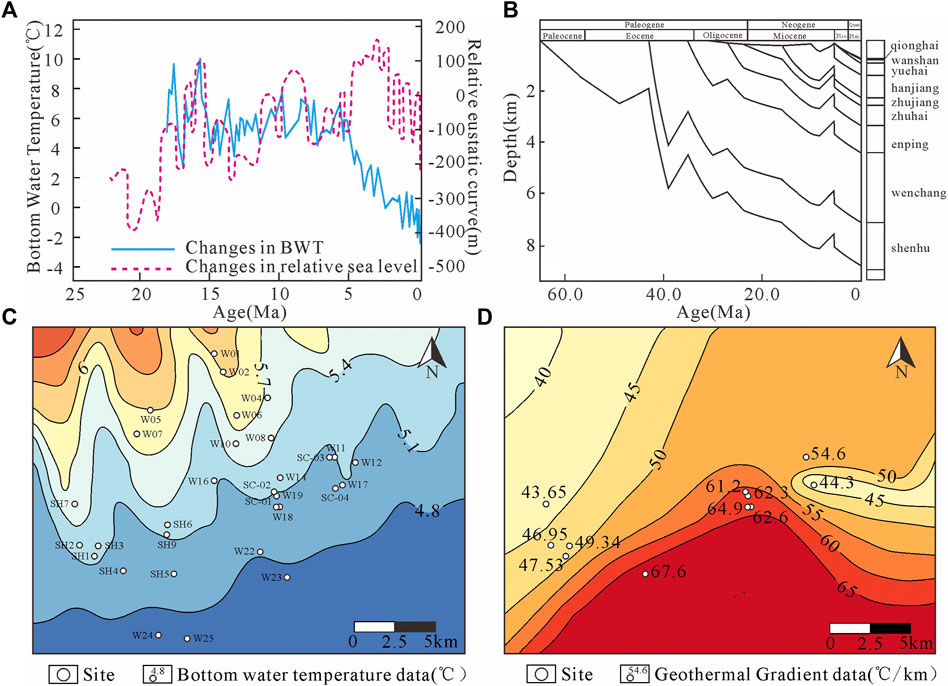
FIGURE 2. (A) Changes in relative sea level and BWT at ODP 806 in the Pearl River Mouth Basin in the northern SCS (modified from Pang et al., 2007 and Lear et al., 2015); (B) Burial history of a single well in the Shenhu area, northern SCS; (C) The BWT characteristics in the Shenhu area, northern SCS; (D) The geothermal gradient characteristics in the Shenhu area, northern South China Sea (the data come from Su et al., 2016; Zhang et al., 2020a; Jin et al., 2020b).
The seafloor subsidence history (
3.2.2 BWT
Zhu, 2007 established a fitting calculation equation for the present bottom water temperature (BWT) (Ts) and seawater depth (D) based on BWT and seawater depth data from the continental margin basins of the northern SCS. The results show that there is a certain deviation between the calculated BWT data and the measured BWT data. However, it can be seen from the World Ocean Atlas 2013 that the annual variability in the BWT in the Shenhu area is approximately ±2°C, so this error is within the normal range of ±2°C. According to Formula 3, the increase in BWT is accompanied by a decrease in GHSZ. The corrected value in Formula 7 is larger than the average value, and the thickness of the GHSZ is correspondingly thinner. Although the BWT changes naturally within a year, it does not affect the change within the minimum range of the GHSZ. The change in BWT had little influence on subsequent analysis.
The measured temperature data of 10 wells, such as SH1 in the Shenhu area, were used as the benchmark to calibrate the equation, and the temperature-depth equation after correction is shown in Eq. 7. After numerical correction, the relative error between the measured and corrected BWT is between ±0.38% and 13.35% (Table 1), which is within the error range. Therefore, the equation of Zhu, 2007 was adopted in this study to calculate the present seabed temperature in the Shenhu area by correcting the measured BWT (Figure 2C).
where
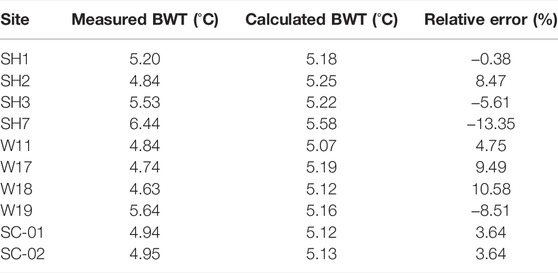
TABLE 1. Calculation parameters of the BWT (Zhu et al., 2013; Zhang et al., 2020a; Zhang et al., 2020b).
Lear et al. (2015) used δ18O and Mg/Ca records of the infaunal benthic foraminifer O. umbonatus from Ocean Drilling Program (ODP) Site 806 (equatorial Pacific; ∼2,500 m) since 17 Ma in an adjacent research area (Figure 2A).
According to the present BWT and the research results of Lear et al. (2015), paleo-BWT (TP) is a function of the present BWT (Ts) and the relative change in BWT (
where
In addition, when the temperature changes, heat transfer occurs inside the model. The model should follow the basic theory of heat transfer and consider the calculation process of heat transfer. However, the process of temperature conduction and the change in hydrate phase state usually does not exceed several decades, which is far less than the time unit studied in this model (millions of years, Ma) (Zander et al., 2017). It is considered that temperature changes in the model will be rapidly converted to GHSZ changes. The possible changes caused by the thermal conductivity process are ignored.
3.2.3 Pressure
The measured drilling pressure in the Shenhu area shows that the present shallow formation pressure is at a normal pressure. Therefore, the formation pressure used to calculate the GHSZ in the Shenhu area is hydrostatic pressure, which can be obtained by Eq. 2. Sea level rise and fall directly cause changes in hydrostatic pressure, which affects the thickness of the GHSZ. As sea level rises, hydrostatic pressure increases. As sea level falls, hydrostatic pressure decreases. The paleo-seawater depth in different periods can be obtained by Eq. 7, and the paleo-formation pressure can be calculated by Eq. 8. The seawater density (ρ) of the Shenhu area is approximately 1.035 g/m3 (Wang et al., 2013). The atmospheric pressure value (Patm) was set to 0.101325 mPa, and the gravitational acceleration (g) was 9.81 m/s2.
3.2.4 Geothermal Gradient
According to the measured geothermal gradients of 11 wells in the Shenhu area (Su et al., 2016; Jin et al., 2020a; Zhang et al., 2020a; Zhang et al., 2020b) and the geothermal gradient trend of the Pearl River Mouth Basin at a shallow depth of 3,000 m observed by Hu et al. (2019), the present distribution of geothermal gradient values in the Shenhu area is drawn in Figure 2D. The geothermal gradient in the Shenhu area varies between 39.44°C/km and 70.20°C/km and is generally low in the northwest and high in the southeast (Figure 2D).
Liu et al. (2018) studied the geothermal gradient evolution history of the Baiyun Sag, and the relationship between the geothermal gradient (
where
4 Results
Using the above methods and parameters, the evolution process of the GHSZ since 8.2 Ma in the Shenhu area was simulated.
4.1 The Calibration Results
Using the method described above, the present GHSZ thickness in 10 wells, such as SH1, was calculated and compared with the actual drilled GHSZ thickness (Table 2). The relative errors for all wells ranged from ±0.96% to 10.98%, indicating that the calculated results were generally reliable.
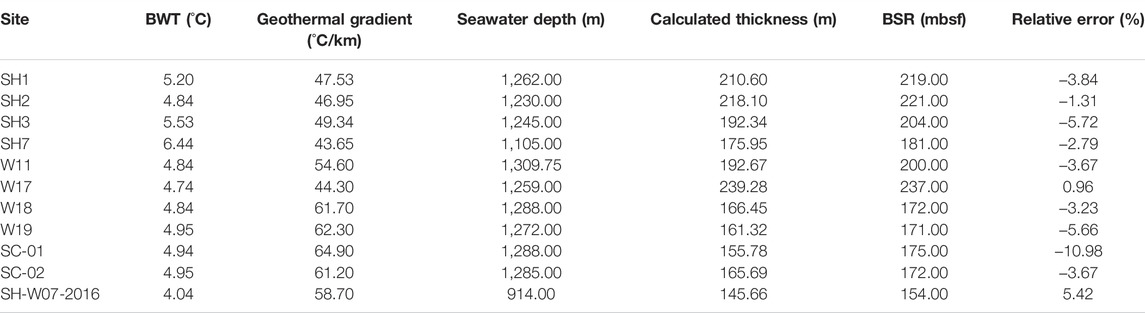
TABLE 2. Calculation parameters and results of the GHSZ (BWT data are from Zhu et al., 2013; Zhang et al., 2020a, Zhang et al., 2020b. Geothermal gradient data are from Su et al., 2016; Zhang et al., 2020a, Zhang et al., 2020b; Jin et al., 2020a. Seawater depth data are from Wang et al., 2014; Zhang et al., 2019; WOA13 V2. Seawater density data are from Wang et al., 2013. BSR data are from Wu et al., 2011; Wang et al., 2014; Su et al., 2016; Liang et al., 2017; Jin et al., 2020a).
4.2 Evolution of the GHSZ
The evolution characteristics of the GHSZ thickness in nine wells since 8.2 Ma show that the GHSZ in these nine wells was very thin before 5.33 Ma, generally less than 40 m. From 4.62 Ma to 0 Ma, overall, the GHSZ thickness gradually increased. However, due to the influence of sea level rise and fall, temperature change and other factors, the GHSZ underwent several cycles of thickening and thinning during this period. The overall variation trend of the thickness of the GHSZ in each well is similar, but the amplitudes of thickening and thinning of the GHSZ differ (Figure 3).
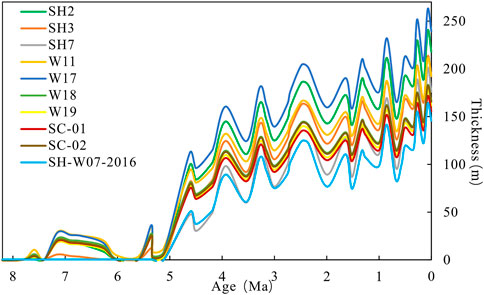
FIGURE 3. The thickness change in the GHSZ at different single sites since 8.2 Ma.
The evolution characteristics of the thickness of the GHSZ in Section 1 spanning five wells (i.e., SH7, W07, W05, W02, and W04) in the Shenhu area (section location is shown in Figure 1) show that the evolution trend of the section is consistent with that of individual wells (Figure 4). At 5.33 Ma, the overall thickness of the GHSZ was less than 30 m or did not exist. The thickness of the GHSZ at 3.93 Ma was significantly thicker than that at 5.33 Ma, ranging from 80 to 140 m. The thickness of the GHSZ in wells SH7 and W07 was approximately 140 m. At 3.53 Ma, the GHSZ thinned to approximately 40–100 m, and the thickest GHSZ was approximately 100 m. The thickness of the GHSZ at 1.51 Ma was also reduced and was approximately 60–140 m thick. By 0 Ma, the thickness of the GHSZ had increased to 140–220 m.
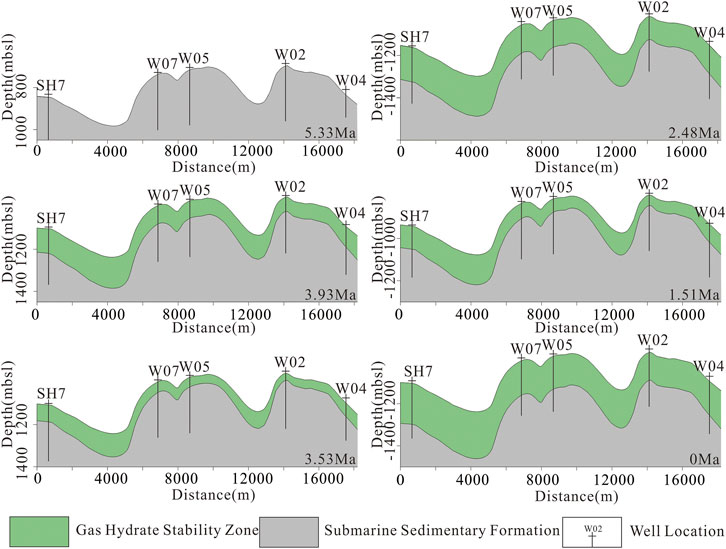
FIGURE 4. Thickness variation in the GHSZ in Section 1 since 5.33 Ma.
The thickness evolution characteristics of the GHSZ in the Shenhu area show (Figure 5) that the overall trend of the study area is in line with the evolution trend of the profile and individual wells. At 5.33 Ma, the thickness of the GHSZ in the Shenhu area was relatively thin, ranging from 0.31 to 45.52 m, and the thickness gradually increased from NW to SE. The thickness of the GHSZ at 3.93 Ma was significantly different from that at 5.33 Ma. The thickness of the GHSZ increased significantly, and the thickness varied between 24.94 and 184.24 m. At 3.53 Ma, the thickness distribution of the GHSZ was similar to that at 3.93 Ma, but the thickness was generally thinner, ranging from 0.44 to 149.65 m. At 2.48 Ma, the GHSZ became thicker as a whole, with a thickness between 79.03 and 229.22 m. The thickness of the GHSZ at 1.51 Ma was generally thinner, ranging from 0.46 to 187.50 m. At present, the thickness of the GHSZ in the Shenhu area is significantly greater. The thickness of the GHSZ is between 106.98 and 267.94 m, with thicknesses being generally higher in the east and west (generally greater than 200 m) and lower in the south and north (generally less than 180 m).
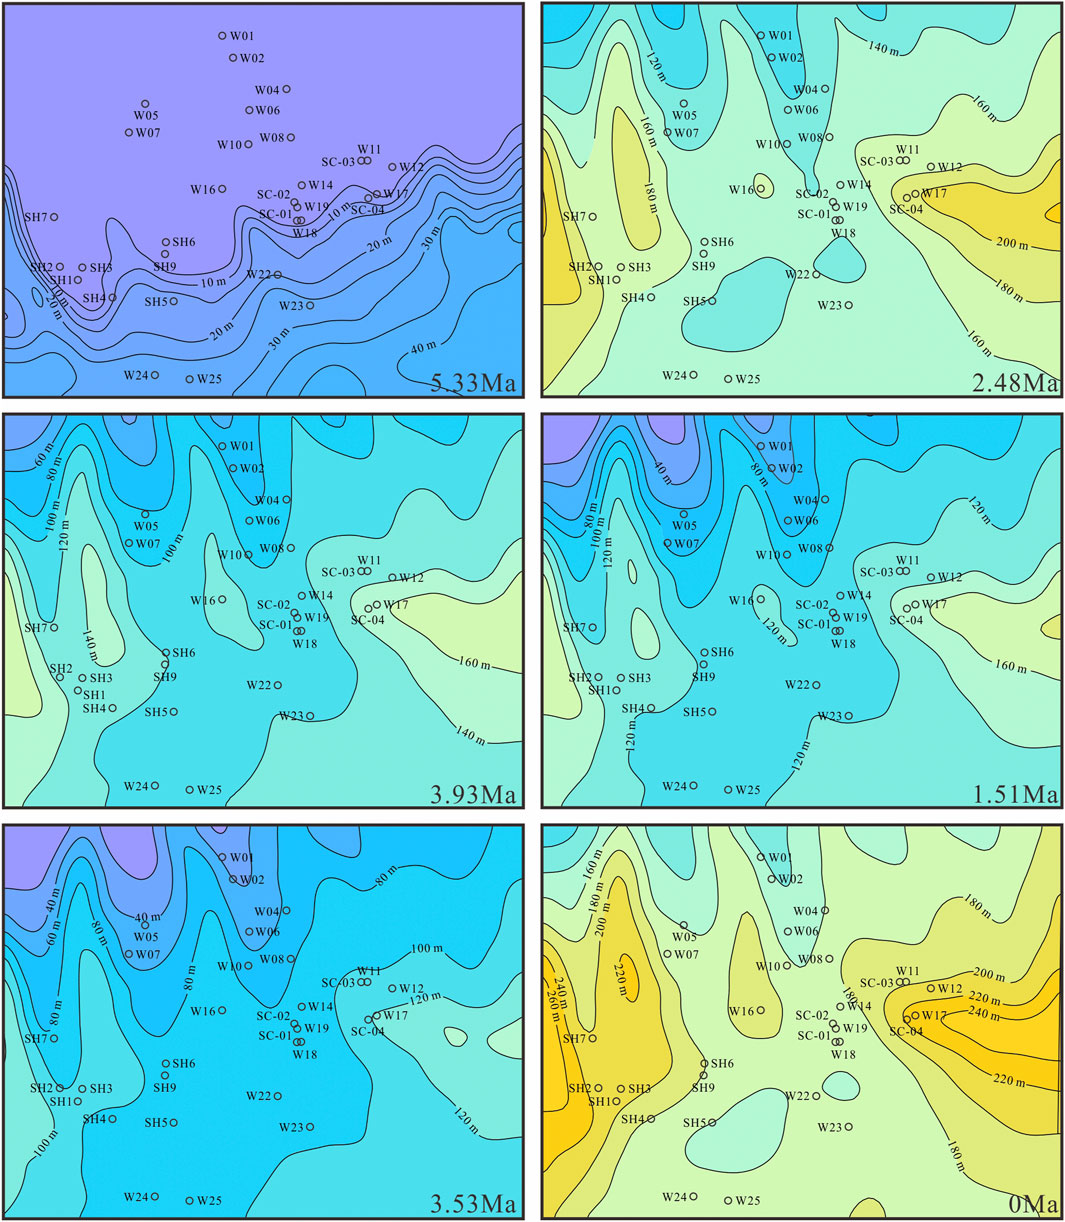
FIGURE 5. Thickness variation in the GHSZ in the Shenhu area since 5.33 Ma.
5 Discussion
5.1 The Relationship Between GHSZ Evolution and Double BSRs
Seismic facies and LWD results indicate that the GHSZ in the Shenhu area has obvious double BSRs, such as those found at sites SH7, W07 and W17 (Liang et al., 2017; Qian et al., 2018; Zhang et al., 2020a; Zhang et al., 2020b). Previous studies have analysed the origin of double/multiple BSRs and proposed changes in temperature and pressure conditions (Posewang and Mienert, 1999; Zander et al., 2017), tectonic uplift and subsidence (Bangs et al., 2005), multiple gas sources (Liang et al., 2017), and changes in formation lithology or mineral composition (Kuramoto et al., 1991; Langseth and Tamaki, 1992). In this study, the formation mechanism of double BSRs is discussed based on LWD results, hydrate types, gas sources of hydrate, and the thickness and evolutionary characteristics of the GHSZ in the Shenhu area.
Site SH7 has a notable double BSRs (Figure 6A). The upper BSR (BSR-1) is displayed at 181 mbsf (Sun et al., 2018). A hydrate approximately 25 m thick is drilled at 152 mbsf to 177 mbsf above BSR-1. The hydrate saturation ranges from 15% to 43.8%, with an average saturation of 23.1% (Wang et al., 2011). The underlying BSR (BSR-2) developed at 238 mbsf and was not drilled at the site but was clearly indicated in the seismic profile (Sun et al., 2018) (Figure 6A). The methane content of the BSR-1 hydrate at site SH7 is between 99.21% and 99.89%, and the ethane content is between 0.10% and 0.76%. Propane, butane and nitrogen are rare (Wu et al., 2011). The carbon isotope content of methane in this hydrate gas is −65.1‰, and C1/(C2+C3) is 160. Pure biogenic gases consist mainly of a large amount of methane and trace amounts of ethane (<1%) (Schoell, 1980; Dudley et al., 1981; Schoell, 1983), and their isotopic characteristics include a low δ13C (δ13C < -55‰), low δD (δD < −200‰), and C1/C2+<1000 (Whiticar and Faber., 1986; Cicerone, 1988; Kirschke et al., 2013). The gas composition and isotopic characteristics of site SH7 indicate that the gas in the hydrates at this site is within the error range of biogenic gas (Liu et al., 2012). The analysis of gas composition and isotope characteristics of sites SH2, SH3 and SH5 near SH7 also indicates that the gas in hydrates in these sites is biogenic gas (Wu et al., 2011; Liu et al., 2012; Zhu et al., 2013; Liu et al., 2015). The maximum thickness of the GHSZ at site SH7 is calculated by using the actual gas composition. The calculation results show that the maximum thickness of the GHSZ is 192.04 m when the gas composition is 99.21% CH4+0.76% C2H6+0.03% C3H8. The GHSZ is much thinner here than in the location where BSR-2 occurs, indicating that the double BSRs composition at site SH7 is not caused by differences in gas composition.
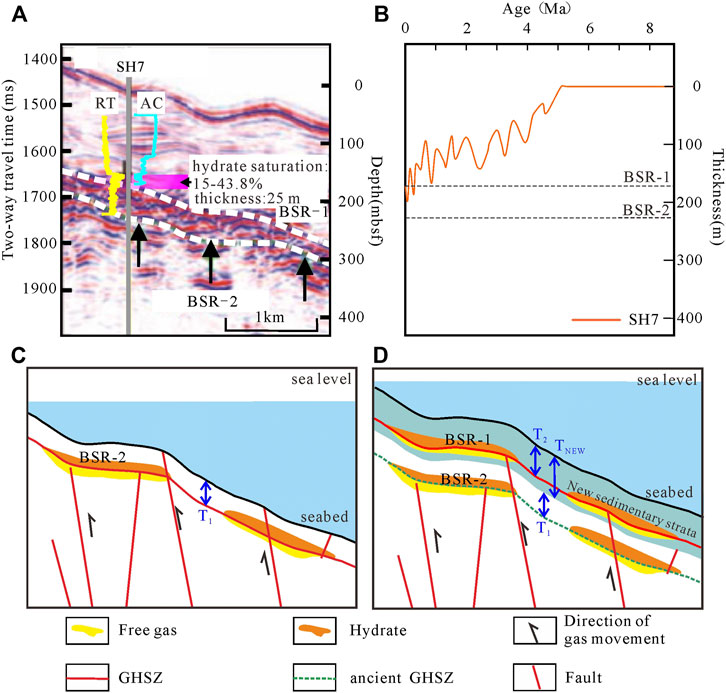
FIGURE 6. (A) Seismic reflection characteristics of double BSRs across site SH7 (modified from Sun et al., 2018). (B) The thickness evolution process of the GHSZ at W17 since 8.2 Ma (C),(D) Double BSRs pattern based on changes in formation temperature, pressure and other conditions (taking site SH7 as an example).
According to the evolution of the thickness of the GHSZ since 8.2 Ma at site SH7 (Figure 6B), the thickness of the GHSZ varies over time. Since 10.5 Ma, the maximum deposition rate is 94 m/Ma, and the maximum deposition thickness is 985 m in the Baiyun Sag (Zhou et al., 2009). At one point, the thickness of the GHSZ is T1, and a BSR display (BSR-2) is formed on the bottom (Figure 6C). After a period of deposition, the thickness of the new sedimentary strata is Tnew, and the thickness of the GHSZ is T2. The BSR display (BSR-1) is formed on the bottom (Figure 6D). When the thickness of T1 plus Tnew is greater than the thickness of T2, the depth of the stratigraphic deposit burial increases is much greater than the thickness of the GHSZ. This finding indicates that the gas hydrates formed earlier may have been removed from the GHSZ during the process of formation deposition and burial. The gas hydrate outside the GHSZ is decomposed. The saturation of gas from decomposing hydrate is low enough to inhibit buoyancy-driven upwards migration, but enough to cause an impedance contrast in seismic data. It is the same principle as multiple BSRs in the Danube deep-sea fan, Black Sea (Zander et al., 2017).
Based on the above understanding, this paper speculated that the BSR-2 of site SH7 is an ancient BSR formed by hydrate decomposition due to the thinning of the GHSZ caused by a temperature rise and pressure decrease or by deposition and burial. The formation process of double BSRs at site SH7 in the Shenhu area is divided into two stages. In the first stage, biogenic gas migrated into GHSZ-1 along faults and diapirs and formed hydrates (Figure 6C). In the second stage, the hydrates formed earlier migrated out of the GHSZ (GHSZ-1) due to thinning of the GHSZ or with formation deposition. The early residual hydrates and free gas settled to form BSR-2 at 238 mbsf (Figure 6D). The late biogenic gas moved to GHSZ-2 to form new hydrates and formed BSR-1 together with free gas. BSR-1 together with residual paleo-BSR-2 formed double BSRs at site SH7.
Site W17 also has a double BSRs in seismic characteristics (Figure 7A). The upper BSR (BSR-1) is 237 mbsf, and the lower BSR (BSR-2) is 330 mbsf (Liang et al., 2017; Qian et al., 2018). Above BSR-1, hydrate approximately 16 m thick is developed at 207 mbsf-223 mbsf. Three thin hydrate layers are developed from below BSR-1 to above BSR-2, at 250 m, 253 and 261 m. Hydrate saturation at site W17 is 0%–76%, with an average of 33% (Zhang et al., 2020a). Based on the gas composition and isotope data of core samples, Liang et al. (2017) and Zhang et al. (2019), Zhang et al. (2020a) concluded that the gas hydrate of 207 mbsf to 223 mbsf in the upper part of BSR-1 is type I, and the gas of this hydrate is biogenic gas. The hydrate at 250 mbsf, 253 mbsf and 261 mbsf below BSR-1 is type II, and the gas is a mixture of biogenic and thermogenic gas, suggesting that the hydrate at site W17 has a deep thermogenic origin (Liang et al., 2017; Zhang et al., 2020a). The gas in the lower part of BSR-1 is at 250 mbsf. Hydrates at 253 mbsf and 261 mbsf are type II, and the gas is a mixture of biogenic and thermogenic gas, suggesting that the hydrate at site W17 is derived from deep thermogenic gas (Liang et al., 2017; Zhang et al., 2020a) (Figure 7B). By analysing the seismic reflection characteristics and geochemical characteristics of analytical gas in the core, Qian et al. (2018) concluded that type II hydrate is developed above the BSR (BSR-2) in the lower 330 mbsf. As shown in Figure 8, when the gas composition above BSR-2 is 98% CH4+0.5% C2H6+1.5% C3H8, 85% CH4+15% C2H6, or 98% CH4+2% C3H8, or when the isobutane content is in the range of 1%–2% and the rest is CH4, the pore water salinity is 32.36‰, and the thickness of the GHSZ is approximately 330 m.
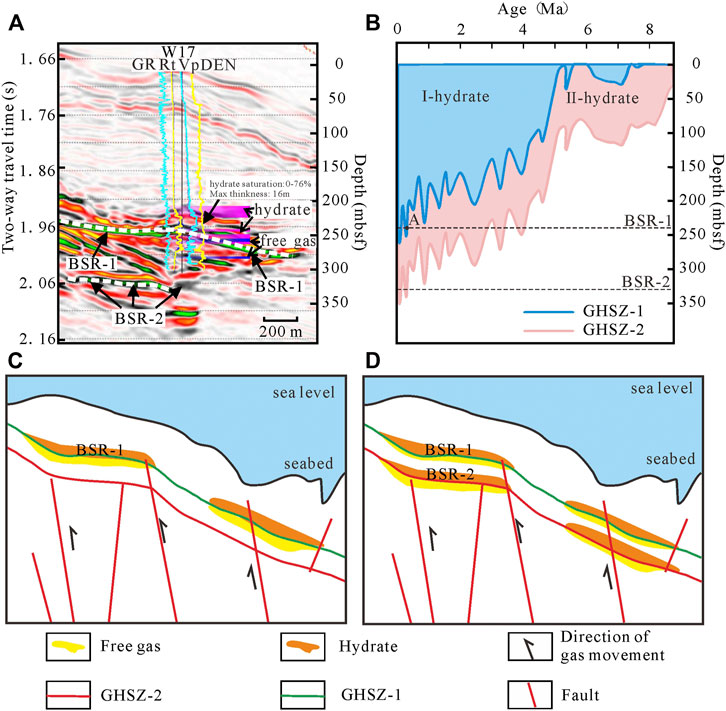
FIGURE 7. (A) Seismic reflection characteristics of double BSRs across site W17 (modified from Qian et al., 2018). (B) The thickness evolution of the GHSZ at W17 and the possible depth range of type I and type II hydrate formation since 8.2 Ma (C),(D) Double BSRs pattern based on differences in gas source and composition (taking site W17 as an example).
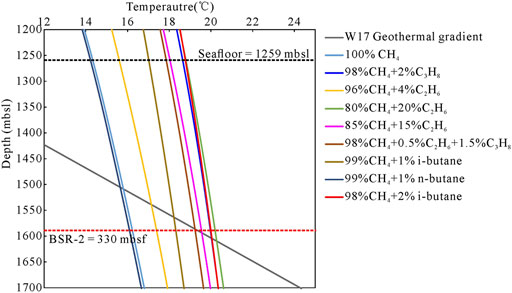
FIGURE 8. The thickness of the GHSZ with different gas components at site W17.
Therefore, the double BSRs at site W17 may have been caused by the difference in natural gas components from different sources or different periods. The formation process of the double BSRs at site W17 in the Shenhu Sea area is divided into two stages. In the first stage, the biogenic gas with high methane content migrated into GHSZ-1 along migration channels such as faults and diapirs and formed hydrates. GHSZ-1 was approximately 237 mbsf, and the hydrate and its free gas beneath formed BSR-1 (Figure 7C). In the second stage, the deep thermogenic gas migrated to the shallow area along migration channels such as faults and diapirs, and along with the shallow biogenic gas, it entered GHSZ-2 and formed hydrate (Figure 7D). GHSZ-2 was approximately 330 m thick, and the hydrate and the free gas beneath it formed BSR-2.
5.2 Relationship Between the Evolution of the GHSZ and the Dynamic Decomposition, Migration, Accumulation and Dissipation of Gas Hydrate
Due to the changes in sea level, BWT, geothermal gradient, formation pressure and other factors in the Shenhu area, the thickness of the GHSZ has varied since 5.33 Ma, with a trend of overall thickening. In the evolution of the GHSZ, due to factors such as formation subsidence and a thin GHSZ, hydrates formed in the early stage, which developed at the bottom of the paleo-GHSZ and moved out of the GHSZ with the new formation deposition, which would lead to the decomposition of hydrate. The decomposed natural gas and/or the later migrated natural gas migrated upward to the GHSZ to form new hydrates or escaped.
Site SH-W07-2016 has two obvious BSRs in the seismic profile (Zhang et al., 2020b), and the upper BSR (BSR-1) is displayed at 154 mbsf. The lower BSR (BSR-2) develops at 259 mbsf (Zhang et al., 2020b) (Figure 9A). The 122 mbsf-153 mbsf well above BSR-1 encountered 31 m thick gas hydrates with hydrate saturations ranging from 39% to 62% (Zhang et al., 2020b). Core observations show that inflation cracks have been formed at 132 mbsf-137 mbsf (see Figure 9 in Zhang et al., 2020b). A porridge structure has been found in cores at 146 mbsf-151 mbsf (see Figure 6 in Zhang et al., 2020b). This is brief evidence for the existence of hydrate at 122 mbsf–153 mbsf. Based on Zhang et al. (2020b), we believe that BSR-2 was the paleo-BSR which formed from the decomposition of gas hydrates. BSR-2 was formed a long time ago and moved out of the GHSZ after formation deposition (see the double BSRs pattern based on changes in formation temperature, pressure and other conditions in 5.1). The hydrate at 122 mbsf -153 mbsf formed at relatively recent ages. As shown in Figure 9B,C, the hydrate began to form after 0.55 Ma (Figure 9B,C, point C). The hydrate starts to form in 0.55 Ma to 0.15 Ma (Figure 9C, ①), in which the GHSZ thinned after hydrate formation, and 0.15 Ma to 0 Ma (Figure 9C, ②), in which the hydrate is always in a suitable temperature and pressure condition after formation. The process of hydrate accumulation in these two cases is completely different. The possible accumulation process of hydrates that start to form in 0.55 Ma to 0.15 Ma are shown in Figure 10 with at most two stages of hydrate formation and at most two stages of hydrate decomposition.
1) Before 0.95 Ma (before point B in Figures 9B,C), the hydrate at 259 mbsf at site SH-W07-2016 was formed in the GHSZ (Figure 10A).
2) During the period from hydrate formation at 259 mbsf to 0.75 Ma (before point C in Figures 9B,C), the bottom boundary of the GHSZ formed in the early stage changed to 259 mbsf due to changes in formation temperature, pressure and other conditions or formation subsidence. The gas from decomposed hydrate formed BSR-2 (Figure 10B).
3) From 0.95 Ma to 0.75 Ma, the bottom boundary of the GHSZ was deeper than 122 mbsf, and the free gas below entered the GHSZ and formed hydrates below 122 mbsf (Figure 10B).
4) From 0.75 Ma to 0.55 Ma (Figures 9B,C, point B-C), the GHSZ was thinned, the bottom boundary of the GHSZ moved to within 122 m, and the hydrates formed below 122 mbsf decomposed (Figure 10C).
5) From 0.55 Ma to 0.15 Ma (Figures 9B,C, point C-D), the GHSZ thickened and thinned from 122 mbsf to 134 mbsf, and the bottom boundary of the GHSZ migrated from 122 mbsf to 134 mbsf. If the hydrate is formed deeper than 134 mbsf, the hydrate will decompose (Figure 10D).
6) From 0.15 Ma to 0.11 Ma (Figures 9B,C, point D-E), the GHSZ thickened, and the bottom boundary of the GHSZ migrated from 134 mbsf to deeper than 154 mbsf. The hydrate formed within the bottom boundary of the GHSZ but was deeper than 154 mbsf (Figure 10E).
7) From 0.11 Ma to 0 Ma (Figures 9B,C, point E-F), the GHSZ thinned, and the bottom boundary of the GHSZ migrated to 154 mbsf. The hydrate below 154 mbsf decomposes into gas (Figure 10F). The hydrates at 122 mbsf-151 mbsf with free gas below in the upper layer formed BSR-1, and the residual hydrates at 259 mbsf with free gas formed BSR-2.
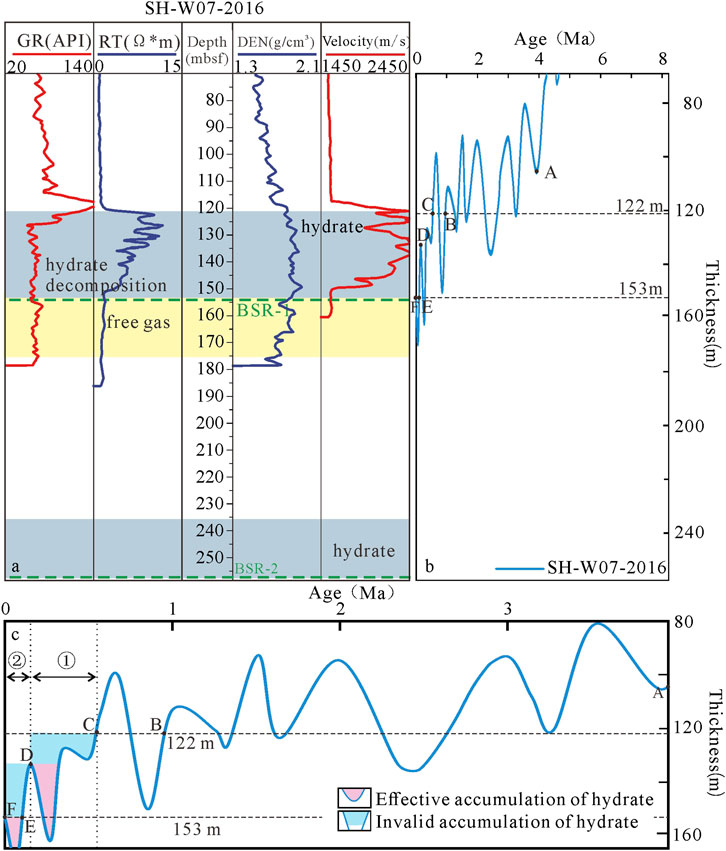
FIGURE 9. (A) The LWD response characteristics of site SH-W07-2016 between 70 mbsf and 260 mbsf (data source: Zhang et al., 2020b). (B) The thickness evolution of the GHSZ at site SH-W07-2016 since 8.2 Ma. (C) The thickness evolution of the GHSZ at site SH-W07-2016 since 4 Ma (blue/pink parts in the figure correspond to the possible formation/decomposition times of decomposed hydrate at 132–137 m and 146–151 m).
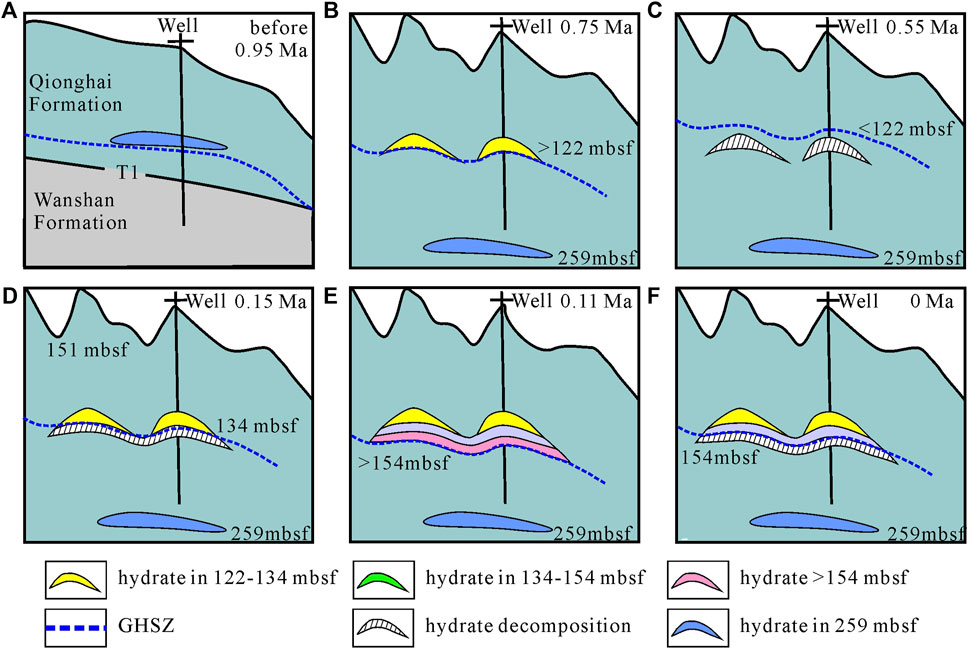
FIGURE 10. Schematic diagram of the dynamic hydrate accumulation process at 122–151 m at site SH-W07-2016. (A) before 0.95 Ma. (B) 0.75 Ma. (C) 0.55 Ma. (D) 0.15 Ma. (E) 0.11 Ma. (F) 0 Ma.
In another case, the hydrate above 154 mbsf may also form during 0.15 Ma to 0 Ma. The situation is shown in Figures 10A, B, E, F with at most one stage of hydrate formation and at most one stage of hydrate decomposition.
1) Before 0.15 Ma (before point B in Figures 9B,C), the hydrate at 259 mbsf at site SH-W07-2016 was formed in the GHSZ (Figure 10A).
2) During the period from hydrate formation at 259 mbsf to 0.15 Ma (before point C in Figures 9B,C), the bottom boundary of the GHSZ formed in the early stage changed to 259 mbsf due to changes in formation temperature, pressure and other conditions or formation subsidence. The gas from decomposed hydrate formed BSR-2 (Figure 10B).
3) From 0.15 Ma to 0.11 Ma (Figures 9B,C, point D-F), and the bottom boundary of the GHSZ is deeper than 154 mbsf (Figures 10B,C). The hydrate formed within the bottom boundary of the GHSZ but was deeper than 154 mbsf (Figure 10E).
4) From 0.11 Ma to 0 Ma (Figures 9B,C, point E-F), the GHSZ thinned, and the bottom boundary of the GHSZ migrated to 154 mbsf. The hydrate below 154 mbsf decomposes into gas (Figure 10F). The hydrates at 122 mbsf-151 mbsf with free gas below in the upper layer formed BSR-1, and the residual hydrates at 259 mbsf with free gas formed BSR-2.
From the above analysis, in the case of hydrate starting to formed at 0.55 Ma–0.15 Ma, at most two stages of hydrate formation and at most two stages of hydrate decomposition have occurred. In the case of hydrate starting from in 0.55 Ma–0.15 Ma, at most one stage of hydrate formation and at most one stage of hydrate decomposition have occurred. Of course, hydrate may also form before 0.55 Ma. As the GHSZ thinned, the hydrate decomposed into gas. When entering the GHSZ again, new hydrates will be formed.
According to the above analysis, the process of hydrate dynamic accumulation can be inferred by determining the spatial-temporal evolution of the GHSZ. The changes in the GHSZ and the changes in the dynamic accumulation process of hydrate. The formation mechanism of double/multiple BSRs and the dynamic accumulation process of hydrate can be better understood by clarifying the evolution of the GHSZ combined with the geological age and gas source. More details of the dynamic accumulation process require more geological, geochemical and seismic data for support.
6 Conclusion
Based on the variation in seawater depth, BWT, geothermal gradient and other parameters, the evolution of the thickness of the GHSZ in the Shenhu area of the SCS is calculated. Two formation modes of double BSRs in the Shenhu area are summarized, and the evolution of the thickness of the GHSZ and the dynamic accumulation of hydrates are discussed. The main conclusions are as follows:
There are two formation mechanisms of double BSRs in the Shenhu area. The first type is the double BSRs pattern based on changes in formation temperature, pressure and other conditions. In this pattern, the lower BSR is the residual BSR after the decomposition of the early hydrate that migrated out of the GHSZ, and the upper BSR is the BSR formed by hydrate re-enrichment in the new GHSZ in the late period, represented by sites SH7 and SH-W07-2016. The other is the double BSRs pattern based on differences in gas source and composition. The upper BSR is type I hydrate, and the lower BSR is type II hydrate, represented by site W17.
The relationship between the evolution of the thickness of the GHSZ and the dynamic evolution of gas hydrate migration, accumulation and dispersion at site SH-W07-2016 in the Shenhu area is preliminarily recognized. According to the different ages of hydrate formation, hydrates have undergone different dynamic accumulation processes. Since the formation of hydrates above the BSR at site SH-W07-2016, the GHSZ at this site has undergone at most two thickening and two thinning periods. With the change in thickness of the GHSZ at site SH-W07-2016, hydrate formation occurred at up two stages from0.55 Ma to 0.15 Ma and occurred at up to one stage from 0.15 Ma to 0 Ma.
Symbol Annotations
T—temperature,K.
P—pressure, mPa.
C—the constant term of the fitting relation, with a value of 2.8074023.
m1, m2, m3 and m4—fitting coefficients of polynomials under different conditions, with values of m1 = 1.559474 × 10⁻¹, m2 = 4.8275 × 10⁻², m3 = −2.78083 × 10⁻³, and m4 = 1.5922 × 10⁻⁴.
g—gravity, with a value of 9.81 m/s2.
h—the vertical distance to seabed, km.
D—the present seawater depth, km.
G—geothermal gradient, °C/km.
t—time, Ma.
Data Availability Statement
The original contributions presented in the study are included in the article/Supplementary Material, further inquiries can be directed to the corresponding author.
Author Contributions
YS: Writing—review and editing., Visualization. YL: Make important revisions to the paper, Investigation, Supervision. LZ: Investigation, Supervision. MC: Conceptualization, Visualization, Investigation. CL: Methodology, Investigation. NL: Formal analysis, Resources.
Funding
This work was supported by the Key Research Program of the Institute of Geology and Geophysics, CAS (IGGCAS-201903), Strategic priority Research Program of the Chinese Academy of Sciences (XDA14010202), National Natural Science Foundation of China (42030808), National major science and technology projects of China (2017ZX05008-004).
Conflict of Interest
The authors declare that the research was conducted in the absence of any commercial or financial relationships that could be construed as a potential conflict of interest.
Publisher’s Note
All claims expressed in this article are solely those of the authors and do not necessarily represent those of their affiliated organizations, or those of the publisher, the editors and the reviewers. Any product that may be evaluated in this article, or claim that may be made by its manufacturer, is not guaranteed or endorsed by the publisher.
References
Andreassen, K., Mienert, J., Bryn, P., and Singh, S. C. (2000). A Double Gas-Hydrate Related Bottom Simulating Reflector at the Norwegian continental Margin. Ann. N. Y. Acad. Sci. 912, 126–135. doi:10.1111/j.1749-6632.2000.tb06766.x
Auguy, C., Calvès, G., Calderon, Y., and Brusset, S. (2017). Seismic Evidence of Gas Hydrates, Multiple BSRs and Fluid Flow Offshore Tumbes Basin, Peru. Mar. Geophys. Res. 38, 409–423. doi:10.1007/s11001-017-9319-2
Baba, K., and Yamada, Y. (2004). BSRs and Associated Reflections as an Indicator of Gas Hydrate and Free Gas Accumulation: an Example of Accretionary Prism and Forearc basin System along the Nankai Trough, off Central Japan. Resource Geology. 54 (1), 11–24. doi:10.1111/j.1751-3928.2004.tb00183.x
Bangs, N. L. B., Musgrave, R. J., and Tréhu, A. M. (2005). Upward Shifts in the Southern Hydrate ridge Gas Hydrate Stability Zone Following Postglacial Warming, Offshore Oregon. J. Geophys. Res. 110 (3), 1–13. doi:10.1029/2004JB003293
Bishnoi, P. R., and Dholabhai, P. D. (1999). Equilibrium Conditions for Hydrate Formation for a Ternary Mixture of Methane, Propane and Carbon Dioxide, and a Natural Gas Mixture in the Presence of Electrolytes and Methanol. Fluid phase equilibria 158-160 (5), 821–827. doi:10.1016/S0378-3812(99)00103-X
Boswell, R., Collett, T. S., Frye, M., Shedd, W., McConnell, D. R., and Shelander, D. (2012). Subsurface Gas Hydrates in the Northern Gulf of Mexico. Mar. Pet. Geology. 34 (1), 4–30. doi:10.1016/j.marpetgeo.2011.10.003
Brown, K. M., Bangs, N. L., Froelich, P. N., and Kvenvolden, K. A. (1996). The Nature, Distribution, and Origin of Gas Hydrate in the Chile Triple Junction Region. Earth Planet. Sci. Lett. 139 (3-4), 471–483. doi:10.1016/0012-821X(95)00243-6
Collett, T. S. (2009). Unconventional Energy Resources: Making the Unconventional Conventional: 29th Annual GCSSEPM Proceedings. Houston, Texas: Gulf Coast Section of the Society of Economic Paleontologists and Mineralogists Foundation, 6–30. doi:10.5724/gcs.09.29.0006Gas Hydrate Petroleum Systems in marine and Arctic Permafrost Environments
Dickens, G. R., and Quinby-Hunt, M. S. (1994). Methane Hydrate Stability in Seawater. Geophys. Res. Lett. 21 (19), 2115–2118. doi:10.1029/94GL01858
Dudley, D. R., George, E., Claypool, D. D., and Claypool, G. E. (1981). Generation, Accumulation, and Resource Potential of Biogenic Gas. Bulletin 65, 5–25. doi:10.1306/2F919765-16CE-11D7-8645000102C1865D
Ecker, C., Dvorkin, J., and Nur, A. M. (2000). Estimating the Amount of Gas Hydrate and Free Gas from marine Seismic Data. Geophysics 65, 565–573. doi:10.1190/1.1444752
Foucher, J. P., Nouzé, H., and Henry, P. (2000). Observation and Tentative Interpretation of a Double BSR on the Nankai Slope. Mar. Geology. 187, 161–175. doi:10.1016/S0025-3227(02)00264-5
Haacke, R. R., Westbrook, G. K., and Hyndman, R. D. (2007). Gas Hydrate, Fluid Flow and Free Gas: Formation of the Bottom-Simulating Reflector. Earth Planet. Sci. Lett. 261, 407–420. doi:10.1016/j.epsl.2007.07.008
He, J. X., Yan, W., Zhu, Y. H., Zhang, W., Gong, F. X., Liu, S. L., et al. (2013). Bio-genetic and Sub-biogenetic Gas Resource Potential and Genetic Types of Natural Gas Hydrates in the Northern Marginal Basins of south China Sea. Nat. Gas industry 33 (6), 121–134. doi:10.3787/j.issn.1000-0976.2013.06.023
He, M., Zhong, G., Liu, X., Liu, L., Shen, X., Wu, Z., et al. (2017). Rapid post-rift Tectonic Subsidence Events in the Pearl River Mouth Basin, Northern south China Sea Margin. J. Asian Earth Sci. 147, 271–283. doi:10.1016/j.jseaes.2017.07.024
He, M., Zhu, W. L., Wu, Z., Zhong, G. F., Ren, J. Y., Liu, L. H., et al. (2019). Neotectonic Movement Characteristics and Hydrocarbon Accumulation of the Pearl River Mouth basin. China offshore oil and gas 31 (5), 9–20.
Holder, G. D., Malone, R. D., and Lawson, W. F. (1987). Effects of Gas Composition and Geothermal Properties on the Thickness and Depth of Natural-Gas-Hydrate Zones. J. Pet. Techn. 39, 1147–1152. doi:10.2118/13595-PA
Hu, S. B., Long, Z. L., Zhu, J. Z., Hu, D., Huang, Y. P., Shi, Y. L., et al. (2019). Characteristics of Geothermal Field and the Tectonic-thermal Evolution in Pearl River Mouth Basin. Acta Petrol. Sin 40 (S1), 178–187. doi:10.7623/syxb2019S1015
Jin, J., Wang, X., Guo, Y., Li, J., Li, Y., Zhang, X., et al. (2020a). Geological Controls on the Occurrence of Recently Formed Highly Concentrated Gas Hydrate Accumulations in the Shenhu Area, South China Sea. Mar. Pet. Geology. 116, 104294. doi:10.1016/j.marpetgeo.2020.104294
Jin, J., Wang, X., He, M., Li, J., Yan, C., Li, Y., et al. (2020b). Downward Shift of Gas Hydrate Stability Zone Due to Seafloor Erosion in the Eastern Dongsha Island, South China Sea. J. Ocean. Limnol. 38 (4), 1188–1200. doi:10.1007/s00343-020-0064-z
Kirschke, S., Bousquet, P., Ciais, P., Saunois, M., Canadell, J. G., Dlugokencky, E. J., et al. (2013). Three Decades of Global Methane Sources and Sinks. Nat. Geosci 6 (10), 813–823. doi:10.1038/NGEO1955
Kuramoto, S., Tamaki, K., Langseth, M. G., Nobes, D. C., Tokuyama, H., Pisciotto, K. A., et al. (1991). Can Opal-A/opal-CT BSR Be an Indicator of the thermal Structure of the Yamato Basin, Japan Sea? Proc. ODP Sci. Results. 127, 1145–1156. doi:10.2973/odp.proc.sr.127128-2.235.1992
Kvenvolden, K. A. (1993). Gas Hydrates-Geological Perspective and Global Change. Rev. Geophys. 31 (2), 173–187. doi:10.1029/93RG00268
Langseth, M. G., and Tamaki, K. (1992). Geothermal Measurements: Thermal Evolution of the Japan Sea Basins and Sediments. Proc. Ocean Drilling Program Scientific Results 127/128, 2. doi:10.2973/odp.proc.sr.127128-2.227.1992
Lear, C. H., Coxall, H. K., Foster, G. L., Lunt, D. J., Mawbey, E. M., Rosenthal, Y., et al. (2015). Neogene Ice Volume and Ocean Temperatures: Insights from Infaunal Foraminiferal Mg/Ca Paleothermometry. Paleoceanography 30, 1437–1454. doi:10.1002/2015PA002833
Lei, Y. H., Song, Y. R., Zhang, L. K., Miao, L. C., Cheng, M., and Liu, N. G. (2021). Research Progress and Development Direction of Reservoir-Forming System of marine Gas Hydrates. Acta Petrolei Sinica 42 (06), 801–820. doi:10.7623/syxb202106009
Li, H. B. (2010). The Features of Construct and Structure and the Discussion of Relationship between Evolution with Hydrocarbon Reservoiring in Huizhou Depression and Dongsha Massif of Pearl River Mouth basin. Wuhan P.R.China: China University of Geosciences.
Li, J.-f., Ye, J. L., Ye, J.-l., Qin, X.-w., Qiu, H.-j., Wu, N.-y., et al. (2018). The First Offshore Natural Gas Hydrate Production Test in South China Sea. China Geol. 1 (1), 5–16. doi:10.31035/cg2018003
Li, L., Liu, H., Zhang, X., Lei, X., and Sha, Z. (2015). BSRs, Estimated Heat Flow, Hydrate-Related Gas Volume and Their Implications for Methane Seepage and Gas Hydrate in the Dongsha Region, Northern South China Sea. Mar. Pet. Geology. 67, 785–794. doi:10.1016/j.marpetgeo.2015.07.008
Liang, J. Q., Wang, H. B., Su, X., Fu, S. Y., Wang, L. F., Guo, Y. Q., et al. (2014). Natural Gas Hydrate Formation Conditions and the Associated Controlling Factors in the Northern Slope of the South China Sea. Nat. Gas Industry 34 (7), 128–135. doi:10.3787/j.issn.1000-0976.2014.07.022
Liang, J., Zhang, Z., Su, P., Sha, Z., and Yang, S. (2017). Evaluation of Gas Hydrate-Bearing Sediments below the Conventional Bottom-Simulating Reflection on the Northern Slope of the South China Sea. Interpretation 5 (3), SM61–SM74. doi:10.1190/int-2016-0219.1
Liu, C. L., Ye, Y. G., Meng, Q. G., He, X. L., Lu, H. L., Zhang, J., et al. (2012). The Characteristics of Gas Hydrates Recovered from Shenhu Area in the South China Sea. Mar. Geology. 22-27, 307–310. doi:10.1016/j.margeo.2012.03.004
Liu, C., Meng, Q., He, X., Li, C., Ye, Y., Zhang, G., et al. (2015). Characterization of Natural Gas Hydrate Recovered from Pearl River Mouth basin in South China Sea. Mar. Pet. Geology. 61, 14–21. doi:10.1016/j.margeo.2012.03.004
Liu, J., Zhang, J., Ma, F., Wang, M., and Sun, Y. (2017). Estimation of Seismic Velocities and Gas Hydrate Concentrations: A Case Study from the Shenhu Area, Northern South China Sea. Mar. Pet. Geology. 88, 225–234. doi:10.1016/j.marpetgeo.2017.08.014
Liu, P., Zhang, X. T., Du, J. Y., Cheng, W., Tao, W. F., and Tao, Y. (2018). Tectonic-Thermal Evolution Process and the Petroleum Geological Significance of Relatively Low Geothermal Gradient in a Rift Basin: An Example from Xijiang Main Sag in pearl River Mouth Basin. Geol. Sci. Techn. Inf. 37 (2), 146–156.
Majumdar, U., Cook, A. E., Shedd, W., and Frye, M. (2016). The Connection between Natural Gas Hydrate and Bottom‐simulating Reflectors. Geophys. Res. Lett. 43 (13), 7044–7051. doi:10.1002/2016GL069443
Martin Schoell, M. (1983). Genetic Characterization of Natural Gases. Bulletin 67, 2225–2238. doi:10.1306/AD46094A-16F7-11D7-8645000102C1865D
Martin, V., Henry, P., Nouzé, H., Noble, M., Ashi, J., and Pascal, G. (2004). Erosion and Sedimentation as Processes Controlling the BSR-Derived Heat Flow on the Eastern Nankai Margin. Earth Planet. Sci. Lett. 222 (1), 131–144. doi:10.1016/j.epsl.2004.02.020
Miles, P. R. (1995). Potential Distribution of Methane Hydrate beneath the European continental Margins. Geophys. Res. Lett. 22 (23), 3179–3182. doi:10.1029/95GL03013
Mosher, D. C. (2011). A Margin-wide BSR Gas Hydrate Assessment: Canada's Atlantic Margin. Mar. Pet. Geology. 28 (8), 1540–1553. doi:10.1029/95GL0301310.1016/j.marpetgeo.2011.06.007
Musgrave, R. J., Bangs, N. L., Larrasoaña, J. C., Gràcia, E., Hollamby, J. A., and Vega, M. E. (2006). Rise of the Base of the Gas Hydrate Zone since the Last Glacial Recorded by Rock Magnetism. Geol 34 (2), 117–120. doi:10.1130/G22008.1
Niu, Z., Liu, G., Ge, J., Zhang, X., Cao, Z., Lei, Y., et al. (2019). Geochemical Characteristics and Depositional Environment of Paleogene Lacustrine Source Rocks in the Lufeng Sag, Pearl River Mouth basin, South China Sea. J. Asian Earth Sci. 171, 60–77. doi:10.1016/j.jseaes.2018.01.004
Pang, X., Chen, C., Peng, D., Zhu, M., Shu, Y., He, M., et al. (2007). Sequence Stratigraphy of Deep-Water Fan System of Pearl River, South China Sea. Earth Sci. Front. 14 (1), 220–229. doi:10.1016/S1872-5791(07)60010-4
Pecher, I. A., Villinger, H., Kaul, N., Crutchley, G. J., Mountjoy, J. J., Huhn, K., et al. (2017). A Fluid Pulse on the Hikurangi Subduction Margin: Evidence from a Heat Flux Transect across the Upper Limit of Gas Hydrate Stability. Geophys. Res. Lett. 44 (12), 385–395. doi:10.1002/2017GL076368
Peltzer, E. T., and Brewer, P. G. (2003). Practical Physical Chemistry and Empirical Predictions of Methane Hydrate Stability. Nat. Gas Hydrate Ocean Permafrost Environments 5, 17–28. doi:10.1007/978-94-011-4387-5_3
Phrampus, B. J., and Hornbach, M. J. (2012). Recent Changes to the Gulf Stream Causing Widespread Gas Hydrate Destabilization. Nature 490, 527–530. doi:10.1038/nature11528
Popescu, I., De Batist, M., Lericolais, G., Nouzé, H., Poort, J., Panin, N., et al. (2006). Multiple Bottom-Simulating Reflections in the Black Sea: Potential Proxies of Past Climate Conditions. Mar. Geology. 227 (3/4), 163–176. doi:10.1016/j.margeo.2005.12.006
Posewang, J., and Mienert, J. (1999). The enigma of Double BSRs: Indicators for Changes in the Hydrate Stability Field? Geo-Marine Lett. 19, 157–163. doi:10.1007/s003670050103
Qian, J., Wang, X., Collett, T. S., Guo, Y., Kang, D., and Jin, J. (2018). Downhole Log Evidence for the Coexistence of Structure II Gas Hydrate and Free Gas below the Bottom Simulating Reflector in the South China Sea. Mar. Pet. Geology. 98, 662–674. doi:10.1016/j.marpetgeo.2018.09.024
Rempel, A. W., and Buffett, B. A. (1997). Formation and Accumulation of Gas Hydrate in Porous media. J. Geophys. Res. 102, 10151–10164. doi:10.1029/97JB00392
Ruppel, C., Boswell, R., and Jones, E. (2008). Scientific Results from Gulf of Mexico Gas Hydrates Joint Industry Project Leg 1 Drilling: Introduction and Overview. Mar. Pet. Geology. 25, 819–829. doi:10.1016/j.marpetgeo.2008.02.007
Schoell, M. (1980). The Hydrogen and Carbon Isotopic Composition of Methane from Natural Gases of Various Origins. Geochimica et Cosmochimica Acta 44, 649–661. doi:10.1016/0016-7037(80)90155-6
Sloan, E. D., and Koh, C. A. (2008). Clathrate Hydrates of the Natural Gases. 3rd ed. Boca Raton, FL: CRC Press.
Su, M., Sha, Z., Zhang, C., Wang, H., Wu, N., Yang, R., et al. (2017). Types, Characteristics and Significances of Migrating Pathways of Gas-Bearing Fluids in the Shenhu Area, Northern Continental Slope of the South China Sea. Acta Geologica Sinica - English Edition 91 (1), 219–231. doi:10.1111/1755-6724.13073
Su, M., Yang, R., Wang, H. B., Sha, Z. B., Liang, J. Q., Wu, N. Y., et al. (2016). Gas Hydrates Distribution in the Shenhu Area, Northern South China Sea: Comparisons between the Eight Drilling Sites with Gas Hydrate Petroleum System. Geol. Acta 14 (2), 79–100. doi:10.1344/GeologicaActa2016.14.2.1
Su, P., Liang, J., Peng, J., Zhang, W., and Xu, J. (2018). Petroleum Systems Modeling on Gas Hydrate of the First Experimental Exploitation Region in the Shenhu Area, Northern South China Sea. J. Asian Earth Sci. 168 (DEC), 57–76. doi:10.1016/j.jseaes.2018.08.001
Sun, Y., Zhang, X., Wu, S., Wang, L., and Yang, S. (2018). Relation of Submarine Landslide to Hydrate Occurrences in Baiyun Depression, South China Sea. J. Ocean Univ. China 17 (1), 129–138. doi:10.1007/s11802-018-3458-1
Wang, C., Lu, J. H., Zhu, R., and Yu, W. T. (2013). Validation on the Applicability of TEOS-10 Equation in the SCS Based on WOA09 Thermohaline Data. Water Conservancy Sci. Techn. Economy 19 (11), 1–6. doi:10.3969/j.issn.1006-7175.2013.11.001
Wang, X., Lee, M., Collett, T., Yang, S., Guo, Y., and Wu, S. (2014). Gas Hydrate Identified in Sand-Rich Inferred Sedimentary Section Using Downhole Logging and Seismic Data in Shenhu Area, South China Sea. Mar. Pet. Geology. 51, 298–306. doi:10.1016/j.marpetgeo.2014.01.002
Wang, X., Wu, S., Lee, M., Guo, Y., Yang, S., and Liang, J. (2011). Gas Hydrate Saturation from Acoustic Impedance and Resistivity Logs in the Shenhu Area, South China Sea. Mar. Pet. Geology. 28, 1625–1633. doi:10.1016/j.marpetgeo.2011.07.002
Wei, J., Fang, Y., Lu, H., Lu, H., Lu, J., Liang, J., et al. (2018). Distribution and Characteristics of Natural Gas Hydrates in the Shenhu Sea Area, South China Sea. Mar. Pet. Geology. 98, 622–628. doi:10.1016/j.marpetgeo.2018.07.028
Whiticar, M. J., and Faber, E. (1986). Methane Oxidation in Sediment and Water Column Environments-Isotope Evidence. Org. Geochem. 10 (4-6), 759–768. doi:10.1016/S0146-6380(86)80013-4
Wu, N., Yang, S., Zhang, H., Liang, J., Wang, H., and Lu, J. a. (2010). Gas Hydrate System of Shenhu Area, Northern South China Sea:Wire-Line Logging, Geochemical Results and Preliminary Resources Estimates. Proc. Annu. Offshore Techn. Conf. 1 (1). doi:10.4043/20485-MS
Wu, N., Zhang, H., Yang, S., Zhang, G., Liang, J., Lu, J. a., et al. (2011). Gas Hydrate System of Shenhu Area, Northern South China Sea: Geochemical Results. J. Geol. Res. 2011, 1–10. doi:10.1155/2011/370298
Wu, S., Zhang, G., Huang, Y., Liang, J., and Wong, H. K. (2005). Gas Hydrate Occurrence on the continental Slope of the Northern South China Sea. Mar. Pet. Geology. 22, 403–412. doi:10.1016/j.marpetgeo.2004.11.006
Yang, J., Wang, X., Jin, J., Li, Y., Li, J., Qian, J., et al. (2017a). The Role of Fluid Migration in the Occurrence of Shallow Gas and Gas Hydrates in the South of the Pearl River Mouth Basin, South China Sea. Interpretation 5 (3), SM1–SM11. doi:10.1190/INT-2016-0197.1
Yang, S. X., Lei, Y., Liang, J. Q., Holland, M., Schultheiss, P., Lu, J. A., et al. (2017b). “Concentrated Gas Hydrate in the Shenhu Area, south China Sea: Results from Drilling Expeditions GMGS3 & GMGS4,” in Proceedings of 9th International Conference on Gas Hydrates, Denver, June, 25–30.
Yang, S. X., Zhang, M., Liang, J. Q., Lu, J. A., Zhang, Z. J., Melanie, H., et al. (2015). Preliminary Results of China's Third Gas Hydrate Drilling Expedition: a Critical Step from Discovery to Development in the south China Sea. Fire and Ice 15 (2), 1–5.
Ye, J. L., Qin, X. W., Xie, W. W., Lu, H. L., Ma, B. J., Qiu, H. J., et al. (2020). The Second Natural Gas Hydrate Production Test in the South China Sea. China Geol. 3 (2), 197–209. doi:10.31035/cg2020043
Ye, J., Qin, X., Qiu, H., Xie, W., Lu, H., Lu, C., et al. (2018). Data Report: Molecular and Isotopic Compositions of the Extracted Gas from China's First Offshore Natural Gas Hydrate Production Test in South China Sea. Energies 11 (10), 2793. doi:10.3390/en11102793
Zander, T., Haeckel, M., Berndt, C., Chi, W.-C., Klaucke, I., Bialas, J., et al. (2017). On the Origin of Multiple BSRs in the Danube Deep-Sea Fan, Black Sea. Earth Planet. Sci. Lett. 462, 15–25. doi:10.1016/j.epsl.2017.01.006
Zhang, G. C., Yang, H. Z., Chen, Y., Ji, M., Wang, K., Yang, D. S., et al. (2014). The Baiyun Sag: A Giant Rich Gas-Generation Sag in the deepwater Area of the Pearl River Mouth Basin. Nat. Gas Industry 34 (11), 11–25. doi:10.3787/j.issn.1000-0976.2014.11.002
Zhang, H. Q., Yang, S. X., and Wu, N. Y. (2007). GMGS-1 Science Team: China’s First Gas Hydrate Expedition Successful (No.1). Fire in the Ice: Methane Hydrate Newsletter 7 (2), 4–8.
Zhang, R.-w., Lu, J. A., Lu, J.-a., Wen, P.-f., Kuang, Z.-g., Zhang, B.-j., et al. (2018). Distribution of Gas Hydrate Reservoir in the First Production Test Region of the Shenhu Area, South China Sea. China Geology. 1, 493–504. doi:10.31035/cg2018049
Zhang, W., Liang, J., Lu, J. a., Wei, J., Su, P., Fang, Y., et al. (2017). Accumulation Features and Mechanisms of High Saturation Natural Gas Hydrate in Shenhu Area, Northern South China Sea. Pet. Exploration Develop. 44 (5), 708–719. doi:10.1016/s1876-3804(17)30082-4
Zhang, W., Liang, J., Wan, Z., Su, P., Huang, W., Wang, L., et al. (2020b2020b). Dynamic Accumulation of Gas Hydrates Associated with the Channel-Levee System in the Shenhu Area, Northern South China Sea. Mar. Pet. Geology. 117, 104354. doi:10.1016/j.marpetgeo.2020.104354
Zhang, W., Liang, J., Wei, J., Lu, J. a., Su, P., Lin, L., et al. (2020a). Geological and Geophysical Features of and Controls on Occurrence and Accumulation of Gas Hydrates in the First Offshore Gas-Hydrate Production Test Region in the Shenhu Area, Northern South China Sea. Mar. Pet. Geology. 114, 104191. doi:10.1016/j.marpetgeo.2019.104191
Zhang, W., Liang, J., Wei, J., Su, P., Lin, L., and Huang, W. (2019). Origin of Natural Gases and Associated Gas Hydrates in the Shenhu Area, Northern South China Sea: Results from the China Gas Hydrate Drilling Expeditions. J. Asian Earth Sci. 183 (1), 103953. doi:10.1016/j.jseaes.2019.103953
Zhang, Y. (2011). Characteristics and Main Controlling Factors of Hydrocarbon Accumulation in the Eogene of Huizhou Depression. Wuhan P.R.China: Master’s degree of China University of Geosciences.
Zhang, Z., and Wright, C. S. (2017). Quantitative Interpretations and Assessments of a Fractured Gas Hydrate Reservoir Using Three-Dimensional Seismic and LWD Data in Kutei basin, East Kalimantan, Offshore Indonesia. Mar. Pet. Geology. 84, 257–273. doi:10.1016/j.marpetgeo.2017.03.019
Zhao, S. J. (2012). Structures of the Dongsha Movement at the Northern Margin of the south China Sea: Implications for the Evolution of the Passive continental Margins. Qindao P.R.China: Master’s degree of Institute of oceanology.
Zhou, D., Sun, Z., Liao, J., Zhao, Z., He, M., Wu, X., et al. (2009). Filling History and post-Breakup Acceleration of Sedimentation in Baiyun Sag, Deepwater Northern South China Sea. J. Earth Sci. 20 (1), 160–171. doi:10.1007/s12583-009-0015-2
Zhu, W. L. (2007). Natural Gas Geology in the continental Margin basin of the Northern South China Sea. Beijing: Petroleum Industry Press, 3–22.
Keywords: gas hydrate, gas hydrate stability zone, double BSRs, dynamic accumulation process, the Shenhu area
Citation: Song Y, Lei Y, Zhang L, Cheng M, Li C and Liu N (2022) Spatial-Temporal Evolution of the Gas Hydrate Stability Zone and Accumulation Patterns of Double BSRs Formation in the Shenhu Area. Front. Earth Sci. 10:880933. doi: 10.3389/feart.2022.880933
Received: 22 February 2022; Accepted: 06 April 2022;
Published: 28 April 2022.
Edited by:
Wei Zhang, Guangzhou Marine Geological Survey, ChinaReviewed by:
Jiapeng Jin, Qingdao National Laboratory for Marine Science and Technology, ChinaMichael Riedel, Helmholtz Association of German Research Centres (HZ), Germany
Jinxiu Yang, China University of Petroleum, China
Chao Fu, China National Offshore Oil Corporation, China
Copyright © 2022 Song, Lei, Zhang, Cheng, Li and Liu. This is an open-access article distributed under the terms of the Creative Commons Attribution License (CC BY). The use, distribution or reproduction in other forums is permitted, provided the original author(s) and the copyright owner(s) are credited and that the original publication in this journal is cited, in accordance with accepted academic practice. No use, distribution or reproduction is permitted which does not comply with these terms.
*Correspondence: Yuhong Lei, bGVpeWhAbWFpbC5pZ2djYXMuYWMuY24=