 Hongxiang Yu
 Guang Li
 Ning Huang
 Michael Lehning
94% of researchers rate our articles as excellent or good
Learn more about the work of our research integrity team to safeguard the quality of each article we publish.
Find out more
ORIGINAL RESEARCH article
Front. Earth Sci., 15 June 2022
Sec. Cryospheric Sciences
Volume 10 - 2022 | https://doi.org/10.3389/feart.2022.880466
This article is part of the Research TopicSnow and Ice Disaster: Formation Mechanism and Control EngineeringView all 9 articles
Strong electric fields, with values of tens kV/m near the surface, are observed during drifting and blowing snow events. Charge separation can significantly affect particle motion. Although several investigations attempted to shed light on the mechanisms of charge separation and the resulting electric field structure, few studies paid attention to the effect of electrification on the particle trajectory, which may influence the transport mechanism. In this work, we studied trajectories of individual, charged particles in an idealized static electrical field by solving the equations of motion in a neutral atmospheric boundary layer. The results show that negatively charged particles have a lower saltation height while positively charged particles jump higher as long as friction velocities are small. This effect reverses for higher friction velocities as rebound velocities start to dominate over vertical acceleration. We find regimes, in which charge separation leads to suspension of particles close to the ground. The threshold condition for this saltation-suspension transition is related to the rebound velocity and charge-to-mass ratio of the charged particle. Our study is a first step towards a better understanding on the influence of charge separation on drifting snow and should lead to include this effect in state of the art saltation models.
Drifting snow is common in cold regions due to strong local winds (Armstrong and Brun, 2008). It affects the snow mass balance by transporting snow from erodible surfaces (e.g., windward slope) to protected locations (e.g., leeward slope, shrubs, and forests), accompanying snow bed-form formations such as patchy snow, snow ridges, snow ripples, snow dunes, and snow cornices (Kochanski et al., 2019; Sharma et al., 2019), and resulting influence on the radiation balance and hydrological processes (Li et al., 2018). The inhomogeneity of snow distribution due to snow drifting may also lead to snow disasters such as snow avalanches, construction collapses, traffic jams, and agricultural damages, which have significant impacts on the local environment and socioeconomic activities (McClung and Schaerer, 2006).
In drifting snow, three motion types of snow particles are recognised: driven by the wind flow, particles with large size can only roll on the surface due to the heavy mass, which is called creep; particles with moderate size can lift off the surface and keep bouncing along the surface, which is called saltation; and particles with small size can follow the wind flow and float in the air, which is called suspension (Clifton and Lehning, 2008). Snow particles get charged when creeping or hopping along the snow bed due to collision and friction. The polarity of charges obtained on a snow particle surface is either positive or negative (Kikuchi, 1981; Maeno et al., 1985), and the value of its charge is between −208 μC/kg to +72 μC/kg (Schmidt et al., 1999). Most of the snow particles in the air have a negative charge, and the bed has a positive charge (Omiya et al., 2011). This distribution pattern of charged particles leads to a positive upward electric field in the reverse direction of the atmospheric electric field. The first observation of a strong vertical upward gradient of electric potential in drifting snow was measured by Simpson (1919). This electric field strength from 0.04 to 0.5 m above the ground could be over +30 kV/m in the blizzard, which is much larger than the background atmospheric electric field (Schmidt and Dent, 1994; Gordon and Taylor, 2009). The electric field strength value positively correlates with the wind speed (Kikuchi, 1981) and decays exponentially with height (Schmidt et al., 1999). The electric field formed by the charged particles can even interfere with the radio antennas. For example, it blocks the radio signals of airplanes passing through a snowstorm (Simpson, 1919; Currie and Pearce, 1949; Yair et al., 2019). Besides, some studies suggest that the snow cornices formation mechanism may be related to the strong electric field at the mountain ridge (Latham and Montagne, 1970; Omiya et al., 2011).
As a feedback, the electric field formed by the charged particles spontaneously influences the particle trajectories and may change the mass profile structure. Schmidt et al. (1999) first proposed the estimation of the electric field force on 0.14 mm-sized snow particles at the height of 5 mm above the bed and found that it could even counterbalance the gravity force. However, the acknowledgement of the interaction between the electric field and the charged saltating snow particles is still lacking because the electrification force on particles has been ignored in most drifting snow models so far (Schmidt et al., 1998). Thus, here we start to study and estimate the effect of electric fields on the trajectories of saltating snow particles carrying positive or negative charges in a stable wind field.
The trajectories of two types of typical snow particles in a neutral atmospheric boundary layer with a vertical electric field are shown in Figure 1. The saltating particle carrying differing charges starts to move forward with an initial vertical velocity, hitting and bouncing when it touches the surface. After several bounces along the surface, its saltation trajectory becomes stable. One type of the suspending particles moves high in the air, and the other one suspends near the ground surface.
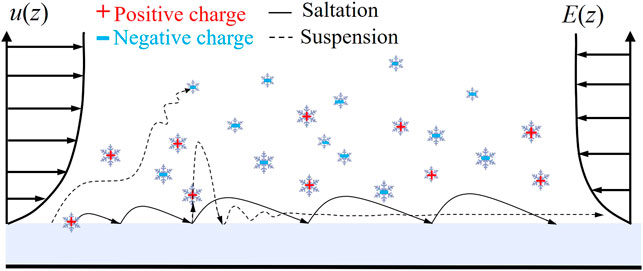
FIGURE 1. Schematic diagram of a saltation snowflake in the wind field and electric field.
When the particle moves in the air, the governing equations are:
where
Net gravity—particles are subject to a vertical downward force, and the expression is:
where D is the equivalent diameter of the snow particles, snow particle density ρp = 910 kg/m3, air density ρa = 1.2 kg/m3, and the gravitational acceleration vector
Drag force—when particle velocity differs from the fluid velocity, fluid has a drag effect on the particles:
where
where u∗ is friction velocity, k is vonKármán constant 0.4, z is the position height, and z0 is the roughness length.
Electric force—positively or negatively electrified particles are subjected to opposite force in direction, and its calculation expression is:
where q is the charge on the snow particle. Based on the facts that the charge carried by particles tends to be saturated during the process of particle-particle and particle-surface collisions (Yu et al., 2017) and the mid-air collision between snow particles is at low probability (Schmidt, 1972; Sommerfeld and Zivkovic, 1992). We therefore assume saturated charges for our particles, and with the values estimated in the wind tunnel experiments (Omiya et al., 2011) which are relatively small limited by the total length of system.
In this model, the lift force can be ignored because its average magnitude is no more than 1% of gravity, which is caused by the low vertical gradient wind speed value. When the saltation particle impacts the surface, it rebounds and splashes other particles on the surface. The restitution coefficients of the particle can be expressed by the following formulas (Sugiura and Maeno, 2000):
where
All the calculation cases follow the steps as shown in Figure 2:
1) Set the initial parameters for wind (including u∗, z0) and for particles (horizontal and vertical positions x (0) and z (0), horizontal and vertical velocities upi (0) and wpi (0), time step dt, diameter D, and saturation charge value q);
2) Start the loop by using the fourth-order Runge-Kutta method to calculate the position of the particles for each time step;
3) Judge if the height of particle is over one radius, and use the splash function to calculate the ejection velocity upr, wpr;
4) Judge if calculation time reaches the total time to end the loop;
5) Summarize and analyze the characteristics of snow particle trajectories.
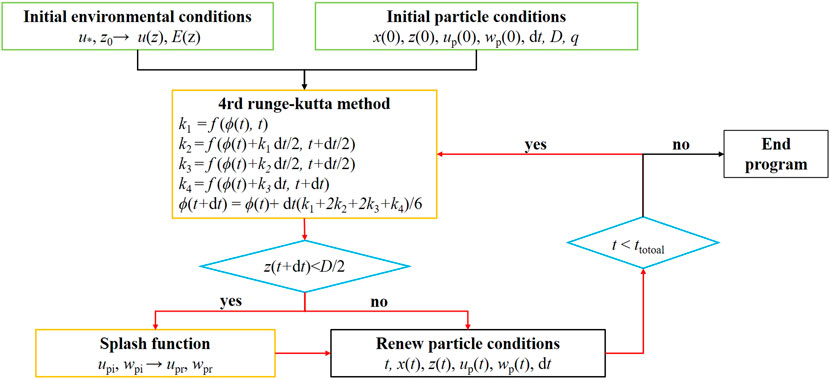
FIGURE 2. Flow chart of the calculation steps.
To verify the accuracy of our model, we first compared the results with the experiments of Nishimura and Hunt (2000). Here, the electric field in the wind tunnel can be ignored because it is much lower than that in field experiments (Sato and Omiya, 2011). Assuming the friction velocity is 0.3 m/s, a snow particle with a diameter of 480 μm jumps with a vertical speed of
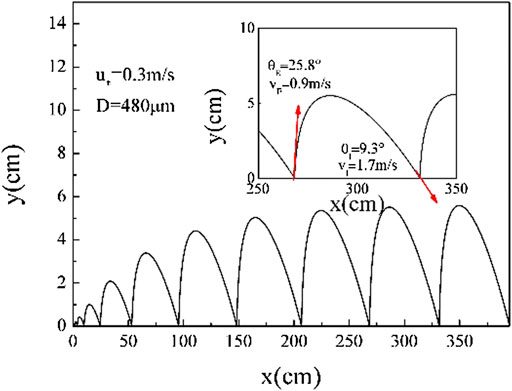
FIGURE 3. The saltation trajectory of a single snow particle in the conditions of Nishimura and Hunt’s experiment (subgraph) (Nishimura and Hunt, 2000).
In this work, we studied the effects of wind velocity, particle initial velocity, the charge-to-mass ratio on the trajectory of saltation snow particles separately. Simulation settings are listed in Table 1. The value of particle diameter and charge-to-mass ratio are in the range of the measurement results (Schmidt et al., 1999). The values of initial velocity of aerodynamic entrainment, rebound and ejection are set according to measurement results (Lü et al., 2012).
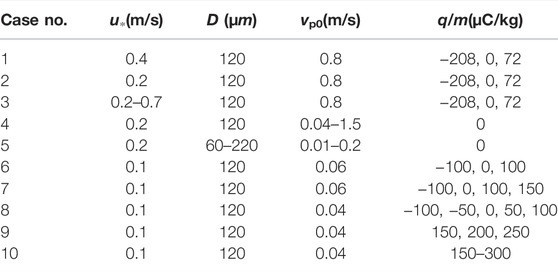
TABLE 1. Simulation case settings.
There are three mechanisms for snow particles to start saltation: aerodynamic entrainment by wind, rebound, and ejection. The initial velocity of a particle taken-off by aerodynamic entrainment is usually set to the value with which particle can reach the height of one particle size O (10–2−10−1 m/s). The initial velocity of a rebound particle has the same magnitude as the average saltation velocity of O (100 m/s), and that of an ejection particle is one magnitude lower than the rebound particle, as O (10−1 m/s) (Anderson and Haff, 1988).
We first investigate the differences among the trajectories of the aerodynamic entrainment, rebound, and ejection particles carrying positive, negative, and neutral charge under the same wind conditions. In the simulation, particle initial velocities are set as 0.07 m/s for the aerodynamic entrainment particle, 0.3 m/s for an ejection particle, and 3 m/s for a rebound particle. From Figure 4 we can conclude that: The saltation height and length of the particles with the same charge but different ways of jumping are almost the same. Generally, negative particles are closer to the ground surface with a shorter saltation length, and positive particles move to a higher position which results in greater saltation length.
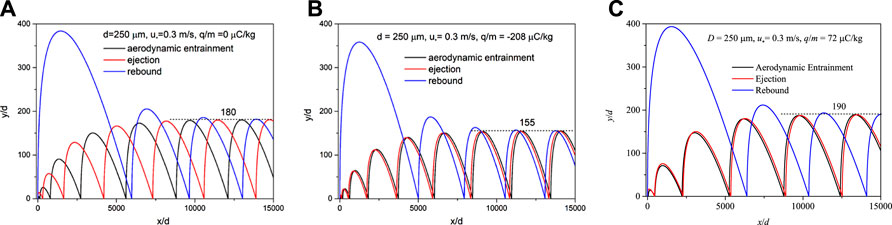
FIGURE 4. Trajectories of aerodynamic entrainment, rebound, and ejection particles with different charge-to-mass ratios.(A) Neutral particles. (B) Negative charged particles with a mass-to-charge value of −208 μC/kg. (C) Positive charged particles with a mass-to-charge value of 72 μC/kg.
Previous research has shown that the mean saltation length and height increase with the increasing wind velocity (Kobayashi, 1972; Maeno et al., 1985; Kosugi et al., 2004; Zhang and Huang, 2008; Xiaohui et al., 2013), while only Schmidt et al. (1999) considered the effect of the electric forces on the snow particle trajectories. Schmidt et al. (1999) theoretically estimated the first hop of single particles with the same initial velocity but differing charges. The results showed that positively charged particles jump higher and further and negative particles do the opposite. However, the first hop cannot represent a stable saltation trajectory. In a stable state of the saltation system with positively, negatively and neutrally charged particles the initial rebound velocities should be given values considering their charge. To estimate the influence of electric forces on the particles’ trajectory in stable state, we calculate the vertical and horizontal effect factors as:
where
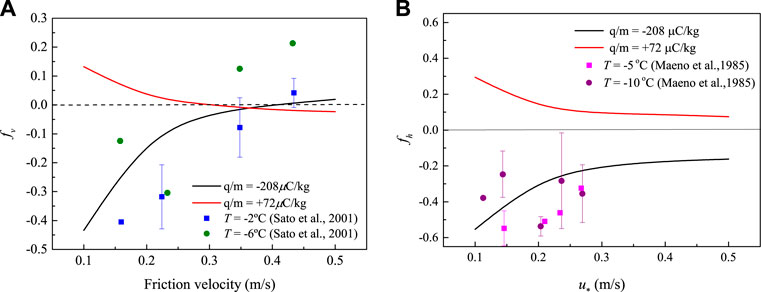
FIGURE 5. (A) Dimensionless saltation height of positive and negative snow particles varies with the friction velocity. The red lines represents for the simulation results for positively (red line) and negative (black line) charged particles. Green dots (T = −6°C) and blue squares (T = −2°C) are experimental data from Sato et al. (2001). (B) Dimensionless saltation length difference between charged particles to neutral particle. Purple dots (T = −10°C) and pink squares (T = −5°C) are experimental data from Maeno et al. (1985).
The effects of electrification on particle saltation height can be estimated considering two factors: vertical rebound velocity and vertical acceleration. The saltation height of a single hop of one particle after a rebound can be estimated as:
where
where the effect of Y is enhanced by its squared contribution, making it stronger than the change of v0c. The experimental data (Maeno et al., 1985; Sato et al., 2001) also supports our simulated results, as shown in Figure 5.
We first took the positive particle and negative particle which have the same magnitude of charge-to-mass ratio but opposite in directions as an example shown in Figure 6A. For the negatively charged particle, its saltation height (in blue line) is 9.14% lower than the neutral particle (in black line), and this is caused by the downward attractive electric force which magnitude is nearly 50% of gravity. For the positively charged particle, its movement pattern transfers from saltation to suspension (in red line), and this is because the upward repulsive electric force reaches the critical value that can balance the downward gravity.
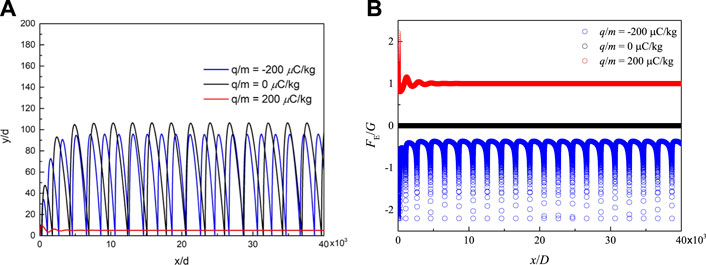
FIGURE 6. (A) Trajectories of positive, neutral, and negative particles. (B) Ratio of electric force to gravity. The values of particles’ charge to mass ratio are −200 μC/kg, 50 μC/kg, and 200 μC/kg.
To investigate how the charge-to-mass ratio impacts the saltation height and length, we compared the fv, fh under different charge-to-mass ratios. Take one example shown in Figure 7A, which indicates an increasing tendency of saltation length from about -24% to +33%, and saltation height from about -14% to +12% when charge-to-mass ratio increases from −200 μC/kg to +200 μC/kg. When the charge-to-mass ratio is larger than +200 μC/kg, there is a regime shift at which the height is about several grain diameters, and the saltation length becomes infinity, which means the particle is floating in the air, and we call it low-level suspension. For these particles, the electric force is equal to the gravity at that height. Thus their vertical momentum dissipates via drag. The suspension height can be estimated by the balance of the electric force and the gravity, which increases with the increasing charge-to-mass ratio, as shown in Figure 7B.
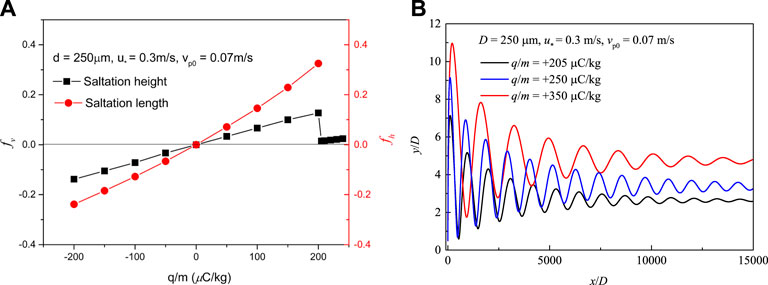
FIGURE 7. (A) Dimensionless saltation height and length for different charge-to-mass ratios of particles. (B) Suspension particles’ trajectories with high value of charge-to-mass.
As it is mentioned above, particles carrying high positive charge change movement patterns from saltation to suspension aided by the electric force. However, the suspension mode returns to saltation mode for higher values of initial velocity, as shown in Figure 8A. Particles with 200 μC/kg of charge-to-mass ratio and 0.34 m/s initial velocity start to show suspension near the ground after the first bounce with the ground, but particles with the same charge-to-mass and higher initial velocity 0.35 m/s stay in the saltation mode. This indicates that suspension only happens when kinematic energy is insufficient to counteract electrostatic energy. Initial velocity and the charge-to-mass ratio value, as the main deciding factor, divide particle movement patterns into three regions for all kinds of particles as shown in Figure 8B: For particles with low charge-to-mass ratio (<100 μC/kg), electric force is not enough to balance the downward vertical gravity; For particles with middle value (100 μC/kg–230 μC/kg) of charge-to-mass ratio, particles are in the transition state, and its movement state governed both by charge-to-mass ratio and initial velocity. Their threshold initial velocity and charge-to-mass ratio satisfy an exponential function relationship, in each kind of wind speed; For particles with high value of the charge-to-mass ratio (>230 μC/kg), particles suspends near the surface under the effect of strong upward electrical force.
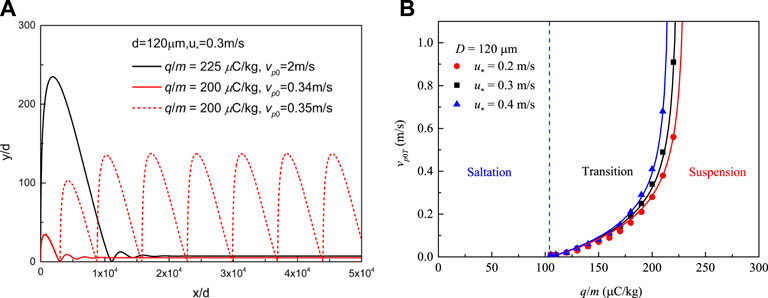
FIGURE 8. The transition of particle saltation to low-level suspension. (A) Examples of particle trajectories at the transition from saltation to suspension as influenced by different initial vertical velocities and charge-to-mass ratios.(B) Three regimes are defined by two charge-to-mass ratio threshold values, in which the lower threshold value is a constant of 105 μC/kg for 120 μm particles while the upper threshold value is affected by friction velocity and initial vertical velocity. The vp0T is the threshold of initial vertical velocity needed for the particle to transit from saltation to suspension. The solid line is fitted by Eq. 17.
Take a 120 μm-sized particle as an example, when its charge-to-mass of the particle is 200 μC/kg, and the initial vertical velocity is less than 0.34 m/s, the particle suspends at a low-level height. It starts saltation when the initial vertical velocity is over 0.35 m/s. As shown in Figure 8, when its charge-to-mass ratio increases to 225 μC/kg, the particle suspends after several impacts even with a high initial vertical velocity value. Different upper threshold velocities for particle suspension corresponding to three classes of friction velocity are calculated. When its charge-to-mass ratio is smaller than a lower threshold value of 105 μC/kg, the particle only can be a saltation particle with any initial vertical velocities. Moreover, this lower threshold is independent of friction velocity but determined by grain size. When its charge-to-mass ratio is over the upper threshold value, the particle suspends. This upper threshold decreases with increasing friction velocity. When its charge-to-mass ratio is between these two values, its initial vertical velocity determines the particle regime. This threshold of initial vertical velocity vp0, th increases with increasing mass-to-charge and is given as:
Where
This transition of saltation to low-level suspension by an electric field will lead to a stratification of drifting snow particles. Low charge-to-mass ratio saltating particles have a higher average height than high charge-to-mass ratio low-level suspension particles, influencing the electric field near the surface, which is however not considered in this study. The suspension height of particle exponentially increases with the charge-to-mass ratio, as is shown in Figure 9, and the function can be fitted as
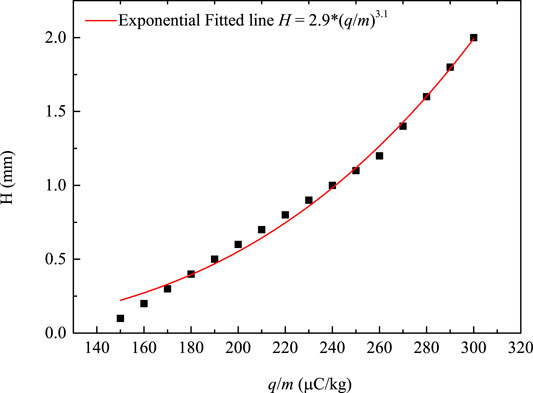
FIGURE 9. The suspension height of particles with different charge-to-mass ratios.
In different granular systems, the particle size obeys different distribution functions. Particle size together with the charge-to-mass ratio determine the threshold for the saltation - suspension transition. It is approximately an exponential function of particle diameter, as is shown in Figure 10. In a natural setting, due to the sublimation and fragmentation of particles moving and bouncing with the surface, mass loss and charge gain of a particle may contribute to a higher charge-to-mass ratio value. Particles with an increasing charge-to-mass ratio are entrained to a higher position in the airflow. As a consequence, the sublimation process could also be intensified due to the increasing number of suspended snow particles in the air.
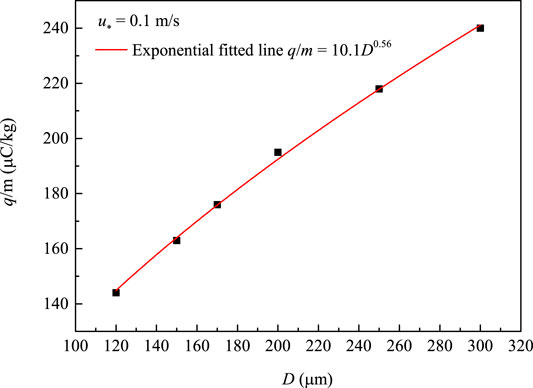
FIGURE 10. Each size of a particle corresponds to a threshold charge-to-mass ratio.
During drifting snow, charged snow particle trajectories are influenced by the electric field in the saltation layer, which has been ignored in most previous simulation models. The simulation model considering the electrification on snow (Schmidt et al., 1999) only analyzed the single hop of one particle, which cannot represent the typical motion for the particles that are in a stable state of saltation. The stable saltation height and length of particles are affected both by the friction velocity, initial particle velocity, and charge-to-mass ratio. In this work, a single charged particle trajectory in the flow field was calculated, and the influence of main factors such as friction velocity, initial particle velocity, and charge-to-mass ratio of the particle was analyzed.
We first investigate the aerodynamic entrainment, rebound, and ejection of these three kinds of particle trajectories in the electric field. For small mass-to-charge ratio and small friction velocity: For particles carrying the same polarity of charge at the snow surface, the effect of initial velocity on saltation height and length can be ignored. For particles carrying different polarities of charge: Negatively charged saltating particles are nearer to the ground with shorter saltation lengths, and positively ones jump higher and further.
An interesting finding is that the final saltation height of particles is the result of two competing influences from the electrical field: The influence on ejection velocity is opposed to the influence on vertical acceleration. Both influences depend on friction velocity and polarity of particles. Both saltation height and length of charged particles tend to become stable with the increasing friction velocity. In high friction velocities, the saltation height of negatively charged particles becomes higher than that of positively charged particles.
With the increasing charge-to-mass ratio, the saltation height of particles gradually increases. When the charge-to-mass ratio is over a critical value, the electrostatic force is large enough to support particles’ suspension in the air at a height very near to the ground surface.
The low-level suspension only happens when the kinematic force on particles is lower than the electrostatic force. Initial velocity and the charge-to-mass ratio value are the main governing factors dividing particle movement state into three regimes: Saltation, transition, and suspension. The low-level suspension height increases exponentially with the increasing charge-to-mass ratio. The threshold charge-to-mass ratio of particles to transfer from saltation to suspension may increase exponentially with the particle size.
This idealized and theoretical study has important limitations: We assumed a static electrical background field, which—despite being consistent with existing experimental data—does not reflect spatio-temporal dynamics which will occur in nature as charging and de-charging dynamically happens due to particle—surface interactions and as charged particles move through the air. We further varied charge-to-mass ratios freely but acknowledge that particle shape, size and temperature will influence and limit possible values. Clearly a fully developed saltation system with many particles, different sizes and a rough surface needs to be investigated to consolidate our results from this idealized study.
Future work, will therefore address these limitations and attempt to include electrostatic forces in a saltation model such as the CRYOS LES (Sharma et al., 2018). A main aspect of this future work should be on dynamically modelling charging of particles and on analysing the influence on total mass flux and sublimation (Sigmund et al., 2022). Overall, this will allow for a better understanding of the momentum/energy transfer near the surface under the effect of the strong electric field in drifting snow, and this can support a theoretical basis for the solving interfere of radiation communication in blizzards.
The raw data supporting the conclusion of this article will be made available by the authors, without undue reservation.
HY and GL designed the model, performed the numerical simulations, and wrote the first draft. NH and ML contributed to the final version of the manuscript. NH supervised the project.
This work was supported by the National Natural Science Foundation of China (Grant No. 41931179 and 42006187), the Second Tibetan Plateau Scientific Expedition and Research Program (Grant No. 2019QZKK020109-2 and 2019QZKK020611), the Fundamental Research Funds for the Central Universities (Grant No. lzujbky-2021-it29 and lzujbky-2020-pd11). And the data and code will be uploaded to the Dryad repository after the paper is published.
The authors declare that the research was conducted in the absence of any commercial or financial relationships that could be construed as a potential conflict of interest.
All claims expressed in this article are solely those of the authors and do not necessarily represent those of their affiliated organizations, or those of the publisher, the editors and the reviewers. Any product that may be evaluated in this article, or claim that may be made by its manufacturer, is not guaranteed or endorsed by the publisher.
Anderson, R. S., and Haff, P. K. (1988). Simulation of Eolian Saltation. Science 241, 820–823. doi:10.1126/science.241.4867.820
Armstrong, R. L., and Brun, E. (2008). Snow and Climate: Physical Processes, Surface Energy Exchange and Modeling. Cambridge: Cambridge University Press.
Clift, R., Grace, J. R., and Weber, M. E. (2005). Bubbles, Drops, and Particles. North Chelmsford, MA: Courier Corporatio.
Clifton, A., and Lehning, M. (2008). Improvement and Validation of a Snow Saltation Model Using Wind Tunnel Measurements. Earth Surf. Process. Landforms 33, 2156–2173. doi:10.1002/esp.1673
Crivelli, P., Paterna, E., Horender, S., and Lehning, M. (2016). Quantifying Particle Numbers and Mass Flux in Drifting Snow. Boundary-Layer Meteorol. 161, 519–542. doi:10.1007/s10546-016-0170-9
Currie, B. W., and Pearce, D. C. (1949). Some Qualitative Results on the Electrification of Snow. Can. J. Res. 27a, 1–8. doi:10.1139/cjr49a-001
Gordon, M., and Taylor, P. A. (2009). The Electric Field during Blowing Snow Events. Boundary-Layer Meteorol. 130, 97–115. doi:10.1007/s10546-008-9333-7
Groot Zwaaftink, C. D., Diebold, M., Horender, S., Overney, J., Lieberherr, G., Parlange, M. B., et al. (2014). Modelling Small-Scale Drifting Snow with a Lagrangian Stochastic Model Based on Large-Eddy Simulations. Boundary-Layer Meteorol. 153, 117–139. doi:10.1007/s10546-014-9934-2
Guala, M., Manes, C., Clifton, A., and Lehning, M. (2008). On the Saltation of Fresh Snow in a Wind Tunnel: Profile Characterization and Single Particle Statistics. J. Geophys. Res. Earth Surf. 113. doi:10.1029/2007jf000975
Kikuchi, T. (1981). A Wind Tunnel Study of the Aerodynamic Roughness Associated with Drifting Snow. Cold Regions Sci. Technol. 5, 107–118. doi:10.1016/0165-232x(81)90045-8
Kobayashi, D. (1972). Studies of Snow Transport in Low-Level Drifting Snow. Contributions Inst. Low Temp. Sci. 24, 1–58.
Kochanski, K., Anderson, R. S., and Tucker, G. E. (2019). The Evolution of Snow Bedforms in the colorado Front Range and the Processes that Shape Them. Cryosphere 13, 1267–1281. doi:10.5194/tc-13-1267-2019
Kosugi, K., Sato, T., and Sato, A. (2004). Dependence of Drifting Snow Saltation Lengths on Snow Surface Hardness. Cold Regions Sci. Technol. 39, 133–139. doi:10.1016/j.coldregions.2004.03.003
Latham, J., and Montagne, J. (1970). The Possible Importance of Electrical Forces in the Development of Snow Cornices. J. Glaciol. 9, 375–384. doi:10.3189/s0022143000022899
Li, G., Huang, N., and Wang, Z. (2017). Drifting Snow and its Sublimation in Turbulent Boundary Layer. J. Phys. Conf. Ser. 822, 012045. doi:10.1088/1742-6596/822/1/012045
Li, G., Wang, Z., and Huang, N. (2018). A Snow Distribution Model Based on Snowfall and Snow Drifting Simulations in Mountain Area. J. Geophys. Res. Atmos. 123, 7193–7203. doi:10.1029/2018jd028434
Lü, X., Huang, N., and Tong, D. (2012). Wind Tunnel Experiments on Natural Snow Drift. Sci. China Technol. Sci. 55, 927–938.
Maeno, N., Naruse, R., Nishimura, K., Takei, I., Ebinuma, T., Kobayabhi, S., et al. (1985). Wind-tunnel Experiments on Blowing Snow. A. Glaciol. 6, 63–67. doi:10.1017/s0260305500010004
McClung, D., and Schaerer, P. A. (2006). The Avalanche Handbook. Seattle, Washington, USA: The Mountaineers Books.
Melo, D. B., Sharma, V., Comola, F., Sigmund, A., and Lehning, M. (2022). Modeling Snow Saltation: the Effect of Grain Size and Interparticle Cohesion. J. Geophys. Res. Atmos. 127, e2021JD035260. doi:10.1029/2021jd035260
Nemoto, M., and Nishimura, K. (2004). Numerical Simulation of Snow Saltation and Suspension in a Turbulent Boundary Layer. J. Geophys. Res. Atmos. 109. doi:10.1029/2004jd004657
Nishimura, K., and Hunt, J. C. R. (2000). Saltation and Incipient Suspension above a Flat Particle Bed below a Turbulent Boundary Layer. J. Fluid Mech. 417, 77–102. doi:10.1017/s0022112000001014
Okaze, T., Niiya, H., and Nishimura, K. (2018). Development of a Large-Eddy Simulation Coupled with Lagrangian Snow Transport Model. J. Wind Eng. Industrial Aerodynamics 183, 35–43. doi:10.1016/j.jweia.2018.09.027
Omiya, S., Sato, A., Kosugi, K., and Mochizuki, S. (2011). Estimation of the Electrostatic Charge of Individual Blowing-Snow Particles by Wind Tunnel Experiment. Ann. Glaciol. 52, 148–152. doi:10.3189/172756411797252167
Sato, A., and Omiya, S. (2011). Electric Field Measurements during the Blowing Snow in a Cryogenic Wind Tunnel by a Non-contact Voltmeter. AGU Fall Meet. Abstr. 2011, C33A–C0629.
Sato, T., Kosugi, K., Mochizuki, S., and Nemoto, M. (2008). Wind Speed Dependences of Fracture and Accumulation of Snowflakes on Snow Surface. Cold Regions Sci. Technol. 51, 229–239. doi:10.1016/j.coldregions.2007.05.004
Sato, T., Kosugi, K., and Sato, A. (2001). Saltation-layer Structure of Drifting Snow Observed in Wind Tunnel. Ann. Glaciol. 32, 203–208. doi:10.3189/172756401781819184
Schmidt, D., and Dent, J. (1994). Measurements of the Electric Field Gradient in a Blizzard. Proc. Int. Snow Sci. Workshop 1994, 197–202.
Schmidt, D. S., Schmidt, R. A., and Dent, J. D. (1999). Electrostatic Force in Blowing Snow. Boundary-Layer Meteorol. 93, 29–45. doi:10.1023/a:1002045818907
Schmidt, D. S., Schmidt, R. A., and Dent, J. D. (1998). Electrostatic Force on Saltating Sand. J. Geophys. Res. 103, 8997–9001. doi:10.1029/98jd00278
Schmidt, R. A. (1972). Sublimation of Wind-Transported Snow: A Model, Vol. 90. Fort Collins, Colorado, USA: Rocky Mountain Forest and Range Experiment Station, Forest Service.
Schmidt, R. A. (1980). Threshold Wind-Speeds and Elastic Impact in Snow Transport. J. Glaciol. 26, 453–467. doi:10.1017/s0022143000010972
Sharma, V., Braud, L., and Lehning, M. (2019). Understanding Snow Bedform Formation by Adding Sintering to a Cellular Automata Model. Cryosphere 13, 3239–3260. doi:10.5194/tc-13-3239-2019
Sharma, V., Comola, F., and Lehning, M. (2018). On the Suitability of the Thorpe-Mason Model for Calculating Sublimation of Saltating Snow. Cryosphere 12, 3499–3509. doi:10.5194/tc-12-3499-2018
Sigmund, A., Dujardin, J., Comola, F., Sharma, V., Huwald, H., Melo, D. B., et al. (2022). Evidence of Strong Flux Underestimation by Bulk Parametrizations during Drifting and Blowing Snow. Boundary-Layer Meteorol. 182, 119–146. doi:10.1007/s10546-021-00653-x
Simpson, G. C. (1919). British Antarctic Expedition 1910-1913: Meteorology. London: Thacker, Spink and Company.
Sommerfeld, M., and Zivkovic, G. (1992). Recent Advances in the Numerical Simulation of Pneumatic Conveying through Pipe Systems. Comput. methods Appl. Sci. 201, 201–212.
Sugiura, K., and Maeno, N. (2000). Wind-tunnel Measurements of Restitution Coefficients and Ejection Number of Snow Particles in Drifting Snow: Determination of Splash Functions. Boundary-layer Meteorol. 95, 123–143. doi:10.1023/a:1002681026929
Wang, Z., and Huang, N. (2017). Numerical Simulation of the Falling Snow Deposition over Complex Terrain. J. Geophys. Res. Atmos. 122, 980–1000. doi:10.1002/2016jd025316
Xiaohui, L., Ning, H., Lei, G., and Guang, L. (2013). Wind Tunnel Study of Vertical Profile of Drifting Snow. Mech. Eng. 35, 20.
Yair, Y., Reuveni, Y., Katz, S., Price, C., and Yaniv, R. (2019). Strong Electric Fields Observed during Snow Storms on Mt. Hermon, israel. Atmos. Res. 215, 208–213. doi:10.1016/j.atmosres.2018.09.009
Yu, H., Mu, L. a., and Xie, L. (2017). Numerical Simulation of Particle Size Effects on Contact Electrification in Granular Systems. J. Electrost. 90, 113–122. doi:10.1016/j.elstat.2017.10.001
Keywords: drifting snow, electric field (EF), particle trajectories, threshold charge-to-mass ratio, near-surface suspension
Citation: Yu H, Li G, Huang N and Lehning M (2022) Idealized Study of a Static Electrical Field on Charged Saltating Snow Particles. Front. Earth Sci. 10:880466. doi: 10.3389/feart.2022.880466
Received: 21 February 2022; Accepted: 23 May 2022;
Published: 15 June 2022.
Edited by:
Ismail Gultepe, Environment and Climate Change Canada, CanadaReviewed by:
Wenyong Ma, Shijiazhuang Tiedao University, ChinaCopyright © 2022 Yu, Li, Huang and Lehning. This is an open-access article distributed under the terms of the Creative Commons Attribution License (CC BY). The use, distribution or reproduction in other forums is permitted, provided the original author(s) and the copyright owner(s) are credited and that the original publication in this journal is cited, in accordance with accepted academic practice. No use, distribution or reproduction is permitted which does not comply with these terms.
*Correspondence: Guang Li, bGlndWFuZ0BsenUuZWR1LmNu
Disclaimer: All claims expressed in this article are solely those of the authors and do not necessarily represent those of their affiliated organizations, or those of the publisher, the editors and the reviewers. Any product that may be evaluated in this article or claim that may be made by its manufacturer is not guaranteed or endorsed by the publisher.
Research integrity at Frontiers
Learn more about the work of our research integrity team to safeguard the quality of each article we publish.