 Ja-Yeon Moon
 Youngeun Choi2*
 Yujin Kim
- 1Climate Research Institute, Konkuk University, Seoul, South Korea
- 2Department of Geography, Konkuk University, Seoul, South Korea
- 3Division of Environmental Science and Engineering, Pohang University of Science and Technology, Pohang, South Korea
This study examines the up-to-date observed trends of subseasonal to annual range climate extremes over the East Asia region using the high-resolution global unified gauge-based analysis of the NOAA Climate Prediction Center for 1981–2021. The spatial extent of extreme events is identified using the Expert Team on Climate Change Detection and Indices (ETCCDI)-based modified climate extreme index (EmCEI) with five subcomponents (maximum temperature, minimum temperature. total rainfall, heavy rainfall, and wet and dry days). By combining the spatiotemporal fields into a simple index, trends in climate extremes are systematically obtained in various time ranges. Annual and semi-annual long-term trends in East Asia showed a statistically significant increase in the percentage of area affected by the upper-extreme climate (warm days, warm nights, wet extreme) and concurrently by the decrease of lower-extreme climate (cool days, cool nights, dry extreme). As the time range becomes higher, the tendency is consistent but extremeness depends on seasons and calendar months. The total EmCEI shows an increasing trend greater in the warm (summer) season than in the cold (winter) season. The temperature extreme components (C1 and C2) are dominated in spring and summer. In the subseasonal months, March has the highest trend among the calendar months both in C1 and C2. The increasing trend is consistently distinct in the 2010s for all time ranges and all components. The long-term trend in winter exhibits distinctive features of the smallest increase than in other seasons and months caused by robust interannual to multidecadal variability in the 1990s–2000s. The area affected by heavy rainfall is mainly dominated in summer while the total rainfall and wet day extreme extend in summer and fall, respectively. The EmCEI suggests that the change in the spatial extent of climate extremes is mainly caused by a shift in temperature and rainfall distributions toward warm and wet extremes over East Asia.
Introduction
“Climate extreme” is a broad term that covers many different types and characteristics of extremes, including high-impact events such as heat waves, floods, and more moderate extremes, including warm days and nights or very wet days (Dittus et al., 2015). The most recent (sixth) report of the Intergovernmental Panel on Climate Change Working Group I (Arias et al., 2021) addressed stronger evidence for changes in extremes and their attribution to human influence, in particular for extreme temperature, precipitation, drought, tropical cyclones, and compound extremes (including dry/hot events and fire weather) since assessment report 5 (Alexander et al., 2013). Hot extremes (Russo et al., 2016; Ceccherini et al., 2017; Herrera-Estrada and Sheffield, 2017) and heavy precipitation have reportedly become more frequent and more intense across most land regions since the 1950s, whereas cold extremes have become less frequent and less severe (Orlowsky and Seneviratne, 2012; Seneviratne et al., 2012; Mishra et al., 2015; Ye et al., 2018), with significant regional variations in precipitation (Hanel and Buishand, 2011; Heinrich and Gobiet, 2011; Sillmann et al., 2013; Ahn et al., 2016).
East Asia has a complex topography, coastline, and atmospheric phenomena at various scales. Frequent weather and climatic disasters are associated with the unique monsoon system (Gong and Han, 2004). It is regarded as being highly vulnerable to natural hazards because of the increase in climate extremes under global climate change and its large population (Hong and Kanamitsu, 2014; Stocker et al., 2014; Kim et al., 2021). The frequency of extreme high-temperature events has increased in most parts of East Asia over the last several decades (Choi et al., 2009; Ding et al., 2010; Min et al., 2014), and the risks associated with some extreme precipitation related to natural disasters have increased. Influenced by the East Asian monsoon system and the complex terrain, the changes in temperature extremes exhibit different spatial characteristics across China (Chen and Lu, 2015; Wang et al., 2015; Wang et al., 2017) with increasing warm nights and decreasing cold days since 1951 (Xu et al., 2013). A fast decreasing trend of winter cold extremes but a slowly increasing trend of summer warm extremes in the 20th century are detected over Korean Peninsula (Min et al., 2015). The enhanced monsoon precipitation due to warming from greenhouse gas emissions was counteracted by decreases in monsoon precipitation due to cooling from human-caused aerosol emissions over the 20th century (Polson et al., 2014; Lau and Kim, 2017). The daily precipitation extremes have increased over parts of the region (Sun et al., 2021) and the heavy precipitation will increase in frequency and intensity, leading to more frequent landslides in some mountain areas. This long-term trend over East Asia with good observational coverage has a common feature with the global change but has high spatial variability (Arias et al., 2021).
Extreme weather events are generally defined as the upper or lower statistical tails of the observed range of values in climate variables or climate indicators (Seneviratne et al., 2012). Tools for monitoring changes in extremes have been developed primarily using indices (Frich et al., 2002). The joint World Meteorological Organization Commission for Climatology/World Climate Research Programme/Joint Technical Commission for Oceanography and Marine Meteorology Expert Team on Climate Change Detection and Indices (ETCCDI) has recommended a suite of 27 extreme indices for international use as standard indices. These indicators are useful for the comprehensive assessment of changes in a range of extremes at single or multiple locations (Gallant and Karoly, 2010). In the 1990s, the Climate Extreme Index (CEI) was developed by the National Centers for Environmental Information to quantify extremes across the contiguous United States (Karl et al., 1996). It is defined by an aggregate set of conventional climate extreme indicators consisting of monthly temperature, drought, and daily precipitation based on the percentage of area affected by extreme conditions. Since the work of Karl et al. (1996), subsequent studies have modified the CEI for application to various regions and longer periods. A revised CEI for the United States was presented by Gleason et al. (2008). They used the highest/lowest 10th percentile threshold values rather than a fixed threshold and improved the spatial coverage for an extended period compared to the original CEI. Gallant and Karoly (2010) provided additional information on the direction of changes in climate extremes by subtracting the lower and upper extremes for Australia and included daily temperature extremes by modifying the CEI (Burkholder, 2007). Only a few studies have applied CEI to the regional scale outside of the United States and Australia (Gallant and Karoly, 2010; Gallant et al., 2014; Moon et al., 2020; Min et al., 2021). Dittus et al. (2015) recently suggested further changes to the modified CEI. They introduced the daily modified CEI (ETCCDI-based modified CEI, EmCEI) using a new method based on standard extreme indices (Donat et al., 2013a; Donat et al., 2013b). Their study provided the first CEI results on the hemispheric scale, including the continental-scale regions of Europe, North America, Asia, and Australia, where sufficient data coverage is available. The EmCEI and its variants are metrics that allow the identification of large-scale, climate changes in extremeness (Dittus et al., 2015). This method provides an efficient tool to document and investigate long-term trends in various aspects of temperature and precipitation extremes in different regions (Gallant et al., 2014).
In this study, we investigate multiple aspects of extreme climate conditions over East Asia (20°–50°N, 100°–150°E) during the recent 41 years (1981–2021). First, the spatial and temporal characteristics of long-term trends in the EmCEI and its subcomponents are explored for the first time from the subseasonal to annual periods in the region of East Asia. Because data availability and quality are the major limitations in applying the CEI to suitable regions, we employed the National Oceanic and Atmospheric Administration (NOAA) Climate Prediction Center (CPC) gauge-based high-resolution grid daily datasets. Section 2 describes the datasets and statistical methods used to define the EmCEI. Section 3 presents the long-term trends of climate extremes in the EmCEI and its five components over East Asia. Section 4 compares the result between the various time ranges. The summary and discussion is in section 5.
Data and Methods
Data
To analyze the EmCEI, 0.5° × 0.5° latitude/longitude grids of CPC gauge-based high-resolution daily maximum temperature, minimum temperature, and precipitation from 1981 to 2021 are used. The CPC extracts surface synoptic weather observations from the Global Telecommunications System and obtains a set of quality-controlled highly quantitative input gauge and satellite data using a robust objective analysis technique with negligible bias (Xie et al., 2007; Chen et al., 2008). The geographical coverage of East Asia is presented with the red box (20°–50°N, 100°–150°E) in Figure 1. Extreme events are analyzed in terms of annual, semi-annual, seasonal, and subseasonal time scales. The semi-annual range is divided by the warm season from May to October (MJJASO) and the cold season from November to April (NDJFMA) of the following year. Thus, the cold season of 1981 is the 6 months from November 1981 to April 1982. In the seasonal range, spring (March–May, MAM), summer (June–August, JJA), fall (September–November, SON), and winter (December–February, DJF) are used. The subseasonal range is defined by monthly variation.
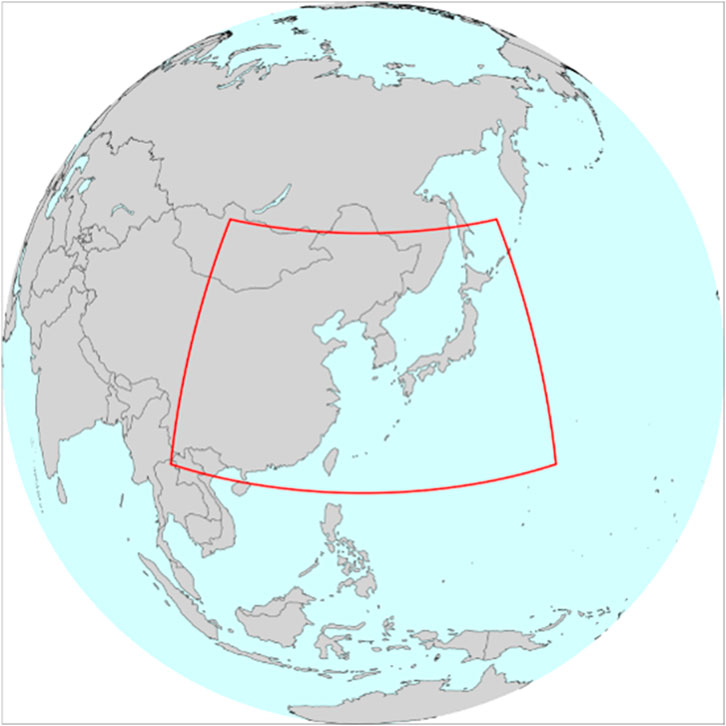
FIGURE 1. Geographical coverage of East Asia (20°–50°N, 100°–150°E, land area in red box).
Statistical Methods
The EmCEI consists of five components (C1 to C5) with seven CEIs and measures the percentage of an area with values above or below the percentile thresholds for the considered variable. In a nonstationary climate, changes to the extremes of a climatic distribution can occur from a shift in the distribution, a change in variance of a distribution, a change in the skewness of a distribution, or a combination of all three possibilities (Allen et al., 2012; Seneviratne et al., 2012). The modified EmCEI considers extreme from both tails of the climatic distribution and can highlight the shifts in the climatic distribution or skewing toward a particular tail of the distribution (Gallant et al., 2014). The method of calculating the EmCEI is presented in Table 1 (see Dittus et al., 2015, for more details). Each component is calculated for subseasonal to annual periods at every grid point over East Asia.
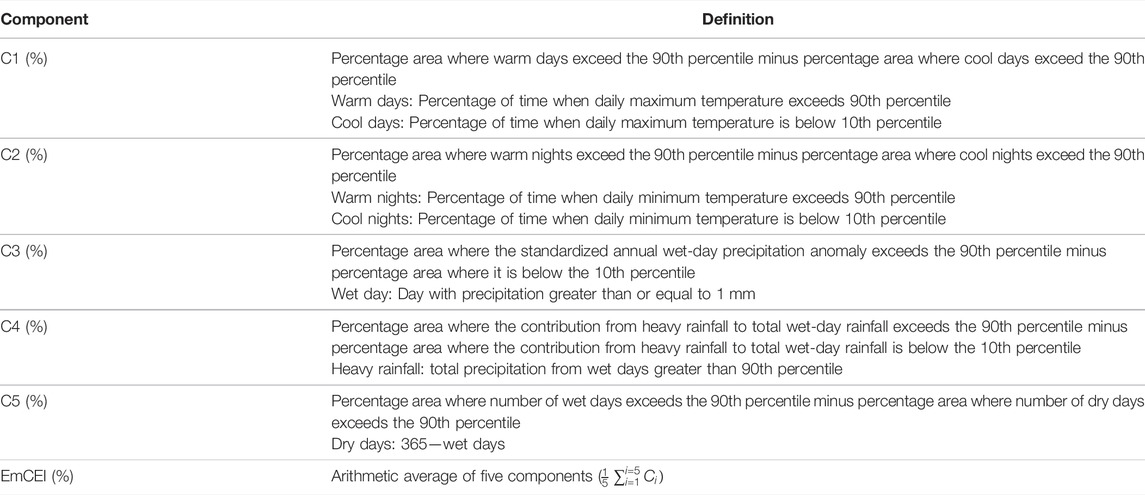
TABLE 1. Definition of each component in EmCEI. Percentile thresholds are calculated for 1981–2021.
The long-term trend in the most recent years (1981–2021) were computed using linear regression and are described in the units of percent per decade. The significance of these trends was determined using a modified nonparametric Mann–Kendall test that accounted for persistence in the time series (Hamed and Rao, 1998). The statistical significance was assessed at the 5% level (Kendall, 1975).
The extremes identified by the temperature components in EmCEI (C1 and C2) are based on the 90th and 10th percentiles of the daily maximum/minimum temperature. Meanwhile, the precipitation components in EmCEI (C3–C5) consider wet days within the subseasonal to annual time scales. The 90th percentile of this wet day precipitation has one threshold value at each grid and time range while the thresholds for the temperature have 365 daily values for each grid point.
Figure 2 shows the distributions of EmCEI thresholds used in this study for the daily maximum temperature (Tx), daily minimum temperature (Tn), and wet day precipitation at individual grid points from January to December. The spatial structures of thresholds for the annual, semi-annual, and seasonal time scales are analogous to the seasonal evolution of the monthly distributions (not shown). Each percentile value in Figure 2 has a larger amplitude toward the south and near the ocean, with obvious seasonality. The wet day extreme rainfall is high over countries in southeastern China near the Yangtze River basin, the Korean Peninsula, and western Japan. The amplitude is smaller in the cold season and less than 5 mm over North China during winter. The daily maximum temperature in summer covers the most area above 30°C at the 90th percentile while it drops to below at the 10th percentile. In winter, Tx10p, Tn90p, and Tn10p decrease to below zero over North and Northeast China and extend southward from November to next March (April for Tn10p). The highest and lowest threshold values from both daily maximum and minimum temperature exist in July–August and December–January, respectively with the temperature ranging from −40°C (Tn10p) to 38°C (Tx90p).
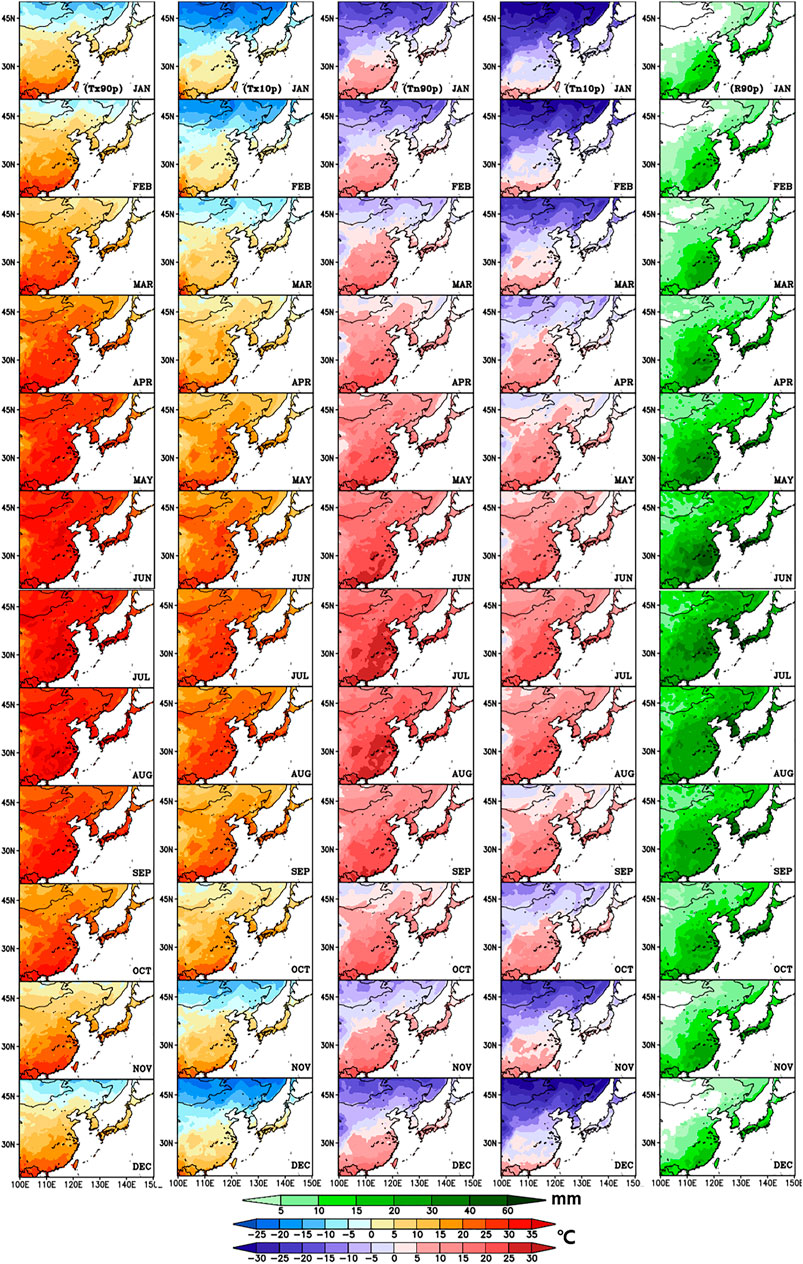
FIGURE 2. Distributions of thresholds used in EmCEI for the 90th percentile of daily maximum temperature (Tx90p, first column), 10th percentile of daily maximum temperature (Tx10p, second column), 90th percentile of daily minimum temperature (Tn90p, third column), 10th percentile of daily minimum temperature (Tn10p, fourth column), and 90th percentile of wet day precipitation (R90p, last column) at individual grid points from January (top) to December (bottom). The base period for the percentiles is 1981–2021. The daily temperature thresholds are averaged over a month.
Long-Term Trends of EmCEI
Spatiotemporal Trends in Annual and Semi-Annual Periods
Figure 3 shows the annual trends of EmCEI and its subcomponents for East Asia from 1981 to 2021. Statistically significant trends are indicated by asterisks in the figure legend. In Figures 3B–F, each component (C1–C5) is indicated by a solid line (with gray shading) and has upper extreme (90th percentile, positive bar) and lower extreme (10th percentile, negative bar) values. The total EmCEI (3A, black solid line), which represents the average of the five components reveals a 9% decade−1 increase in the percentage of the area experiencing extreme climate both contributed by the temperature and precipitation. The 1980s and 2010s have opposite phases, where the areas experiencing extreme climate by the contribution of lower extreme (cold and dry) temperature and precipitation in the 1980s have changed to the upper (90th percentile) extreme warm and wet condition in the 2010s.
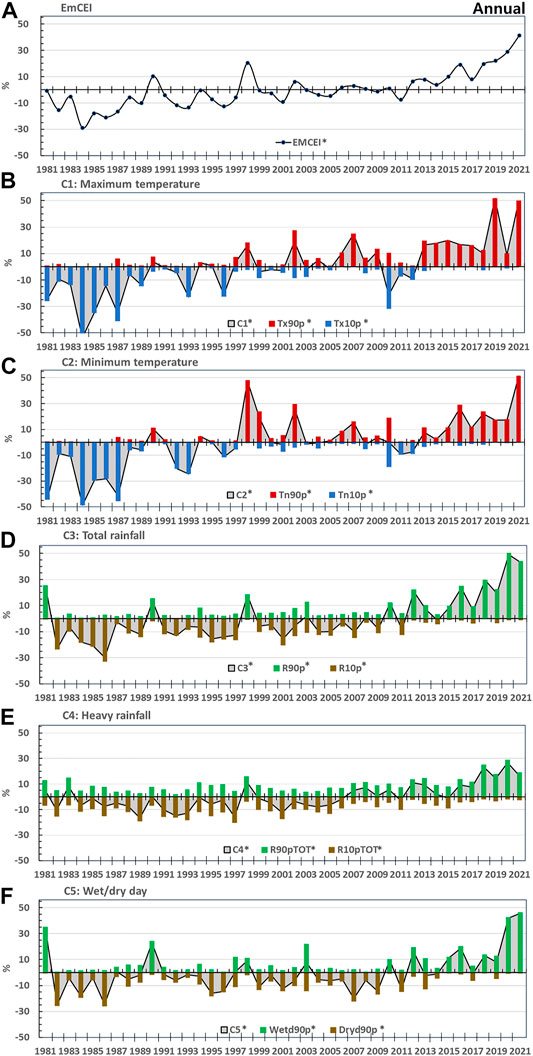
FIGURE 3. EmCEI and its five components ((A): C1, (B): C2, (C): C3, (D): C4, (E): C5) for annual time period over East Asia in 1981–2021. These components represent the percentage area of the East Asia region that experienced extreme warm days (Tx90p) or nights (Tn90p) in red bars and extreme cool days (Tx10p) or nights (Tn10p) in blue bars. Green and brown bars show the percentage areas experiencing wet and dry extremes, respectively. Solid gray line corresponds to temperature and precipitation components, where the lower-tail extremes were subtracted from the upper-tail extremes. Statistical significance of trends was calculated using the Kendall tau test. An asterisk indicates statistical significance at the 5% level.
As shown in Figures 3B–F, annual increases in the subcomponents are observed, where the increase in extreme temperature (C1: 12% decade−1, C2: 12% decade−1) is higher than the increase in extreme precipitation (C3: 9% decade−1, C4: 5% decade−1, C5: 5% decade−1). The temperature extremes show a growing upper-tail prevalence in both maximum and minimum temperatures. That is, the East Asia region has experienced more extremely warm days and nights than extremely cool days and nights in the most recent decade. The precipitation component, C3, represents extreme total rainfall. In the 2010s, the area of the upper extreme mostly covered East Asia, and the lower extreme area covered less than 5%. The areal percentage of upper extreme heavy rainfall (C4) also contributed more than the lower extreme (10th percentile) in the 2010s. The area with extreme numbers of wet and dry days (C5) also exhibits a significant pattern, where the area experiencing the wet day extreme is larger than the dry day extreme in the 2010s.
Note that the precipitation components in Figure 3 show both upper- and lower-tail extreme contributions, in contrast to the temperature components, where most years have a contribution from either the upper- or lower-tail extreme. Thus, the spatial coherence of the temperature extremes is much larger than that for precipitation extremes, as reported by Dittus et al. (2015). In their study, the EmCEI was first applied across five large-scale regions (the Northern Hemisphere, North America, Europe, Australia, and Asia); the areal extent of Asia (10°–70°N, 60°E–170°E) is much broader than that in our study, covering the tropics to high latitudes during 1951–2010. The annual EmCEI trend for Asia revealed a 5% decade−1 increase, with a greater increase for the temperature components than for the precipitation components. Our result (Figure 3) is consistent with their study, however, there are several differences. First, the base period for the analysis includes up-to-date climate information. Second, we consider a more regional scale for the East Asia region. Third, various time scale changes are added and compared. Thus, several discrepancies appeared as follows. There is an abrupt increase in the temperature and precipitation extremes in the recent decade (the 2010s), which has led to an increasing trend of five components as well as the total EmCEI. The year 2021 is recorded to be the highest that experience extreme from a multivariable in more than 40% of East Asia. The amplitude of the year-to-year variability differs due to the difference in the base period. Because East Asia is significantly affected by the seasonal overturning of the monsoon flow, there are seasonal and subseasonal dependencies in extreme climate which will be explained in Figures 4–10.
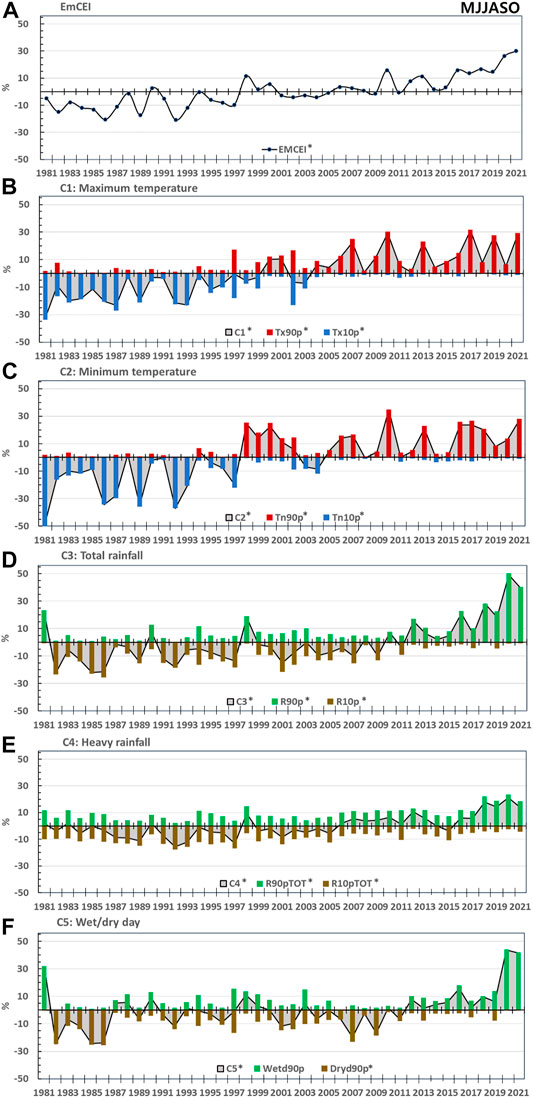
FIGURE 4. Same as Figure 3, except for the warm season (May to October).
The semi-annual trends of the EmCEI are shown in Figures 4, 5. In both warm and cold seasons, a significant increase in EmCEI is observed, where the increase is greater in the warm season (8% decade−1) than in the cold season (6% decade−1). The increases in C1 (11% decade−1) and C2 (11% decade−1) in the warm season are higher than those in the cold season (C1: 9%, C2: 8% decade−1). The temperature component (C1 and C2) in the cold season show a large interannual to decadal variability during the late 1990s to early 2010s. The weaker trend may be related with the observed aerosol cooling in the 20th century (Arias et al., 2021) and the multidecadal variability (Miao and Wang, 2020), which counteracts the consistent increase in temperature over East Asia especially in the cold season. The contributions of the upper tail to extreme precipitation have a consistent trend with the temperature but a more robust increment in the recent decade during the both season and higher in warm season. Because East Asia has a distinct rainy season in summer, the large amount of rainfall affects the annual precipitation by processes with various time and spatial scales. The contribution of extremely heavy rainfall (C4) in the warm season is larger than in the cold season (5 and 2% decade−1, respectively). The wet/dry day extreme (C5) in both seasons also has a significant trend and is highly correlated (R = 0.9 regardless of the trend) with the total rainfall extreme (C3).
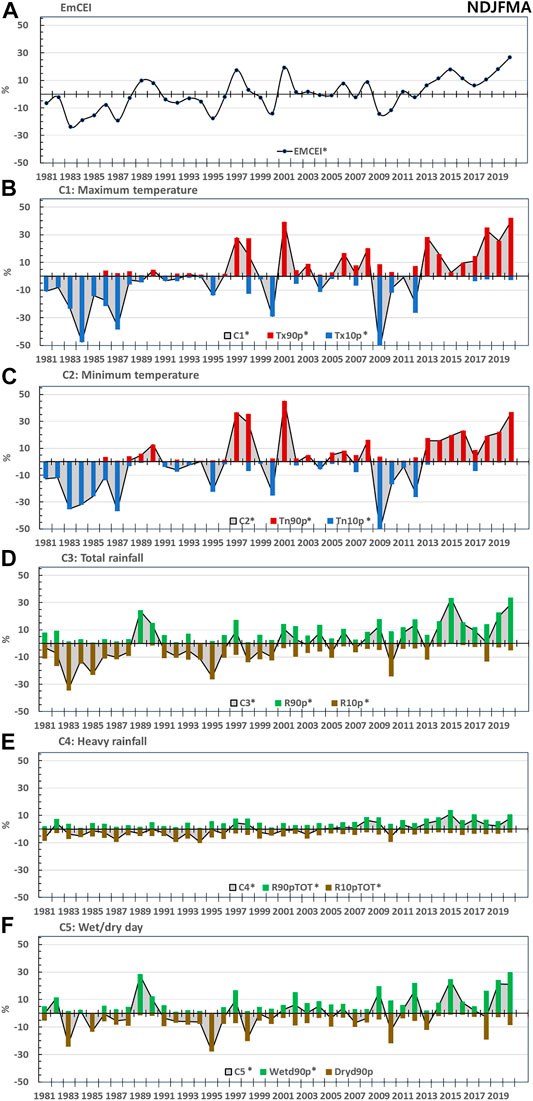
FIGURE 5. Same as Figure 3, except for the cold season (November to April).
In short, the extreme temperature shows a more distinct increasing trend in the warm season than in the cold season, as well as the upper-tail extreme of wet-day total rainfall, rain days, and heavy rainfall. In both seasons, EmCEI was highest in the most recent year of the analysis (2021 and 2020 for warm and cold seasons).
Spatial Distributions of EmCEI Components
The EmCEI integrates several components that assess changes in temperature and precipitation extremes and returns a percentage value representing the fraction area of a region affected (Gallant et al., 2014). In Figure 6, we selected the years with the highest and lowest EmCEI in the annual and semi-annual trends and plotted the grid points that contribute to the extreme of each component. We can monitor the locations of temperature and precipitation extremes separately using this multivariate index. In the annual, warm, and cold seasons, the highest percentage of upper (lower) tail extremes occurred in 2021 (1984), 2021 (1992), and 2020 (1983), respectively. The highest percentage is mostly explained by either the upper or the lower tail extremes in the temperature while it is largely (or partly) explained by either side of the extreme in the precipitation. The upper (lower) tail extremes of C1 to C5 include warm (cool) days, warm (cool) nights, wet-day total rainfall, the contribution of heavy rainfall to total wet-day rainfall, and the number of wet (dry) days exceeding (below) the 90th (10th) percentile, respectively.
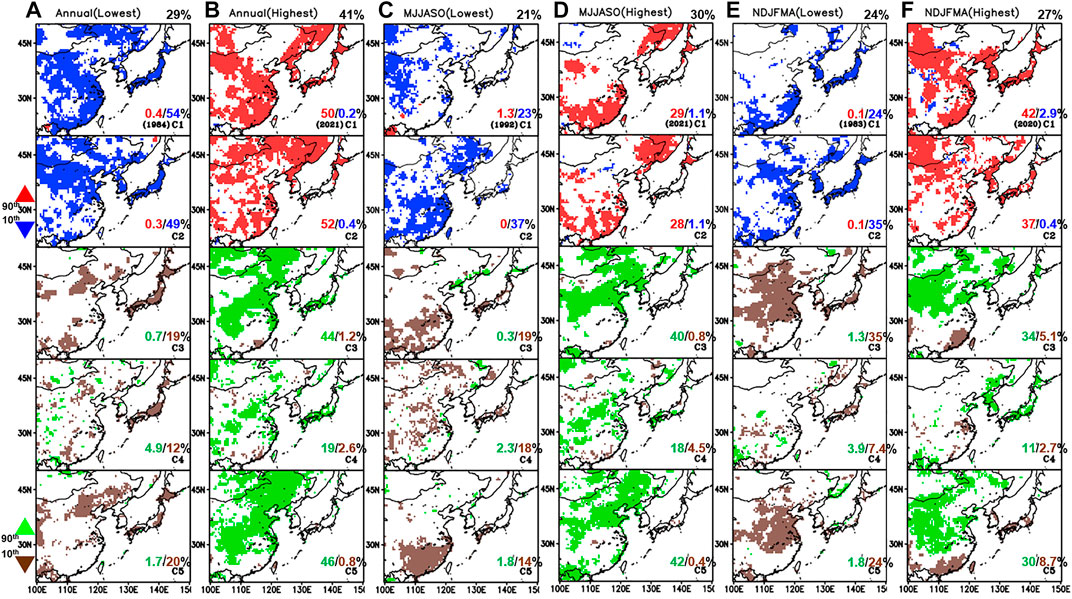
FIGURE 6. Distribution of locations exposed to upper and lower tail extremes of EmCEI subcomponents (C1 to C5) in the (A,B) annual (C,D) warm season (MJJASO), and (E,F) cold season (NDJFMA). The years with the lowest and highest EmCEIs are chosen. The percentage of area in the EmCEI is shown at the upper right corner and the areal percentages of upper and lower tails in the CEI are displayed at the bottom-right corner, respectively. White areas are non-extreme events during the time period.
In the annual EmCEI (Figures 6A,B), C1/C2 in 1984 and 2021 cover approximately 50% of East Asia, with opposite extreme conditions. The year 2021 was the eighth of the top 10 warmest years on record that occurred in the last decade. East Asia was also exposed to one of the hottest summers in China, Korea, and Japan. Most areas exposed to the lower tail extreme in 1984 are shifted to the upper tail extreme in 2021. For C3 to C5, the area experiencing wet extreme are mostly over North and Southcentral China in 2021. In Japan, dry extreme conditions prevail all around the country in 1984 while the opposite wet extreme occur over western Japan in 2021. The area exposed to the dry extreme in C3 to C5 mostly overlaps the wet extreme with more extended regions. As shown in warm season EmCEI (Figures 6C,D), the cool night extreme (C2) in 1992 occur in a larger area than the cool day extreme (C1). During the 2021 warm season, C1 and C2 concurrently reveal a 30% area of warm day and night extreme over the south and eastern coast and Northeast China. The areas with lower-tail precipitation extremes in C3 and C5 occur over southern China and western Japan, whereas small areas in C4 are scattered across East Asia. The upper-tail precipitation extreme in the warm season is consistent with the annual range, showing the contribution of extreme precipitation is mostly from the warm season. In the cold season EmCEI (Figures 6E,F), cold and dry extremes prevailed over the continent adjacent to the ocean and central-north China, respectively in 1983. The Korean Peninsula and Japan experienced extreme cold. While in winter 2020, simultaneous but opposite warm and wet extremes with the area more extended are observed. C3 and C5 reveal consistent wet extremes in North China which means the frequent wet days contributed to the extreme rainfall. In C4, strong heavy rainfall dominates over Korean Peninsula and Japan.
Based on the long-term trends and the information in Figure 6, we can identify the land area affected by the extreme climate in a specific time period, which component makes the largest contribution, and which locations have the greatest exposure to various extreme conditions. The spatial distribution of extreme conditions clearly showed multivariate features on an equal basis over the East Asia region. From the two highest records by upper- and lower-tail extreme temperature, the area of cold extreme at the lowest year are changed to be exposed to the warm extreme at the highest year.
Spatiotemporal Trends in Seasonal and Subseasonal Periods
Long-term trends of EmCEI and subcomponents from spring to winter are shown in Figure 7. In each season, indices from subseasonal months (Figure 8) are plotted to evaluate their contribution to the season.
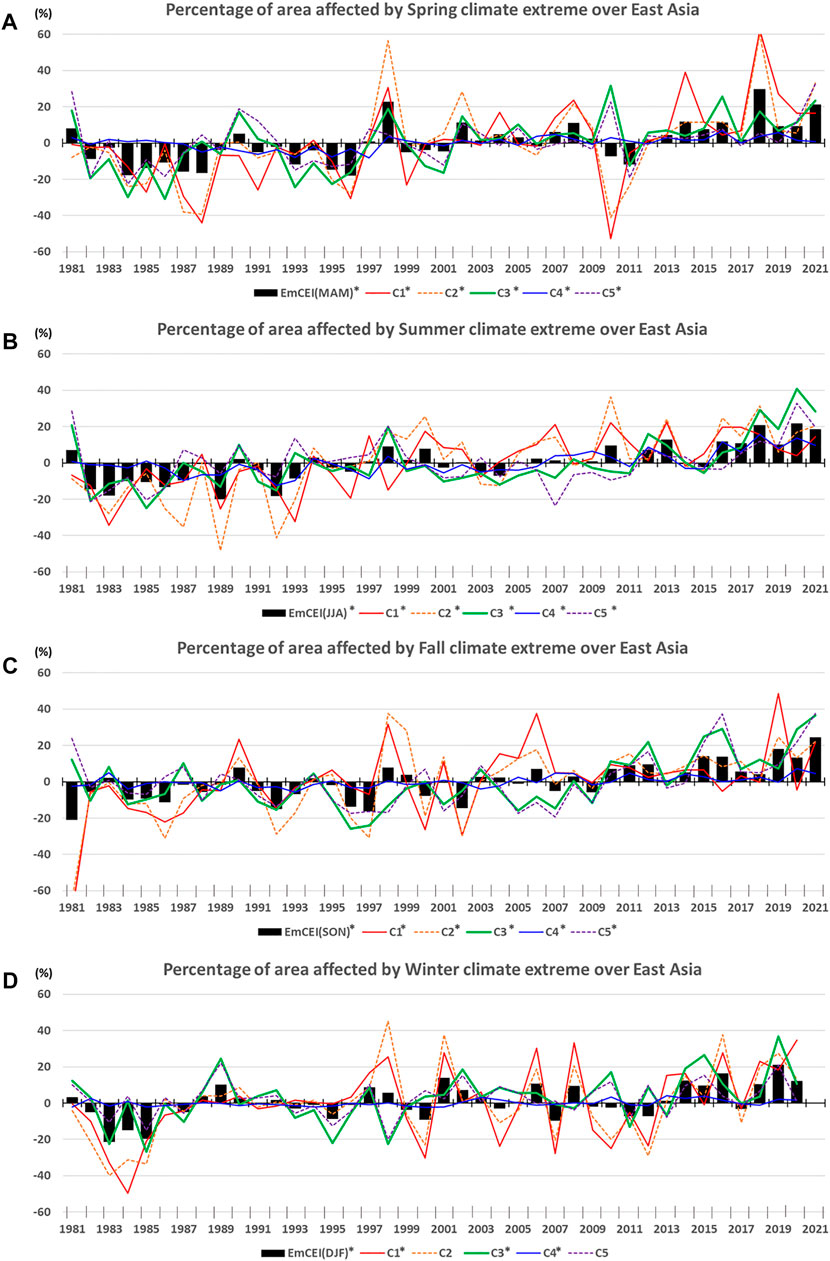
FIGURE 7. The EmCEI and its five components (C1–C5) for East Asia in (A) spring (B) summer (C) fall, and (D) winter of 1981–2021. The EmCEI is displayed by black bar and the five components (C1 to C5) are plotted as colored line. Statistical significance of trends was calculated using the Kendall tau test. An asterisk indicates statistical significance at the 5% level.
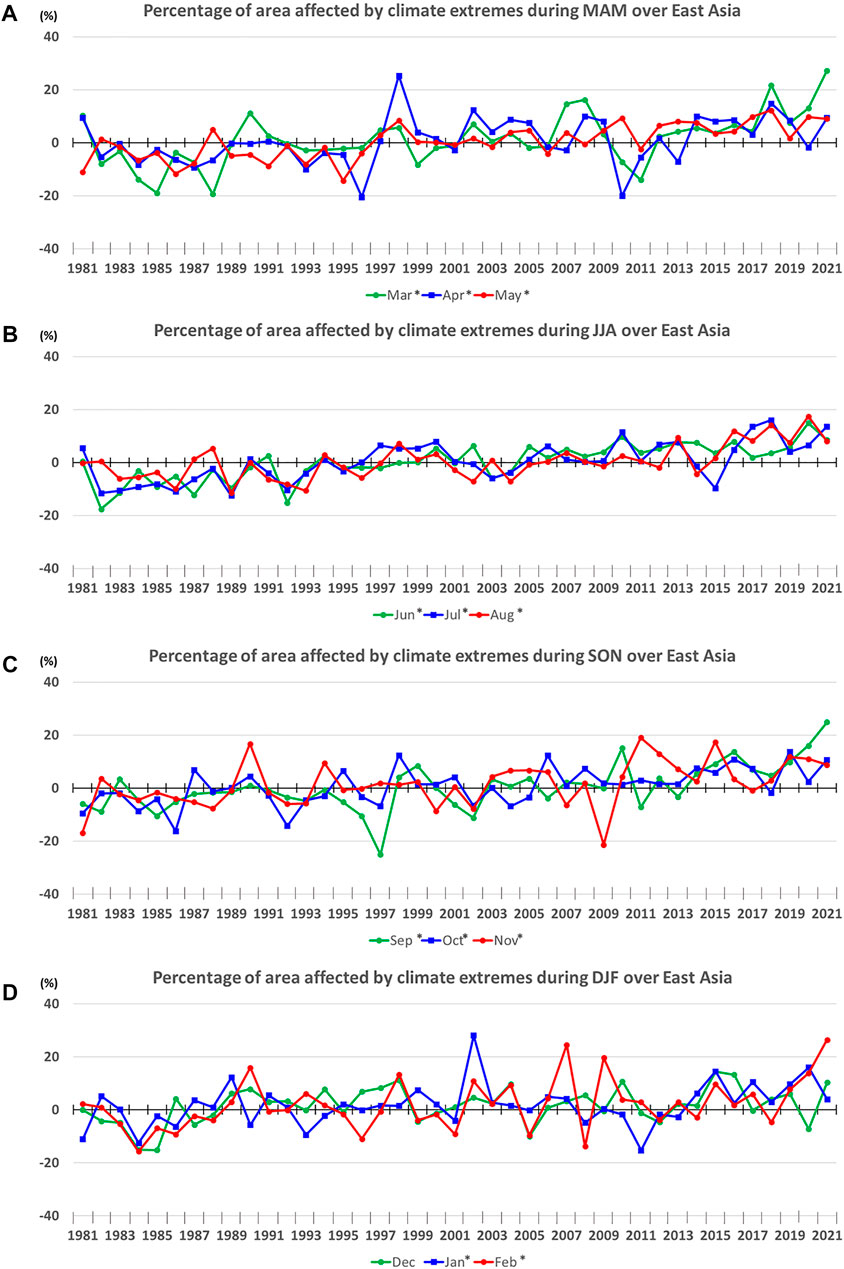
FIGURE 8. The EmCEI in subseasonal range for East Asia during (A) March to May (B) June to August (C) September to November, and (D) December to February of 1981–2021. The EmCEI at each month is displayed by colored line. Statistical significance of trends was calculated using the Kendall tau test. An asterisk indicates statistical significance at the 5% level.
In spring (Figure 7A), there are some years with marked spatial coverage that has experienced warm extremes in the recent decade. East Asia was exposed to cold and dry conditions in the 1980s–1990s and changed to the opposite conditions (warm and wet) afterward except for 2–3 years of opposite variations. The areas of extreme total rainfall are gradually increased and more frequent days of precipitation is found in the recent decade. In the case of heavy rainfall extreme, only a small area is exposed. Among the seasons, the increasing trend of maximum temperature (C1: 9% per decade) and total rainfall (C3: 7% per decade) is the highest in spring with the largest contribution from March and May, respectively. There is a large interannual variability from the late 1990s to the 2000s during April (Figure 8A).
In summer (Figure 7B), the contrasting tendency before and after the 2000s in the temperature extremes is obvious. The contributions from the minimum temperature are larger and have the highest increment among the seasons with the largest contribution from decreasing trend of the cool night in June (shown in Figure 9C). Because of the distinct rainy season over East Asia, smaller but significant trends are found in all three components of the wet day precipitation (C3 to C5). In the recent decade, there is an abrupt increase in the regions with extremely heavy and frequent rainfall causing the extreme total rainfall in East Asia. On the subseasonal scale, June to August shows the most steady and consistent trends and less interannual to decadal variability in comparison with other seasons.
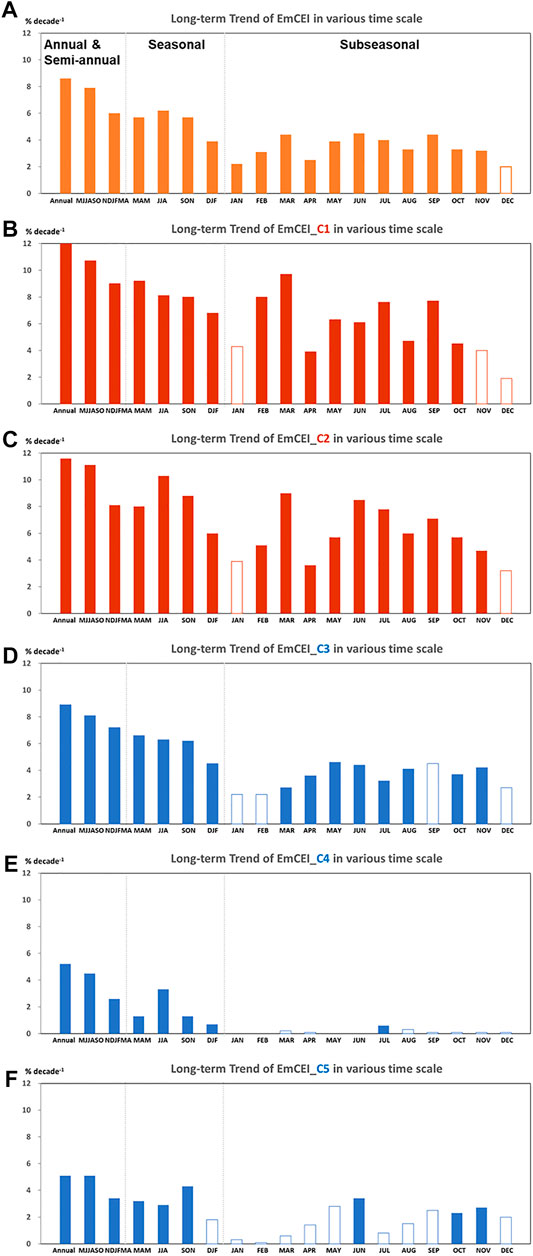
FIGURE 9. The long-term trends in the percentage of area affected by extreme climate represented by (A) EmCEI and (B–F) its five components (C1–C5) at the various time scales (subseasonal months, seasons, warm and cold seasons, and annual range) during 1981–2021. The unit is % per decade. Colored bars indicate significant trends.
In fall, changes toward the warm and wet extreme conditions are also obvious. Compared to other seasons, the enhanced wet day extreme is the largest. There are large monthly discrepancies (especially in temperature). In November, low trends and large interannual variability prevail through the analysis period. In spite of the monthly discrepancies, a warm and wet shift toward the recent decade is clearly found in seasonal (Figure 7C) and subseasonal (Figure 8C) EmCEI.
In winter, long-term trends in the minimum temperature (C2) and wet/dry day extremes are not significant and there is the largest interannual to multi-decadal variability, resulting in the lowest magnitude in trend among all the seasons. In the context of global warming, East Asian winter air temperature exhibits pronounced and complicated subseasonal variations (Yang and Fan 2022). In Figures 7D, 8D, winter shows the largest interannual variability in the spatial coverage of extreme temperature during the analysis period as well as the highest subseasonal variability among the seasons. In addition, the largest interannual variability occurs in the late 1990s to early 2010s in C1 and C2 (Figure 7D). During winter 2020/21, there were extreme cold waves that invaded China from December 2020 (Dai et al., 2021), then the record-breaking warm event in February 2021 (Zhang et al., 2021) was caused by Arctic sea ice melting and stratospheric sudden warming. As such, the EmCEI in December 2020 and February 2021 is revealed as the opposite extreme in Figure 8D.
In short, the seasonal long-term trend in the extreme maximum (minimum) temperature was strongest during spring (summer) and weakest during winter. The seasonal long-term trend in the extreme total rainfall, heavy rainfall, and wet days were highest in spring, summer, and fall, respectively. The tendencies in the EmCEI and five components represent an increasing proportion of East Asia experiencing warm and wet extremes in the 2010s of the recent decade except for weak signal in the winter due to large subseasonal and interannual variability.
Long-Term Trends of EmCEI Components in Various Periods
In the previous two sections, we have assessed changes in long-term climate extreme shifting from cold to warm and dry to wet depending on the space and time. To further identify the types of changes that are leading to changes in extremes, the magnitude of the trend from each component and its upper and lower tails are computed for subseasonal to annual periods in Figures 9, 10.
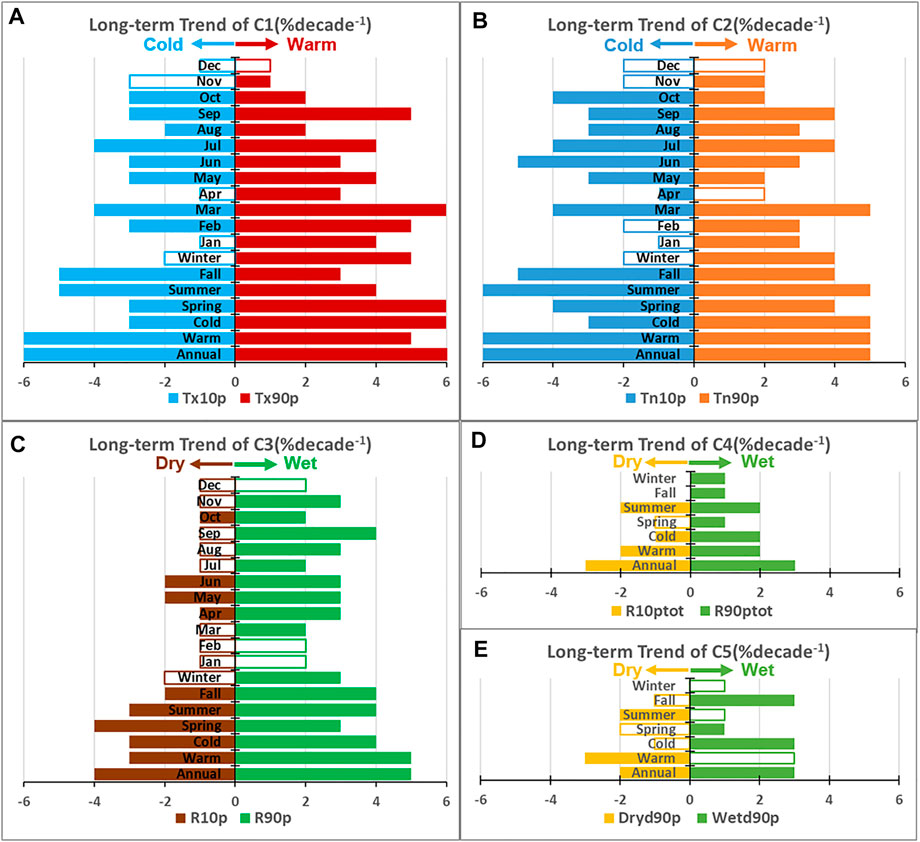
FIGURE 10. Long-term trends in the percentage of area affected by extreme climate represented by upper (right) and lower (left) tails of (A) C1 (B) C2 (C) C3 (D) C4, and (E) C5 in EmCEI at subseasonal months, seasons, warm and cold seasons, and annual ranges (top to bottom) during 1981–2021. The unit is % per decade. Colored bars indicate the significant trends.
In Figures 9A–F, five components in EmCEI consistently indicate more areas are exposed to extreme temperature and precipitation in the warm season than in the cold season. Among the seasons, EmCEI (A) has the highest and lowest trends in JJA and DJF, respectively. However, comparing each component with seasons, the highest trend in C1 and C3 occurs in spring, C2 and C4 in summer, and C5 in fall. In the subseasonal range, the trend of temperature extreme is robust and highest in March. The trend in the total rainfall extreme is significant mostly in the months of the warm season and highest in May which is not the peak period in the summer rainy season over East Asia. The monthly trend in C4 shows the lowest value because of its reduced spatial coherence by local effects. The wet day extreme tends to be only significant in June, October, and November.
In Figure 10, the long-term trends by the upper and lower extremes are displayed with the direction of change in percent per decade. Increased areas of warm and wet extreme climate (warm shift) can be detected in East Asia when these two tails enlarged to the opposite directions. In the annual range, a decreasing trend of the lower-tail (left) and increasing trend of the upper-tail (right) in five components (A–E) are comparable and significant, reflecting the robust shift in climate extreme from cold and dry to warm and wet regions. When subdividing the time range to shorter scales, the ratio between the trend of upper and lower tail extremes becomes asymmetric. In the winter season and from November to January, the trends in the lower-tail temperature extreme are not significant. There is no significant trend in any of the components in EmCEI during December.
During the summer and warm season, decreasing cold extreme is slightly higher than the increasing warm extreme whereas the tendency becomes the opposite in the winter and cold season. As indicated in the previous section, trends in March are the highest among the calendar months and higher at the upper extreme temperature. In the extreme precipitation, most of the months in the lower-tail do not show significant trends except for April to June and October. Meanwhile, the increasing trend at the wet extreme occurs in most of the months except for the winter months. The trend in precipitation extremes of C3 (C) and C4 (D) in seasonal to annual periods correspond in showing the extreme climate change from dry extreme to wet extreme. The wet and dry day extremes (E) have a variable tendency in the direction of the extreme by the season. The warm season and summer have a more significant trend in the decreasing of dry day extreme while the opposite occurred in the fall and cold season. This means locations with frequent wet days have increased in the cold season.
Overall, the long-term trends of decreasing lower-tail extreme and increasing upper-tail extreme are clearly found in temperature extreme from subseasonal to annual periods except for winter and winter months. The wet extreme also showed large subseasonal to seasonal asymmetry toward the upper tail extreme.
Summary and Discussion
In this study, a newly developed climate extreme index (the EmCEI) was applied for East Asia region to investigate the multiple aspects of extreme climate conditions in the recent 41 years. The long-term trends of EmCEI and its five components in various time periods are successfully obtained using the high-resolution gridded and real-time available CPC gauge-based datasets.
During the recent decades (1981–2021), significantly increasing trend in the areal extrent of climate extreme was detected in the East Asia. Due to the abrupt and consistent increase of temperature and precipitation extremes in the 2010s, the long-term trends over East Asia have been more increased. The climate extreme from the cold and dry to the warm and wet (warm shift) signal was continuously observed from the subseasonal to annual time periods. The highest extreme year of EmCEI occurred in 2021 and covered 41% of East Asia contributed both by the warm and wet extreme conditions. China and Japan experienced a warm and wet year while warm conditions prevailed in Korean Peninsula.
The EmCEI in the annual, warm season, cold season, spring, summer, fall, and winter periods increased significantly, by 9, 8, 6, 6, 6, 6, and 4% decade−1, respectively. From the temporal distribution of EmCEI, there was a distinct contrasting tendency between the 1980s and 2010s, where the areas experiencing extreme climate are mainly contributed by the upper (90th percentile) extreme temperature and precipitation in the 2010s. The temperature extremes show a growing upper-tail prevalence in both maximum and minimum temperatures. The precipitation extremes exhibited an abrupt increase in the 2010s. The spatial extent of extreme total precipitation, wet days, and the contribution from the heavy rainfall have increased concurrently. Because heavy rainfall develops on the mesoscale to synoptic scale mainly in the warm season, the spatial coverage of the contribution from extremely heavy rainfall is much lower in other seasons than summer. The total rainfall extreme showed a high correlation (R = 0.9) with the wet day extreme in all time periods.
Analysis of EmCEI with five subcomponents in various time periods revealed large subseasonal to seasonal discrepancies. The increase in EmCEI is greater in the warm season than in the cold season. The highest trend in the maximum temperature and total rainfall are found in spring, minimum temperature and contribution from the heavy rainfall in summer, and frequent wet days in fall. The monthly trend in C4 showed the lowest value because of its reduced spatial coherence by local effects. The distinct subseasonal to seaonal discrepancies in the EmCEI subcomponents are summarized as follows:
1) C1 in spring showed the highest increasing trend (C1: 9% decade−1) and March recording the largest contribution as well as the highest trend in all calendar months.
2) C2 in summer has the largest trend (C2: 10% decade−1) and March shows the highest trend in all calendar months.
3) C3 is slightly higher in spring (C3: 7% decade−1) and comparable with summer and fall. May shows the highest trend in all calendar months.
4) C4 in summer shows the highest increasing trend and June only shows the significant trend.
5) C5 in fall shows the most increasing trend while in June, October, and November has the significant trend.
Of note, the long-term trend in winter exhibits distinctive features. During the 1990s–2000s, the year-to-year variability of extreme temperatures increased. As mentioned in section 3.1, changes due to a large interannual to decadal variability counteracts the consistent increase in temperature over East Asia. Thus, the temperature extremes in winter show a smaller increase than in other seasons, and December-January has the lowest trend and was not significant.
Comparing the long-term trends in the upper and lower tails of extreme among the EmCEI components and various time periods, decreasing lower-tail extreme and increasing upper-tail extreme is equally found in temperature extreme from subseasonal to annual periods except for winter and winter months, having the largest asymmetry. In the precipitation, asymmetry toward the wet extreme prevailed in the subseasonal range.
This study provides a more complete picture of the observed trends in the spatial extent of climate extremes over the East Asia region. The EmCEI introduced and applied for East Asia provided sufficient information to investigate which types of extremes are changing over the region on various time scales of interest. To further analyze the extremeness such as where the extremes are occurring or how extreme those values are, a more precise calculation is needed which will be the further study.
Data Availability Statement
The original contributions presented in the study are included in the article, further inquiries can be directed to the corresponding author.
Author Contributions
J-YM and YC designed this manuscript; J-YM, YK, and SM performed the data analysis; J-YM and YC drafted the manuscript; YK and SM performed manuscript review and editing.
Funding
This paper was supported by the Konkuk University in 2019.
Conflict of Interest
The authors declare that the research was conducted in the absence of any commercial or financial relationships that could be construed as a potential conflict of interest.
Publisher’s Note
All claims expressed in this article are solely those of the authors and do not necessarily represent those of their affiliated organizations, or those of the publisher, the editors and the reviewers. Any product that may be evaluated in this article, or claim that may be made by its manufacturer, is not guaranteed or endorsed by the publisher.
Acknowledgments
We would like to thank Editage (www.editage.co.kr) for English language editing. We are grateful to NOAA/OAR/ESRL PSL, Boulder, CO, United States, for providing the Interpolated OLR data (Web site at https://psl.noaa.gov/data/gridded/data.interp_OLR.html#detail), CPC Global Unified Precipitation data (Web site at https://psl.noaa.gov/data/gridded/data.cpc.globalprecip.html), CPC Global Temperature data (Web site at https://psl.noaa.gov/data/gridded/data.cpc.globaltemp.html), and to Copernicus Climate Data Store, Copernicus Climate Change Service, ECMWF for providing the ERA5 reanlysis data (Web site at https://cds.climate.copernicus-climate.eu/cdsapp#!/dataset/reanalysis-era5-pressure-levels-preliminary-back-extension?tab=overview).
References
Ahn, J.-B., Jo, S., Suh, M.-S., Cha, D.-H., Lee, D.-K., Hong, S.-Y., et al. (2016). Changes of Precipitation Extremes over South Korea Projected by the 5 RCMs under RCP Scenarios. Asia-Pacific J. Atmos. Sci. 52, 223–236. doi:10.1007/s13143-016-0021-0
Alexander, L., Allen, S., Bindoff, N. L., and Breon, F.-M. (2013). in The Physical Science Basis. Contribution of Working Group I to the Fifth Assessment Report of the Intergovernmental Panel on Climate Change. Editors T. F. Stocker, D. Qin, G.-K. Plattner, M. Tignor, S. K. Allen, J. Boschunget al. (Cambridge, United Kingdom and New York, NY, USA: Cambridge University Press), 1535.
Allen, S., Barros, V., Burton, I., Lenderum, D. C., Field, C. B., Barros, V., et al. (2012). in Managing the Risks of Extreme Events and Disasters to Advance Climate Change Adaptation (Cambridge, United Kingdom and New York, NY, USA: Cambridge University Press), 582.
Arias, P. A., Bellouin, N., Coppola, E., Masson-Delmotte, V., Zhai, P., Pirani, A., et al. (2021). “Summary for Policymakers,” in Climate Change 2021: The Physical Science Basis. Contribution of Working Group I to the Sixth Assessment Report of the Intergovernmental Panel on Climate Change (Cambridge, United Kingdom and New York, NY: Cambridge University Press), 3–32.
Burkholder, B. (2007). An Assessment of United States Climate Variations Using the Climate Extremes Index. M.S. thesis. Norman: University of Oklahoma, 103.
Ceccherini, G., Russo, S., Ameztoy, I., Marchese, A. F., and Carmona-Moreno, C. (2017). Heat Waves in Africa 1981-2015, Observations and Reanalysis. Nat. Hazards Earth Syst. Sci. 17, 115–125. doi:10.5194/nhess-17-115-2017
Chen, M., Shi, W., Xie, P., Silva, V. B. S., Kousky, V. E., Wayne Higgins, R., et al. (2008). Assessing Objective Techniques for Gauge-Based Analyses of Global Daily Precipitation. J. Geophys. Res. 113, D04110. doi:10.1029/2007JD009132
Chen, R., and Lu, R. (2015). Comparisons of the Circulation Anomalies Associated with Extreme Heat in Different Regions of Eastern China. J. Clim. 28 (14), 5830–5844. doi:10.1175/jcli-d-14-00818.1
Choi, Y.-S., Ho, C.-H., Gong, D.-Y., Jeong, J.-H., and Park, T.-W. (2009). Adaptive Change in Intra-winter Distribution of Relatively Cold Events to East Asian Warming. Terr. Atmos. Ocean. Sci. 20, 807816. doi:10.3319/tao.2008.11.20.01(a)
Dai, G., Li, C., Han, Z., Luo, D., and Yao, Y. (2021). The Nature and Predictability of the East Asian Extreme Cold Events of 2020/21. Adv. Atmos. Sci. 39, 566–575. doi:10.1007/s00376-021-1057-3
Ding, T., Qian, W., and Yan, Z. (2010). Changes in Hot Days and Heat Waves in China during 1961-2007. Int. J. Climatol. 30, 1452–1462. doi:10.1002/joc.1989
Dittus, A. J., Karoly, D. J., Lewis, S. C., and Alexander, L. V. (2015). A Multiregion Assessment of Observed Changes in the Areal Extent of Temperature and Precipitation Extremes. J. Clim. 28, 9206–9220. doi:10.1175/jcli-d-14-00753.1
Donat, M. G., Alexander, L. V., Yang, H., Durre, I., Vose, R., and Caesar, J. (2013a). Global Land-Based Datasets for Monitoring Climatic Extremes. Bull. Amer. Meteor. Soc. 94, 997–1006. doi:10.1175/BAMS-D-12-00109.1
Donat, M. G., Alexander, L. V., Yang, H., Durre, I., Vose, R., Dunn, R. J. H., et al. (2013b). Updated Analyses of Temperature and Precipitation Extreme Indices since the Beginning of the Twentieth Century: The HadEX2 Dataset. J. Geophys. Res. Atmos. 118, 2098–2118. doi:10.1002/jgrd.50150
Frich, P., Alexander, L., Della-Marta, P., Gleason, B., Haylock, M., Klein Tank, A., et al. (2002). Observed Coherent Changes in Climatic Extremes during the Second Half of the Twentieth Century. Clim. Res. 19, 193–212. doi:10.3354/cr019193
Gallant, A. J. E., and Karoly, D. J. (2010). A Combined Climate Extremes Index for the Australian Region. J. Clim. 23, 6153–6165. doi:10.1175/2010JCLI3791.1
Gallant, A. J. E., Karoly, D. J., and Gleason, K. L. (2014). Consistent Trends in a Modified Climate Extremes Index in the United States, Europe, and Australia. J. Clim. 27, 1379–1394. doi:10.1175/JCLI-D-12-00783.1
Gleason, K. L., Lawrimore, J. H., Levinson, D. H., Karl, T. R., and Karoly, D. J. (2008). A Revised U.S Climate Extremes Index. J. Clim. 21, 2124–2137. doi:10.1175/2007JCLI1883.1
Gong, D. Y., and Han, H. (2004). Extreme Climate Events in Northern China over the Last 50 Years. Acta Geogr. Sin. 59 (2), 230–238. (in Chinese). doi:10.11821/xb200402009
Hamed, K. H., and Ramachandra Rao, A. (1998). A Modified Mann-Kendall Trend Test for Autocorrelated Data. J. Hydrology. 204, 182–196. doi:10.1016/s0022-1694(97)00125-x
Hanel, M., and Buishand, T. A. (2011). Analysis of Precipitation Extremes in an Ensemble of Transient Regional Climate Model Simulations for the Rhine Basin. Clim. Dyn. 36, 1135–1153. doi:10.1007/s00382-010-0822-2
Heinrich, G., and Gobiet, A. (2011). The Future of Dry and Wet Spells in Europe: A Comprehensive Study Based on the ENSEMBLES Regional Climate Models. Int. J. Climatol. 32, 1951–1970. doi:10.1002/joc.2421
Herrera-Estrada, J. E., and Sheffield, J. (2017). Uncertainties in Future Projections of Summer Droughts and Heat Waves over the Contiguous United States. J. Clim. 30, 6225–6246. doi:10.1175/JCLI-D-16-0491.1
Hong, S.-Y., and Kanamitsu, M. (2014). Dynamical Downscaling: Fundamental Issues from an NWP Point of View and Recommendations. Asia-Pacific J. Atmos. Sci. 50 (1), 83–104. doi:10.1007/s13143-014-0029-2
Karl, T. R., Knight, R. W., Easterling, D. R., and Quayle, R. G. (1996). Indices of Climate Change for the United States. Bull. Amer. Meteor. Soc. 77, 279–292. doi:10.1175/1520-0477(1996)077<0279:ioccft>2.0.co;2
Kim, G., Cha, D.-H., Park, C., Jin, C.-S., Lee, D.-K., Suh, M.-S., et al. (2021). Evaluation and Projection of Regional Climate over East Asia in CORDEX-East Asia Phase I Experiment. Asia-Pacific J. Atmos. Sci. 57, 119–134. doi:10.1007/s13143-020-00180-8
Lau, W. K.-M., and Kim, K.-M. (2017). Competing Influences of Greenhouse Warming and Aerosols on Asian Summer Monsoon Circulation and Rainfall. Asia-Pacific J. Atmos. Sci. 53 (2), 181–194. doi:10.1007/s13143-017-0033-4
Miao, J., and Wang, T. (2020). Decadal Variations of the East Asian Winter Monsoon in Recent Decades. Atmos. Sci. Lett. 21, e960. doi:10.1002/asl.960
Min, S.-K., Kim, Y. H., Kim, M. K., and Park, C. (2014). Assessing Human Contribution to the Summer 2013 Korean Heat Wave, in: Explaining Extreme Events of 2013 from a Climate Perspective. Bull. Amer. Meteor. Soc. 95, S48–S51.
Min, S.-K., Son, S.-W., Seo, K.-H., Kug, J.-S., An, S.-I., Choi, Y.-S., et al. (2015). Changes in Weather and Climate Extremes over Korea and Possible Causes: A Review. Asia-Pacific J. Atmos. Sci. 51 (2), 103–121. doi:10.1007/s13143-015-0066-5
Min, S., Choi, Y., Moon, J.-Y., Kim, Y., Kim, M.-K., Choi, D., et al. (2021). Examination on the Spatial Coverage Change and Future Projection of Climate Extreme Events during Summer and Winter in South Korea Using a Combined Climate Extreme Index. J. Clim. Res. 16 (1), 53–69. (in Korean with English abstract). doi:10.14383/cri.2021.16.1.53
Mishra, V., Ganguly, A. R., Nijssen, B., and Lettenmaier, D. P. (2015). Changes in Observed Climate Extremes in Global Urban Areas. Environ. Res. Lett. 10, 24005. doi:10.1088/1748-9326/10/2/024005
Moon, J.-Y., Choi, Y., and Kim, Y. (2020). A Study on the Application of an Integrated Climate Extreme Index that Measures the Fraction of the Area Experiencing the Extremes in South Korea Using the Surface Observation Station Data on an Annual Basis. J. Clim. Res. 15 (1), 21–34. (in Korean with English abstract). doi:10.14383/cri.2020.15.1.21
Orlowsky, B., and Seneviratne, S. I. (2012). Global Changes in Extreme Events: Regional and Seasonal Dimension. Clim. Change 110, 669–696. doi:10.1007/s10584-011-0122-9
Polson, D., Bollasina, M., Hegerl, G. C., and Wilcox, L. J. (2014). Decreased Monsoon Precipitation in the Northern Hemisphere Due to Anthropogenic Aerosols. Geophys. Res. Lett. 41, 6023–6029. doi:10.1002/2014gl060811
Russo, S., Marchese, A. F., Sillmann, J., and Imme, G. (2016). When Will Unusual Heatwaves Become Normal in a Warming Africa? Environ. Res. Lett. 11, 54016. doi:10.1088/1748-9326/11/5/054016
Seneviratne, S. I., Nicholls, N., Easterling, D., Goodess, C. M., Kanae, S., Kossin, J., et al. (2012). “Changes in Climate Extremes and Their Impacts on the Natural Physical Environment,” in Managing the Risks of Extreme Events and Disasters to Advance Climate Change Adaptation. A Special Report of Working Groups I and II of the Intergovernmental Panel on Climate Change (IPCC) [Field. Editors V. Barros, T. F. Stocker, D. Qin, D. J. Dokken, and K. L. Ebi (Cambridge, UK, and New York, NY, USA: Cambridge University Press), 109–230.
Sillmann, J., Kharin, V. V., Zwiers, F. W., Zhang, X., and Bronaugh, D. (2013). Climate Extremes Indices in the CMIP5 Multimodel Ensemble: Part 2. Future Climate Projections. J. Geophys. Res. Atmos. 118, 2473–2493. doi:10.1002/jgrd.50188
Stocker, T. F., Qin, D., Plattner, G.-K., Tignor, M. M., Allen, S. K., Boschung, J., et al. (2014). Climate Change 2013: The Physical Science Basis. Contribution of Working Group I to the Fifth Assessment Report of IPCC the Intergovernmental Panel on Climate Change. Cambridge, UK, and New York, NY, USA: Cambridge University Press.
Sun, Q., Zhang, X., Zwiers, F., Westra, S., and Alexander, L. V. (2021). A Global, Continental, and Regional Analysis of Changes in Extreme Precipitation. J. Clim. 34, 243–258. doi:10.1175/jcli-d-19-0892.1
Wang, W., Zhou, W., Li, Y., Wang, X., and Wang, D. (2015). Statistical Modeling and CMIP5 Simulations of Hot Spell Changes in China. Clim. Dyn. 44, 2859–2872. doi:10.1007/s00382-014-2287-1
Wang, Y., Zhou, B., Qin, D., Wu, J., Gao, R., and Song, L. (2017). Changes in Mean and Extreme Temperature and Precipitation over the Arid Region of Northwestern China: Observation and Projection. Adv. Atmos. Sci. 34, 289–305. doi:10.1007/s00376-016-6160-5
Xie, P., Chen, M., Yang, S., Yatagai, A., Hayasaka, T., Fukushima, Y., et al. (2007). A Gauge-Based Analysis of Daily Precipitation over East Asia. J. Hydrometeor. 8, 607–626. doi:10.1175/jhm583.1
Xu, W., Li, Q., Wang, X. L., Yang, S., Cao, L., and Feng, Y. (2013). Homogenization of Chinese Daily Surface Air Temperatures and Analysis of Trends in the Extreme Temperature Indices. J. Geophys. Res. Atmos. 118, 9708–9720. doi:10.1002/jgrd.50791
Yang, H., and Fan, K. (2022). Reversal of Monthly East Asian Winter Air Temperature in 2020/21 and its Predictability. Atmos. Ocean. Sci. Lett. 15, 100142–100147. doi:10.1016/j.aosl.2021.100142
Ye, J.-S., Gong, Y.-H., Zhang, F., Ren, J., Bai, X.-K., and Zheng, Y. (2018). Which Temperature and Precipitation Extremes Best Explain the Variation of Warm versus Cold Years and Wet versus Dry Years? J. Clim. 31, 45–59. doi:10.1175/JCLI-D-17-0377.1
Keywords: East Asia, climate extreme index, spatial extent, trend, subseasonal to annual
Citation: Moon J-Y, Choi Y, Kim Y and Min S (2022) Subseasonal to Annual Long-Term Trends in Climate Extremes Over East Asia, 1981–2021. Front. Earth Sci. 10:880462. doi: 10.3389/feart.2022.880462
Received: 21 February 2022; Accepted: 16 May 2022;
Published: 08 June 2022.
Edited by:
Wei Zhang, Utah State University, United StatesReviewed by:
Chunzai Wang, South China Sea Institute of Oceanology (CAS), ChinaDaoyi Gong, Beijing Normal University, China
Fei Liu, Sun Yat-sen University, China
Copyright © 2022 Moon, Choi, Kim and Min. This is an open-access article distributed under the terms of the Creative Commons Attribution License (CC BY). The use, distribution or reproduction in other forums is permitted, provided the original author(s) and the copyright owner(s) are credited and that the original publication in this journal is cited, in accordance with accepted academic practice. No use, distribution or reproduction is permitted which does not comply with these terms.
*Correspondence: Youngeun Choi, eWVjaG9pQGtvbmt1ay5hYy5rcg==
†Present address: Research Institute, 4D Solution, Co., Ltd., Seoul, South Korea