 Zhen Li
 Qiaomu Qi
 Chuang Hei3
95% of researchers rate our articles as excellent or good
Learn more about the work of our research integrity team to safeguard the quality of each article we publish.
Find out more
ORIGINAL RESEARCH article
Front. Earth Sci. , 29 March 2022
Sec. Solid Earth Geophysics
Volume 10 - 2022 | https://doi.org/10.3389/feart.2022.879345
This article is part of the Research Topic High-pressure Physical Behavior of Minerals and Rocks: Mineralogy, Petrology and Geochemistry View all 16 articles
Single-well acoustic imaging in logging-while-drilling (LWD) has important application potential in evaluating cluster-well drilling safety as it can be applied to the real-time detection of an existing cased borehole from a new well during drilling. Forward modelling can help us understand the mechanism of elastic-wave radiation, scattering and reception. In this work, we investigate the characteristics of acoustic wavefields associated with LWD in an unconsolidated formation. We use the time-domain finite difference (FDTD) method to simulate the wavefields corresponding to a ring dipole source. The modeling results reveal the existence of a new Mach wave apart from the conventional P- and S-waves. The Mach waves are secondary waves resulting from the constructive interference of the collar waves. Such wave is often overlooked in the previous studies of single-well acoustic imaging in LWD. We found that not only P- and S-waves but also the Mach waves could be scattered by the nearby cased borehole and propagate back to the original borehole. The simulations indicate that both the scattered P-waves and the scattered Mach S-waves exhibit strong amplitudes. This study provides a theoretical foundation for the borehole detection by LWD single-well acoustic imaging technique in unconsolidated formations.
Single-well acoustic imaging has achieved rapid development in the last decades. Based on the elastic waves reflected or scattered back to the borehole, the technique could provide geological structures information located at tens of meters away from the borehole and plays an important role in oil and gas exploration process (Hornby, 1989; Tang, 2004; Haldorsen et al., 2006; Tang and Patterson, 2009; Hirabayashi et al., 2017; Hirabayashi, 2020). To verify the effectiveness of single-well acoustic imaging and provide a method for testing downhole acoustic imaging tools, Tang et al. (2016) conducted physical experiments with two test boreholes drilled with a distance of 10 m. The target hole can be well imaged from the measurement hole despite the size of the borehole is much smaller than the wavelength. Their pioneering work proved that the single-well acoustic imaging could be used for the detection of nearby boreholes, which is of great significance for drilling safety evaluation in densely drilled fields.
In recent years, cluster-well drilling has been widely adopted especially in offshore exploration and development because the procedure can significantly reduce the drilling costs. The formations in shallow-water marine environments is usually very soft and unconsolidated. The borehole source radiation and propagation in such formations are quite different from in the consolidated fast formations. Gu et al. (2021) studied the elastic-wave radiation from a dipole source in an open borehole and its scattering occurs at a nearby cased borehole for an unconsolidated formation. The results show that compared to SH-waves, P-waves are more advantageous for the borehole detection in unconsolidated formations. Compared to the conventional wireline logging, logging-while-drilling (LWD) can provide real-time formation parameters, it is useful to apply single-well acoustic imaging among other LWD acquisitions. A number of theoretical and practical studies on single-well acoustic imaging in LWD have been done in the past few years. Tang et al. (2007) achieved the first imaging of the formation interface using the LWD monopole waveform data. Cao et al. (2016), Wei et al. (2019) studied the radiation and reflection of the P- and S-waves with an LWD dipole source. Yang et al. (2019) simulated the acoustic fields excited by linear phased array acoustic transmitters to realize azimuth identification. Pan et al. (2020) investigated the wave reflection and scattering in a borehole with finite depth based on numerical simulation. Up to now, the radiation and scattering of a dipole source in unconsolidated slow formations has not yet been investigated. Meanwhile, the previous studies only focus on the P- and S-waves radiated directly from the source. Meredith et al. (1993) pointed out that the Mach waves will generate when the tube-wave velocity is greater than the formation S-wave velocity. In the context of LWD acquisition, as a result of the good coupling between the drill collar and transmitters, strong collar waves will form. The collar-wave velocity is usually greater than the formation S-wave velocity, sometimes even greater than the formation P-wave velocity. Hence, Mach waves will exist in most acoustic measurements in LWD and its radiation from the borehole and scattering outside the borehole have not been fully understood.
Understanding the elastic-wave radiation, scattering and reception characteristics in an LWD environment for an unconsolidated formation can help us evaluate the performance of different types of waves for single-well acoustic imaging. In this paper, we first simulate the acoustic fields in an unconsolidated formation excited by a ring dipole LWD source and analyze the characteristics of the radiation of the P-, S- and Mach waves. Then, we model the scattering of the radiated waves occurred at a nearby cased borehole. Lastly, we analyze the received signal of the scattering waves from the cased borehole. We compare the arrival times and amplitudes between different types of scattered waves received in the measurement borehole. The synthetic study provides a theoretical foundation for the borehole detection by LWD single-well acoustic imaging technique, which is meaningful for the evaluation of cluster-well drilling safety in shallow-water marine environments.
The schematic of the LWD model with a dipole source is illustrated in Figure 1. The drill collar is centered and occupies most of the space of the borehole. The borehole is surrounded by an unconsolidated formation with low P- and S-wave velocities. A ring dipole source is placed on the surface of the drill collar as shown in Figures 1A,B. The dipole source is composed of two half circular sources which can generate radial forces with same amplitudes but opposite phases. The polarization direction of the dipole source is in x-direction (see Figure 1B). The receiver array including four sub-arrays is also on the surface of the collar as shown in Figures 1A,C. The interval between two adjacent receivers is 0.15 m. The minimum offset, i.e., the distance between the source and first receiver, is 3.0 m. The outer radius of the inner fluid, drill collar and outer fluid is rin = 0.035m, rout = 0.14 m and rb = 0.205m, respectively. The outer radius of the formation is infinite. The parameters of the borehole fluid, drill collar and formation used in the elastic modeling are shown in Table 1.
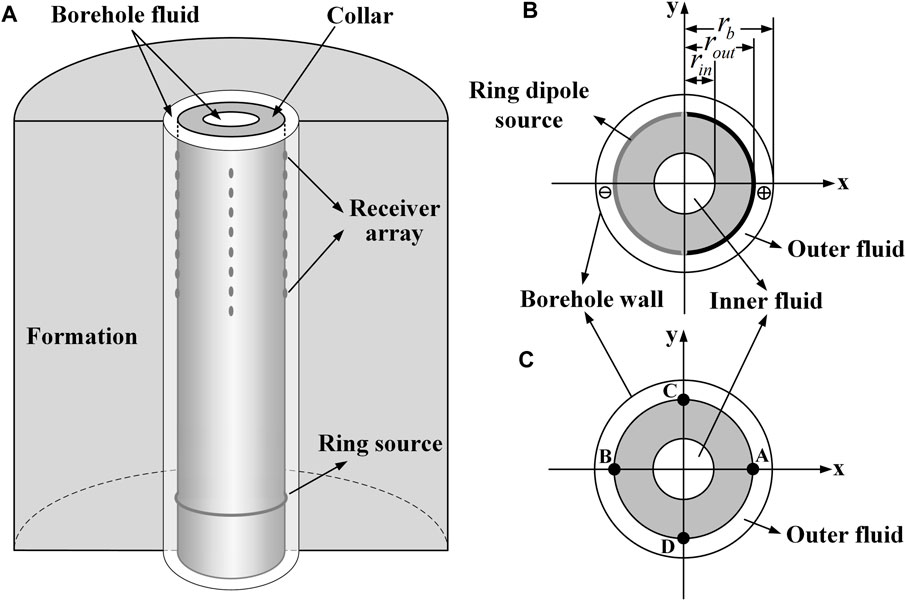
FIGURE 1. (A) Schematic diagram of the LWD model with a ring dipole source; (B) Configuration of the ring dipole source in LWD; (C) Configuration of the receiver array in LWD.
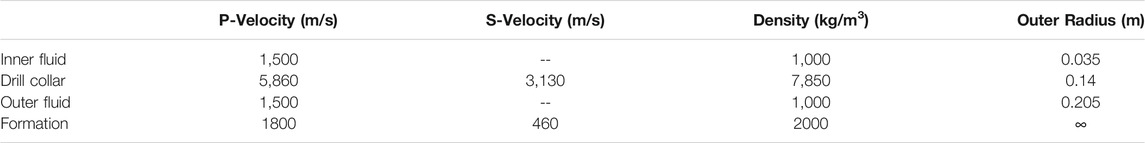
TABLE 1. Model parameters of the LWD.
Numerical simulation is widely used in the theoretical study of the acoustic logging (Li et al., 2020). In this study, the three-dimensional finite-difference method in time-domain (FDTD) is used in the simulation of the elastic wave propagation (Cheng et al., 1995). The perfectly matched layer (PML) is usually used for removing the artificial wave reflection caused by the truncation of the computational zone in the numerical simulation of both electromagnetics and elastodynamics (Liu and Sinha, 2003; Zhang et al., 2019). We use the complex frequency-shifted perfectly matched layer (CFS-PML) method (Zhang and Shen, 2010) to remove the artificial reflection which is caused by the truncation of the computational domain. The source function is the standard Ricker source with 3 kHz center frequency which is the typical frequency used in real dipole acoustic logging. In the modeling, the grid size in FDTD is 5 mm and the thickness of the CFS-PML is 30 grid cells. To validate the accuracy of the modeling results, we compare the synthetic waveforms modeled by FDTD and real-axis integration (RAI) methods (Tang and Cheng, 2004). The waveforms recorded here are fluid displacements which are taken as the difference between the positions of A and B in the subarrays (see Figure 1C) (Tang and Cheng, 2004). As shown in Figure 2, the modeling result of FDTD (black solid lines) agrees well with the modeling result of RAI (red dot lines). Strong collar waves and leaky-P waves can be observed. The leaky-P wave is a wave mode which is dispersive and attenuative. It travels along the borehole and radiates energy into the formation. Differently, the P- and S-wave radiated from the source directly are both body waves traveling in the formation. The Mach wave is secondary wave caused by constructive interference of the radiated collar wave.
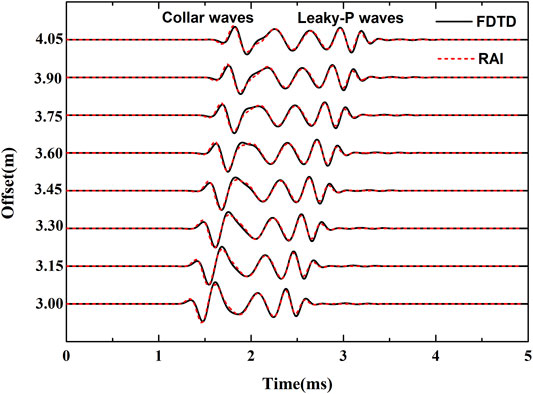
FIGURE 2. Comparison between the modeling results of the numerical FDTD (black solid line) and semi-analytical RAI (red dot line) methods.
To investigate the radiation characteristics of the ring dipole source, we first simulated the elastic wave propagation in a homogeneous unconsolidated formation in the context of LWD acquisition. The computational domain is from −0.5 to 5.1 m in all x-, y- and z-directions. The center of the ring dipole source is at the origin of the coordinate. The geometry and parameters for elastic modeling are given in Table 1. As the velocity-stress staggered gird is used in the FDTD simulation, the vibration velocity can be used to represent the radiation characteristics. The total vibration velocity can be calculated based on the velocity component, i.e., vx, vy and vz in a Cartesian coordinate system.
Figure 3 shows the snapshot of total vibration velocity in the xoy-plane at 3.1483 ms. The wave propagation pattern in the horizontal plane in LWD context is similar to the results associated with an open borehole. The snapshot reveals the propagation P- and SH-waves which have different dominant radiation directions (Tang et al., 2014). The amplitude of the P-wave in x-direction is larger than that of the S-wave. The snapshots of the total vibration velocity in the vertical planes are shown in Figure 4. Apart from the P- and S-waves radiated from the source directly, there also exists secondary P- and S-waves, which are closely related to the collar waves. These secondary waves are commonly known as Mach waves. As the transmitter is well coupled to the drill collar, strong collar waves are produced. The collar waves will radiate into the formation and form secondary waves. Figure 5A shows the phase velocity dispersion curves of collar waves (blue line), leaky-P waves (red) and formation flexural-waves (black) (Zheng and Hu, 2017). The propagation velocity of the collar waves is faster than the P- and S-waves in most frequency range. The collar waves will interfere constructively and this leads to the formation of the secondary Mach waves as shown in Figure 5B (Meredith et al., 1993). To distinguish the two secondary waves propagating at different velocities, here we name them as Mach P-wave and Mach S-wave, respectively. The sine of the propagation angle of Mach wave, which is the angle between the borehole axis and the wavefront of the Mach waves, is equal to the ratio of P-/S-wave velocity to collar-wave velocity. As the collar-wave is dispersive (see blue line in Figure 5A), the Mach wave also behaves as dispersive wave. The width of the wave package will increase as the collar wave propagates in z-direction. Interestingly, as the collar waves excited by a dipole source are directional, the corresponding Mach waves radiated into the formation by collar waves are also directional. Figures 4A,C show the snapshots in xoz-plane, while Figures 4B,D show the snapshot in yoz-plane. Apparently, the amplitudes of Mach waves are different in different directions.

FIGURE 3. The snapshot of the total vibration velocity field in xoy-plane at 3.1483 ms
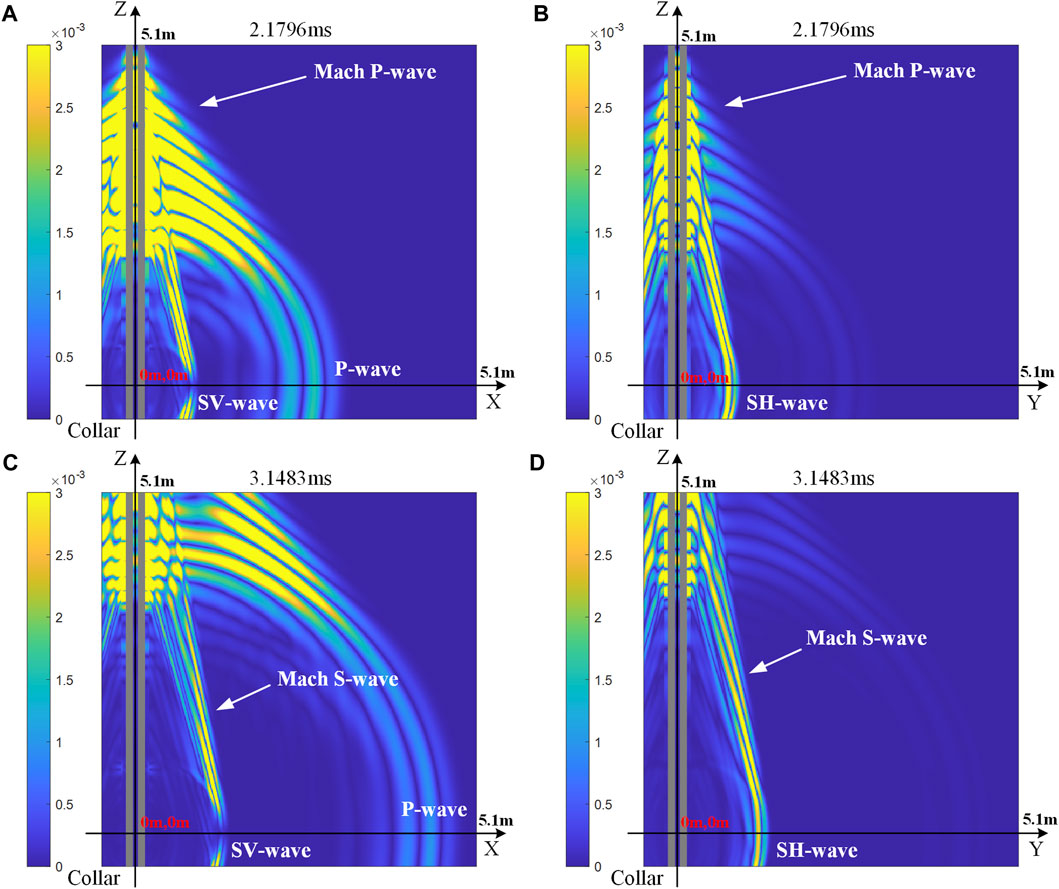
FIGURE 4. The snapshots of the total vibration velocity fields in (A) xoz-plane at 2.1796 ms, (B) yoz-plane at 2.1796 ms, (C) xoz-plane at 3.1483 ms and (D) yoz-plane at 3.1483 ms.
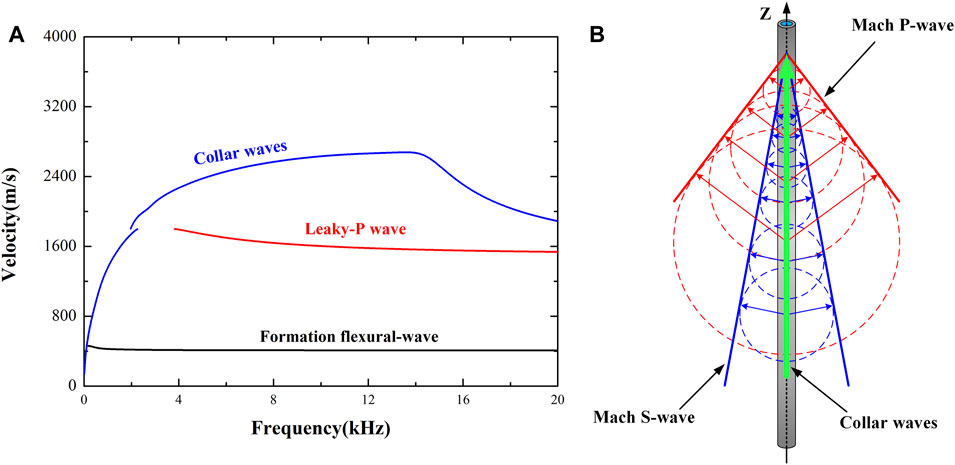
FIGURE 5. (A) The phase velocity dispersion curves of the inner borehole wave modes; (B) Schematic diagram of the generation of the Mach P-wave and Mach S-wave.
To further investigate the radiation characteristics, we recorded the transient waveforms on three circles representing three orthogonal directions as shown in Figure 6. The centers of these circles are at the origin. The radiuses R of these circles are all 5.0 m. The red, blue and green circles are in xoy-, xoz-, and yoz-plane respectively. The small black spheres represent the receivers on the circles. The vibration velocities
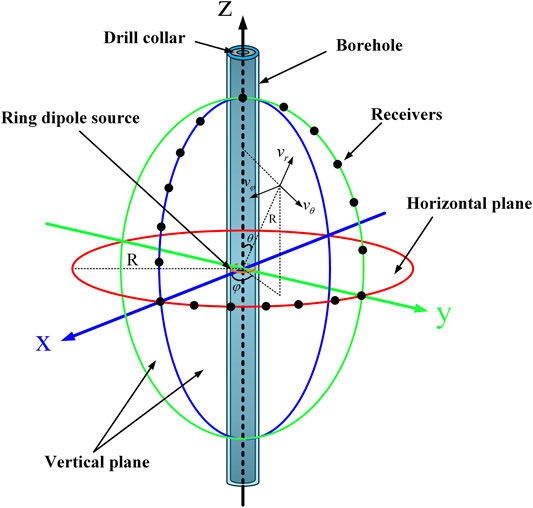
FIGURE 6. The Schematic diagram of the dipole source radiation patterns in LWD environment.
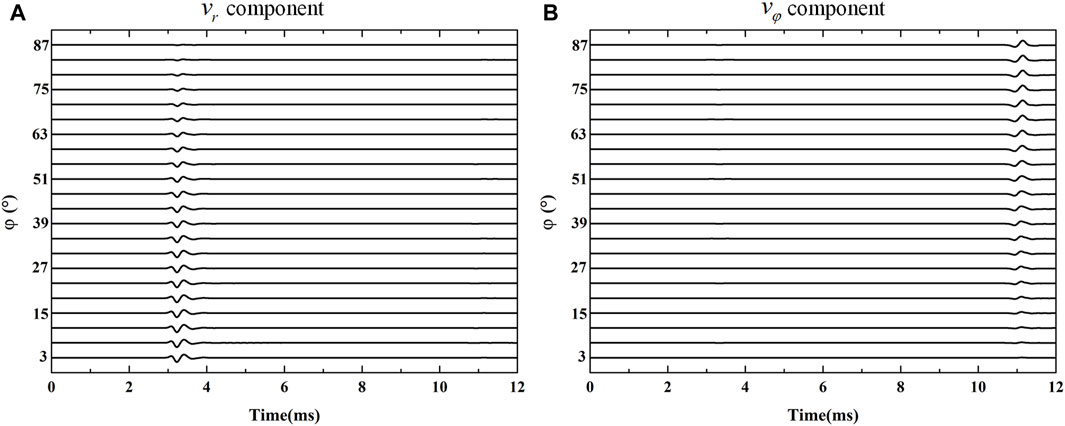
FIGURE 7. The waveforms of (A) P-wave and (B) SH-wave received on the red circle (see Figure 6).
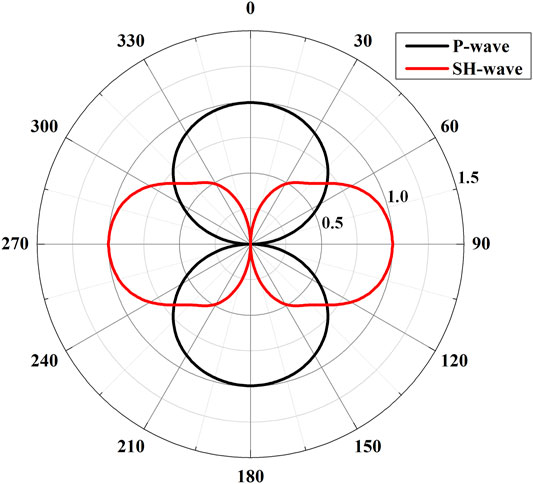
FIGURE 8. The P-wave (black) and SH-wave (red) radiation patterns in the horizontal plane of a ring dipole source in LWD.
For the waves radiated from the borehole in the vertical planes, the wavefields are more complicated. As we discussed earlier, apart from the P- and S-waves radiated from the source directly, the Mach waves, which are secondary waves, play an important part in the wavefields. As shown in Figure 9A, the propagation paths of the Mach waves are different from the P- and S-waves. For the receivers in the vertical planes, the travel-path of the Mach waves is composed of two parts. The collar wave first travels along the drill collar with a much higher speed and then it radiates into the formation with the velocity of P-/S-wave of the formation (see red dot lines in Figure 9A). However, for the P- and S-waves radiated directly from the source, the propagation distances from the source to the receivers on the blue and green circle are all the same (blue solid lines in Figure 9A). As shown in Figures 9B–D, the arrival times of the P- or S-waves at different θ on the vertical circles are equal. This is the same with the results in xoy-plane. On the other hand, as shown in Figures 9B–D the arrival times of Mach waves changes with the angle θ because their propagation paths are different for different receivers. Figures 9B,D show the
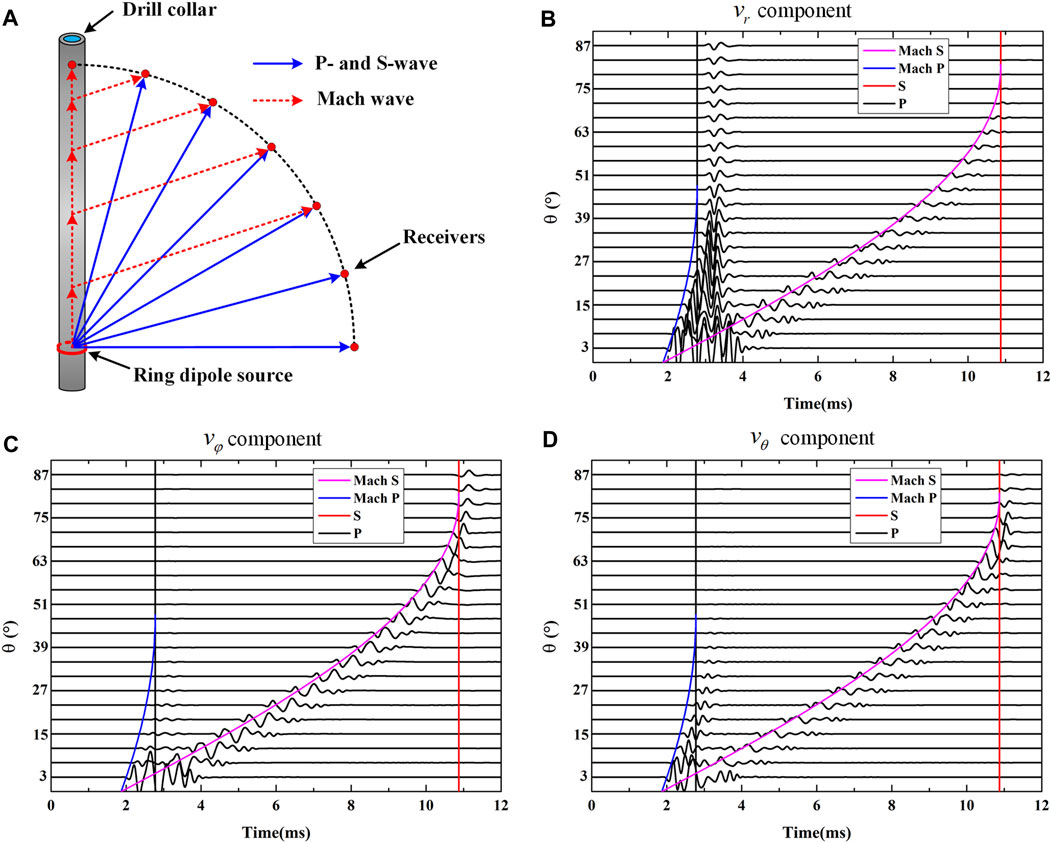
FIGURE 9. (A) The propagation paths of Mach waves (red dot lines) and P-, S-waves radiated from the source directly (blue solid lines). (B) The
To investigate the wave scattering by a nearby cased borehole, we build a dual-borehole model to simulate the nearby borehole detection during the LWD acquisition. Figure 10 shows the physical model for nearby borehole detection with a ring dipole source in an LWD measurement. The axes of the two boreholes are parallel to each other with a distance of D. The nearby cased borehole is assumed to be well cemented. The geometry and physical parameters of the nearby borehole are listed in Table 2. The parameters of the measurement borehole and drill collar are the same with the previous example (see Table 1). The black and red lines denote the propagation paths of P-(S-) waves and Mach waves respectively. The propagation paths of Mach waves are also composed of two parts, which is similar to the case shown in Figure 9A.
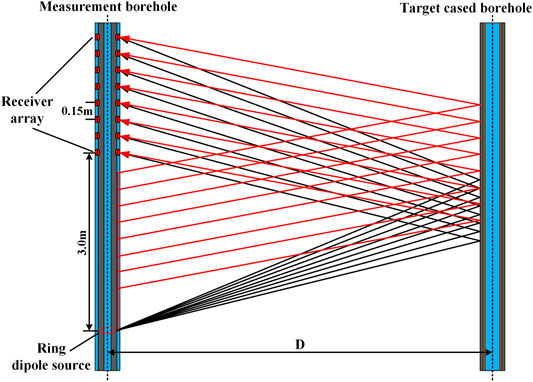
FIGURE 10. Schematic of the detection of a nearby cased borehole with a ring dipole source in LWD. The red and black lines represent the propagation paths of Mach waves and P-(S-) waves, respectively.
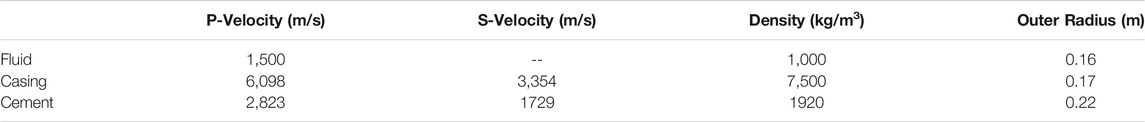
TABLE 2. Model parameters of the nearby cased borehole.
The fluid displacements received in the measurement borehole are plotted in Figure 11. To clearly show the scattered waves from the target cased borehole, we have removed the direct waves propagating along the drill collar and the measurement borehole (see Figure 2). The black, red and magenta lines represent the theoretical arrival times of P-, S- and Mach S-waves respectively. The arrival times of Mach P-waves are not shown because the Mach P-waves cannot be received in the receivers according to the ray theory. Figures 11A,C are the modeling results when the plane of the two boreholes is parallel to the x-direction. Figures 11B,D are the modeling results when the plane of the two boreholes is parallel to the y-direction. Note that the polarization of the dipole source is in x-direction, the characteristics of the received waveforms will depend on the position of the nearby target borehole.
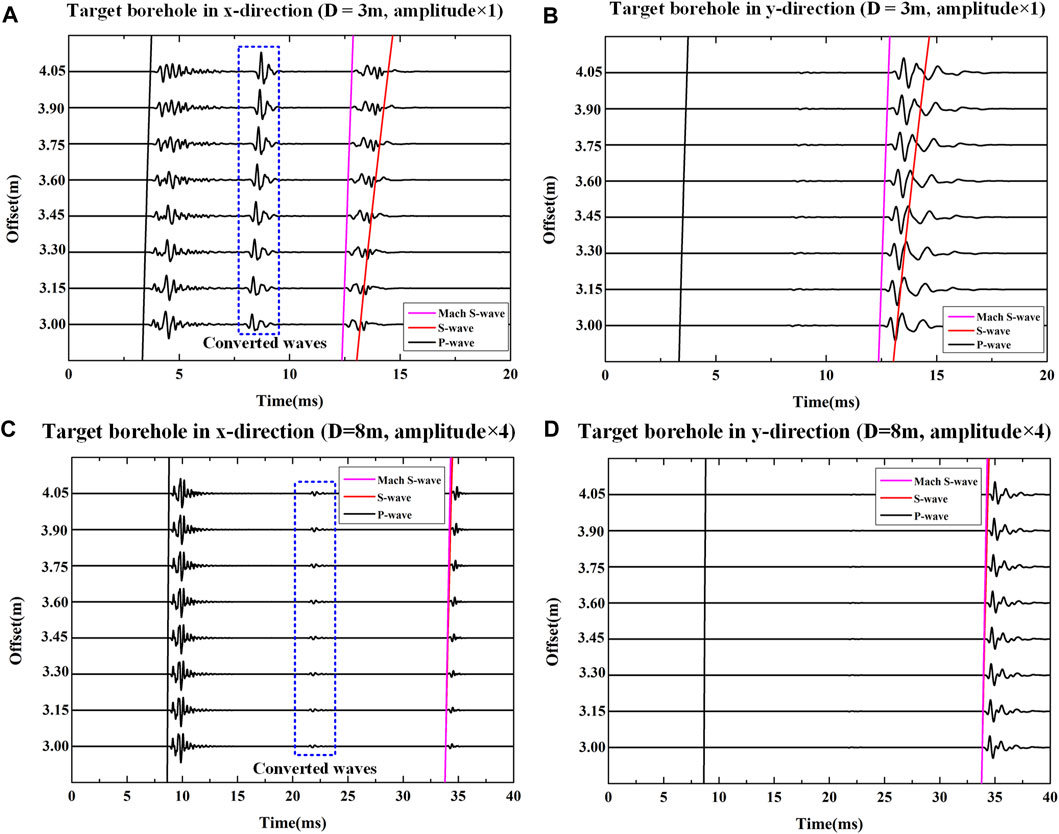
FIGURE 11. Pure scattered waves from the nearby cased borehole at different distances and directions. (A) and (B), (C) and (D) show the results when (D) is equal to 3 m and 8 m, respectively. The axis of target borehole is in the xoz-plane for (A) and (C). The axis of target borehole is in the yoz-plane for (B) and (D). The black, red and magenta lines represent the theoretical arrival times of the scattered P-wave, S-wave, Mach S-wave respectively.
When the target borehole is very close to the measurement borehole, for example D = 3 m as shown in Figures 11A,B, we can distinguish the Mach S-waves and the S-waves based on their arrivals. The scattered P- and Mach S-waves are much stronger than the scattered S-waves. Besides, remarkable converted waves occur when the target borehole is located on the x-direction (see blue dot outline box in Figure 11A). We plot the maximum absolute values of different types of scattered waves in Figure 13A. As shown in Figures 11A,B, the S-S wave marked in Figure 13A is dominated by the scattered Mach S-waves. Figure 13A shows that the amplitudes of the scattered P-waves and converted waves change evidently with the offset. The scattered Mach S-waves have more stable and larger amplitudes when the orientation of the target borehole is perpendicular to the source polarization direction. The amplitudes of scattered Mach S-waves become smaller when the source polarization direction is parallel to the plane of the measurement and target boreholes. Therefore, the scattered Mach S-wave should be used for imaging the nearby boreholes as its stable, strong amplitudes and good orientation sensitivity. With increasing distance between the measurement and target boreholes, as waveforms shown in Figures 11C,D and normalized amplitudes shown Figure 13B, the relative amplitudes of different types of waves change markedly. The scattered waves become less sensitive to the offset and meanwhile, the amplitude of the converted wave shows apparent decrease compared with the results when D = 3 m. The scattered P-wave possess the maximal amplitude. As the arrival times of the scattered S-wave and scattered Mach S-wave are similar (see Figures 11C,D) when D = 8 m, we could not distinguish their amplitudes based on arrivals. As the scattered S-wave and the scattered Mach S-wave are mixed together in the waveform, we just call them scattered S-wave without distinction here. To identify the amplitudes of scattered S-wave caused by S-wave and Mach S-wave respectively, we build a new borehole detection model shown in Figure 12A. Part of the drill collar between the source and receiver array is removed to destroy the constructive interference of the collar wave. As the Mach S-wave is not excited, the influence on the scattered S-wave caused by the Mach S-wave is eliminated. The modeling result is shown in Figure 12B when the source orientation is perpendicular to the target borehole orientation. Comparing with scattered S-wave under the influence of the Mach S-wave (see Figure 11D), the amplitudes of the scattered S-wave caused by pure S-wave is smaller. That means the existence of Mach S-wave will enhance the scattered S-wave in this case. The scattered S-waves when the source polarization is perpendicular to the orientation of the target borehole still exhibit strong amplitude which is about 80% of the scattered P-wave. Hence, the scattered P-wave is the best choice for single-well acoustic imaging in LWD with an unconsolidated formation when the distance between the measurement and target boreholes.
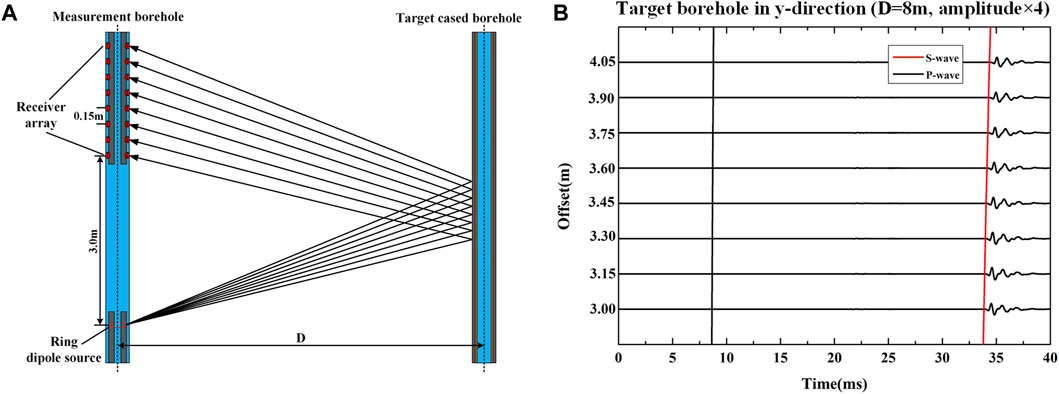
FIGURE 12. (A) Schematic of the borehole detection model without motivating the Mach wave. (B) Pure scattered waves from the nearby cased borehole at the distance of 8 m when the target borehole orientation is perpendicular to the source orientation. The influence on the scattered waves caused by the Mach wave is avoided by removing part of the drill collar as shown in (A).
In the application of borehole detection, the measurement and target boreholes can often be close to each other, especially when drilling toward the existing borehole in the case of drilling a relief well. As we shown in this work, the characteristics of the scattered waves change significantly when the distance between the measurement and target boreholes varies. This is due to the presence of the Mach S-waves. When the distance between two boreholes is large enough, we can simply use the scattered P-waves for imaging the trajectory of the nearby boreholes (see Figures 11C,D, Figure 13B). Because the arrival time of the scattered S-wave is late, it usually could not be recorded in LWD logging tools and thus, will not influence the imaging results. For the case with a close distance between the two boreholes, as shown in Figures 11A,B, Figure 13A, the scattered Mach S-waves exhibit stable and strong amplitudes when the orientation of the target borehole is perpendicular to the source polarization direction. Although the amplitudes of scattered P-waves and converted waves change markedly, they also have strong amplitudes at certain offsets. Application of the different types of scattered waves indiscriminately can lead to erroneous borehole trajectories in the imaging results. Hence, pure scattered Mach S-waves should be extracted before imaging for the case of boreholes with close distance. On the other hand, different types of scattered waves bring different information of the target borehole, so these waves can be jointly analyzed for LWD single well imaging for obtaining better imaging results.
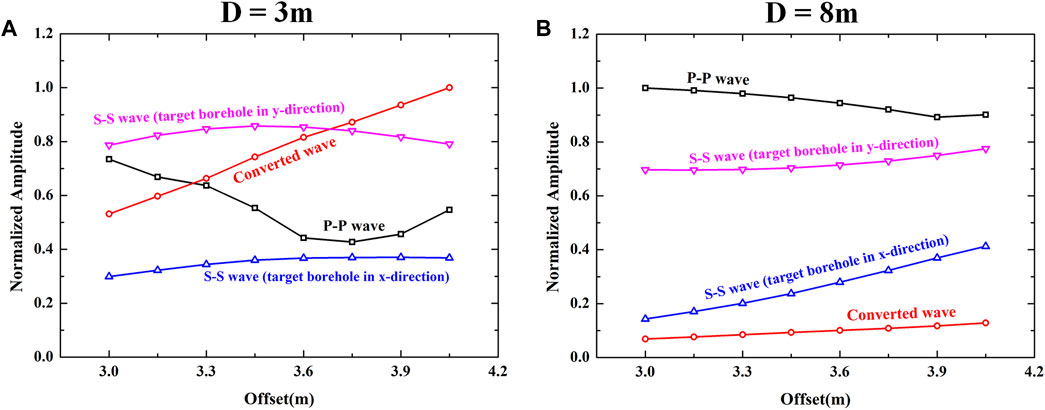
FIGURE 13. The normalized amplitudes of different types of scattered waves received in the borehole. (A) and (B) show the amplitudes for the model when the distance between the measurement and target boreholes is 3 m and 8 m, respectively.
When the drill collar and transmitters are well coupled, strong collar waves can be generated. Such wave will first propagate along the drill collar and meanwhile, part of the collar wave energy will radiate into the formation. Because the collar wave velocity is much faster than the velocity of the unconsolidated formation, the radiated collar waves will interfere constructively in the formation and form secondary waves which is known as Mach waves. Apart from the P- and S-waves radiated from the source directly, the Mach wave also plays an important role in the outer borehole wavefields. The existence of a nearby cased borehole will generate significant scattered waves in the measurement borehole during LWD acquisition. The presence of Mach S-wave results in different characteristics of the scattered waves with different distances between the measurement and target boreholes. When the target borehole is close to the measurement borehole, the amplitudes of scattered P-waves and converted waves show apparent variation with the source-receiver offset. The scattered Mach S-wave should be used for imaging as its stable, strong amplitudes and good orientation sensitivity. With increasing distance between the two boreholes, the scattered waves become less sensitive to the offset. The scattered P-wave possess the largest amplitude, which is most ideal for subsequent imaging purpose. This study provides a theoretical foundation for the borehole detection in LWD by single-well acoustic imaging in unconsolidated formations.
The original contributions presented in the study are included in the article/Supplementary Material, further inquiries can be directed to the corresponding author.
All authors listed have made a substantial, direct, and intellectual contribution to the work and approved it for submission.
This work is supported by the National Natural Science Foundation of China (Grant nos. 42104132, 41904113; 42074163). This work is also supported by Sichuan International Science and Technology Innovation Cooperation Program (Grant No: 2021YFH0050).
The authors declare that the research was conducted in the absence of any commercial or financial relationships that could be construed as a potential conflict of interest.
All claims expressed in this article are solely those of the authors and do not necessarily represent those of their affiliated organizations, or those of the publisher, the editors, and the reviewers. Any product that may be evaluated in this article, or claim that may be made by its manufacturer, is not guaranteed or endorsed by the publisher.
Cao, J. J., Tang, X. M., Su, Y. D., Wei, Z. T., and Zhuang, C. X. (2016). Radiation Characteristics of the Single-Well Imaging Field in While-Drilling Logging Using an Acoustic Dipole Source. Chin. J. Geophys. 59, 3503–3513. doi:10.6038/cjg20160932
Cheng, N., Cheng, C. H., and Toksöz, M. N. (1995). Borehole Wave Propagation in Three Dimensions. The J. Acoust. Soc. America 97, 3483–3493. doi:10.1121/1.412996
Gu, X.-H., Tang, X.-M., and Su, Y.-D. (2021). Delineating a Cased Borehole in Unconsolidated Formations Using Dipole Acoustic Data from a Nearby Well. Geophysics 86, D139–D147. doi:10.1190/GEO2020-0570.1
Haldorsen, J., Voskamp, A., Thorsen, R., Vissapragada, B., Williams, S., and Fejerskov, M. (2006). Borehole Acoustic Reflection Survey for High Resolution Imaging. New Orleans, LA: Society of Exploration Geophysicists, 314–318.
Hirabayashi, N. (2021). Beamform Processing for Sonic Imaging Using Monopole and Dipole Sources. Geophysics 86, D1–D14. doi:10.1190/geo2020-0235.1
Hirabayashi, N., Sakiyama, N., and Ikegami, T. (2017). Characteristics of Waveforms Recorded by Azimuthally Spaced Hydrophones of Sonic Logging Tool for Incident Plane Waves. Geophysics 82, D353–D368. doi:10.1190/geo2017-0201.1
Hornby, B. E. (1989). Imaging of Near‐borehole Structure Using Full‐waveform Sonic Data. Geophysics 54, 747–757. doi:10.1190/1.1442702
Li, T., Wang, Z., Wang, R., and Yu, N. (2020a). Pore Type Identification in Carbonate Rocks Using Convolutional Neural Network Based on Acoustic Logging Data. Neural Comput. Applic 33, 4151–4163. doi:10.1007/s00521-020-05246-2
Li, T., Wang, Z., Yu, N., Wang, R., and Wang, Y. (2020b). Numerical Study of Pore Structure Effects on Acoustic Logging Data in the Borehole Environment. Fractals 28, 2050049. doi:10.1142/S0218348X20500498
Liu, Q. H., and Sinha, B. K. (2003). A 3D Cylindrical PML/FDTD Method for Elastic Waves in Fluid‐filled Pressurized Boreholes in Triaxially Stressed Formations. Geophysics 68, 1731–1743. doi:10.1190/1.1620646
Meredith, J. A., Toksoz, M. N., and Cheng, C. H. (1993). Secondary Shear Waves from Source Boreholes1. Geophys. Prospect. 41, 287–312. doi:10.1111/j.1365-2478.1993.tb00571.x
Pan, Y., He, X., Chen, H., and Wang, X. (2020). Reflection Signals and Wellbore Scattering Waves in Acoustic Logging while Drilling. J. Geophys. Eng. 17, 552–561. doi:10.1093/jge/gxaa014
Tang, X.-M., Cao, J.-j., and Wei, Z.-t. (2014). Shear-wave Radiation, Reception, and Reciprocity of a Borehole Dipole Source: With Application to Modeling of Shear-Wave Reflection Survey. Geophysics 79, T43–T50. doi:10.1190/geo2013-0096.1
Tang, X.-M., and Patterson, D. J. (2009). Single-well S-Wave Imaging Using Multicomponent Dipole Acoustic-Log Data. Geophysics 74, WCA211–WCA223. doi:10.1190/1.3227150
Tang, X., Cao, J., Li, Z., and Su, Y. (2016). Detecting a Fluid-Filled Borehole Using Elastic Waves from a Remote Borehole. J. Acoust. Soc. America 140, EL211–EL217. doi:10.1121/1.4960143
Tang, X. M., and Cheng, C. H. (2004). Quantitative Borehole Acoustic Methods. Amsterdam: Elsevier Science Publishing.
Tang, X. M. (2004). Imaging Near‐borehole Structure Using Directional Acoustic‐wave Measurement. Geophysics 69, 1378–1386. doi:10.1190/1.1836812
Tang, X. M., Zheng, Y., and Patterson, D. (2007). Processing Array Acoustic-Logging Data to Image Near-Borehole Geologic Structures. Geophysics 72, E87–E97. doi:10.1190/1.2435083
Wei, Z., Tang, X., and Cao, J. (2019). Acoustic Radiation and Reflection of a Logging-While-Drilling Dipole Source. Geophys. J. Int. 219, 108–128. doi:10.1093/gji/ggz193
Yang, S., Qiao, W., and Che, X. (2019). Numerical Simulation of Acoustic fields in Formation Generated by Linear Phased Array Acoustic Transmitters during Logging while Drilling. J. Pet. Sci. Eng. 182, 106184. doi:10.1016/j.petrol.2019.106184
Zhang, R., Sun, Q., Zhuang, M., Huang, W.-F., Zhan, Q., Wang, D., et al. (2019). Optimization of the Periodic PML for SEM. IEEE Trans. Electromagn. Compat. 61, 1578–1585. doi:10.1109/TEMC.2018.2866441
Zhang, W., and Shen, Y. (2010). Unsplit Complex Frequency-Shifted PML Implementation Using Auxiliary Differential Equations for Seismic Wave Modeling. Geophysics 75, T141–T154. doi:10.1190/1.3463431
Keywords: single-well acoustic imaging, LWD, mach waves, nearby borehole detection, unconsolidated formation
Citation: Li Z, Qi Q, Hei C, Jiang C and Wang X-J (2022) Elastic-Wave Radiation, Scattering, and Reception of a Dipole Acoustic Logging-While-Drilling Source in Unconsolidated Formations. Front. Earth Sci. 10:879345. doi: 10.3389/feart.2022.879345
Received: 19 February 2022; Accepted: 10 March 2022;
Published: 29 March 2022.
Edited by:
Lidong Dai, Institute of geochemistry (CAS), ChinaReviewed by:
Zhenguan Wu, Southwest Petroleum University, ChinaCopyright © 2022 Li, Qi, Hei, Jiang and Wang. This is an open-access article distributed under the terms of the Creative Commons Attribution License (CC BY). The use, distribution or reproduction in other forums is permitted, provided the original author(s) and the copyright owner(s) are credited and that the original publication in this journal is cited, in accordance with accepted academic practice. No use, distribution or reproduction is permitted which does not comply with these terms.
*Correspondence: Qiaomu Qi, cWlhb211X3FpQDE2My5jb20=
Disclaimer: All claims expressed in this article are solely those of the authors and do not necessarily represent those of their affiliated organizations, or those of the publisher, the editors and the reviewers. Any product that may be evaluated in this article or claim that may be made by its manufacturer is not guaranteed or endorsed by the publisher.
Research integrity at Frontiers
Learn more about the work of our research integrity team to safeguard the quality of each article we publish.