 Dong Kangxing
 Zhao Xinrui
95% of researchers rate our articles as excellent or good
Learn more about the work of our research integrity team to safeguard the quality of each article we publish.
Find out more
ORIGINAL RESEARCH article
Front. Earth Sci. , 24 March 2022
Sec. Environmental Informatics and Remote Sensing
Volume 10 - 2022 | https://doi.org/10.3389/feart.2022.876944
This article is part of the Research Topic Applications of Artificial Intelligence in the Oil and Gas Industry View all 9 articles
Appropriate water injection volume is the most basic parameter required to maintain stable formation pressure and ensure the development effect of water flooding in oilfields. However, the determination of appropriate water injection volume has always been a major problem in oilfield water injection management. Based on the Grey relational algorithm, this paper determines the optimal connected injection-production well group through the study of the dynamic relationship between oil and water wells. To specifically predict water injection, a Sparrow search algorithm optimisation model based on Sine mapping is proposed. A Sine-SSA-BP algorithm was devised to predict water injection volume and both the improved algorithm and the original BP algorithm were applied to real-world data to assess their predictive accuracy. The prediction results of the Sine-SSA-BP algorithm were found to be closer to the true value than the results of the original BP algorithm, and the average error percentage is reduced by 23.86%. Therefore, the new algorithm can predict and calculate the water injection volume more accurately. The research content of this paper can provide a theoretical basis for advising adjustment measures in the block to slow down the rise of water content, maintain stable production, and improve the efficiency of the mechanical mining system.
In the early stage of oilfield development or after relying on natural energy for oil recovery, water injection wells are commonly used to improve oil recovery and production rate by injecting water into the oil layer to effectively supplement the formation energy and maintain the oil layer pressure. Water injection is an important technique that has been widely adopted (Feng et al., 2017; Jia et al., 2020; Wang et al., 2020). In the middle and late stages of oilfield development, problems such as rising water cut and declining production necessitate a rapid increase in water injection to achieve stable production of the oilfield. However, this also results in reduced efficiency of the mechanical production system (Rashid et al., 2020; Pyatibratov et al., 2021). The study of injection-production connectivity is of great significance for understanding the remaining oil distribution and making dynamic adjustments during the process. The relationship between injection and production is a dynamic process, which is mainly reflected in dynamic data and is affected by both static parameters and the distribution of underlying fluid and pressure. Thus, the dynamic connectivity between injection and production changes with the development of the oilfield. Therefore, despite its importance, dynamic connectivity is difficult to determine in actual production (Dinh and Tiab, 2008; Liu et al., 2009; Lee et al., 2020). At present, methods of studying connectivity mainly include wireline logging, stratigraphic correlation, geochemistry, pressure testing, and tracers, but these methods are relatively expensive. Using dynamic data to study connectivity can effectively reduce costs while ensuring good accuracy (Li et al., 1997). Some scholars have used bottom hole pressure data, injection-production volume, and multiple linear regression methods to approach this problem (Albertoni and Lake, 2002; Li et al., 2020; Liu et al., 2020), and some others have used a combination of the CM method and injection-production volume (Yousef et al., 2006).
As oilfields develop, they enter a stage where the water cut increases, and existing literature focuses on factors relating to water injection wells, such as water injection timing, water injection methods, and water injection intensity. Few articles combine water injection wells and production wells. To solve the problem of low oil production efficiency, this paper innovatively combines data on both water injection wells and production wells to achieve a balanced analysis of the injection-production system. The dynamic relationship between oil and water wells was studied to determine the best-connected injection and production wells of single-layer reservoir, and the water injection volume was studied as an influencing factor affecting the efficiency of the production well system. Hence, this article provides a theoretical basis for specifying adjustment measures in the block to slow down the rise of water content, maintain stable production, and improve the efficiency of the mechanical mining system.
Gray relational analysis (GRA) is a multi-factor statistical analysis method that can provide quantitative measures for the development and change of a system. This method is suitable for the dynamic course analysis of oil and water well systems (Yin, 2021). Through the grey relational method, the connection between injection and production wells can be determined by comparing the trends in development as influenced by parameters relating to the water injection wells and the oil wells. Changes in the quantity of water injected at the water well will cause changes in liquid production of the corresponding oil well, and the range of the change of liquid production of the oil well is related to the correlation of oil-water wells, where stronger correlation implies greater magnitude of change, and vice versa. GRA can also be used to determine the relevance of surrounding oil wells, where greater calculated relevance indicates better relevance, and vice versa.
The percentage of moisture, liquid production, and bottom-hole flow pressure of the oil production well are important factors that influence the effect of water flooding. Therefore, the percentage of moisture, liquid production, and bottom-hole flow pressure of the oil production well were selected for use in correlation calculations involving the water injection volume of the water injection well to obtain the correlation between connected wells. By taking the percentage of moisture, fluid production, and bottom hole flow pressure as a comparison sequence, a matrix was constructed, as shown below:
In the formula: m is the number of indicators,
Taking the water injection amount as the reference sequence, this was written as:
To more intuitively analyse the data to achieve more accurate conclusions, it was necessary to carry out dimensionless data processing when conducting Grey relational analysis. The dimensionless data sequence forms the following matrix:
The values of the absolute differences between each evaluated object of the indicator sequence and the corresponding element of the reference sequence were calculated one by one. The minimum and maximum values of the absolute difference of each data point were thus determined, namely:
In the formula:
For each evaluation object (comparison sequence), the mean value of the correlation coefficient between each index and the corresponding element of the reference sequence was calculated to reflect the relationship between each evaluation object and the reference sequence. This was called the correlation degree, and was calculated as follows:
In the formula:
In the formula: ρ is the resolution coefficient, 0<ρ < 1, usually ρ takes 0.5. The smaller the ρ, the greater the difference between the correlation coefficients and the stronger the capacity for discrimination. The resolution coefficient can improve the significance of the difference between the correlation coefficients.
In summary, the calculation formula for the correlation coefficient between the oil production well and the water injection well was obtained as:
In the formula:
Based on the oilfield injection and production data, wells with a correlation difference within 0.015 were considered to have the same connection effect, and the wells with the highest correlation degree and a difference within 0.015 were considered the oil-water well group with the best connection effect (Zhang et al., 2016). Figure 1 shows the schematic diagram of water injection wells and surrounding oil wells, demonstrating that there were generally four first-line production wells around each water injection well, and four first-line water injection wells around each oil production well. Only one well and four surrounding first-line wells needed to be included in the correlation calculation.
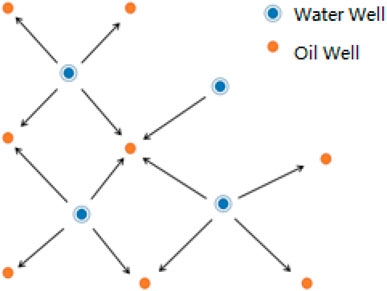
FIGURE 1. Schematic diagram of water injection wells and their surrounding oil wells.
Considering well OO75-160 as an example, the correlation between oil well OO75-160 and its surrounding four first-line water injection wells was calculated using the Grey relational method, as shown in Table 1. The correlation between oil production well OO75-160 and water well PP76-61 was much higher than that of the other water injection wells, which proves that the effective injection well was PP76-61. To verify that the curve fluctuation of oil well OO75-160 was caused by water well PP76-61, the monthly liquid production curve of oil well OO75-160 was compared with changes in the water injection volume of surrounding connected water injection wells, as shown in Figure 2 and Figure 3.
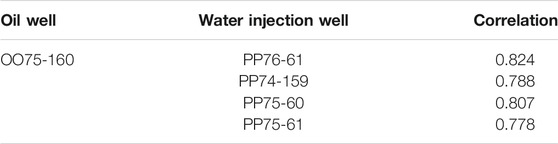
TABLE 1. The correlations between oil production well OO75-160 and water injection wells.
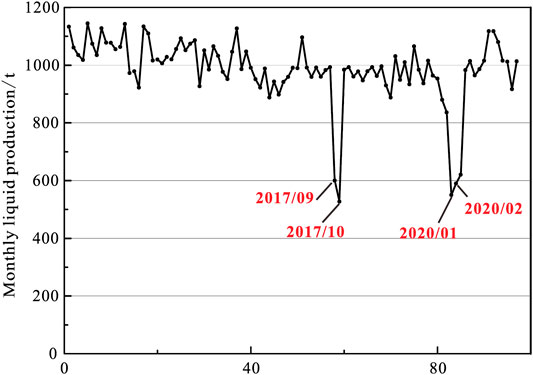
FIGURE 2. Monthly fluid production of oil well OO75-160.
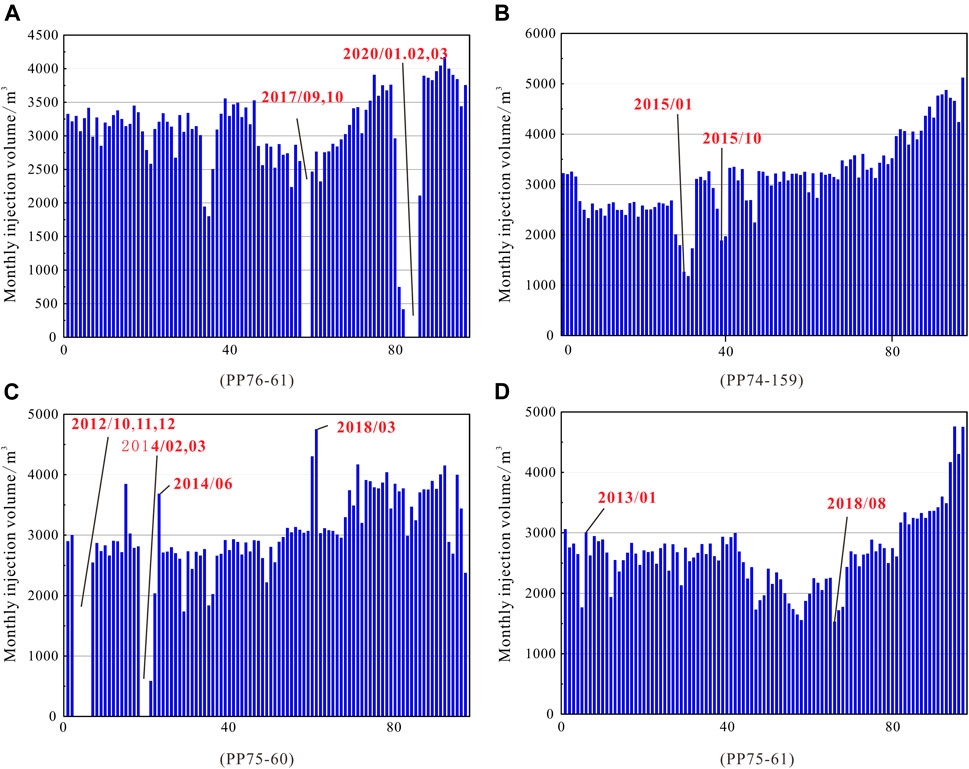
FIGURE 3. Histogram of monthly injection volume of four water injection wells.
As can be seen from Figure 2, the second half of the curve demonstrates obvious fluctuations. Slight fluctuations consistent with those observed in the first half of the curve can be ignored, as these represent the normal fluctuation range. It is only necessary to pay attention to and discuss the time of two significant drops in the second half. Specifically, two large-scale fluctuations occurred in September 2017 and January 2020. The first sudden drop occurred in September 2017, and production continued to decrease in October, before suddenly rising to the original normal range in November. The second time the curve dropped significantly was in January 2020. There was a downward trend in production in the previous 2 months, after which it fell to the lowest point in January and returned to the normal fluctuation range in april after a small increase in February and March.
To verify the connection between the oil well and the surrounding water wells, a histogram of the monthly injection volume of the four surrounding water wells is shown in Figure 3. As displayed in Figure 3A, there were two large fluctuations in the monthly injection volume of well PP76-61. The first was a sudden drop to zero in September 2017, after which injection volume returned to the normal range in November. The second event involved a decline in injection volume beginning in November 2019, followed by a monthly injection volume of zero from January to March 2020. Figures 3B,C show that the monthly injection volume of the two water injection wells did not fluctuate greatly overall, which is in contrast to the fluctuation of the monthly liquid production curve of the oil well. Hence, these were not the relevant water wells of the oil well. Furthermore, as can be seen from Figure 3C, the monthly injection volume of well PP75-60 showed three large fluctuations, with two downward fluctuations in October 2012 and February 2014, and one upward fluctuation in March 2018, which is quite different from the trends in monthly liquid production of the oil production well OO75-160. Comparing the histograms of the monthly water production of the four water injection wells, the two fluctuations of the water well in (a) are very consistent with the fluctuation trend of the monthly liquid production of the oil wells, that is, there is a strong relationship between the two, which is consistent with the results of the Grey relational coefficient analysis. Moreover, this confirms that the injection well shown in (a) is the connecting well of the production well.
To prove that production well OO75-160 is the effective well of water well PP76-61, water injection well PP76-61 was taken as the central well and the correlation degree between oil production well OO75-160 and its surrounding four first-line production wells was calculated by the Grey relational method. The results are shown in Table 2. The correlation degree between oil production well OO75-160 and water well PP76-61 was much higher than those of other oil wells, which proves that the effective well of this water well was OO75-160. To confirm this result, the changes in water injection volume of the water injection wells and the monthly liquid production curve of the four surrounding oil wells were compared, as shown in Figures 4, 5.
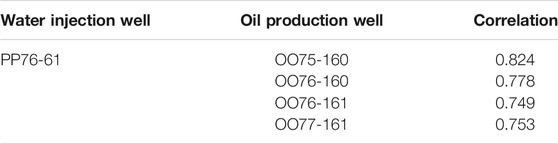
TABLE 2. Correlations between water injection well PP76-61 and oil wells.
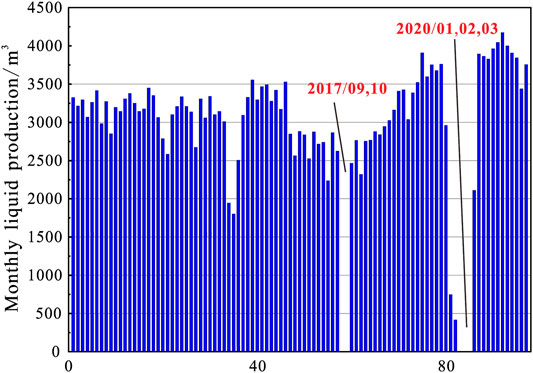
FIGURE 4. Histogram of monthly water injection volume of PP76-61.
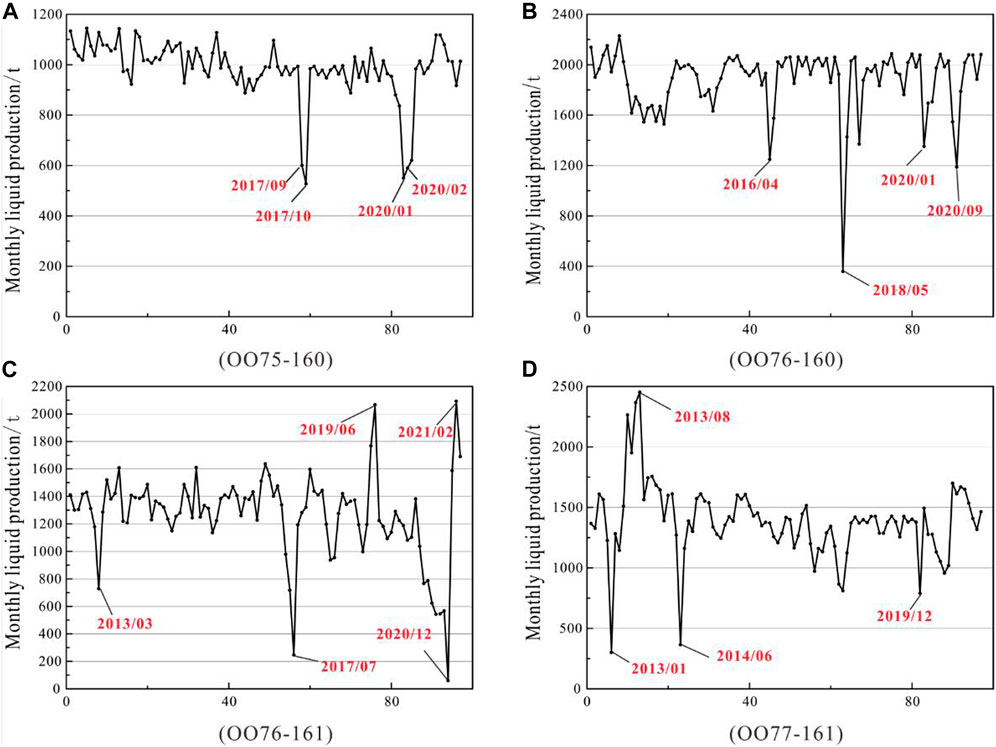
FIGURE 5. Variations in monthly liquid production of surrounding first-line oil wells.
Figure 4 is the same as Figure 3A. There were two large-scale fluctuations in the monthly injection volume of well PP76-61, once in September 2017 and once in January to March 2020. According to the above, the changes in monthly liquid production of the oil well in Figure 5A are highly consistent with those in Figure 4. There were five large-scale declines in Figure 5B. The time of decline for the water injection volume for water injections wells in January 2020 was the same as that of liquid production for the oil wells. However, the water injection wells declined slowly in the first 2 months of January and rose suddenly after March, while oil well OO76-160 (in (b)) rose slowly after a sudden decline in January. Thus, the rates of the changes were different and oil well OO76-160 was not an effective well of PP76-61. Figures 5C,D demonstrates that the time and range of the changes in monthly liquid production of the two oil wells were obviously different from the changes in monthly water injection of the water injection well. Through comparison, it was further determined that water well PP76-61 and oil well OO75-160 are connected wells, and that connected wells can be determined by grey relational analysis.
To explore the impact of water injection on the efficiency of oil production wells, the production well was studied as the central well and Grey relational analysis was performed to determine the best-connected well among the production wells. Thus, the impact of water injection on the system efficiency of connected oil wells was analysed. The system efficiency of oil production wells can be improved by adjusting the water injection volume. According to experience, the water injection volume has a strong correlation with the liquid production, water content, and bottom hole flow pressure of oil production wells. Therefore, the ideal value of water injection volume can be predicted based on the liquid production, water content, and bottom hole flow pressure of oil production wells.
The BP neural network is widely used in the oilfield field because of its strong nonlinear mapping advantages (Pan, 2016; Wu, 2021), and can infinitely approximate a nonlinear relation function with arbitrary accuracy. The typical three-layer BP network structure is shown in Figure 6. Back propagation is an important feature of the BP neural network. In the forward propagation stage, the sample data starts from the input layer and is calculated and processed layer by layer from top to bottom. The output of the upper node is the input of the lower node. Finally, the sample information is transmitted to the output layer node to obtain the prediction result. After the prediction error is calculated, it enters the back propagation stage, and the prediction error of the output node is used to estimate the error of the hidden node layer by layer. The connection weight and threshold are also adjusted layer by layer. Finally, the output value of the network is infinitely close to the actual value. The implementation process of the BP algorithm is shown in Figure 7.
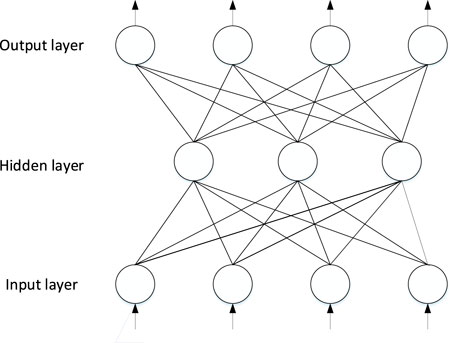
FIGURE 6. Typical three-layer neural network.
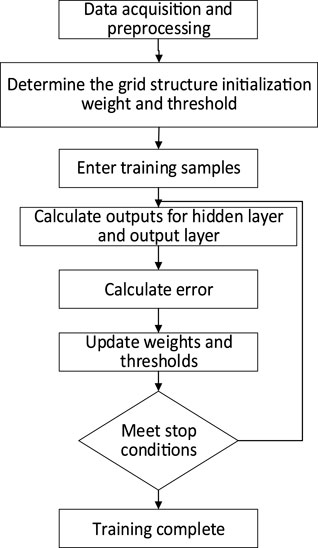
FIGURE 7. BP model training process.
The BP neural network can realise arbitrary nonlinear mapping and solve most practical engineering problems, but in the process of practical application, the BP network model also has some limitations. The first is that it easily falls into the local optimal solution. During normal network operation and the adjustment of weight and threshold, it is hoped to obtain the result with the smallest error, but in actual operation, the network easily falls into the range of the local minimum error and the global optimal solution cannot be obtained. The second is the initial weight sensitivity. The initial network model requires a random small weight coefficient, which makes the neural network model unrepeatable. To solve the above problems, this study optimised the BP neural network based on a Sparrow search algorithm of the sine chaotic map.
The Sparrow search algorithm (SSA) was proposed in 2020 (Xue and Shen, 2020). The algorithm exhibits high performance in different search spaces and can explore the potential global optimal region. Therefore, it effectively solves the local optimal problem based on the complex nonlinear process of threat prediction. Considering all possible group behaviour factors, it has the advantage of fast convergence to the optimal value with high stability for global optimal search and is very suitable for combination with the BP reverse neural network (Wang et al.,2021).
The process of optimising the BP algorithm by the Sparrow search algorithm based on sine mapping is shown in Figure 8.
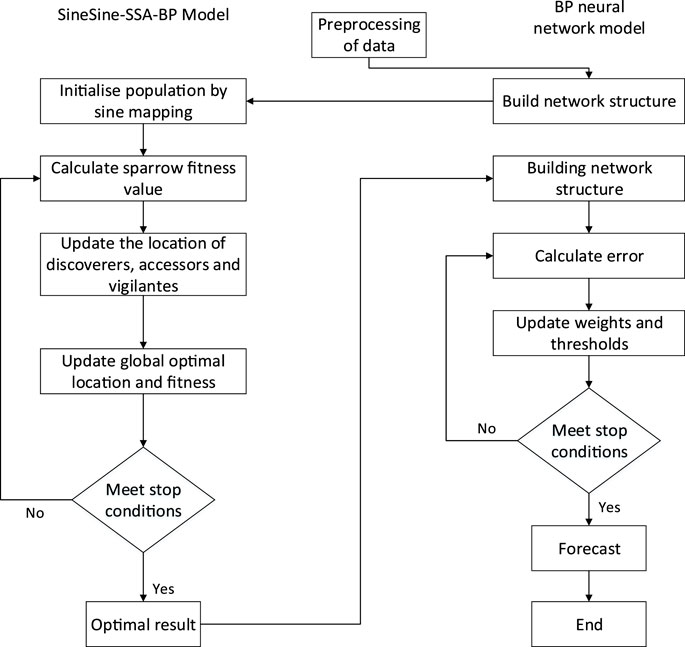
FIGURE 8. Flow chart depicting the process of the Sine-SSA-BP algorithm. Field application of the Sine-SSA-BP algorithm.
The data of a group of associated oil and water wells in the D oilfield block from August 2009 to February 2021 were selected, of which August 2009 to April 2020 were used as the training set. According to steps for model optimisation as introduced above, the Sine-SSA-BP model for water injection prediction was established. The classical three-layer BP neural network was selected in the model, and the structure of the BP neural network was set to 3-5-1, that is, the number of divine elements of the network input layer, hidden layer, and output layer was 3, 5, and 1, respectively. The neurons of the network input layer were water content, flow pressure, and liquid production, and water injection was a parameter of the network output layer. The specific data are shown in Table 3.
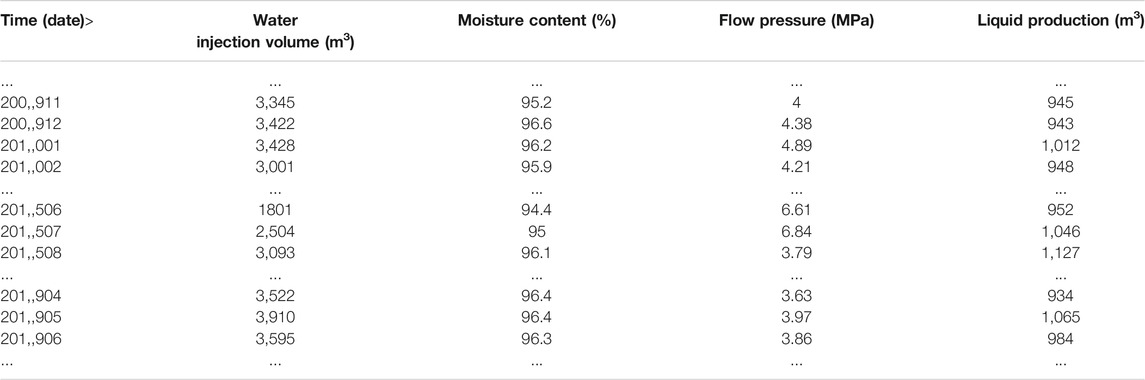
TABLE 3. Original datasheet.
Based on the water injection volume and oil well parameters standardised by min-max, a subset of 123 time points in the data were used as the training set and the last ten time points were used as the test set. The comparison between the predicted results and real values of the BP model and Sine-SSA-BP model is shown in Figure 9. Changes in the trends for the predictions by both models were consistent with trends in the real values, but the overall curve of the Sine-SSA-BP model was closer to the curve of the real values.
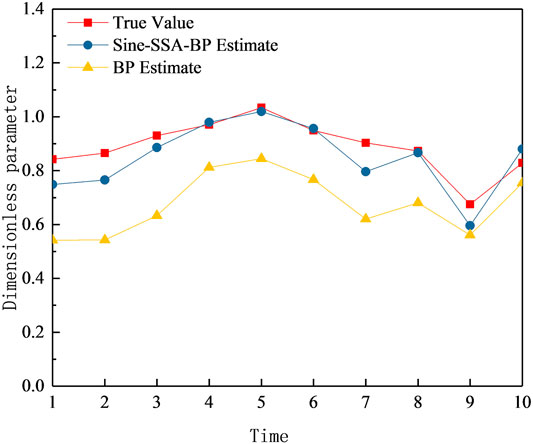
FIGURE 9. Comparison of prediction results.
further analyse the prediction results, the real values and the prediction results of the BP model and the sine-SSA-BP model are listed in Table 4. The table also includes percentage error as the basis for comparative analysis. The calculation formula for percentage error is shown in Eq. 10.
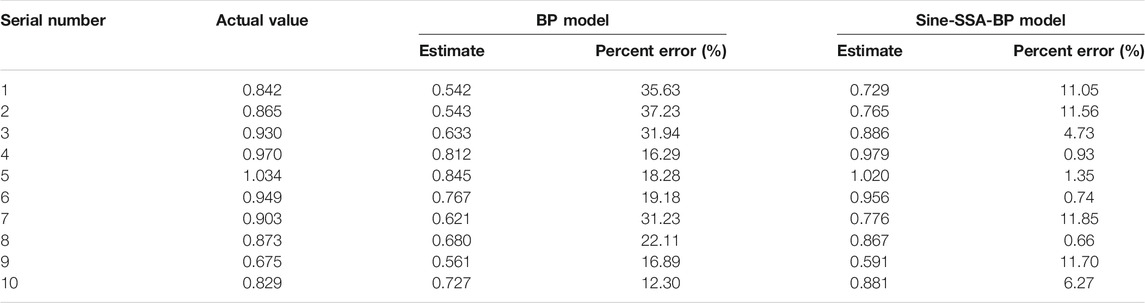
TABLE 4. Prediction results for water injection.
In the formula:
It can be seen from the table that the percentage error of the BP model was 24.11%, while that of the Sine-SSA-BP model was 6.08%. The minimum percentage error of the BP model (12.30%) was markedly higher than that of the Sine-SSA-BP model (0.66%). The percentage error of the Sine-SSA-BP model was within 12%, and the average error was 6.08%. Within the scope of engineering error, the water injection can be reasonably predicted.
To comprehensively evaluate the Sine-SSA-BP model, three indicators of the analysis were selected for further investigation, namely, the MSE (mean square error), MAPE (mean relative error) and MAE (mean absolute error). The mean absolute error, mean square error, and mean relative error all represent the deviation between the actual value and the predicted value. The clearer the value of these three indicators, the higher the prediction accuracy. The smaller the deviation, the more accurate the result. The specific formulae for the three indicators are as follows:
In the formula: n is the number of predicted values,
The evaluation results of the BP model and the Sine-SSA-BP model training set and prediction set are shown in Table 5. The mean square error, mean relative error, and mean absolute error of the Sine-SSA-BP model were significantly lower than those of the BP model, indicating that the prediction of the Sine-SSA-BP model was more accurate.
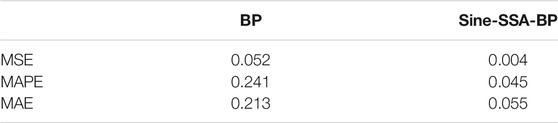
TABLE 5. Prediction and evaluation table.
This paper determines the best-connected injection-production wells through the dynamic correlation between oil and water wells, by investigating water injection volume as the influencing factor for oil production efficiency, conducting water injection prediction research, and proposing a model for water injection prediction based on a Sine-SSA-BP algorithm. Hence, this work provides the basis for the design of adjustment measures in the block to slow down the rise of water content, maintain the stability of production, and improve the efficiency of the mechanical production system.
1) Using the Grey relational method, the water content, liquid production, and bottom hole flow pressure of the production well were selected for correlation analysis with the water injection volume of the water injection well. The correlation coefficient of the production well and the water injection well was deduced, and a method was proposed for the determination of the connection relationship between the injection and production wells.
2) A Sparrow search algorithm optimisation BP model based on sine mapping was proposed. The Sparrow algorithm was used to explore the potential global optimal region. At the same time, sine chaotic mapping was used to replace the random initialisation of the Sparrow population, which can improve the uniformity of the search spatial distribution.
3) Comparing the prediction results for the water injection volume of the water injection wells by the Sine-SSA-BP algorithm and the original BP algorithm, it was found that the prediction results of the Since-SSA-BP algorithm were closer to the real value, with a prediction error of 6.08%, which is far less than the 24.11% of the BP algorithm. Therefore, the Sine-SSA-BP algorithm can predict and analyse the water injection volume more accurately.
The original contributions presented in the study are included in the article/supplementary material, further inquiries can be directed to the corresponding author.
DK is responsible for the conception of the whole paper, ZX is responsible for data sorting, LQ is responsible for the establishment of sine SSA BP model, LW is responsible for the establishment of BP model, and CS is responsible for comparative analysis.
The project is supported by the Young innovative talents in Colleges and universities of Heilongjiang Province (Number: UNPYSCT-2020150) and Petro China Innovation Foundation (Number: 2020D-5007-0206).
The authors declare that the research was conducted in the absence of any commercial or financial relationships that could be construed as a potential conflict of interest.
All claims expressed in this article are solely those of the authors and do not necessarily represent those of their affiliated organizations, or those of the publisher, the editors and the reviewers. Any product that may be evaluated in this article, or claim that may be made by its manufacturer, is not guaranteed or endorsed by the publisher.
Albertoni, A., and Lake, L. W. (2002). “Inferring Interwell Connectivity from Well-Ratefluctuations in Waterfloods,” in SPE/DOE Improved Oil Recovery Symposium, Tulsa, 1–15. 75225. doi:10.2523/75225-MS
Dinh, A., and Tiab, D. (2008). Inferring Interwell Connectivity from Well Bottomhole-Pressure Fluctuations in Waterfloods. Spe Reservoir Eval. Eng. 11 (5), 874–881. doi:10.2118/106881-pa
Feng, Z.-M., Tan, J.-j., Liu, X., and Fang, X. (2017). Selection Method Modelling and Matching Rule for Rated Power of Prime Motor Used by Beam Pumping Units. J. Pet. Sci. Eng. 153, 197–202. doi:10.1016/j.petrol.2017.03.048
Jia, D., He, L., Zhang, J., and Gong, B. (2020). Data-driven Optimization for fine Water Injection in a Mature Oil Field. Pet. Exploration Development 47 (3), 629–636. doi:10.1016/s1876-3804(20)60084-2
Lee, Y., Kim, S., Wang, J., and Sung, W. (2020). Relationship between Oil Production and CO2 Storage during Low-Salinity Carbonate Water Injection in Acid Carbonate Reservoirs. J. Ind. Eng. Chem. 88, 215–223. doi:10.1016/j.jiec.2020.04.016
Li, D., Liu, X., Zha, W., Yang, J., and Lu, D. (2020). Automatic Well Test Interpretation Based on Convolutional Neural Network for a Radial Composite Reservoir. Pet. Exploration Development 47 (3), 623–631. doi:10.1016/s1876-3804(20)60079-9
Li, Q., Wang, Y., and Huanzhong, D. (1997). Relationship between Reasonable Injection-Production Ratio and Pressure Level in Development Area of Southern Saertu Reservoir, Daqing Oilfield. SPE Adv. Technology Ser. 5 (1), 28–34.
Liu, F., Mendel, J. M., and Nejad, A. M. (2009). Forecasting Injector/Producer Relationships from Production and Injection Rates Using an Extended Kalman Filter. SPE J. 14 (4), 653–664. doi:10.2118/110520-pa
Liu, X., Li, D., Yang, J., Zha, W., Zhou, Z., Gao, L., et al. (2020). Automatic Well Test Interpretation Based on Convolutional Neural Network for Infinite Reservoir. J. Pet. Sci. Eng. 195, 107618. doi:10.1016/j.petrol.2020.107618
Pan, L. (2016). Research on Residual Chlorine Prediction Model of Oilfield Reinjection Water Based on Optimized BP Neural Network. Wuhan: Wuhan University of science and technology.
Pyatibratov, P. V., Kalinin, D. S., Nazarova, L., and Nikolaevnaa, L. (2021). Enhanced Oil Recovery in Tight Oil Reservoirs Using Dual Injection and Production. Neftyanoe Khozyaystvo-Oil Industry 3, 58–61. doi:10.24887/0028-2448-2021-3-58-61
Rashid, O., Low, K. W. Q., and Pittman, J. F. T. (2020). Mold Cooling in Thermoplastics Injection Molding: Effectiveness and Energy Efficiency. J. Clean. Prod. 264 (1), 121375. doi:10.1016/j.jclepro.2020.121375
Wang, H., Mu, L., Shi, F., and Dou, H. (2020). Production Prediction at Ultra-high Water Cut Stage via Recurrent Neural Network. Pet. Exploration Development 47 (5), 1009–1015. doi:10.1016/s1876-3804(20)60119-7
Wang, X., Liu, J., Hou, T., and Pan, C. (2021). The SSA-BP-Based Potential Threat Prediction for Aerialtarget Considering Commander Emotion. Defence Technology (3). doi:10.1016/j.dt.2021.05.017
Wu, J. (2021). Research and Application of Oilfield Stimulation index Optimization Model Based on Big Data Mining. Xi’an: Xi'an University of petroleum.
Xue, J., and Shen, B. (2020). A Novel Swarm Intelligence Optimization Approach: Sparrow Search Algorithm. Syst. Sci. Control. Eng. 8 (1), 22–34. doi:10.1080/21642583.2019.1708830
Yin, F. (2021). Research on Correlation Evaluation Method of Polymer Flooding Injection Production wells Based on Grey Theory. Inner Mongolia Petrochemical Industry 4, 104–108.
Yousef, A. A., Lake, L. W., and Jensen, J. L. (2006). Analysis and Interpretation of Interwell Connectivity from Production and Injection Rate Fluctuations Using a Capacitance Model. Tusla: Society of Petroleum Engineers.
Keywords: correlation model, system efficiency, algorithm optimisation, water injection analysis, sine-SSA-BP
Citation: Kangxing D, Xinrui Z, Qiuyu L, Wei L and Siyuan C (2022) Balance and Correlation Analysis of Oilfield Injection-Production System Based on Data Mining. Front. Earth Sci. 10:876944. doi: 10.3389/feart.2022.876944
Received: 16 February 2022; Accepted: 28 February 2022;
Published: 24 March 2022.
Edited by:
Kai Zhang, China University of Petroleum, ChinaReviewed by:
Xiaodong Han, China University of Petroleum, ChinaCopyright © 2022 Kangxing, Xinrui, Qiuyu, Wei and Siyuan. This is an open-access article distributed under the terms of the Creative Commons Attribution License (CC BY). The use, distribution or reproduction in other forums is permitted, provided the original author(s) and the copyright owner(s) are credited and that the original publication in this journal is cited, in accordance with accepted academic practice. No use, distribution or reproduction is permitted which does not comply with these terms.
*Correspondence: Lu Qiuyu, ZGt4QG5lcHUuZWR1LmNu
Disclaimer: All claims expressed in this article are solely those of the authors and do not necessarily represent those of their affiliated organizations, or those of the publisher, the editors and the reviewers. Any product that may be evaluated in this article or claim that may be made by its manufacturer is not guaranteed or endorsed by the publisher.
Research integrity at Frontiers
Learn more about the work of our research integrity team to safeguard the quality of each article we publish.