- 1School of Ocean Sciences, China University of Geosciences, Beijing, China
- 2Marine and Polar Research Center, China University of Geosciences, Beijing, China
- 3Guangzhou Marine Geological Survey, China Geological Survey, Guangzhou, China
- 4Academy of South China Sea Geological Science, China Geological Survey, Sanya, China
- 5Hubei Key Laboratory of Marine Geological Resources, China University of Geosciences, Wuhan, China
- 6Institute of Geology and Geophysics, Chinese Academy of Sciences, Beijing, China
- 7School of Geosciences and Resources, China University of Geosciences, Beijing, China
- 8Department of Earth and Environment Sciences, Macquarie University, Sydney, NSW, Australia
Exploration and pilot production have confirmed that gas hydrates in the Shenhu area on the northern continental slope of the South China Sea have enormous resource potential. However, a meticulous depiction of gas hydrate reservoirs based on sediments is limited. The distributed low-flux gas hydrates are mainly deposited in the Shenhu area, and the gas hydrate saturation exhibits extreme vertical heterogeneity. In this study, we focused on the sediment microstructure of gas hydrate reservoirs. Based on the variation in gas hydrate saturation, the study interval was divided into non-gas hydrate (non-GH) as well as I-, II-, and III-gas hydrate reservoir layers. We analyzed the relationship between sediment microstructure and gas hydrate reservoirs based on computed tomography scans, specific surface area analysis, and scanning electron microscopy observations. The results showed that the sediment in gas hydrate reservoirs had three types of pores: 1) intergranular pores between coarse grains (CG-intergranular pores), 2) intergranular pores between fine grains (FG-intergranular pores), and 3) biologic grain pores (BG-pores). The CG- and FG-intergranular pores were mainly formed by the framework, which consisted of coarse minerals (such as quartz and feldspar) and clay minerals, respectively. The BG-pores were mainly formed by the coelomes of foraminifera. CG-intergranular pores and BG-pores can provide effective reservoir space and increase the permeability of sediment, which is conducive to gas hydrate accumulation. The FG-intergranular pores reduce permeability and are not conducive to gas hydrate accumulation. Clay minerals and calcareous ultramicrofossils with small grain sizes and complex microstructures fill the effective reservoir space and reduce the permeability of sediment; additionally, they improve the adsorption capacity of sediment to free gas or pore water, which is not conducive to gas hydrate formation and accumulation. The results of our study explicitly suggest that the microstructure of sediment is an important controlling factor for gas hydrate accumulation and reveals its underlying mechanism.
Introduction
Gas hydrates constitute a potential strategic energy resource for the future owing to their high-density energy and clean-burning features (Boswell and Collett, 2006; Tréhu et al., 2006; Boswell et al., 2012; Koh et al., 2012; Malagar et al., 2019). Globally, most gas hydrates occur in submarine sediments. In recent years, a series of scientific research, exploration, and gas hydrate production tests have been conducted in the Gulf of Mexico, Cascadia subduction zone, Nankai Trough in Japan, Ulleung Basin in Korea, Krishna-Godavari Basin in India, and the northern South China Sea (Pohlman et al., 2009; Boswell et al., 2012; Collett et al., 2012; Ryu et al., 2013; Ito et al., 2015; Zhang et al., 2015; Su et al., 2016; Boswell et al., 2019). Based on a large number of relevant previous studies, gas hydrate accumulation is significantly controlled by the gas hydrate stability zone, gas source, and gas migration channels (Collett, 2002; Lu and McMechan, 2002; Tréhu et al., 2006; Wu et al., 2007; Wang et al., 2014). However, as exemplified by many cases of gas hydrate drilling, the gas hydrate forms and saturation are significantly different among different sea areas, different sites in the same sea area, and even different layers at the same site (Colwell et al., 2004; Tréhu et al., 2006; Ryu et al., 2013; Boswell et al., 2019; Liang et al., 2019; Ye et al., 2019). Gas hydrate formation and saturation exhibit strong horizontal and vertical heterogeneity in the gas hydrate stability zone (Yang S. et al., 2017; Kang et al., 2020). The heterogeneity of gas hydrate accumulation is difficult to explain solely based on controlling factors, such as gas hydrate stability zone, gas source, or gas migration channels. Differences in gas hydrate reservoir properties may also play a key role in restricting gas hydrate accumulation.
For decades, research on gas hydrate reservoirs has mainly relied on geophysical methods. Many researchers have used seismic and logging while drilling (LWD) data to describe and characterize gas hydrate reservoirs (Chand et al., 2004; Collett et al., 2012; Wang et al., 2014; Liang et al., 2016; Haines et al., 2017; Yang J. et al., 2017). LWD data can be used to calculate the gas hydrate saturation and identify potential gas hydrate reservoirs (Chand et al., 2004; Collett et al., 2012; Liang et al., 2016; Yang J. et al., 2017). Seismic profiles can help describe and study the characteristics of gas hydrate-bearing deposits; by combining these with logging data, we can reveal the plane distribution of gas hydrate reservoirs (Popescu et al., 2006; Wang et al., 2014; Li et al., 2016; Su et al., 2017; Bai et al., 2019; Zhang et al., 2020). Most gas hydrate reservoir studies that rely on geophysical methods have been conducted on a large scale. Higher-resolution reservoir studies require more detailed and accurate information from sediment data. There has also been research on the properties of gas hydrate reservoir sediment. Some researchers have studied the effects of grain size parameters and biological components of sediments on gas hydrate reservoirs. They found that coarse grain size (Lu and McMechan, 2002; Colwell et al., 2004; Tréhu et al., 2006; Ito et al., 2015; Li et al., 2019), poor sorting (Waite et al., 2019; Yang et al., 2020), and some types of microfossils (e.g., foraminifera and diatoms) (Chen et al., 2013; Ryu et al., 2013; Zhang et al., 2015; Boswell et al., 2019) have potentially positive effects on gas hydrate accumulation. However, as gas hydrate exploration has increased, these rules cannot be applied to all research cases (Zhang et al., 2015; Yi et al., 2018; Boswell et al., 2019; Li et al., 2019; Su et al., 2021), indicating that the influence of sediment properties on gas hydrate accumulation is very complex.
Recent research has shown that sediment microstructure is also a controlling factor for gas hydrate accumulation (Jones et al., 2007; Ghosh and Ojha, 2021). Some researchers have used laboratory simulation methods to explore the formation process of gas hydrates in sediment and the variation in porosity and permeability properties and established the relationship between porosity and permeability parameters and gas hydrate saturation (Wang et al., 2020; Wu et al., 2020; Li et al., 2021). These laboratory simulations provide a reasonable basis for exploring the effect of the sediment microstructure on gas hydrate accumulation. However, the actual conditions for gas hydrate accumulation are complex. Thus, some researchers have used actual gas hydrate-bearing sediments for microstructural research. They considered that the mineral type and grain size determine the pore space and influence gas hydrate accumulation (Lee et al., 2013; Bian et al., 2020; Cai et al., 2020). Undoubtedly, the reservoir space is one of the key factors affecting gas hydrate accumulation. However, it is difficult to explain the gas hydrate accumulation rule in many research cases simply by emphasizing the control effect of sediment grain size and pore space, especially in gas hydrate reservoirs dominated by fine-grained sediments in the northern South China Sea (Zhang et al., 2015; Su et al., 2016; Li et al., 2019). Thus, the effect of sediment microstructure on gas hydrate accumulation requires further research.
Gas hydrates in the Shenhu area of the northern South China Sea (SCS) are typically dominated by diffused gas hydrates (Liang et al., 2016). Sediments in the Shenhu area have a more significant controlling effect on gas hydrate accumulation (Zhang et al., 2015; Li et al., 2019; Su et al., 2021). Therefore, the selection of gas hydrate-bearing sediment samples from the Shenhu area is more conducive to discussing the influence of the sediment microstructure on gas hydrate accumulation. In this study, scanning electron microscopy (SEM) and computed tomography (CT) were used to characterize the microstructure of gas hydrate-bearing sediments. Then, we combined the microstructural features of the sediment, specific surface area, and biological data to reveal the controlling effect of sediment microstructure on gas hydrate accumulation.
Geological Setting
The SCS is 1,212 m deep on average, with a maximum depth of 5,377 m (Wu et al., 2007). The northeastern slope of the SCS is located in the transitional zone between quasi-passive and active continental margins. The northeastern slope of the SCS has a complex geological structure and covers a total area of approximately 2.3 × 10⁵ km2, with a length of 900 km and a width of 143–342 km (Shao et al., 2007; Wu et al., 2007; Bai et al., 2019; Li et al., 2019; Zhang W. et al., 2019). The western part of the northeastern slope of the SCS is the Pearl River Mouth Basin, which has an extensional setting (Figure 1A). During the Paleocene, the northeastern slope of the SCS was a rift basin, and numerous faults of different scales were formed (Shao et al., 2007; Bai et al., 2019; Li et al., 2019). After the Middle Miocene, the northeastern continental margin of the SCS entered a tectonic subsidence stage. During this stage, the regional sedimentary layer was dominated by marine sediments, with a very high deposition rate of approximately 520 m/Ma (Shao et al., 2007).
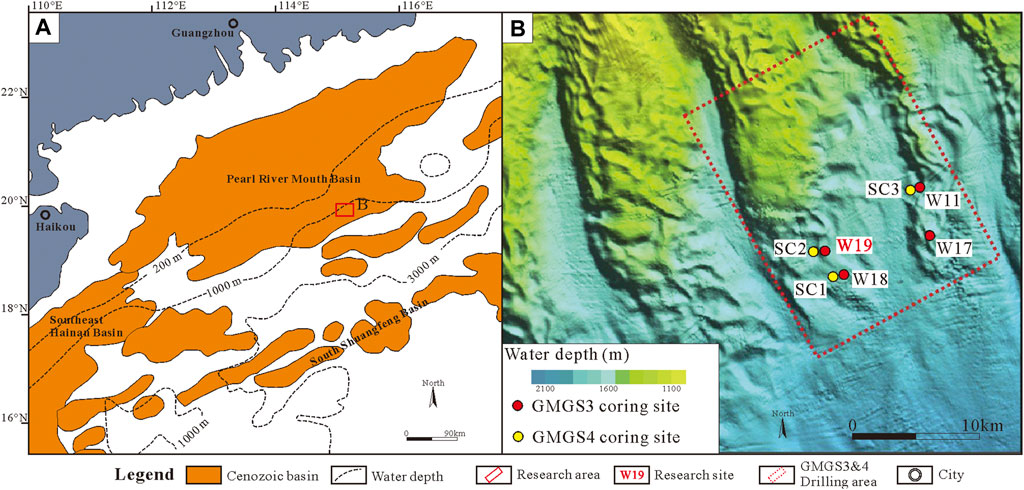
FIGURE 1. The geological map of study area. (A) the geological map of northern slope of SCS, modified from Li et al. (2019); (B) enlarge the red box in figure (A), the drilling area of GMGS3&4, modified from Zhang W. et al. (2019).
According to a series of exploratory drilling expeditions and two gas hydrate production tests conducted by the Guangzhou Marine Geological Survey (GMGS) in the past few years, the SCS is known worldwide as an attractive and potentially resource-rich area that contains gas hydrates (Liu et al., 2012; Li et al., 2018; Qin et al., 2020; Su et al., 2021). In the third gas hydrate exploratory drilling expeditions by GMGS (GMGS3), gas hydrates were obtained at sites W11, W17, W18, and W19 (Figure 1B). The sediment core, geophysical data, and geological background data of sites W11, W17, W18, and W19 were also obtained during the GMGS3 expedition. Site W19 is located on the western ridge of the GMGS3 drilling area and contains a favorable gas hydrate reservoir. The gas hydrates at site W19 occurred between 134 and 171 m below the seafloor (mbsf), at gas hydrate saturations as high as approximately 71% (Zhang et al., 2020). Site W19 was selected as the key site owing to its high hydrate saturation and thick reservoir.
Materials and Methods
Core Samples, SEM Observations, and CT Scans
This study focused on the gas hydrate reservoir and adjacent layers of site W19 (114.4–171 mbsf) and 39 samples were obtained for SEM observations, CT scans, and specific surface area (SSA) analyses (Table 1; Figure 3). The gas hydrate in the core samples decomposed under changes in temperature and pressure conditions (Figure 2A). However, gas hydrate decomposition has a limited influence on the mineral and biological components and SSA in sediments (Zhang et al., 2016; Li et al., 2019; Waite et al., 2019). The microstructure of the core samples is not in the in-situ state with gas hydrates. However, the samples can represent the microstructural features of the sediment before gas hydrate formation, which is significant for gas hydrate accumulation analysis. The samples used for SEM observation and CT scans in this study were obtained using plastic square cubes (2 × 2 × 2 cm), which helped preserve the original microstructural features as much as possible (Figure 2B). The samples were stored on dry ice until the tests were conducted in the laboratory.
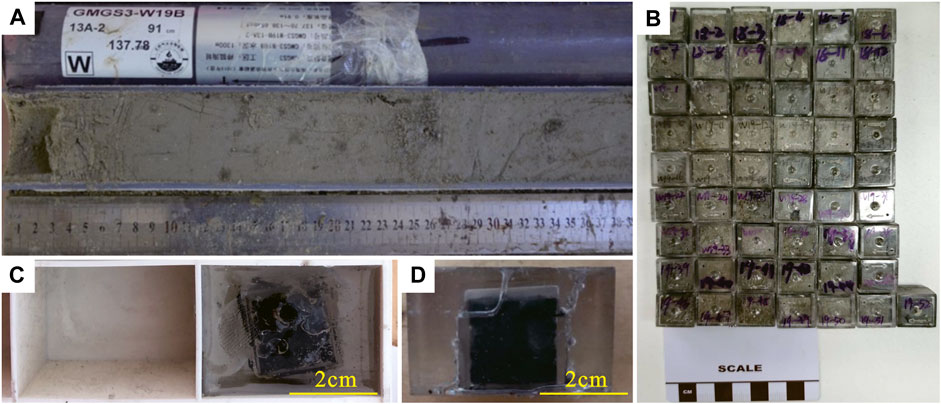
FIGURE 2. The sampling method images. (A) the sediment cores of Site W19; (B) the sample cubes for microstructure analysis which sampling from sediment cores; (C) and (D) the images of sample preparation process.
As the square cubes were made of plastic, which has no effect on the CT scan, the samples and square cubes were tested directly to obtain CT scan images and data. A total 12 samples were used for CT scan. The CT scan was performed by Nanjing Hongchuang Geological Exploration Technology Service Co., Ltd.
The samples used for the SEM observation were prepared as follows:
(1) First, the epoxy resin and curing agent proportions were adjusted. We used more epoxy resin and less curing agent, which prolongs the curing time of epoxy resin and facilitates infiltration.
(2) Then, the samples were placed in a mold and wrapped with a mixture of epoxy resin and a curing agent (Figure 2C). The samples were then left at 25°C for curing (Figure 2D).
(3) Next, the samples were cut.
(4) The cut surface was reinfused with a mixture of epoxy resin and curing agent to ensure that the samples were completely cured.
(5) The cut surface of the samples was ground and the samples were placed on the slide and cut to 1–2 mm thickness.
(6) The samples were polished with 800- and 1200-mesh emery cloths to complete the preparation.
The samples for SEM observation were prepared at the Institute of Geology and Geophysics, Chinese Academy of Sciences.
Gas Hydrate Saturation
The analysis of gas hydrate saturation of site W19 was mainly based on the voyage report of GMGS3. In this study, resistivity log data, Cl− anomalies of the pore water in sediment, and quantitative degassing of the pressure core were used to analyze the gas hydrate variation trend (Dvorkin et al., 1999; Qian et al., 2018; Ye et al., 2019).
Biological Statistics
Biological data were obtained from the voyage report of GMGS3 and were tested at the Test Center of the Guangzhou Marine Geological Survey.
Specific Surface Area
SSA analysis was conducted using Quantachrome Autosorb-1 and Quantachrome Nova Station A instruments at the Institute of Analysis and Testing, Beijing Academy of Science and Technology. Before the analysis, the samples were degassed at approximately 383.15 K under vacuum for approximately 12 h to remove adsorbed moisture and residual volatiles. The N2 sorption isotherms were determined at 77.35 K within a relative pressure (P/Po = absolute/saturation pressure) range of 0.009–0.995. The specific surface area was calculated using the Brunauer-Emmet-Teller equation (Brunauer et al., 1938).
Results
Lithology
The lithological data of site W19 were collected from the voyage report of the GMGS3. In the study interval at site W19, the sediments were dominated by clayey silt and silt. The sand content of the sediments ranged from 0.12 to 10.85%, with an average of 3.34%. The silt content of the sediments ranged from 55.64 to 80.07%, with an average of 70.00%. The clay content of the sediments ranged from 17.21 to 44.19%, with an average of 26.66%. In the upper part of the study interval (114.4–145 mbsf), the sediments were dominated by clayey silt with only a few silt layers in the bottom part (Figure 3). In the lower part of the study interval (145–171 mbsf), the sediments were dominated by silt with several interbedded clayey silt layers (Figure 3). In Site W19, the sediments mainly consist of quartz, feldspar, calcite, and clay minerals, and a few dolomite, siderite, and anhydrite appear in some layers. The clay minerals were dominated by illite/smectite, illite, kaolinite, and chlorite.
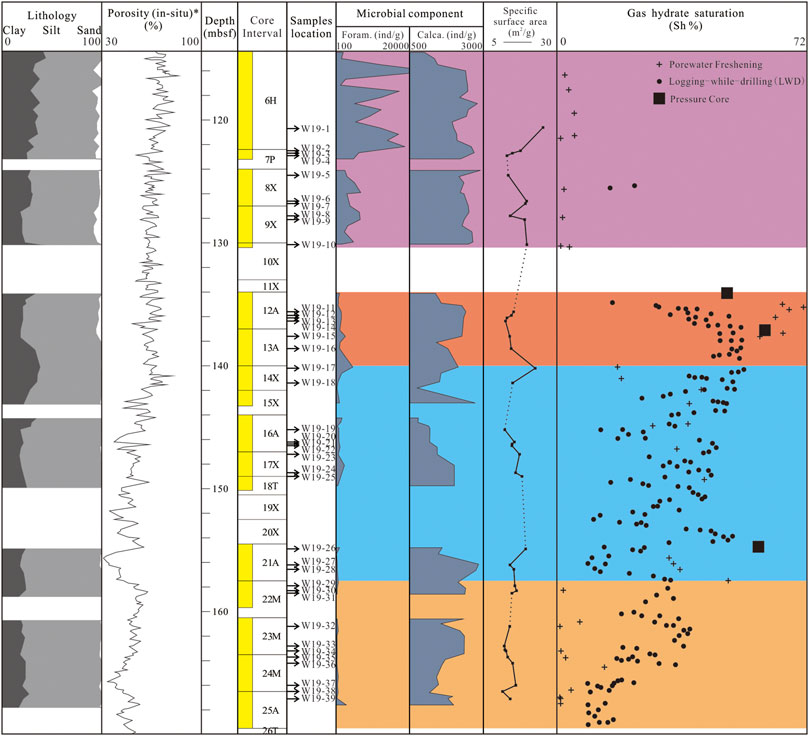
FIGURE 3. The comprehensive column of Site W19. The lithology data are cited from voyage report of the GMGS3. Foram. and Calca. are short for foraminifera and calcareous ultra-microfossils, respectively. The purple, red, bule and orange shaded area indicate non-GH, Ⅰ-, Ⅱ-, and Ⅲ-GHR layers, respectively. * The Porosity (in-situ) is calculated by LWD data.
Microstructural Features of Gas Hydrate-Bearing Sediment
Based on the SEM observations, the sediments at site W19 mainly consisted of quartz, feldspar, carbonates, and clay minerals (Figure 4A). The quartz mainly exhibited a granular shape with a diameter of 8–30 μm. The edge of the quartz was smooth and exhibited some abrasion (Figure 4B). The feldspar in the sediment could be classified into two categories, K-feldspar and plagioclase, which both have similar morphology. The diameter of the feldspar ranged from 10 to 30 μm, while its edge was smooth but indicated some traces of corrosion (Figures 4A, C). The carbonates in the sediment were mostly calcite, which appeared as fossils. Some fossils were calcareous ultramicrofossils with diameters of less than 2 μm (Figure 4D). Other fossils were foraminiferal shells, which consisted of calcite. The calcite particles in the foraminiferal shells were fibrous with unclear edges. The diameter of the foraminiferal shells was >20 μm (Figure 4E). Many clay minerals in the sediment included filamentous or flaky illite/smectite (I/S) (Figure 4F), illite (Figures 4G, H), sheet-like kaolinite, and flaky chlorite (Figure 4I). The diameter of the clay mineral particles was less than 1 μm.
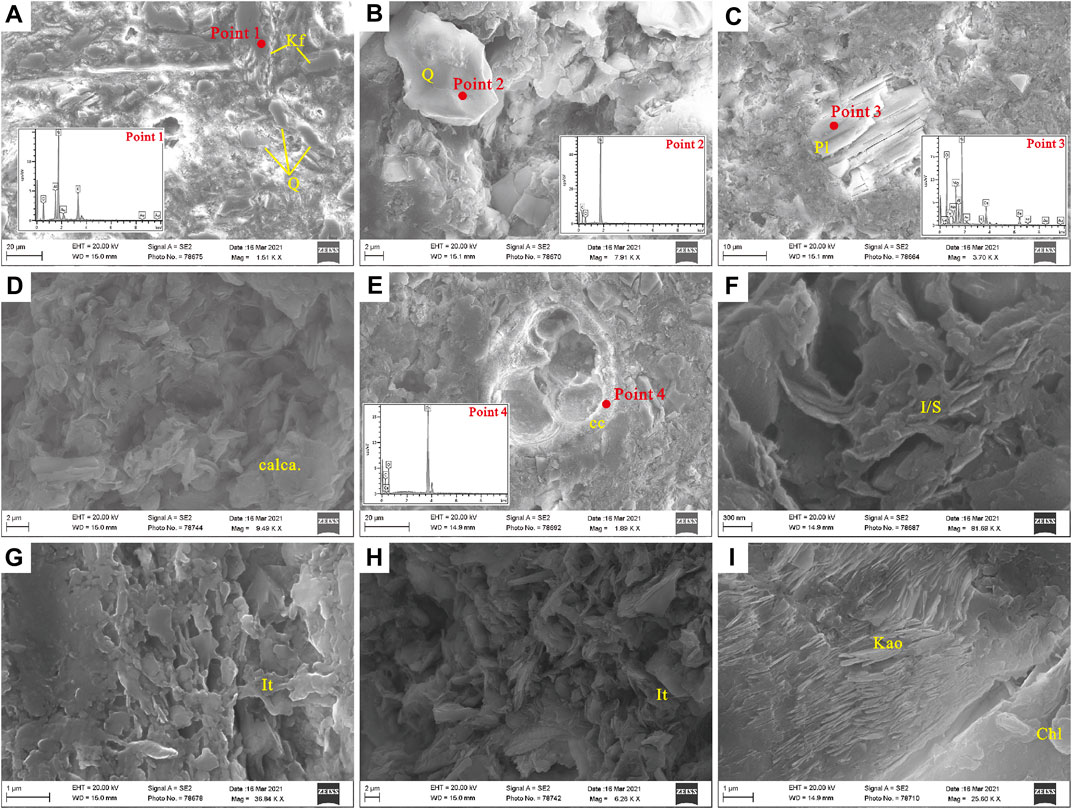
FIGURE 4. The microstructure features of gas hydrate-bearing sediments. (A) Site W19, 126.60 mbsf, sediments consist of quartz, K-feldspar and clay minerals; (B) Site W19, 135.60 mbsf, the quartz in sediments; (C) Site W19, Site W19, 135.60 mbsf, the plagioclase in sediments; (D) Site W19, 127.80 mbsf, the calcareous ultra-microfossils in sediments; (E) Site W19, 135.90 mbsf, the foraminifera shell composed of calcite; (F) Site W19, 130.20 mbsf, the I/S in sediments; (G) Site W19, 136.1 mbsf, the filamentous ilite in sediments; (H) Site W19, 136.1 mbsf, the flaky ilite in sediments; (I) Site W19, 166.6 mbsf, the sheet-like kaolinite and flaky chlorite. Q, kf, Pl, calca, cc, I/S, It, Kao, and Chl are short for quartz, K-feldspar, plagioclase, calcareous ultramicrofossils, calcite, illite/semectite, illite, kaolinite and chlorite, respectively.
Gas Hydrate Saturation Data
In this study, gas hydrate saturation refers to resistivity log data, Cl− anomalies of the pore water in the sediment, and quantitative degassing of the pressure core. The gas hydrate saturation ranged from 10 to 54% based on the resistivity log data (Figure 3). Based on the Cl− anomalies of the pore water in the sediments, the gas hydrate saturation ranged from 0.21 to 70.90% (Figure 3). According to the voyage of GMGS3, only three pressure cores (12, 13, and 21A) were successfully obtained, from which we collected 234 L, 228 L, and 190 L, respectively, of methane gas. The gas hydrate saturation values calculated for the three pressure cores were 60, 58, and 49%, respectively (Figure 3).
Biological Statistics
The biological component mainly consisted of foraminifera and calcareous ultramicrofossils based on SEM observations. The abundance of the foraminifera in the study interval ranged from 238.8 ind/g to 39,014.4 ind/g, with an average of 3,214.5 ind/g. The abundance of calcareous ultramicrofossils ranged from 758 ind/g to 2,895 ind/g, with an average of 1,872.1 ind/g.
Specific Surface Area Data
The SSA data are presented in Table 2; Figure 3. The SSA of the sediments in the study interval ranged from 11.49 m2/g to 24.86 m2/g, with an average of 15.6 m2/g.
Discussion
Gas Hydrate Saturation Variation Rule
The quantitative degassing of the pressure core provides the most accurate gas hydrate saturation. However, owing to the high cost of obtaining a pressure core, data on gas hydrate saturation with quantitative degassing of the pressure core are scarce. It is difficult to indicate the variation in gas hydrate saturation. The gas hydrate saturation estimated by the resistivity logs was continuous and independent of the sediment samples. However, resistivity logs have multiple solutions (Chand et al., 2004; Collett et al., 2012; Wang et al., 2014). The gas hydrate saturation estimated by the Cl− anomalies of pore water in sediment is relatively accurate and relatively continuous (Lu and McMechan, 2002; Su et al., 2021). Meanwhile, the study of microstructures depends on the sediment sample, and it can be well matched with the gas hydrate saturation estimated by the Cl− anomalies of the pore water in the sediment.
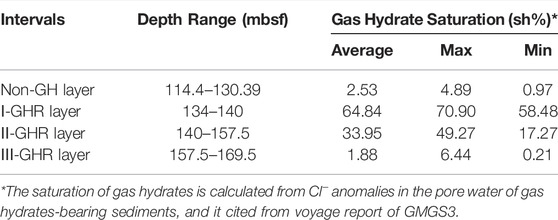
The gas hydrate saturation was very low in the upper part of the study interval, highest in the middle part, decreased with fluctuation, and was lower in the bottom part (Figure 3). Combined with the methane gas migration direction, the study interval was divided into upper and lower sections with 134 mbsf as the boundary. The upper section was the non-gas hydrate layer (114.4–130.39 mbsf). Furthermore, the lower section was the gas hydrate reservoir layer, which was subdivided into three layers according to the gas hydrate saturation: 1) I-gas hydrate reservoir (I-GHR) layer, where the gas hydrate saturation ranged from 58.48 to 70.90%, with an average of 64.84% (Table 3); 2) II-gas hydrate reservoir (II-GHR) layer, where the gas hydrate saturation ranged from 17.27 to 49.27%, with an average of 33.95% (Table 3); 3) III- gas hydrate reservoir (III-GHR) layer, where the gas hydrate saturation ranged from 0.21 to 6.44%, with an average of 1.88% (Table 3).
Microstructure in Different Gas Hydrate Reservoir Layers
The study of the sediment microstructure relied on SEM observations and CT scans. CT scans can directly display the microstructural features of sediment, particularly the size and distribution of pores (Jones et al., 2007; Bian et al., 2020; Wu et al., 2020). SEM observations can reveal more details of microstructural features, such as more accurate size, morphology, and sediment composition of pores (Bohrmann et al., 2007; Klapp et al., 2010; Oshima et al., 2019; Cai et al., 2020).
The SEM observation and CT scan results indicate that there are 1) intergranular pores between coarse grains (CG-intergranular pores), 2) intergranular pores between fine grains (FG-intergranular pores), and 3) biologic grain pores (BG-pores) in the study interval sediments (Figure 5A).
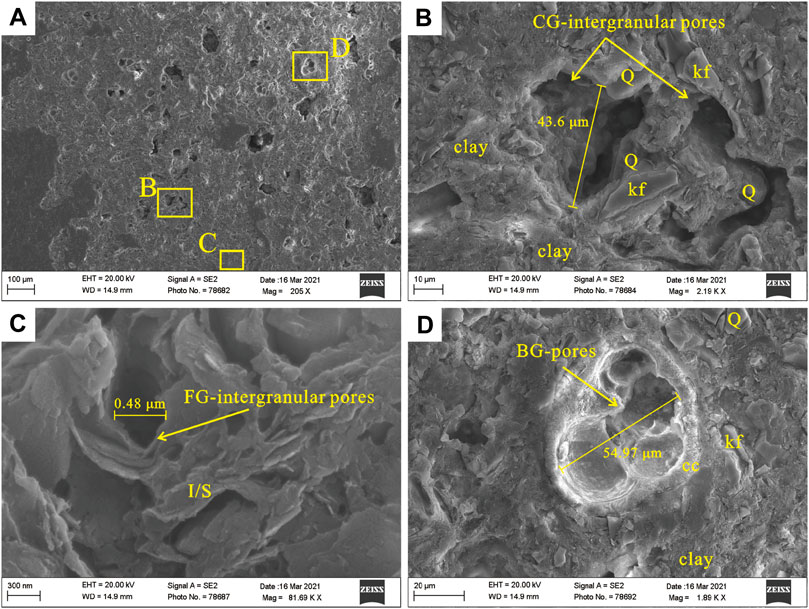
FIGURE 5. Pores structure characteristics in gas hydrate reservoir. (A) Site W19, 136.10 mbsf, SEM image; (B), (C), and (D) enlarge the yellow box in figure (A). Q, kf, cc, clay, and I/S are short for quartz, K-feldspar, calcite, clay minerals, and illite/semectite, respectively.
CG-intergranular pores occur between coarse grains such as quartz, feldspar, or foraminiferal fossils and have irregular pore shapes. They have pore sizes between 10 and 100 μm (Figure 5B). FG-intergranular pores occur between coarse grains, such as clay minerals. Their pore shape varies with the morphology of the clay mineral, while their pore size is typically less than 1 μm (Figure 5C). BG-pores consist of coeloms of foraminifera. Their pore shape is either spherical or ellipsoidal, while the pore size is commonly greater than 50 μm (Figure 5D).
The microstructural features of the sediments among the non-GH, I-, II-, and III-GHR layers were significantly different. In the non-GH layer, the CT scan showed that the sediment had massive structures with many FG-intergranular pores and a few CG-intergranular pores (Figures 6A–C). The BG-pores in the non-GH layer were specific, and many FG-intergranular pore aggregates showed spherical BG-pore shapes visible in CT scan images (Figures 6A–C). The SEM observations confirmed that the BG-pores were filled with other components (Figure 6D).
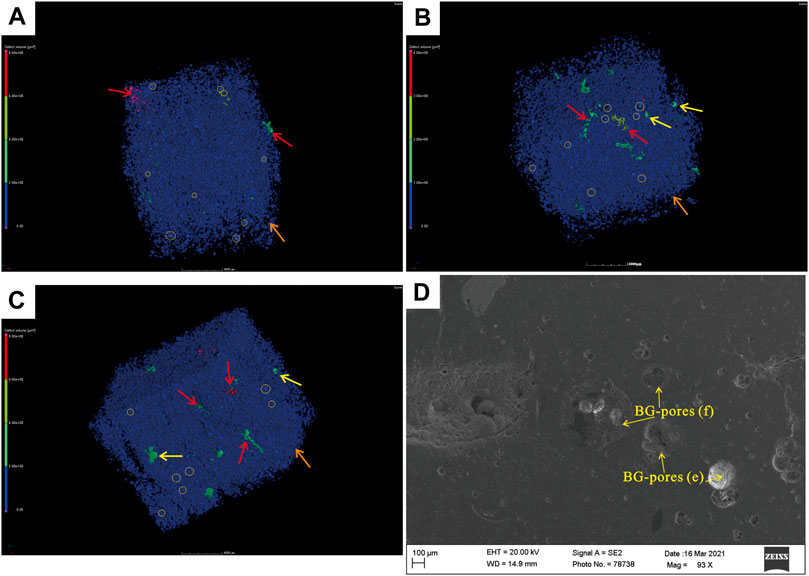
FIGURE 6. Microstructure of sediments in the non-GH layer. (A) Site W19, 126.60 mbsf, CT scan image; (B) Site W19, 127.80 mbsf, CT scan image; (C) Site W19, 130.15 mbsf, CT scan image; (D) Site W19, 126.60 mbsf, SEM image; red arrows indicate CG-intergranular pores, yellow arrows indicate empty BG-pores (e), orange arrows indicate FG-intergranular pores; yellow dotted circle indicate filled BG-pores (f).
In the I-GHR layer, the sediment microstructure was loose compared to the non-GH layer and had many CG-intergranular pores, BG-pores, and some FG-intergranular pores (Figures 7A, B). The SEM observations showed features similar to those observed in the CT scan (Figures 7C, D).
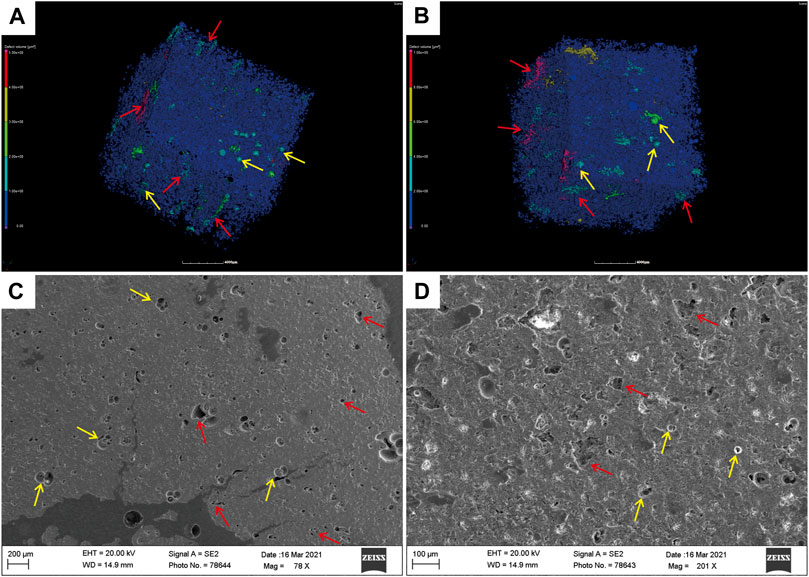
FIGURE 7. Microstructure of sediments in the Ⅰ-GHR layer. (A) Site W19, 137.60 mbsf, CT scan image; (B) Site W19, 138.60 mbsf, CT scan image; (C) Site W19, 130.70 mbsf, SEM image; (D) Site W19, 138.60 mbsf, SEM image; red arrows indicate CG-intergranular pores, yellow arrows indicate BG-pores.
In the III-GHR layer, CG-intergranular pores and BG-pores were rare, while there were few FG-intergranular pores (Figures 8A–C). However, the clay fraction content in the III-GHR layer was not significantly different from those in the non-GH and I-GHR layers (Figure 3). This indicates that the structure of the clay minerals in the III-GHR layer was different from that in the non-GH and I-GHR layers.
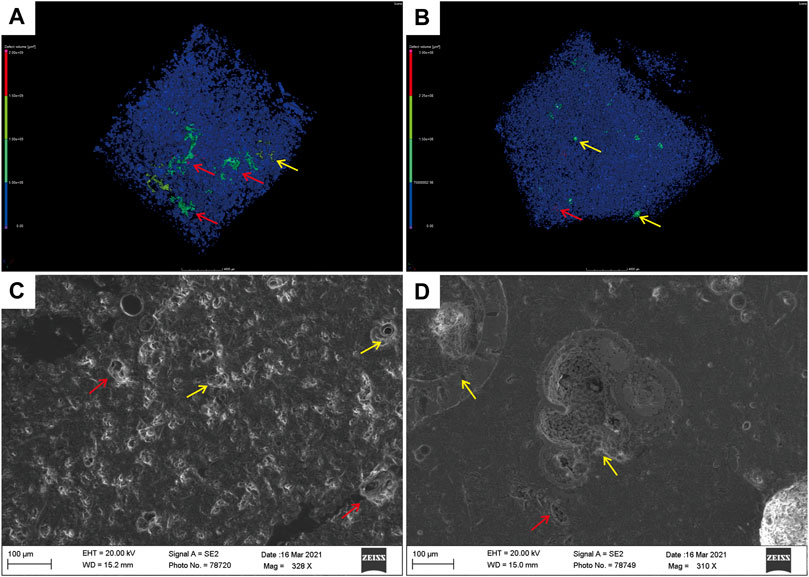
FIGURE 8. (A) Site W19, 146.35 mbsf, CT scan image; (B) Site W19, 156.55 mbsf, CT scan image; (C) Site W19, 146.35 mbsf, SEM image; (D) Site W19, 156.55 mbsf, SEM image; red arrows indicate CG-intergranular pores, yellow arrows indicate BG-pores.
In the II-GHR layer, some samples exhibited similar features to samples of the I-GHR layer (Figures 9A, C), while others exhibited similar features to those of the III-GHR layer (Figures 9B, D). Thus, the II-GHR layer acted as a transitional layer between the I-GHR and III-GHR layers, which is consistent with the wide range of gas hydrate saturation in the II-GHR layer (Figure 3).

FIGURE 9. (A) Site W19, 162.80 mbsf, CT scan image; (B) Site W19, 167.10 mbsf, CT scan image; (C) Site W19, 162.80 mbsf, SEM image; red arrows indicate CG-intergranular pores, yellow arrows indicate BG-pores.
Controlling Effects of Microstructure on Gas Hydrate Accumulation
The effect of the microstructure on gas hydrate accumulation is generally reflected in porosity and permeability (Jones et al., 2007; Klapp et al., 2010; Cai et al., 2020; Wang et al., 2020; Li et al., 2021). Previous studies have shown that large pores formed by coarser sediments are conducive to gas hydrate accumulation (Colwell et al., 2004; Boswell et al., 2009; Ito et al., 2015; Heeschen et al., 2016; Bian et al., 2020). The grain size of sediments does not affect the total porosity but may significantly affect the effective reservoir space and permeability (Wang et al., 2020). It may be difficult for extremely small pore spaces to form and accumulate gas hydrates owing to the migration ability of gas or pore water and capillary pressure (Brown and Ransom, 1996; Gamage et al., 2011; Li et al., 2021). Meanwhile, at the same porosity, more small pores lead to a significant decrease in sediment permeability (Brown and Ransom, 1996; Gamage et al., 2011; Oshima et al., 2019; Wu et al., 2020). Thus, a sediment layer with more CG-intergranular pores has more effective reservoir spaces and high permeability, which is beneficial for gas hydrate accumulation.
Many previous studies have shown that BG-pores consisting of foraminiferal coeloms can improve the quality of gas hydrate reservoirs, as foraminiferal coeloms are large and can thus provide additional effective reservoir space (Wang et al., 2011; Chen et al., 2013; Wang et al., 2014; Zhang et al., 2015; Li et al., 2019). In the I-, II-, and III-GHR layers, BG-pores gradually decreased, which is consistent with previous research results. However, according to Figure 3, the abundance of foraminifera was the highest in the non-GH layer, in contrast with previous research results. Meanwhile, BG-pore filling was verified both by SEM observations and CT scans (Figure 6 and Figure 10). The filling components were clay minerals and many calcareous ultramicrofossils (Figure 10). Calcareous ultramicrofossils have very small grain sizes (typically less than 2 μm) and clay fraction content. Thus, calcareous ultramicrofossils will reduce the effective reservoir space of the BG-pores and reduce the permeability of the sediment together with clay minerals.
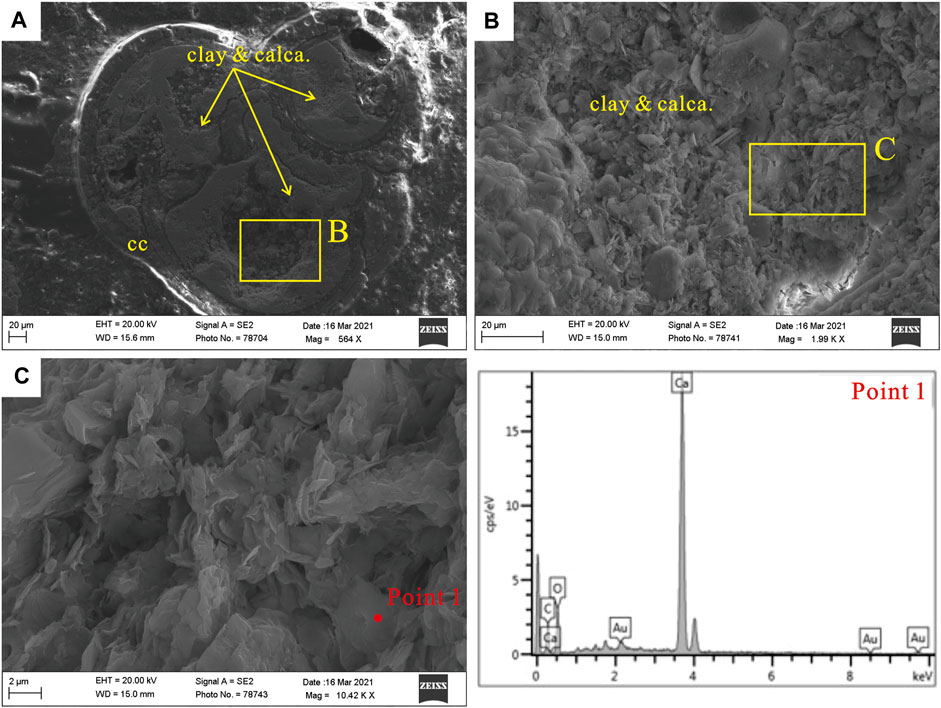
FIGURE 10. Calcareous ultra-microfossils and clay minerals fill foraminifera coeloms. (A) Site W19, 126.60 mbsf, SEM image; (B) enlarge the yellow box in figure (A); (C) enlarge the yellow box in figure (B); cc and calca. are short for calcite and calcareous ultra-microfossils, respectively.
The adsorption of methane by quartz and carbonates is significantly lower than that of clay minerals. The strong adsorption of methane by clay minerals is usually related to the complex structure and large SAA of clay minerals (Venaruzzo et al., 2002; Volzone et al., 2002; Ji et al., 2012). The SEM observations confirmed that the FG-intergranular pores were mainly clay minerals (Figure 5C). The microstructure of clay minerals controls the FG-intergranular pores. SSA is an effective parameter to characterize the microstructure of clay minerals (Dogan et al., 2006; Macht et al., 2011; Zhang Y. et al., 2019). Some studies have reported that the SSA is negatively correlated with gas hydrate saturation (Zhang et al., 2016; Zhang et al., 2017). The negative correlation between SSA and gas hydrate saturation may be determined by the clay mineral content and microstructure. The more complex microstructure of clay minerals leads to the formation of more FG-intergranular pores, affecting the permeability of sediment and the adsorption of free gas and pore water on sediments (Dogan et al., 2006; Gamage et al., 2011; Macht et al., 2011). The adsorption of free gas and pore water on sediments has potential significance for controlling gas hydrate formation. The weak adsorption capacity of sediments may make it difficult for free gas or pore water to remain in sediment and form gas hydrates. Conversely, the strong adsorption capacity of sediment may make it difficult for free gas or pore water to flow, thereby potentially acting as a sealing bed.
The in-situ porosity (calculated by LWD data) from the voyage report showed a sharp porosity drop in the I-GHR layer (Figure 3). The decreased porosity in the I-GHR layer is probably caused by gas hydrate enrichment. The porosity of the non-GH layer is not significantly higher than that of the underlying I-GHR layer. However, the abundance of the foraminifera in the non-GH layer is significantly higher than in the others. The high abundance of the foraminifera did not result in increased porosity. The saturation of gas hydrate in the non-GH layer is low (Figure 3) due to the BG-pores filling with calcareous ultramicrofossils and clay minerals. In the II- and III-GHR layers, the trend of porosity is consistent with that of gas hydrate saturation (Figure 3).
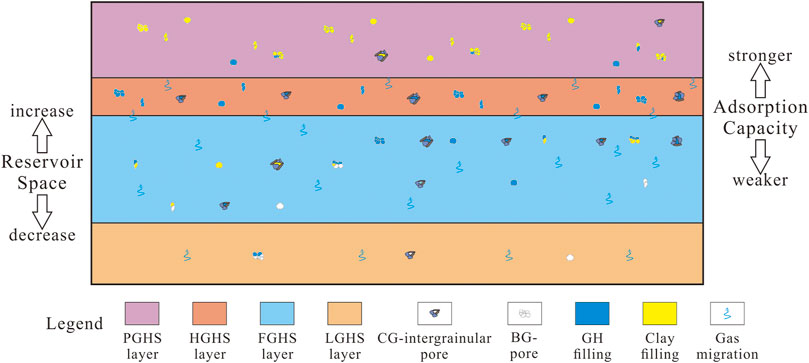
The CG-intergranular, FG-intergranular, and BG-pores were smaller in the III-GHR layer. The sediment in the III-GHR layer had low SSA. The reservoir space and adsorption capacity of the sediment were low and weak, respectively. After gas and water form and migrate to the III-GHR layer, it may be difficult to stay and no sufficient effective space to form the gas hydrate. The CT scan of samples shows FG-intergranular pores dominate the microstructure of the III-GHR layers (Table 4). The gas hydrate saturation of the CT scan samples in this layer is also very low (0.63–1.08%), indicating that the gas hydrate is not enriched. Hence, this layer may act as a gas migration channel (Figure 11). In the I-GHR layer, the sediments had many CG-intergranular pores and BG-pores (Table 4), indicating a more effective reservoir space and higher permeability (Figure 11). The CT scan samples’’ gas hydrate saturation in this layer is very high (58.48–62.89%). Thus, the gas hydrate had sufficient space and conditions to form and accumulate in the I-GHR layer. The II-GHR layer is a transition layer between the III- and I-GHR layers. The gas hydrate saturation of the CT scan samples in this layer (18.35–42.47%) is lower than in the I-GHR layer (Figure 3 and Table 4). Sediments with microstructural features similar to the I-GHR layer are favorable for gas hydrate accumulation, and those similar to the III-GHR layer are unfavorable for gas hydrate accumulation (Figure 11). Although many BG-pores in the non-GH layer were filled, CG-intergranular pores were rare, making it difficult to form an effective reservoir space (Figures 6, 10). Based on CT scan samples, the microstructure of sediments in the III-GHR layer is dominated by filled BG- and FG-intergranular pores (Table 4). The gas hydrate saturation of the CT scan samples in this layer is very low (1.45–3.41%). Meanwhile, the sediments in the non-GH layer had high SSA, which indicates that there were many FG-intergranular pores in the sediment, thereby leading to low permeability and strong adsorption of the sediments and making free gas or pore water migration difficult (Figure 11). The sediment in the I- and III-GHR layers had the same low SSA, indicating a weak adsorption capacity for free gas or pore water. However, the non-GH layer overlying the I-GHR layer had strong adsorption capacity and lacked an effective reservoir space. Thus, free gas and pore water may accumulate in the I–GHR layer and form gas hydrates (Figure 11).
Conclusion
Based on the variation in gas hydrate saturation, the study interval was divided into non-GH, I-, II-, and III-GHR layers. Based on the SEM observations and CT scans, the study interval had three types of pores: CG-intergranular pores, FG-intergranular pores, and BG-pores.
The microstructure of the non-GH layer was dominated by FG-intergranular pores and had many filled BG-pores. The CG-intergranular and BG-pores dominated the microstructure of the I-GHR layer. All types of pores in the study interval were rare in the III-GHR layer; while the II-GHR layer represented a transition between the I-GHR and III-GHR layers.
The CG-intergranular and BG-pores can provide effective reservoir space and increase the permeability of sediment, which is conducive to gas hydrate accumulation. The FG-intergranular pores reduce permeability and are not conducive to gas hydrate accumulation. Clay minerals and calcareous ultramicrofossils with small grain sizes and complex microstructures fill the effective reservoir space and reduce the permeability of sediment. Clay minerals and calcareous ultramicrofossils improve the adsorption capacity of sediment to free gas or pore water, which is not conducive to gas hydrate formation and accumulation.
The non-GH layer sediment has strong absorption capacity and few effective pores, which inhibit the upward migration of free gas or pore water. The underlying I-GHR layer has high permeability and a more effective reservoir space. The superposition of the non-GH and I-GHR layers was conducive to the formation and accumulation of gas hydrates.
Data Availability Statement
The original contributions presented in the study are included in the article/Supplementary Material, further inquiries can be directed to the corresponding author.
Author Contributions
CB: complete work including theoretical development, editing and writing of the manuscript. PS: complete work including theoretical development, filed support, and modifying of the manuscript. XS: theoretical development and modifying of the manuscript. JG: samples preparation and analysis. HC: filed support and biological data analysis. SH: modifying of the manuscript. GZ: modifying of the manuscript.
Funding
Foundation of Hubei Key Laboratory of Marine Geological Resources (No. MGR202002). This works was supported by China Geological Survey Project (No. DD20190224), Chinese Fundamental Research Funds for the Central Universities (No. 2652019079) and Foundation of Hubei Key Laboratory of Marine Geological Resources (No. MGR202002).
Conflict of Interest
The authors declare that the research was conducted in the absence of any commercial or financial relationships that could be construed as a potential conflict of interest.
Publisher’s Note
All claims expressed in this article are solely those of the authors and do not necessarily represent those of their affiliated organizations, or those of the publisher, the editors and the reviewers. Any product that may be evaluated in this article, or claim that may be made by its manufacturer, is not guaranteed or endorsed by the publisher.
Acknowledgments
We would like to thank the Guangzhou Marine Geological Survey (GMGS) for allowing the data of this research to be shared. We wish to thank all those who contributed to the China National Gas Hydrate Program Expedition 3.
References
Bai, C., Zhang, G., Lu, J. A., Liang, J., Yang, Z., Yan, W., et al. (2019). Deep-Water Sediment Waves as a Special Gas Hydrate Reservoirs in the Northeastern South China Sea. Mar. Pet. Geol. 101, 476–485. doi:10.1016/j.marpetgeo.2018.12.031
Bian, H., Xia, Y., Lu, C., Qin, X., Meng, Q., and Lu, H. (2020). Pore Structure Fractal Characterization and Permeability Simulation of Natural Gas Hydrate Reservoir Based on CT Images. Geofluids 2020, 1–9. doi:10.1155/2020/6934691
Bohrmann, G., Kuhs, W. F., Klapp, S. A., Techmer, K. S., Klein, H., Murshed, M. M., et al. (2007). Appearance and Preservation of Natural Gas Hydrate from Hydrate Ridge Sampled during ODP Leg 204 Drilling. Mar. Geol. 244, 1–14. doi:10.1016/j.margeo.2007.05.003
Boswell, R., and Collett, T. (2006). The Gas Hydrates Resource Pyramid: Fire in the Ice Newsletter. U.S. DOE - office of Fossil Energy, 5–7. Available at: https://www.researchgate.net/publication/240442367
Boswell, R., Frye, M., Shelander, D., Shedd, W., McConnell, D. R., and Cook, A. (2012). Architecture of Gas-Hydrate-Bearing Sands from Walker Ridge 313, Green Canyon 955, and Alaminos Canyon 21: Northern Deepwater Gulf of Mexico. Mar. Petroleum Geol. 34, 134–149. doi:10.1016/j.marpetgeo.2011.08.010
Boswell, R., Myshakin, E., Moridis, G., Konno, Y., Collett, T. S., Reagan, M., et al. (2019). India National Gas Hydrate Program Expedition 02 Summary of Scientific Results: Numerical Simulation of Reservoir Response to Depressurization. Mar. Petroleum Geol. 108, 154–166. doi:10.1016/j.marpetgeo.2018.09.026
Boswell, R., Shelander, D., Lee, M., Latham, T., Collett, T., Guerin, G., et al. (2009). Occurrence of Gas Hydrate in Oligocene Frio Sand: Alaminos Canyon Block 818: Northern Gulf of Mexico. Mar. Petroleum Geol. 26, 1499–1512. doi:10.1016/j.marpetgeo.2009.03.005
Brown, K. M., and Ransom, B. (1996). Porosity Corrections for Smectite-Rich Sediments: Impact on Studies of Compaction, Fluid Generation, and Tectonic History. Geology 24, 843. doi:10.1130/0091-7613(1996)024<0843:pcfsrs>2.3.co;2
Brunauer, S., Emmett, P. H., and Teller, E. (1938). Adsorption of Gases in Multimolecular Layers. J. Am. Chem. Soc. 60, 309–319. doi:10.1021/ja01269a023
Cai, J., Xia, Y., Lu, C., Bian, H., and Zou, S. (2020). Creeping Microstructure and Fractal Permeability Model of Natural Gas Hydrate Reservoir. Mar. Petroleum Geol. 115, 104282. doi:10.1016/j.marpetgeo.2020.104282
Chand, S., Minshull, T. A., Gei, D., and Carcione, J. M. (2004). Elastic Velocity Models for Gas-Hydrate-Bearing Sediments-A Comparison. Geophys. J. Int. 159, 573–590. doi:10.1111/j.1365-246X.2004.02387.x
Chen, F., Su, X., Lu, H., Zhou, Y., and Zhuang, C. (2013). Relations between Biogenic Component (Foraminifera) and Highly Saturated Gas Hydrates Distribution from Shenhu Area, Northern South China Sea. Earth Sci. 38, 907–915. (in Chinese with English abstract). doi:10.3799/dqkx.2013.089
Collett, T. S. (2002). Energy Resource Potential of Natural Gas Hydrates. Bulletin 86, 1971–1992. doi:10.1306/61EEDDD2-173E-11D7-8645000102C1865D
Collett, T. S., Lee, M. W., Zyrianova, M. V., Mrozewski, S. A., Guerin, G., Cook, A. E., et al. (2012). Gulf of Mexico Gas Hydrate Joint Industry Project Leg II Logging-While-Drilling Data Acquisition and Analysis. Mar. Petroleum Geol. 34, 41–61. doi:10.1016/j.marpetgeo.2011.08.003
Colwell, F., Matsumoto, R., and Reed, D. (2004). A Review of the Gas Hydrates, Geology, and Biology of the Nankai Trough. Chem. Geol. 205, 391–404. doi:10.1016/j.chemgeo.2003.12.023
Dogan, A. U., Dogan, M., Onal, M., Sarikaya, Y., Aburub, A., and Wurster, D. E. (2006). Baseline Studies of the Clay Minerals Society Source Clays: Specific Surface Area by the Brunauer Emmett Teller (BET) Method. Clays Clay Min. 54, 62–66. doi:10.1346/CCMN.2006.0540108
Dvorkin, J., Prasad, M., Sakai, A., and Lavoie, D. (1999). Elasticity of Marine Sediments: Rock Physics Modeling. Geophys. Res. Lett. 26, 1781–1784. doi:10.1029/1999GL900332
Gamage, K., Screaton, E., Bekins, B., and Aiello, I. (2011). Permeability-Porosity Relationships of Subduction Zone Sediments. Mar. Geol. 279, 19–36. doi:10.1016/j.margeo.2010.10.010
Ghosh, R., and Ojha, M. (2021). Amount of Gas Hydrate Estimated from Rock Physics Analysis Based on Morphology and Intrinsic Anisotropy in Area B, Krishna Godavari Offshore Basin, Expedition NGHP-02. Mar. Petroleum Geol. 124, 104856. doi:10.1016/j.marpetgeo.2020.104856
Haines, S. S., Hart, P. E., Collett, T. S., Shedd, W., Frye, M., Weimer, P., et al. (2017). High-Resolution Seismic Characterization of the Gas and Gas Hydrate System at Green Canyon 955, Gulf of Mexico, USA. Mar. Petroleum Geol. 82, 220–237. doi:10.1016/j.marpetgeo.2017.01.029
Heeschen, K. U., Schicks, J. M., and Oeltzschner, G. (2016). The Promoting Effect of Natural Sand on Methane Hydrate Formation: Grain Sizes and Mineral Composition. Fuel 181, 139–147. doi:10.1016/j.fuel.2016.04.017
Ito, T., Komatsu, Y., Fujii, T., Suzuki, K., Egawa, K., Nakatsuka, Y., et al. (2015). Lithological Features of Hydrate-Bearing Sediments and Their Relationship with Gas Hydrate Saturation in the Eastern Nankai Trough, Japan. Mar. Petroleum Geol. 66, 368–378. doi:10.1016/j.marpetgeo.2015.02.022
Ji, L., Zhang, T., Milliken, K. L., Qu, J., and Zhang, X. (2012). Experimental Investigation of Main Controls to Methane Adsorption in Clay-Rich Rocks. Appl. Geochem. 27, 2533–2545. doi:10.1016/j.apgeochem.2012.08.027
Jones, K. W., Kerkar, P. B., Mahajan, D., Lindquist, W. B., and Feng, H. (2007). Microstructure of Natural Hydrate Host Sediments. Nucl. Instrum. Methods Phys. Res. Sect. B Beam Interact. Mater. Atoms 261, 504–507. doi:10.1016/j.nimb.2007.03.032
Kang, D., Lu, J. a., Zhang, Z., Liang, J., Kuang, Z., Lu, C., et al. (2020). Fine-Grained Gas Hydrate Reservoir Properties Estimated from Well Logs and Lab Measurements at the Shenhu Gas Hydrate Production Test Site, the Northern Slope of the South China Sea. Mar. Petroleum Geol. 122, 104676. doi:10.1016/j.marpetgeo.2020.104676
Klapp, S. A., Bohrmann, G., Kuhs, W. F., Mangir Murshed, M., Pape, T., Klein, H., et al. (2010). Microstructures of Structure I and II Gas Hydrates from the Gulf of Mexico. Mar. Petroleum Geol. 27, 116–125. doi:10.1016/j.marpetgeo.2009.03.004
Koh, C. A., Sum, A. K., and Sloan, E. D. (2012). State of the Art: Natural Gas Hydrates as a Natural Resource. J. Nat. Gas Sci. Eng. 8, 132–138. doi:10.1016/j.jngse.2012.01.005
Lee, J.-S., Lee, J. Y., Kim, Y. M., and Lee, C. (2013). Stress-Dependent and Strength Properties of Gas Hydrate-Bearing Marine Sediments from the Ulleung Basin, East Sea, Korea. Mar. Petroleum Geol. 47, 66–76. doi:10.1016/j.marpetgeo.2013.04.006
Li, J.-F., Ye, J., Ye, J.-L., Qin, X.-W., Qiu, H.-J., Wu, N.-Y., et al. (2018). The First Offshore Natural Gas Hydrate Production Test in South China Sea. China Geol. 1, 5–16. doi:10.31035/cg2018003
Li, J., Lu, J. a., Kang, D., Ning, F., Lu, H., Kuang, Z., et al. (2019). Lithological Characteristics and Hydrocarbon Gas Sources of Gas Hydrate-Bearing Sediments in the Shenhu Area, South China Sea: Implications from the W01B and W02B Sites. Mar. Geol. 408, 36–47. doi:10.1016/j.margeo.2018.10.013
Li, X. S., Zhou, Q. J., Su, T. Y., Liu, L. J., Gao, S., and Zhou, S. W. (2016). Slope-Confined Submarine Canyons in the Baiyun Deep-Water Area, Northern South China Sea: Variation in Their Modern Morphology. Mar. Geophys Res. 37, 95–112. doi:10.1007/s11001-016-9269-0
Li, Y., Song, X., Wu, P., Sun, X., and Song, Y. (2021). Consolidation Deformation of Hydrate-Bearing Sediments: A Pore-Scale Computed Tomography Investigation. J. Nat. Gas Sci. Eng. 95, 104184. doi:10.1016/j.jngse.2021.104184
Liang, J., Zhang, G., Lu, J., Su, P., Sha, Z., Gong, Y., et al. (2016). Accumulation Characteristics and Genetic Models of Natural Gas Hydrate Reservoirs in the NE Slope of the South China Sea. Nat. Gas. Ind. 36, 157–162. (in Chinese with English abstract). doi:10.3787/j.issn.1000-0976.2016.10.020
Liang, J., Zhang, W., Lu, J. a., Wei, J., Kuang, Z., and He, Y. (2019). Geological Occurrence and Accumulation Mechanism of Natural Gas Hydrates in the Eastern Qiongdongnan Basin of the South China Sea: Insights from Site GMGS5-W9-2018. Mar. Geol. 418, 106042. doi:10.1016/j.margeo.2019.106042
Liu, C., Ye, Y., Meng, Q., He, X., Lu, H., Zhang, J., et al. (2012). The Characteristics of Gas Hydrates Recovered from Shenhu Area in the South China Sea. Mar. Geol. 307-310, 22–27. doi:10.1016/j.margeo.2012.03.004
Lu, S., and McMechan, G. A. (2002). Estimation of Gas Hydrate and Free Gas Saturation, Concentration, and Distribution from Seismic Data. Geophysics 67, 582–593. doi:10.1190/1.1468619
Macht, F., Eusterhues, K., Pronk, G. J., and Totsche, K. U. (2011). Specific Surface Area of Clay Minerals: Comparison between Atomic Force Microscopy Measurements and Bulk-Gas (N2) and -liquid (EGME) Adsorption Methods. Appl. Clay Sci. 53, 20–26. doi:10.1016/j.clay.2011.04.006
Malagar, B. R. C., Lijith, K. P., and Singh, D. N. (2019). Formation & Dissociation of Methane Gas Hydrates in Sediments: A Critical Review. J. Nat. Gas Sci. Eng. 65, 168–184. doi:10.1016/j.jngse.2019.03.005
Oshima, M., Suzuki, K., Yoneda, J., Kato, A., Kida, M., Konno, Y., et al. (2019). Lithological Properties of Natural Gas Hydrate-Bearing Sediments in Pressure-Cores Recovered from the Krishna-Godavari Basin. Mar. Petroleum Geol. 108, 439–470. doi:10.1016/j.marpetgeo.2019.01.015
Pohlman, J. W., Kaneko, M., Heuer, V. B., Coffin, R. B., and Whiticar, M. (2009). Methane Sources and Production in the Northern Cascadia Margin Gas Hydrate System. Earth Planet. Sci. Lett. 287, 504–512. doi:10.1016/j.epsl.2009.08.037
Popescu, I., De Batist, M., Lericolais, G., Nouzé, H., Poort, J., Panin, N., et al. (2006). Multiple Bottom-Simulating Reflections in the Black Sea: Potential Proxies of Past Climate Conditions. Mar. Geol. 227, 163–176. doi:10.1016/j.margeo.2005.12.006
Qian, J., Wang, X., Collett, T. S., Guo, Y., Kang, D., and Jin, J. (2018). Downhole Log Evidence for the Coexistence of Structure II Gas Hydrate and Free Gas below the Bottom Simulating Reflector in the South China Sea. Mar. Petroleum Geol. 98, 662–674. doi:10.1016/j.marpetgeo.2018.09.024
Qin, X., Liang, Q., Ye, J., Yang, L., Qiu, H., Xie, W., et al. (2020). The Response of Temperature and Pressure of Hydrate Reservoirs in the First Gas Hydrate Production Test in South China Sea. Appl. Energy 278, 115649. doi:10.1016/j.apenergy.2020.115649
Ryu, B.-J., Collett, T. S., Riedel, M., Kim, G. Y., Chun, J.-H., Bahk, J.-J., et al. (2013). Scientific Results of the Second Gas Hydrate Drilling Expedition in the Ulleung Basin (UBGH2). Mar. Petroleum Geol. 47, 1–20. doi:10.1016/j.marpetgeo.2013.07.007
Shao, L., Li, X., Geng, J., Pang, X., Lei, Y., Qiao, P., et al. (2007). Deep Water Bottom Current Deposition in the Northern South China Sea. Sci. China Ser. D. 50, 1060–1066. doi:10.1007/s11430-007-0015-y
Su, M., Luo, K., Fang, Y., Kuang, Z., Yang, C., Liang, J., et al. (2021). Grain-Size Characteristics of Fine-Grained Sediments and Association with Gas Hydrate Saturation in Shenhu Area, Northern South China Sea. Ore Geol. Rev. 129, 103889. doi:10.1016/j.oregeorev.2020.103889
Su, M., Sha, Z., Zhang, C., Wang, H., Wu, N., Yang, R., et al. (2017). Types, Characteristics and Significances of Migrating Pathways of Gas-bearing Fluids in the Shenhu Area, Northern Continental Slope of the South China Sea. Acta Geol. Sin. 91, 219–231. doi:10.1111/1755-6724.13073
Su, M., Yang, R., Wang, H., Sha, Z., Liang, J., Wu, N., et al. (2016). Gas Hydrates Distribution in the Shenhu Area, Northern South China Sea: Comparisons between the Eight Drilling Sites with Gas-Hydrate Petroleum System. Geol. Acta 14, 79–100. doi:10.1344/GeologicaActa2016.14.2.1
Tréhu, A., Ruppel, C., Holland, M., Dickens, G., Torres, M., Collett, T., et al. (2006). Gas Hydrates in Marine Sediments: Lessons from Scientific Ocean Drilling. Oceanography 19, 124–142. doi:10.5670/oceanog.2006.11
Venaruzzo, J. L., Volzone, C., Rueda, M. L., and Ortiga, J. (2002). Modified Bentonitic Clay Minerals as Adsorbents of CO, CO2 and SO2 Gases. Microporous Mesoporous Mater. 56, 73–80. doi:10.1016/S1387-1811(02)00443-2
Volzone, C., Rinaldi, J. O., and Ortiga, J. (2002). N2 and CO2 Adsorption by TMA- and HDP-Montmorillonites. Mat. Res. 5, 475–479. doi:10.1590/S1516-14392002000400013
Waite, W. F., Jang, J., Collett, T. S., and Kumar, P. (2019). Downhole Physical Property-Based Description of a Gas Hydrate Petroleum System in NGHP-02 Area C: A Channel, Levee, Fan Complex in the Krishna-Godavari Basin Offshore Eastern India. Mar. Petroleum Geol. 108, 272–295. doi:10.1016/j.marpetgeo.2018.05.021
Wang, J., Zhang, L., Ge, K., Zhao, J., and Song, Y. (2020). Characterizing Anisotropy Changes in the Permeability of Hydrate Sediment. Energy 205, 117997. doi:10.1016/j.energy.2020.117997
Wang, X., Collett, T. S., Lee, M. W., Yang, S., Guo, Y., and Wu, S. (2014). Geological Controls on the Occurrence of Gas Hydrate from Core, Downhole Log, and Seismic Data in the Shenhu Area, South China Sea. Mar. Geol. 357, 272–292. doi:10.1016/j.margeo.2014.09.040
Wang, X., Hutchinson, D. R., Wu, S., Yang, S., and Guo, Y. (2011). Elevated Gas Hydrate Saturation within Silt and Silty Clay Sediments in the Shenhu Area, South China Sea. J. Geophys. Res. 116, B05102. doi:10.1029/2010JB007944
Wu, P., Li, Y., Liu, W., Liu, Y., Wang, D., and Song, Y. (2020). Microstructure Evolution of Hydrate‐Bearing Sands during Thermal Dissociation and Ensued Impacts on the Mechanical and Seepage Characteristics. J. Geophys. Res. Solid Earth 125, e2019JB019103. doi:10.1029/2019JB019103
Wu, S., Wang, X., Wong, H. K., and Zhang, G. (2007). Low-Amplitude BSRs and Gas Hydrate Concentration on the Northern Margin of the South China Sea. Mar. Geophys Res. 28, 127–138. doi:10.1007/s11001-007-9020-y
Yang, C., Lu, K., Liang, J., Lin, Z., Zhang, B., Liu, F., et al. (2020). Control Effect of Shallow-Burial Deepwater Deposits on Natural Gas Hydrate Accumulation in the Shenhu Sea Area of the Northern South China Sea. Nat. Gas. Ind. 40, 68–76. (in Chinese with English abstract). doi:10.3787/j.issn.1000-0976.2020.08.005
Yang, J., Wang, X., Jin, J., Li, Y., Li, J., Qian, J., et al. (2017). The Role of Fluid Migration in the Occurrence of Shallow Gas and Gas Hydrates in the South of the Pearl River Mouth Basin, South China Sea. Interpretation 5, SM1–SM11. doi:10.1190/INT-2016-0197.1
Yang, S., Liang, J., Lu, J., Qu, W., and Liu, B. (2017). New Understanding on the Characteristics and Controlling Factors of Gas Hydrate Reservoirs in the Shenhu Area on the Northern Slope of the South China Sea. Earth Sci. Front. 24 (4), 1–14. (in Chinese with English abstract). doi:10.13745/j.esf.yx.2016-12-43
Ye, J., Wei, J., Liang, J., Lu, J., Lu, H., and Zhang, W. (2019). Complex Gas Hydrate System in a Gas Chimney, South China Sea. Mar. Petroleum Geol. 104, 29–39. doi:10.1016/j.marpetgeo.2019.03.023
Yi, B. Y., Lee, G. H., Kang, N. K., Yoo, D. G., and Lee, J. Y. (2018). Deterministic Estimation of Gas-Hydrate Resource Volume in a Small Area of the Ulleung Basin, East Sea (Japan Sea) from Rock Physics Modeling and Pre-Stack Inversion. Mar. Petroleum Geol. 92, 597–608. doi:10.1016/j.marpetgeo.2017.11.023
Zhang, G., Liang, J., Lu, J. a., Yang, S., Zhang, M., Holland, M., et al. (2015). Geological Features, Controlling Factors and Potential Prospects of the Gas Hydrate Occurrence in the East Part of the Pearl River Mouth Basin, South China Sea. Mar. Petroleum Geol. 67, 356–367. doi:10.1016/j.marpetgeo.2015.05.021
Zhang, H., Lu, H., Liang, J., and Wu, N. (2016). The Methane Hydrate Accumulation Controlled Compellingly by Sediment Grain at Shenhu, Northern South China Sea. Chin. Sci. Bull. 61, 388–397. (in Chinese with English abstract). doi:10.1360/N972014-01395
Zhang, W., Liang, J., Lu, J. A., Wei, J., Su, P., Fang, Y., et al. (2017). Accumulation Features and Mechanisms of High Saturation Natural Gas Hydrate in Shenhu Area, Northern South China Sea. Petroleum Explor. Dev. 44, 708–719. doi:10.1016/S1876-3804(17)30082-4
Zhang, W., Liang, J., Wei, J., Lu, J. A., Su, P., Lin, L., et al. (2020). Geological and Geophysical Features of and Controls on Occurrence and Accumulation of Gas Hydrates in the First Offshore Gas-Hydrate Production Test Region in the Shenhu Area, Northern South China Sea. Mar. Petroleum Geol. 114, 104191. doi:10.1016/j.marpetgeo.2019.104191
Zhang, W., Liang, J., Wei, J., Su, P., Lin, L., and Huang, W. (2019a). Origin of Natural Gases and Associated Gas Hydrates in the Shenhu Area, Northern South China Sea: Results from the China Gas Hydrate Drilling Expeditions. J. Asian Earth Sci. 183, 103953. doi:10.1016/j.jseaes.2019.103953
Keywords: sediments microstructure, gas hydrate reservoir, gas hydrate accumulation, shenhu area, south China sea
Citation: Bai C, Su P, Su X, Guo J, Cui H, Han S and Zhang G (2022) Sediment Microstructure in Gas Hydrate Reservoirs and its Association With Gas Hydrate Accumulation: A Case Study From the Northern South China Sea. Front. Earth Sci. 10:876134. doi: 10.3389/feart.2022.876134
Received: 15 February 2022; Accepted: 19 April 2022;
Published: 03 May 2022.
Edited by:
Alessandra Savini, University of Milano-Bicocca, ItalyReviewed by:
Qing Li, Qingdao Institute of Marine Geology (QIMG), ChinaZhilei Sun, Qingdao Institute of Marine Geology (QIMG), China
Copyright © 2022 Bai, Su, Su, Guo, Cui, Han and Zhang. This is an open-access article distributed under the terms of the Creative Commons Attribution License (CC BY). The use, distribution or reproduction in other forums is permitted, provided the original author(s) and the copyright owner(s) are credited and that the original publication in this journal is cited, in accordance with accepted academic practice. No use, distribution or reproduction is permitted which does not comply with these terms.
*Correspondence: Pibo Su, c3BiXzUyNUBzaW5hLmNvbQ==
 Chenyang Bai
 Pibo Su
 Xin Su
 Jujie Guo6
 Shujun Han

