 Xuan Lyu
 Zhifei Liu
 Qiong Wu
 Christophe Colin3
 Xun Yu
95% of researchers rate our articles as excellent or good
Learn more about the work of our research integrity team to safeguard the quality of each article we publish.
Find out more
ORIGINAL RESEARCH article
Front. Earth Sci. , 27 April 2022
Sec. Marine Geoscience
Volume 10 - 2022 | https://doi.org/10.3389/feart.2022.875292
This article is part of the Research Topic Sedimentation on the Continental Margins: From Modern Processes to Deep-Time Records View all 28 articles
The International Ocean Discovery Program (IODP) Expedition 349 recovered Miocene oceanic red beds overlying the basaltic basement in the South China Sea. The occurrence of oceanic red beds provides an opportunity to understand the deep-sea redox conditions when the South China Sea was open to the western Pacific during the Miocene. Here, we investigated iron oxide mineral contents along with major element compositions of the oceanic red beds at Site U1433 to reveal the Miocene deep-sea oxidation environment of the South China Sea and its interaction with the western Pacific. The results show that these samples contain 0.20–1.48% hematite (average 0.50%) and 0.30–2.98% goethite (average 1.20%). Their contents have good linear correlations with color reflectance a* (red) and b* (yellow), respectively, implying that the reddish-brown color of the Miocene oceanic red beds resulted from a mixture of hematite and goethite. Compared to other oceanic red beds worldwide, the occurrence of hematite and goethite in the South China Sea is considered to form under an oxic bottom water environment with an extremely low sedimentation rate. The (hematite + goethite)/(100%—Al2O3) ratio is adopted to reconstruct the evolution of bottom water oxidation during the Early–Middle Miocene. A continuously decreased oxidation trend from 18.4 to 11.6 Ma, along with two strengthened oxidation events occurring at around 15 Ma and 14 Ma, is observed to dominate the environment evolution of the abyssal South China Sea. We infer that this long-term decreased oxidation trend was caused by the gradual blocking of oxygen-rich bottom water from the western Pacific since the Early Miocene, while the two oxidation events were likely attributed to the rapid thermal subsidence of the South China Sea and the global cooling during the Middle Miocene climate transition, respectively.
Oceanic red beds are marine sedimentary layers that are predominantly red in color and deposited in pelagic or hemipelagic deep-water environment (Franke and Paul, 1980; Wang et al., 2009). The oceanic red beds usually stand for oxic and oligotrophic deep-water conditions and therefore have been used to trace paleoenvironment and paleoclimate evolution since the 1970s (Walker, 1967; Wang et al., 2004; Hu et al., 2005; Wang et al., 2005). Oceanic red beds are common in global oceans and widespread throughout the geological history from the middle Ediacaran to the whole Phanerozoic (Song et al., 2017). Previous investigations mainly focus on the Cretaceous oceanic red beds, and there are few studies on the Cenozoic oceanic red beds. Due to the change in the sedimentary environment, it is difficult to analogize the origins of the Cretaceous oceanic red beds to those of the Cenozoic directly. In addition, earlier studies emphasized an oxidation environment in which oceanic red beds were produced, although the mechanism to form red color in oceanic red beds remains uncertain (Cai et al., 2012; Hu et al., 2012). Therefore, it is necessary to carry out relevant studies on the Cenozoic oceanic red beds.
Trace element geochemistry and iron oxide mineralogy are common and effective tools to characterize the sedimentary conditions and formation mechanism of oceanic red beds (Jamal et al., 2017). However, trace elements are easily affected by numerous factors, for example, salinity, pH, temperature, and hydrothermal inputs (Li et al., 2011; Neuhuber and Wagreich, 2011; Hu et al., 2012). In comparison, iron oxide mineralogy is less affected by these external factors. Even so, contents of iron oxide minerals (mainly hematite and goethite) are difficult to be determined quantitatively in marine sediments due to their low levels and similar mineralogical features. X-ray diffraction (XRD) was usually used to identify the mineral contents. However, the detection limit of XRD for minerals is ∼1% (Deaton and Balsam, 1991). As a result, XRD is not suitable for measuring the contents of iron oxide minerals as hematite and goethite commonly occur at levels less than 1% in marine sediments. Although Mossbauer spectrometry can also be used to detect the contents of hematite and goethite, it only gives the relative proportion of Fe phases, and the analysis is time-consuming (Walden et al., 2000; Ji et al., 2002). In addition, magnetic proxies for the hematite content are also considered because of the magnetization of hematite, while the weak magnetization of hematite and often significant superparamagnetic nanoparticle concentrations make quantification difficult (Roberts et al., 2020). Despite all these, diffuse reflectance spectroscopy (DRS) is capable of detecting and quantifying iron oxide minerals in sediments with analytical levels as low as ∼0.01% (Scheinost et al., 1998; Scheinost and Schwertmann, 1999; Ji et al., 2002). Furthermore, Li et al. (2011) successfully quantified the contents of iron oxide minerals for the oceanic red beds by using the DRS method. Therefore, the DRS method potentially provides an opportunity to achieve the composition of iron oxide minerals with high accuracy to understand the formation of oceanic red beds. Percent reflectance spectrums at different bands and derivatives (first and second derivatives) of DRS all have been used for the quantitative determination of hematite and goethite (Deaton and Balsam, 1991; Scheinost et al., 1998; Ji et al., 2002). In derivative plots, the characteristic peaks (435 and 535 nm) of goethite may be masked by hematite (about 565 nm) and minerals (440 nm) (e.g., illite and chlorite) (Balsam and Damuth, 2000; Ji et al., 2006). Also the heights of peaks in derivative plots for different minerals do not mean the difference in content as they can be affected by the matrix effect during analysis (Ji et al., 2002). Considering the aforementioned two reasons, we chose using the percent reflectance spectrums at different bands to calculate hematite and goethite contents in this study.
The lower–middle Miocene oceanic red beds were first recovered in the South China Sea (SCS) during the International Ocean Discovery Program (IODP) Expedition 349, especially at Site U1433, where the most continuous sedimentary record has been well preserved (Figure 1A). Onboard preliminary investigation suggested that the oceanic red beds at Site U1433 are reminiscent of the deep-water red clays in the central Pacific, but the exact mechanism of formation needs further study (Li et al., 2015). The Miocene oceanic red beds are considered the only sedimentary record in the abyssal basin of the SCS during the Early–Middle Miocene. Early studies of Miocene sediments in the SCS were few and conducted mainly on the northern continental slope (Wan et al., 2007; Liu et al., 2013). There was lack of deep-sea drilling holes in the central basin. As the largest marginal sea in the western Pacific, the deep-water mass of the SCS is always from the Pacific (Tian et al., 2006). In particular, the SCS was directly connected to the western Pacific in the Miocene (Hall, 2002). Thus, although the study area certainly has local characteristics, the results reflect the scenario of the western Pacific in the Miocene.
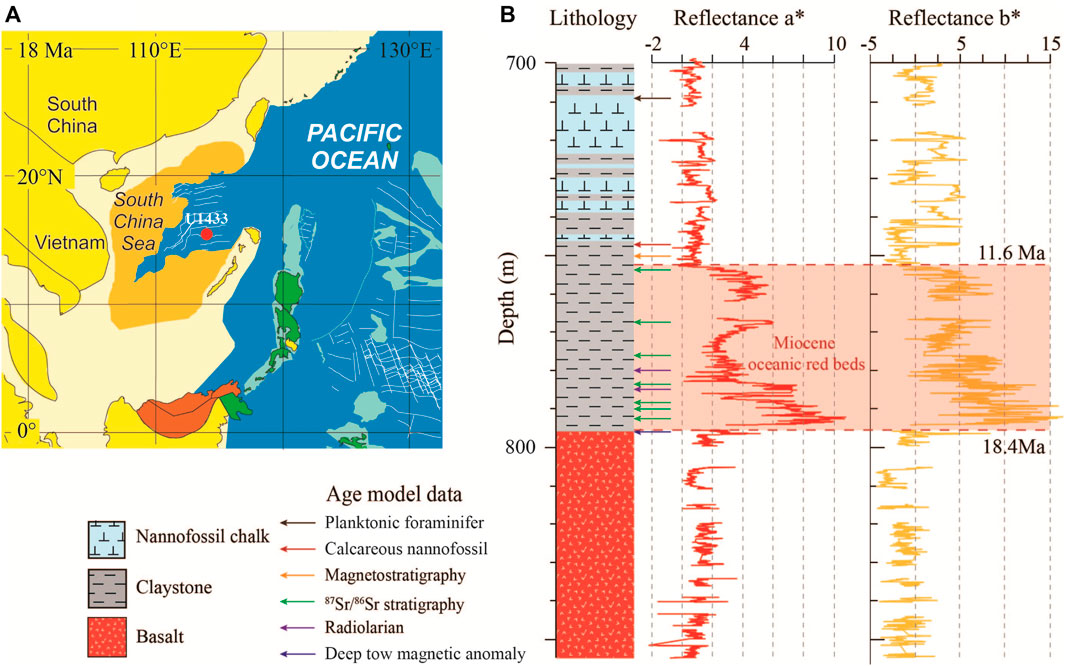
FIGURE 1. Early Miocene paleogeographic map of the South China Sea (SCS) and development of the Miocene oceanic red beds at IODP Site U1433. (A) Reconstructed SCS paleogeographic map at 18 Ma (Hall, 2002) showing the location of Site U1433 (red dot). (B) Lithology and color reflectances a* (red) and b* (yellow) (10-point running average) of the lower part of Site U1433 (data from Li et al., 2015). Shaded area represents the Miocene oceanic red beds, spanning from 18.4 to 11.6 Ma.
In this study, we used the DRS method to quantitatively determine the contents of hematite and goethite of the oceanic red beds at Site U1433. Major elemental compositions were also analyzed together to study the deep-sea oxidation environment evolution of the SCS during the period when the Miocene oceanic red beds developed. This is the first study to report the identification and composition of hematite and goethite in the Miocene oceanic red beds of the world’s oceans and then to discuss their application on the evolution history of deep-sea oxidation of the western Pacific. Therefore, we highlight that the deep-sea oxidation history recorded from iron oxide minerals in the Miocene oceanic red beds in this study is of regional or global Miocene evolutionary scientific significance.
Site U1433 (12°55.13′N, 115°2.85′E, water depth 4379 m) is located in the abyssal basin of the SCS (Figure 1A). The site was drilled 857.48 m deep below the seafloor during the IODP Expedition 349 in 2014 (Li et al., 2015). The lithology consists of the upper sediment unit (0–796.67 m) and the lower basalt basement (796.67–857.48 m). The Miocene oceanic red beds lie directly above the oceanic basalt at a depth range of 754.18–796.67 m, with a total thickness of 42.49 m (Figure 1B). They are composed of reddish-brown (reflectance a* >2) clay stone and clay stone with minimal millimeter-scale silt intervals. A total of 96 samples from the red beds were collected at an interval of ∼50 cm (equivalent to 80 ka temporal resolution) for this study. All samples were analyzed for iron oxide mineralogy and major element geochemistry. Seven of these samples were selected, most from the oceanic red bed section for picking fossil fish teeth for 87Sr/86Sr stratigraphy construction.
87Sr/86Sr of fossil fish teeth were measured by using a Thermo Scientific NeptunePlus Multicollector Inductively Coupled Plasma Mass Spectrometer (MC-ICP-MS) at the Laboratoire des Sciences du Climat et de l’Environnement (LSCE) in Gif-sur-Yvette, following the method described by Colin et al. (2014). For each sample, 30 mg fish teeth/debris with sizes larger than 150 μm were handpicked under a binocular microscope. All the fossil fish teeth were then ultrasonicated for 1 min 3 times in ultrapure water. The cleaned fish teeth were dissolved in 6 N HCl. The sample solution was then loaded into a column filled with AG50-X8 cation resin. The Sr fraction was de-trapped from the column using 2N HCl. Then, the Sr fraction was purified on a 20-μl SrSpec® column consisting of a polyethylene syringe with a 4-mm ∅ Millex® filter. During the analytical sessions, every two samples were bracketed with analyses of appropriate Sr standard solution NIST SRM987 (87Sr/86Sr≈0.710250 ± 000,016) (Lugmair et al., 1983). Sample and standard concentrations were matched at 25 ppb. The Sr and Nd isotope ratios were corrected from mass bias according to the exponential law relative to 84Sr/86Sr = 0.1194. The analytical error for each sample analysis was taken as the external reproducibility of the NIST SRM987 standard unless the internal error was larger.
Iron oxide minerals were quantitatively analyzed using a PerkinElmer Lambda 6 Spectrophotometer with a diffuse reflectance attachment at the Institute of Surficial Geochemistry (Nanjing University). Sample preparation and analysis followed the procedures described by Ji et al. (2002) and Zhang et al. (2007). In brief, the samples were made into a slurry on a glass microslide with distilled water, smoothed, and dried slowly at room temperature (< 40°C). During measurement, we used the visible spectrum (400–700 nm) that is the most sensitive to iron oxides (Deaton and Balsam, 1991) at 2-nm intervals to obtain reflectance data. The reflectance data were further converted into percent reflectance in standard color bands (Judd and Wyszecki, 1975), that is, violet = 400–450 nm, blue = 450–490 nm, green = 490–560 nm, yellow = 560–590 nm, orange = 590–630 nm, and red = 630–700 nm. Percent reflectance in standard color bands was determined by dividing the percentage of reflectance in a given color band by the total visible wavelength reflectance in a sample (Balsam et al., 1999). The total reflectance of a sample or brightness was calculated by summing the reflectance values from 400 to 700 nm. Brightness and percent reflectance spectrums of violet, blue, green, yellow, orange, and red were used as independent variables to calculate hematite and goethite contents according to transfer functions. The transfer functions for this study were obtained by adding a series of known quantities of pigment-grade synthetic hematite and goethite to the matrix material treated using the citrate–bicarbonate–dithionite (CBD) procedure, following the method described by Ji et al. (2002), which is summarized in Supplementary Appendix A1. The transfer functions are as follows:
The correlation coefficients of these formulas are 0.989 for hematite and 0.980 for goethite, respectively. To further assess the accuracy of our quantitative estimates of hematite and goethite contents, nine samples were selected randomly for analyzing extractable iron contents after the CBD procedure. The CBD procedure can fully extract iron oxide phases of iron oxide minerals (mainly hematite and goethite in this study) without affecting other minerals (Raiswell et al., 1994). Samples were extracted twice with sodium dithionite in hot (75°C) sodium citrate and sodium bicarbonate solution to ensure the complete removal of iron oxides. Then, the extractable iron content of the CBD extractable solution was measured on a UV-2100 spectrophotometer to calculate the percentage of iron oxides extracted. The calibration samples for this study are the same as those of previous studies (Li et al., 2011).
Major elements were measured on bulk sediments by using the X-ray fluorescence (XRF) method using a PANalytical AxiosmAX spectrometer at the State Key Laboratory of Marine Geology (Tongji University). The samples were dried and ground to a fine powder using an agate mortar and pestle. About 4 g of the powder was mixed with H3BO3 as a substrate in a set of cylinder mold and then compressed under 40 MPa to obtain a pellet for analysis. Sediment standards GSR-6 and GSD-15 were used to monitor the analytical precision and accuracy. The data were reported as major element oxides. The analytical precision for major elements is greater than 2%.
The age model of this site was established using planktonic foraminifera, calcareous nannofossil, radiolarian, and magnetic stratigraphy from proceedings of Expedition 349 (Li et al., 2015), and deep-tow magnetic anomaly from Li et al. (2014) (Supplementary Appendix A2). Li et al. (2014) carried out an in situ measurement of the basalt basement age in the SCS by using deep-tow magnetic anomaly and found that the age of basalt at Site U1433 is 18.4 Ma. The Miocene oceanic red beds lie directly above the basalt basement, so we adopted 18.4 Ma as the starting age of the oceanic red bed. Therefore, the age points of the oceanic red beds at this site are a magnetic stratigraphic age point (11.06 Ma), two radiolarian age points (15 Ma, 15.03 Ma), and the deep-tow magnetic anomaly age point (18.4 Ma) (Table 1). Based on this low-resolution age model for the oceanic red beds, we obtained seven age points from 87Sr/86Sr stratigraphy. The deep-tow magnetic anomaly, the biostratigraphic, and paleomagnetic data limited the fish tooth-tuned age to 11.06–18.4 Ma. But the 87Sr/86Sr of fossil fish teeth vary between 0.708812 and 0.708943, which were higher than 87Sr/86Sr of seawater from global oceans (about 0.708600–0.708900) during the same period (Veizer et al., 1999). The Sr isotope of seawater was a mixture of Sr input from continental flux and mantle flux (Palmer and Elderfield, 1985). The SCS as a marginal sea may receive higher 87Sr/86Sr continental input from rivers than from the oceans (Palmer and Edmond, 1989). So, there should be an offset of 87Sr/86Sr of seawater between the SCS and global oceans. We roughly used the mean value of 87Sr/86Sr of seawater from the SCS (0.708849) and global oceans (0.708755) to calculate the offset (0.000094) in the oceanic red beds. After deviation correction, the fish tooth-tuned age of the Miocene oceanic red beds at the IODP Site U1433 was refined by 87Sr/86Sr of fossil fish teeth to the seawater 87Sr/86Sr stratigraphy of the global seawater (Figure 2, Table 1) (Veizer et al., 1999). The 87Sr/86Sr stratigraphy compensates for the lack of biostratigraphic age points in the Miocene oceanic red beds. Totally 60 age points were used for fitting the age model of Site U1433 (Figure 3, Supplementary Appendix A2), including planktonic foraminifera, calcareous nannofossil, radiolarian, and magnetic stratigraphy from the proceedings of Expedition 349 (Li et al., 2015), deep-tow magnetic anomaly from Li et al. (2014), and 87Sr/86Sr stratigraphy from this study. The age model result shows that the development of the oceanic red beds at Site U1433 started at 18.4 Ma and ended at 11.6 Ma, with an average sedimentation rate of 0.60 cm/ka.
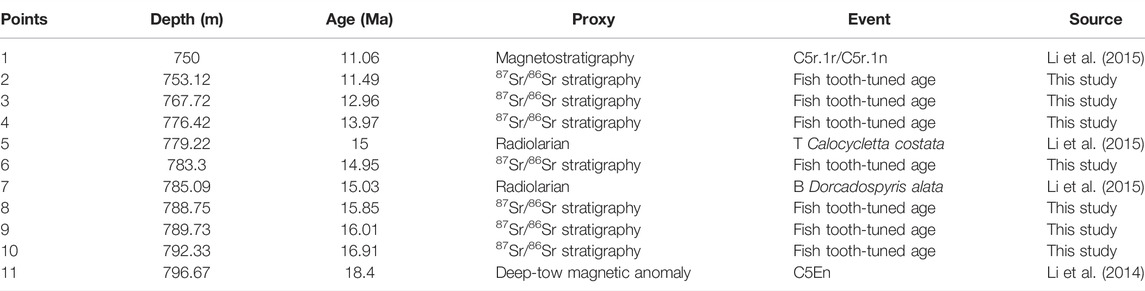
TABLE 1. Age model points of the oceanic red beds at IODP Site U1433 in the SCS.
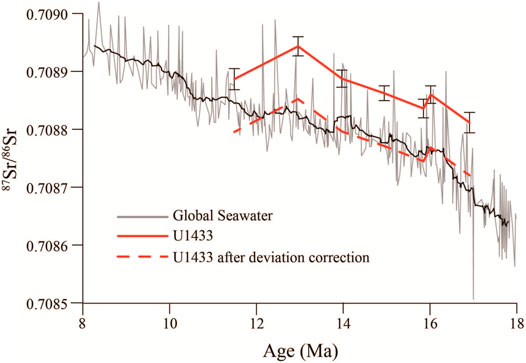
FIGURE 2. 87Sr/86Sr stratigraphy reconstructed from fossil fish teeth of the Miocene oceanic red beds at Sites U1433 and its correlation with global seawater (Veizer et al., 1999).

FIGURE 3. Age–depth plot of the Miocene oceanic red beds at Site U1433 in the SCS. Shaded area shows the Miocene oceanic red beds section.
The DRS data suggest that the oceanic red beds at Site U1433 contain both hematite and goethite. All samples have three first derivative peaks for hematite (565 nm) and goethite (435 and 525 nm) in the first derivatives of DRS data (Figure 4A). For goethite, the 435 nm peak is more significant because the 525 nm peak is commonly overlapped by the 565 nm peak of hematite (Balsam and Wolhart, 1993). Peaks of hematite in most samples are higher than those of goethite. However, the heights of peaks for different minerals do not mean the difference in contents as they can be affected by the matrix effect during analysis (Ji et al., 2002). Distribution of hematite and goethite over time is further present in the plot of DRS data versus age (Figure 4B). Time series color difference between the wavelengths demonstrates that the first derivatives at 435 and 565 nm show peaks at most periods, while the first derivative at 525 nm shows a peak only at certain periods. Meanwhile, the first derivative values at 435 nm are higher than those at 525 nm.

FIGURE 4. First derivatives of the diffuse reflectance spectrometry (DRS) data for the Miocene oceanic red beds of Site U1433. (A) Spectrum distribution of DRS first derivatives of all samples at Site U1433. (B) Time series variations of DRS first derivatives of samples during Early–Middle Miocene. The wavelength ranges from 400 to 700 nm. It is noteworthy that the peaks at 435 and 525 nm represent the signals of goethite, and the peak at 565 nm represents the signal of hematite.
Based on regression Eqs 1, 2, the contents of hematite and goethite can be calculated quantitatively. Results show that the samples contain 0.20–1.48% hematite (average 0.50%) and 0.30–2.98% goethite (average 1.20%) (Figure 5, Supplementary Appendix A3). Temporal variations of hematite and goethite contents show a similar decreasing trend from 18.4 to 11.6 Ma, with a sudden increase at 15.2 Ma. The only difference in their content variations occurred during 13.2–14.8 Ma, in which the hematite content suddenly decreased and was constant, while the goethite content first increased and then decreased upward. Meanwhile, reflectances a* and b* also have a similar trend, with the only difference occurring in this period. The reflectance a* was constant, while the reflectance b* showed a tendency to rise and fall and rise again during 13.2–14.8 Ma. Time series variations of the hematite content and reflectance a* have the same trend when the hematite content is below 1.0% after 17.8 Ma.
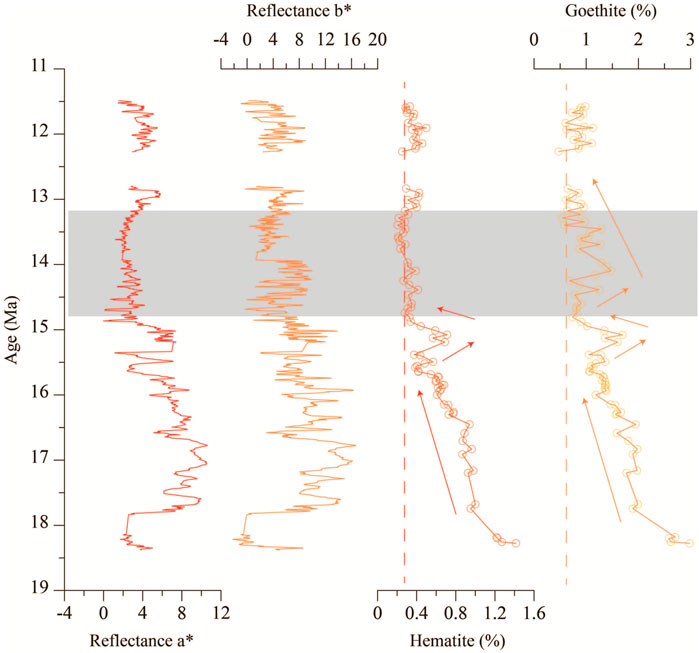
FIGURE 5. Time series variations of hematite and goethite contents and color reflectances a* and b* (10-point running average) of the Miocene oceanic red beds at Site U1433. Reflectances a* and b* data are from proceedings of Expedition 349 (Li et al., 2015). Shaded area shows that the hematite content was constant, while goethite content first increased and then decreased upward.
Major element compositions are characterized by high SiO2 (52.60–63.80%), Al2O3 (13.54–19.92%), and Fe2O3 (6.57–13.12%), with low MgO (2.21–3.97%), K2O (2.15–3.61%), CaO (0.34–1.22%), Na2O (1.37–2.01%), TiO2 (0.53–0.75%), and MnO (0.04–2.52%) (Figure 6, Supplementary Appendix A4). In temporal variation, the Al2O3 content stabilized at ∼14% during the 18.4–15.5 Ma period, then gradually increased to 19.5% at 12 Ma, and finally slightly decreased to ∼17% at 11.6 Ma. This variation pattern occurred also in the K2O content. However, the opposite pattern of variation was obtained in CaO and Na2O contents. In comparison, the Fe2O3 content shows a gradually decreasing trend from ∼13% at 18.4 Ma to ∼7% at 11.6 Ma. Such a decreasing pattern is also observed from MgO and MnO contents.
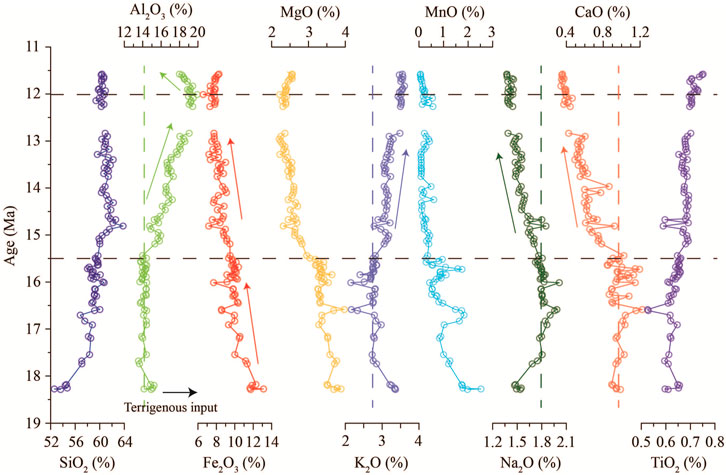
FIGURE 6. Time series variations of major elements of the Miocene oceanic red beds at Site U1433, indicating a strong change at around 15.5 Ma for all major element contents.
We added a series of known quantities of hematite and goethite to the matrix material when we obtained the regression equations (see details in Supplementary Appendix A1). The actual hematite and goethite contents mixed into the samples are compared with the estimated contents of hematite and goethite to evaluate the reliability of regression equations. For hematite from 0 to 1.0%, the R2 of the regression line is 0.978. For goethite from 0 to 2.5%, R2 = 0.961. The good correlations between the estimated contents and the actual contents of iron oxide minerals can confirm the accuracy of calibration equations and the reliability of quantitative analysis in this study. For a few samples with hematite and goethite contents out of the constrained ranges, we excluded them in the following discussion since their accuracy cannot be ensured in our calculation. In addition, these samples are located at the bottom of the Miocene oceanic red beds sequence (>18 Ma), and their exclusion will not affect the overall evolution trend.
To further assess the accuracy of the quantitative estimates, we compared the calculated iron from estimated contents of hematite and goethite with the CBD extractable iron contents from the samples (Figure 7). The CBD extractable iron is used to estimate the amount of free iron oxides in sediments. In marine sediments, the free iron oxides are mainly composed of hematite and goethite with a small amount of maghemite and magnetite (Li et al., 2011). Therefore, the calculated Fe contents based on estimated contents of hematite and goethite should be close to or slightly less than the contents of CBD extractable iron. In this study, the strong linear relationship (R2 = 0.934) between the estimated iron contents and the CBD extractable iron contents, lying near the line Y = X (Figure 7), further supports the reliability of the quantitative estimates of iron oxide minerals.
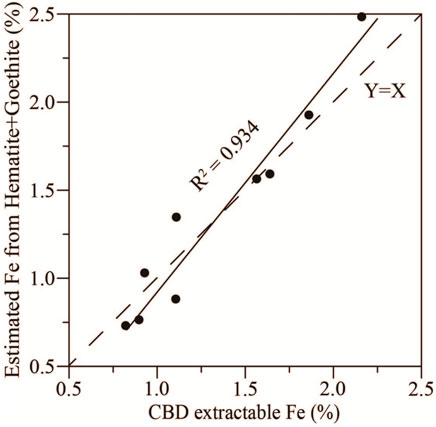
FIGURE 7. Linear relationship between estimated iron from hematite and goethite contents and the CBD extractable free iron of selected Miocene oceanic red beds samples at Site U1433. Solid line: fitted line, dashed line: Y = X.
The oceanic red beds are in reddish-brown color, which is a key indicator for identifying their existence in nature. Hematite, goethite, and rhodochrosite (Mn2+ bearing calcite) were all considered as the possibilities to account for the reddish-brown color of oceanic red beds (Nagao and Nakashima, 1992; Hu et al., 2012). The other iron or manganese minerals reserved in the oxidation environment are black. Nonetheless, the characteristic peak of rhodochrosite, which is 577 nm in the first derivation spectrum of DRS (Cai et al., 2008), is not observed from our samples. Thus, we proposed that the existence of hematite and goethite should be the main reason to interpret the formation of reddish-brown color in this study. We tested this inference by the CBD procedure, as shown in Supplementary Appendix A1. Before the CBD procedure, all samples were brownish and characterized by the prominent first derivative peaks of hematite and goethite. After the CBD procedure, all samples changed colors from brownish to greenish or grayish, and the characteristic peaks of hematite and goethite disappeared. After adding standard minerals of hematite and goethite to the matrix materials, the samples returned to brownish again and the characteristic peaks of hematite and goethite reappeared.
The role of hematite and goethite in forming the color of sediments is different. In theory, hematite is bloodred in color (3.5R–4.1 YR, Munsell hue) and imparts a red color to sediments, while goethite is bright yellow in color (8.1YR–1.6Y, Munsell hue) and imparts a bright yellow color to sediments (Deaton and Balsam, 1991). To identify the role of hematite and goethite in this study, we correlated the hematite content to reflectance a* and the goethite content to reflectance b*, wherein a* indicates the degree of red color and b* indicates the degree of yellow color. Results show that the hematite content has a strong linear correlation with reflectance a* (R2 = 0.76) and the goethite content has a relatively strong linear correlation with reflectance b* (R2 = 0.44) (Figure 8). Although the correlation coefficient between reflectance b* and goethite content is smaller than that between reflectance a* and hematite, the positive correlation is clear to indicate that goethite could have implications for forming yellow color for the Miocene oceanic red beds. This confirms that hematite plays the main role in forming red color and goethite could have an impact on forming yellow color for the Miocene oceanic red beds at Site U1433. In addition, there is no special characteristic peak of other pigment minerals shown in the first derivation spectrum of DRS. Therefore, we concluded that the reddish-brown color of the Miocene oceanic red beds was resulted from the mixture of hematite and goethite.
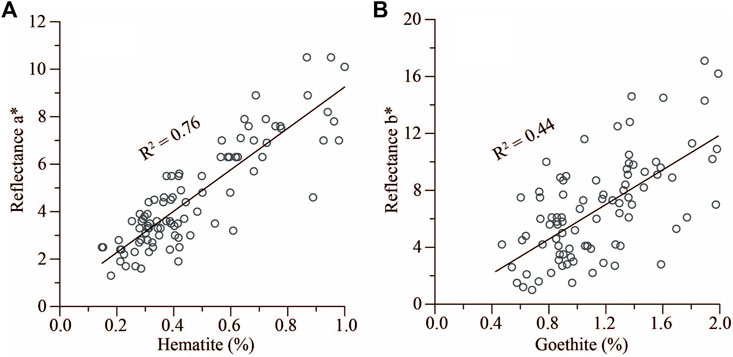
FIGURE 8. Correlations of hematite and goethite contents with color reflectances a* and b* of the Miocene oceanic red beds at Site U1433, respectively. (A) Hematite versus reflectance a*. (B) Goethite versus reflectance b*. Data of color reflectances a* and b* are from proceedings of Expedition 349 (Li et al., 2015).
Hematite and goethite in marine sediments can be terrigenous (Abrajevitch et al., 2009; Chen et al., 2017). However, we consider that hematite and goethite in the oceanic red beds of the SCS were authigenic, which can be supported by 1) the mineral crystallinity deduced from the DRS data and 2) the relationship between iron oxide minerals and major elements. First, genesis of iron oxide can be identified by the mineral crystallinity, and first derivative peaks can be used to indicate the crystallinity of hematite and goethite. With the decrease in hematite and goethite crystallinity, their first derivative peaks move toward the short wavelength (Cai et al., 2008). Well-crystalline hematite from the Cretaceous oceanic red beds is characterized by the peak centered at 575 nm (Hu et al., 2006). In comparison, hematite from this study is characterized by the peak centered at 565 nm, which shows a weak crystalline characteristic. Goethite in this study also shows the same weak crystalline characteristic because the characteristic peak of goethite in this study is 525 nm, which is less than 535 nm as characterized by well-crystalline goethite (Figure 4A). In general, hematite from the terrigenous inputs is well crystalline, while authigenic hematite is poor in crystallization (Li and Cai, 2014). Therefore, it is likely to reveal that the hematite and goethite in this study were authigenic.
Second, the variation of Al2O3 can be used as a proxy to indicate terrigenous inputs of red beds because Al2O3 is mainly derived from clay minerals which come from terrigenous inputs in marine sediments (Boyle, 1983; Turgeon and Brumsack, 2006). The different evolution trends between Al2O3 and Fe2O3 (Figure 6) reveal that the source of Fe2O3 was not terrigenous inputs, at least not entirely. Although the variations of hematite and goethite contents show a similar trend (Figure 5), their positive correlation shows three distinct stages: 11.6–13.2 Ma, 13.2–14.8 Ma, and 14.8–17.8 Ma (Figure 9A). The stages of 11.6–13.2 Ma and 14.8–17.8 Ma show a strong and same correlation (R2 = 0.75), while the stage of 13.2–14.8 Ma indicates a relatively weak correlation (R2 = 0.24) and a marked deviation from the trend of other two stages (Figure 9A). This may imply a weak formation of hematite during 13.2–14.8 Ma, as shown in Figure 5. Generally, the hematite and goethite contents are negatively correlated with the Al2O3 content, respectively (Figures 9B,C). However, unlike the relatively strong correlation of the goethite content with the Al2O3 content (R2 = 0.51), the correlation of the hematite content with the Al2O3 content is quite weak due to the shift of the decreased hematite content during the stage of 13.2–14.8 Ma. Therefore, we believe that the decrease of the hematite content at this stage leads to the low correlation between the hematite content and Al2O3 content. As for the reasons for the decrease in the hematite content, we infer that the environmental change at that stage prevented the transformation of goethite to hematite or the direct formation of hematite. Such a strong negative correlation between hematite and goethite contents and Al2O3 content further indicates that hematite and goethite of the Miocene oceanic red beds at Site U1433 are authigenic.
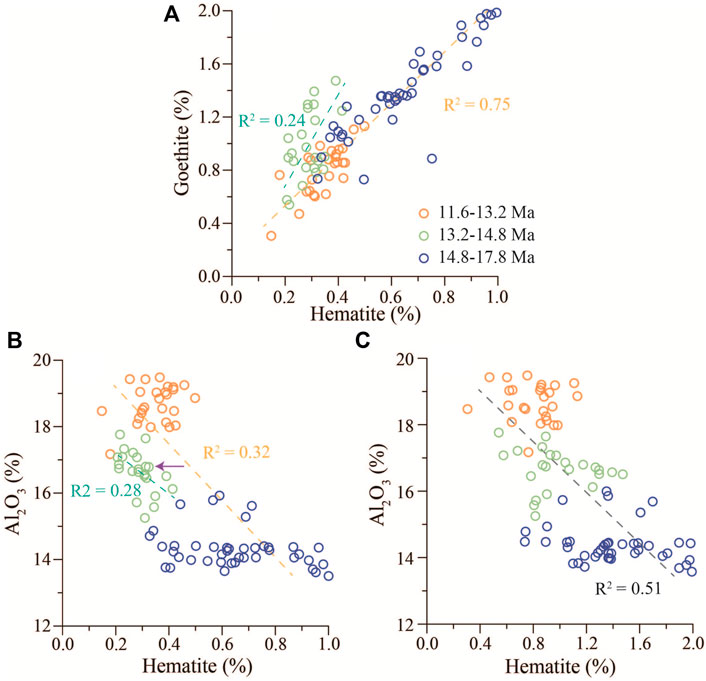
FIGURE 9. Correlations of hematite, goethite, and Al2O3 contents of the Miocene oceanic red beds at Site U1433. (A) Plot of hematite versus goethite content. (B) Plot of hematite versus Al2O3 content. (C) Plot of goethite versus Al2O3 content.
The authigenic hematite and goethite are directly derived from a syn-depositional oxidation environment which allows free iron to settle in the form of trivalence from seawater (Hu et al., 2009). The redox condition at the sediment–water interface was determined by two factors, the concentration of dissolved oxygen and the accumulation rate of organic matter (Morford and Emerson, 1999). Therefore, formation of authigenic hematite and goethite in the Miocene oceanic red beds can result in two mechanisms: sedimentation in an oxygen-rich condition, for example, Cretaceous oceanic red beds (Clauer et al., 1982; Wagreich and Krenmayr, 2005), and sedimentation with oxygen in an extremely low sedimentation rate, for example, modern oceanic red clay of the Pacific (Glasby, 1991). The average sedimentation rate of the red beds at Site U1433 is 0.60 cm/ka, which is higher than the that of modern oceanic red clay (<0.1 cm/ka, Dunlea et al., 2015) but lower than that of the Cretaceous oceanic red beds (1–2 cm/ka, Hu et al., 2012). Therefore, the oxidation degree of the Miocene oceanic red beds sediment environment was relatively stronger than that of the modern oceanic red clay. The concentration of dissolved oxygen of the deep water in the modern SCS is around 2.5 ml/L, which is still in an oxidation environment (Li and Qu, 2006). Nonetheless, the development of oceanic red beds of the SCS disappeared after the Middle Miocene (12 Ma), when the sedimentation rate experienced a sudden increase to 6.22 cm/ka on average (Figure 3). Considering that the SCS basin was open to the western Pacific and the oxygen-rich bottom water of the Pacific flowed directly into the SCS in the Early-Middle Miocene (Hall, 2002), we proposed that the formation of the authigenic hematite and goethite in the SCS should be affected by both the oxygen-rich condition and the low sedimentation rate.
The formation of authigenic hematite and goethite can be used to indicate the redox condition of the depositional environment. Here, we selected the (hematite + goethite)/(100%—Al2O3) ratio as a redox proxy to reflect the syn-depositional environment by ruling out the dilution influence of terrigenous input. The result shows that the degree of oxidation gradually weakened from the Early to Middle Miocene, with two slightly strengthening at around 15 Ma and 14 Ma (Figure 10B). The continuous decreasing trend of oxidation degree in the SCS might be caused by the decreased oxidation degree of the bottom water mass in the western Pacific. However, the global climate cooling event significantly increased dissolved oxygen concentration in seawater during the Early-Middle Miocene (Figure 10C) (Zachos et al., 2001). The expansion of the Antarctic ice sheet at the same time increased the dissolved oxygen concentration of bottom water in the western Pacific due to the recharge of the oxygen-rich bottom water from the Antarctic (Woodruff and Douglas, 1981; Ramsay et al., 1994). Thus, the possibility of the oxidation degree of the bottom water in the western Pacific should be ruled out. In previous studies, the strong deviation of benthic foraminifera δ13C of the SCS from the global ocean marks the birth of a local deep water due to the closure of the SCS since 16 Ma (Figure 10D) (Li et al., 2007; Wang and Li, 2009). The gradual closure of the SCS blocked the intrusion of the oxygen-rich bottom water from the western Pacific. Therefore, the gradual closure of the SCS could be the plausible reason causing the gradual decrease of oxidation degree of the bottom water in the abyssal basin of the SCS.
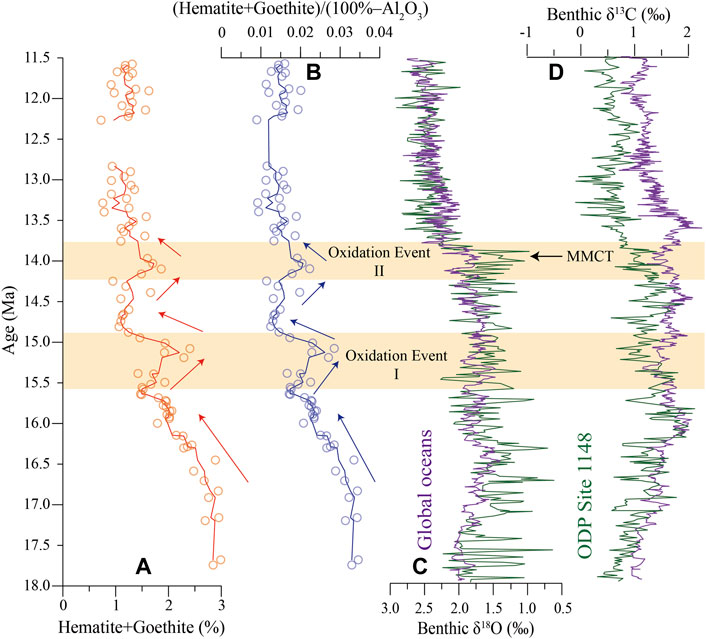
FIGURE 10. Time series variations of hematite + goethite and (hematite + goethite)/(100%—Al2O3) of the Miocene oceanic red beds at Site U1433. δ18O and δ13C of ODP Site 1148 in the SCS (Tian et al., 2002) and combined δ18O and δ13C in the global oceans (Zachos et al., 2001) of benthic foraminifera are plotted for comparison. Shaded areas show two oxidation events occurred at around 15 Ma and 14 Ma. The Middle Miocene climate transition (MMCT) at 13.8 Ma (Shevenell et al., 2004) is also indicated.
For the two strengthened oxidation events (Figure 10B), it could happen for different reasons. The oxidation event I occurred at about 15 Ma when the SCS experienced a rapid thermal subsidence at the end of expansion (Li et al., 2014; Ding et al., 2016), allowing the intrusion of more oxygen-rich bottom water from the western Pacific (Beaty et al., 2017). Such a shift to the bottom water activity could have reinforced the formation of a more oxidized sedimentary environment in the SCS. Oxidation event II occurred at around 14 Ma and might be caused by the global cooling during the Middle Miocene Climate Transition (MMCT, 14.2–13.8 Ma) (Shevenell et al., 2004). The cooling global climate can lead to the increase in the dissolved oxygen concentration in seawater (Zachos et al., 2001). Hence, we consider that the rapid subsidence of the SCS at about 15 Ma and the global cooling during the MMCT around 14 Ma led to the occurrence of two strengthened oxidation events. Similar to the fact that the Oxidation Event II was caused by global cooling, the Oxidation Event I also might be affected by relative cooling conditions at around 15 Ma. According to the benthic δ18O, there was no very significant cooling event at around 15 Ma like the global cooling during the MMCT. Also, the first oxidation event was significantly stronger than the second event. Thus, we suggest that the rapid subsidence of the SCS was the main contribution to the first oxidation event and the cooling played a secondary role.
In this study, we quantitatively analyzed the hematite and goethite contents in the Miocene oceanic red beds at IODP Site U1433 and revealed their chromogenic reason of reddish-brown color. We finally applied these results to the reconstruction of the deep-sea oxidation environment evolution of the SCS abyssal basin during the Early-Middle Miocene. The following conclusions were obtained:
1) The quantitative analysis result shows that the Miocene oceanic red beds contain 0.20–1.48% hematite (average 0.50%) and 0.30–2.98% goethite (average 1.20%). The hematite and goethite contents have strong positive correlations with reflectance a* (red) and b* (yellow), respectively, indicating that the combined action of hematite and goethite is the reason for the reddish-brown color of the samples.
2) Hematite and goethite in the Miocene oceanic red beds are poor in crystallization, and their contents are negatively correlated with the Al2O3 content, indicating that they are mainly authigenic minerals, formed in the oxygen-rich bottom water and extremely low sedimentation rate sedimentary environment.
3) The (hematite + goethite)/(100%—Al2O3) ratio indicates the gradually decreased oxidation evolution of the bottom water in the SCS abyssal basin from the Early to Middle Miocene, with two strengthened oxidation events occurring at around 15 Ma and 14 Ma. The long-term decreasing trend might be caused by the gradual blocking of oxygen-rich bottom water from the western Pacific since the early Miocene, while the two oxidation events could be led by the thermal subsidence of the SCS and the global cooling during the MMCT, respectively.
The original contributions presented in the study are included in the article/Supplementary Material, further inquiries can be directed to the corresponding authors.
ZL designed the study and obtained the funding. ZL, CL, and QL carried out the fieldwork. XL, QW, and CC carried out the measurements with support from XY. XL wrote the original draft. All authors contributed to discussion and writing.
This work is supported by the National Key R&D Program of China (2018YFE0202400), the Shanghai Science and Technology Innovation Action Plan (20590780200), and the National Natural Science Foundation of China (41530964).
The authors declare that the research was conducted in the absence of any commercial or financial relationships that could be construed as a potential conflict of interest.
All claims expressed in this article are solely those of the authors and do not necessarily represent those of their affiliated organizations, or those of the publisher, the editors, and the reviewers. Any product that may be evaluated in this article, or claim that may be made by its manufacturer, is not guaranteed or endorsed by the publisher.
This research used samples and data provided by the International Ocean Discovery Program (IODP). We acknowledge Junfeng Ji of Nanjing University for his help in the experiment of iron oxide minerals. ZL, CL, and QL thank IODP-China for sponsoring their sailing of IODP Expedition 349 in the SCS.
The Supplementary Material for this article can be found online at: https://www.frontiersin.org/articles/10.3389/feart.2022.875292/full#supplementary-material
Supplementary Appendix A1 | Transfer functions for hematite and goethite measurement.
Supplementary Appendix A2 | Table S1 Age model of IODP Site U1433 in the South China Sea.
Supplementary Appendix A3 | Table S2 Contents of hematite, goethite, and related reflectance of various color bands of the Miocene oceanic red beds at IODP Site U1433 in the SCS. (provided in as a separate file.xlsx).
Supplementary Appendix A4 | Table S3 Major element contents of the Miocene oceanic red beds at IODP Site U1433 in the SCS (provided in as a separate file.xlsx).
Abrajevitch, A., der Voo, R. V., and Rea, D. K. (2009). Variations in Relative Abundances of Goethite and Hematite in Bengal Fan Sediments: Climatic vs. Diagenetic Signals. Mar. Geology. 267, 191–206. doi:10.1016/j.margeo.2009.10.010
Balsam, W. L., and Damuth, J. E. (2000). Further Investigations of Shipboard vs. Shorebased Spectral Data: Implications for Interpreting Leg 164 Sediment Composition. Proc. ODP Scientific Results 164, 313–324. doi:10.2973/odp.proc.sr.164.222.2000
Balsam, W. L., Deaton, B. C., and Damuth, J. E. (1999). Evaluating Optical Lightness as a Proxy for Carbonate Content in marine Sediment Cores. Mar. Geology. 161, 141–153. doi:10.1016/s0025-3227(99)00037-7
Balsam, W. L., and Wolhart, R. J. (1993). Sediment Dispersal in the Argentine Basin: Evidence from Visible Light Spectra. Deep Sea Res. Part Topical Stud. Oceanography 40, 1001–1031. doi:10.1016/0967-0645(93)90046-p
Beaty, T., Heinze, C., Hughlett, T., and Winguth, A. M. E. (2017). Response of export Production and Dissolved Oxygen Concentrations in Oxygen Minimum Zones to pCO2 and Temperature Stabilization Scenarios in the Biogeochemical Model HAMOCC 2.0. Biogeosciences 14, 1–34. doi:10.5194/bg-14-781-2017
Boyle, E. A. (1983). Chemical Accumulation Variations under the Peru Current during the Past 130,000 Years. J. Geophys. Res. 88, 7667–7680. doi:10.1029/jc088ic12p07667
Cai, Y., Li, X., Pan, Y., and Hu, X. (2008). The Color-Causing Mechanism of Mn2+ and Fe3+: Evidence from the Italian Cretaceous Pelagic Red Limestones (in Chinese). Acta Geologica Sinica 82, 133–138. doi:10.3321/j.issn:0001-5717.2008.01.016
Cai, Y., Hu, X., Li, X., and Pan, Y. (2012). Origin of the Red Colour in a Red limestone from the Vispi Quarry Section (central Italy): A High-Resolution Transmission Electron Microscopy Analysis. Cretaceous Res. 38, 97–102. doi:10.1016/j.cretres.2011.11.016
Chen, Q., Kissel, C., and Liu, Z. (2017). Late Quaternary Climatic Forcing on the Terrigenous Supply in the Northern South China Sea: Input from Magnetic Studies. Earth Planet. Sci. Lett. 471, 160–171. doi:10.1016/j.epsl.2017.04.047
Clauer, N., Hoffert, M., and Karpoff, A.-M. (1982). The Rb Sr Isotope System as an index of Origin and Diagenetic Evolution of Southern Pacific Red Clays. Geochimica et Cosmochimica Acta 46, 2659–2664. doi:10.1016/0016-7037(82)90384-2
Colin, C., Siani, G., Liu, Z., Blamart, D., Skonieczny, C., Zhao, Y., et al. (2014). Late Miocene to Early Pliocene Climate Variability off NW Africa (ODP Site 659). Palaeogeogr. Palaeoclimatol. Palaeoecol. 401, 81–95. doi:10.1016/j.palaeo.2014.02.015
Deaton, B. C., and Balsam, W. L. (1991). Visible Spectroscopy; a Rapid Method for Determining Hematite and Goethite Concentration in Geological Materials. J. Sediment. Res. 61, 628–632. doi:10.1306/d4267794-2b26-11d7-8648000102c1865d
Ding, W., Li, J., and Clift, P. D. (2016). Spreading Dynamics and Sedimentary Process of the Southwest Sub-basin, South China Sea: Constraints from Multi-Channel Seismic Data and IODP Expedition 349. J. Asian Earth Sci. 115, 97–113. doi:10.1016/j.jseaes.2015.09.013
Dunlea, A. G., Murray, R. W., Sauvage, J., Pockalny, R. A., Spivack, A. J., Harris, R. N., et al. (2015). Cobalt-based Age Models of Pelagic clay in the South Pacific Gyre. Geochem. Geophys. Geosyst. 16, 2694–2710. doi:10.1002/2015gc005892
Franke, W., and Paul, J. (1980). Pelagic Redbeds in the Devonian of Germany - Deposition and Diagenesis. Sediment. Geology. 25, 231–256. doi:10.1016/0037-0738(80)90043-3
Glasby, G. P. (1991). Mineralogy, Geochemistry, and Origin of Pacific Red Clays: A Review. New Zealand J. Geology. Geophys. 34, 167–176. doi:10.1080/00288306.1991.9514454
Hall, R. (2002). Cenozoic Geological and Plate Tectonic Evolution of SE Asia and the SW Pacific: Computer-Based Reconstructions, Model and Animations. J. Asian Earth Sci. 20, 353–431. doi:10.1016/s1367-9120(01)00069-4
Hu, X., Cheng, W., and Ji, J. (2009). Origin of Cretaceous Oceanic Red Beds from the Vispi Quarry Section, Central Italy: Visible Reflectance and Inorganic Geochemistry. SEPM Soc. Sediment. Geology. 91, 183–197. doi:10.2110/sepmsp.091.183
Hu, X., Jansa, L., Wang, C., Sarti, M., Bak, K., Wagreich, M., et al. (2005). Upper Cretaceous Oceanic Red Beds (CORBs) in the Tethys: Occurrences, Lithofacies, Age, and Environments. Cretaceous Res. 26, 3–20. doi:10.1016/j.cretres.2004.11.011
Hu, X., Scott, R. W., Cai, Y., Wang, C., and Melinte-Dobrinescu, M. C. (2012). Cretaceous Oceanic Red Beds (CORBs): Different Time Scales and Models of Origin. Earth-Science Rev. 115, 217–248. doi:10.1016/j.earscirev.2012.09.007
Hu, X., Wang, C., Li, X., and Jansa, L. (2006). Upper Cretaceous Oceanic Red Beds in Southern Tibet: Lithofacies, Environments and Colour Origin. Sci. China Ser. D 49, 785–795. doi:10.1007/s11430-006-0785-7
Jamal, M., Tamar-Agha, M., and Alwani, T. A. (2017). Geochemistry and Depositional Conditions of the Cretaceous Oceanic Red Beds (CORBs) within the Shiranish Formation in North of Iraq. Iraqi J. Sci. 58, 2139–2164. doi:10.24996/ijs.2017.58.4B.18
Ji, J., Balsam, W., Chen, J. U., and Liu, L. (2002). Rapid and Quantitative Measurement of Hematite and Goethite in the Chinese Loess-Paleosol Sequence by Diffuse Reflectance Spectroscopy. Clays and Clay Minerals 50, 208–216. doi:10.1346/000986002760832801
Ji, J., Zhao, L., Balsam, W., Chen, J., Wu, T., and Liu, L. (2006). Detecting Chlorite in the Chinese Loess Sequence by Diffuse Reflectance Spectroscopy. Clays Clay Miner. 54, 266–273. doi:10.1346/ccmn.2006.0540211
Judd, D., and Wyszecki, G. (1975). Color in Business, Science, and Industry. New York: John Wiley & Sons, 553.
Li, C.-F., Lin, J., and Kulhanek, D. K.Expedition 349 Scientists (2015). Proceedings of the International Ocean Discovery Program, 349. South China Sea Tectonics. College Station, TX: International Ocean Discovery Program 349. doi:10.14379/iodp.proc.349.2015
Li, C.-F., Xu, X., Lin, J., Sun, Z., Zhu, J., Yao, Y., et al. (2014). Ages and Magnetic Structures of the South China Sea Constrained by Deep Tow Magnetic Surveys and IODP Expedition 349. Geochem. Geophys. Geosyst. 15, 4958–4983. doi:10.1002/2014gc005567
Li, L., and Qu, T. (2006). Thermohaline Circulation in the Deep South China Sea basin Inferred from Oxygen Distributions. J. Geophys. Res. 111, C05017. doi:10.1029/2005JC003164
Li, Q., Zhao, Q., Zhong, G., Jian, Z., Tian, J., Cheng, X., et al. (2007). Deepwater Ventilation and Stratification in the Neogene South China Sea. J. China Univ. Geosciences 18, 95–108. doi:10.1016/S1002-0705(07)60024-7
Li, X., and Cai, Y. (2014). The Colouration Mechanism and Genetic Study of Cretaceous Oceanic Red Beds (in Chinese). Acta Mineralogica Sinica 34, 451–460. doi:10.16461/j.cnki.1000-4734.2014.04.006
Li, X., Hu, X., Cai, Y., and Han, Z. (2011). Quantitative Analysis of Iron Oxide Concentrations within Aptian-Albian Cyclic Oceanic Red Beds in ODP Hole 1049C, North Atlantic. Sediment. Geology. 235, 91–99. doi:10.1016/j.sedgeo.2010.06.024
Liu, B., Wang, Y., Su, X., and Zheng, H. (2013). Elemental Geochemistry of Northern Slope Sediments from the South China Sea: Implications for Provenance and Source Area Weathering since Early Miocene. Geochemistry 73, 61–74. doi:10.1016/j.chemer.2012.11.005
Lugmair, G. W., Shimamura, T., Lewis, R. S., and Anders, E. (1983). Samarium-146 in the early solar system: Evidence from neodymium in the Allende Meteorite. Science 222, 1015–1018.
Morford, J. L., and Emerson, S. (1999). The Geochemistry of Redox Sensitive Trace Metals in Sediments. Geochimica et Cosmochimica Acta 63, 1735–1750. doi:10.1016/s0016-7037(99)00126-x
Nagao, S., and Nakashima, S. (1992). The Factors Controlling Vertical Color Variations of North Atlantic Madeira Abyssal Plain Sediments. Mar. Geology. 109, 83–94. doi:10.1016/0025-3227(92)90222-4
Neuhuber, S., and Wagreich, M. (2011). Geochemistry of Cretaceous Oceanic Red Beds - A Synthesis. Sediment. Geology. 235, 72–78. doi:10.1016/j.sedgeo.2010.10.008
Palmer, M. R., and Edmond, J. M. (1989). The Strontium Isotope Budget of the Modern Ocean. Earth Planet. Sci. Lett. 92, 11–26. doi:10.1016/0012-821x(89)90017-4
Palmer, M. R., and Elderfield, H. (1985). Sr Isotope Composition of Sea Water over the Past 75 Myr. Nature 314, 526–528. doi:10.1038/314526a0
Raiswell, R., Canfield, D. E., and Berner, R. A. (1994). A Comparison of Iron Extraction Methods for the Determination of Degree of Pyritisation and the Recognition of Iron-Limited Pyrite Formation. Chem. Geology. 111, 101–110. doi:10.1016/0009-2541(94)90084-1
Ramsay, A. T. S., Sykes, T. J. S., and Kidd, R. B. (1994). Waxing (And Waning) Lyrical on Hiatuses: Eocene - Quaternary Indian Ocean Hiatuses as Proxy Indicators of Water Mass Production. Paleoceanography 9, 857–877. doi:10.1029/94pa01397
Roberts, A. P., Zhao, X., Heslop, D., Abrajevitch, A., Chen, Y -H., and Pillans, B. J. (2020). Hematite (α-Fe2o3) Quantification in Sedimentary Magnetism: Limitations of Existing Proxies and Ways Forward. Geosci. Lett. 7 (1), 8. doi:10.1186/s40562-020-00157-5
Scheinost, A. C., Chavernas, A., Barrón, V., and Torrent, J. (1998). Use and Limitations of Second-Derivative Diffuse Reflectance Spectroscopy in the Visible to Near-Infrared Range to Identify and Quantify Fe Oxide Minerals in Soils. Clays and Clay Minerals 46, 528–536. doi:10.1346/ccmn.1998.0460506
Scheinost, A. C., and Schwertmann, U. (1999). Color Identification of Iron Oxides and Hydroxysulfates. Soil Sci. Soc. Am. J. 63, 1463–1471. doi:10.2136/sssaj1999.6351463x
Shevenell, A. E., Kennett, J. P., and Lea, D. W. (2004). Middle Miocene Southern Ocean Cooling and Antarctic Cryosphere Expansion. Science 305, 1766–1770. doi:10.1126/science.1100061
Song, H., Jiang, G., Poulton, S. W., Wignall, P. B., Tong, J., Song, H., et al. (2017). The Onset of Widespread marine Red Beds and the Evolution of Ferruginous Oceans. Nat. Commun. 8, 399. doi:10.1038/s41467-017-00502-x
Tian, J., Wang, P., Cheng, X., and Li, Q. (2002). Astronomically Tuned Plio-Pleistocene Benthic δ 18 O Record from South China Sea and Atlantic-Pacific Comparison. Earth Planet. Sci. Lett. 203, 1015–1029. doi:10.1016/s0012-821x(02)00923-8
Tian, J., Yang, Q., Liang, X., Xie, L., Hu, D., Wang, F., et al. (2006). Observation of Luzon Strait Transport. Geophys. Res. Lett. 33, L19607. doi:10.1029/2006gl026272
Turgeon, S., and Brumsack, H.-J. (2006). Anoxic vs Dysoxic Events Reflected in Sediment Geochemistry during the Cenomanian-Turonian Boundary Event (Cretaceous) in the Umbria-Marche Basin of central Italy. Chem. Geology. 234, 321–339. doi:10.1016/j.chemgeo.2006.05.008
Veizer, J., Ala, D., Azmy, K., Bruckschen, P., Buhl, D., Bruhn, F., et al. (1999). 87Sr/86Sr, δ13C and δ18O Evolution of Phanerozoic Seawater. Chem. Geology. 161, 1586. doi:10.1016/s0009-2541(99)00081-9
Wagreich, M., and Krenmayr, H.-G. (2005). Upper Cretaceous Oceanic Red Beds (CORB) in the Northern Calcareous Alps (Nierental Formation, Austria): Slope Topography and Clastic Input as Primary Controlling Factors. Cretaceous Res. 26, 57–64. doi:10.1016/j.cretres.2004.11.012
Walden, J., White, K. H., Kilcoyne, S. H., and Bentley, P. M. (2000). Analyses of Iron Oxide Assemblages within Namib Dune Sediments Using High Field Remanence Measurements (9 T) and Mossbauer Analysis. J. Quat. Sci. 15, 185–195. doi:10.1002/(sici)1099-1417(200002)15:2<185::aid-jqs503>3.0.co;2-5
Walker, T. R. (1967). Formation of Red Beds in Modern and Ancient Deserts. Geol. Soc. America Bull. 78, 353–368. doi:10.1130/0016-7606(1967)78[353:forbim]2.0.co;2
Wan, S., Li, A., Clift, P. D., and Stuut, J.-B. W. (2007). Development of the East Asian Monsoon: Mineralogical and Sedimentologic Records in the Northern South China Sea since 20 Ma. Palaeogeogr. Palaeoclimatol. Palaeoecol. 254, 561–582. doi:10.1016/j.palaeo.2007.07.009
Wang, C., Huang, Y., Hu, X., and Li, X. (2004). Cretaceous Oceanic Redbeds: Implications for Paleoclimatology and Paleoceanography. Acta Geologica Sinica 78, 873–877. doi:10.3321/j.issn:1000-9515.2004.03.036
Wang, C., Hu, X., Huang, Y., Scott, R. W., and Wagreich, M. (2009). “Overview of Cretaceous Oceanic Red Beds (CORBs): A Window on Global Oceanic and Climate Change,” in Cretaceous Oceanic Red Beds: Stratigraphy, Composition, Origins and Paleoceanographic and Paleoclimatic Significance. Editors X. Hu, C. S. Wang, R. W. Scott, M. Wagreich, and L. Jansa (SEPM Special Publication), 91, 13–33. doi:10.2110/sepmsp.091.013
Wang, C., Hu, X., Sarti, M., Scott, R. W., and Li, X. (2005). Upper Cretaceous Oceanic Red Beds in Southern Tibet: a Major Change from Anoxic to Oxic, Deep-Sea Environments. Cretaceous Res. 26, 21–32. doi:10.1016/j.cretres.2004.11.010
Wang, P., and Li, Q. (2009). The South China Sea − Paleoceanography and Sedimentology. Dordrecht: Springer, 506. doi:10.1007/978-1-4020-9745-4
Woodruff, F., and Douglas, R. G. (1981). Response of Deep-Sea Benthic Foraminifera to Miocene Paleoclimatic Events, DSDP Site 289. Mar. Micropaleontology 6, 617–632. doi:10.1016/0377-8398(81)90024-4
Zachos, J., Pagani, M., Sloan, L., Thomas, E., and Billups, K. (2001). Trends, Rhythms, and Aberrations in Global Climate 65 Ma to Present. Science 292, 686–693. doi:10.1126/science.1059412
Keywords: Miocene oceanic red beds, hematite, goethite, major elements, IODP Expedition 349 Site U1433, South China Sea
Citation: Lyu X, Liu Z, Wu Q, Colin C, Yu X, Liu C and Li Q (2022) Quantifying Iron Oxide Mineral Contents in Miocene Oceanic Red Beds for the Deep-Sea Oxidation Evolution in the South China Sea. Front. Earth Sci. 10:875292. doi: 10.3389/feart.2022.875292
Received: 14 February 2022; Accepted: 28 March 2022;
Published: 27 April 2022.
Edited by:
Xiting Liu, Ocean University of China, ChinaReviewed by:
Zhaoxia Jiang, Ocean University of China, ChinaCopyright © 2022 Lyu, Liu, Wu, Colin, Yu, Liu and Li. This is an open-access article distributed under the terms of the Creative Commons Attribution License (CC BY). The use, distribution or reproduction in other forums is permitted, provided the original author(s) and the copyright owner(s) are credited and that the original publication in this journal is cited, in accordance with accepted academic practice. No use, distribution or reproduction is permitted which does not comply with these terms.
*Correspondence: Zhifei Liu, bHpoaWZlaUB0b25namkuZWR1LmNu; Qiong Wu, cWlvbmd3dUBoaHUuZWR1LmNu
Disclaimer: All claims expressed in this article are solely those of the authors and do not necessarily represent those of their affiliated organizations, or those of the publisher, the editors and the reviewers. Any product that may be evaluated in this article or claim that may be made by its manufacturer is not guaranteed or endorsed by the publisher.
Research integrity at Frontiers
Learn more about the work of our research integrity team to safeguard the quality of each article we publish.