 Jianbo Liao
 Zhongyi Zhang2
94% of researchers rate our articles as excellent or good
Learn more about the work of our research integrity team to safeguard the quality of each article we publish.
Find out more
ORIGINAL RESEARCH article
Front. Earth Sci., 10 March 2022
Sec. Structural Geology and Tectonics
Volume 10 - 2022 | https://doi.org/10.3389/feart.2022.873617
This article is part of the Research TopicQuantitative Characterization and Engineering Application of Pores and Fractures of Different Scales in Unconventional ReservoirsView all 24 articles
The fracturing and well pattern optimization of fractured reservoirs is a hot spot in petroleum engineering. In this study, taking the tight oil reservoirs of the Yanchang Formation in the Ordos Basin as an example, an optimized plan of hydraulic fracturing and well pattern deployment of the fractured tight reservoir were systematically studied using a fluid-solid coupling model. The results show that the Chang 6 Member of Yanchang Formation mainly develop feldspar sandstone. A large number of vertical fractures are developed in Chang 6 Member, and they have significant shearing properties. The target sandstone reservoir is in the mid-diagenetic A stage. Natural fractures have a significant effect on the extension of hydraulic fractures. When the fracturing direction is parallel to the main strike of natural fractures, the extension distance of the hydraulic fractures is long and the fracturing scale is large; however, when the fracturing direction is orthogonal or oblique to the main strike of natural fractures, the extension distance of the hydraulic fractures is limited. Statistics show that the average length of hydraulic fractures when fracturing parallel to natural fractures is 1.3 times of that when fracturing perpendicular to natural fractures. In addition, after optimization of fracturing parameters, we found that the displacement should be controlled at 2–3 cubic meters/min, and the sand ratio should be controlled at 25%. The smaller the horizontal minimum principal stress difference between the fracturing layer and the shielding layer, the lower the elastic modulus, and the easier it is to control the fracture height. Microseismic monitoring results show that the half-fracture length and fracture height are mainly distributed in 80–140 m and 15–25 m, respectively. The optimized fracture half-length was 120 m and the half-fracture height was 20 m. Finally, the well pattern of the target layer is optimized considering natural fractures. Through this study, we found that the reverse five-spot well pattern is suitable for the efficient development of tight oil reservoirs of the Chang 6 Member in this area.
At present, the exploration and development of continental tight sandstone oil has achieved great success in China (Zou et al., 2013; Yin et al., 2018; Li et al., 2020). The development of continental tight sandstone oil is difficult, which puts forward higher requirements for the integration technology of geology and engineering of tight oil (Li et al., 2018; Hong et al., 2020; Abouzar and Ghanbarian, 2021; Ding et al., 2021). The integrated construction of tight oil geology and engineering is to maximize the stable production of crude oil. Therefore, the core issue of this technology is the dynamic optimization and timely matching of engineering and geological parameters (Chitrala et al., 2013; Wang et al., 2019; He et al., 2020; Mahmud et al., 2020; Yoshida and Santosh, 2020).
The continental tight oil reservoirs in the Yanchang Formation in the Ordos Basin are characterized by strong heterogeneity, small single sand body thickness, and low natural productivity (Zou et al., 2013; Yin and Wu, 2020). In recent years, the development of fracturing and well pattern optimization technologies have provided a huge space for the upgrading of reserves production in such oil reservoirs (Salamon, 1984; Ma et al., 2019; Dong et al., 2020; Khan et al., 2020; Xue et al., 2021). However, with different development methods, the complexity of fluid flow between different well patterns in tight oil reservoirs increases. Thus, the effect of different fracturing and well pattern mode on oil production capacity is difficult to predict (Jaeger and Cook, 1976; McBride, 1989; Du and Aydin, 1993; Zhang et al., 2017; Gao, 2021). For tight fractured reservoirs, the presence of natural fractures aggravates the anisotropy of the reservoir, which in turn has a significant impact on the development effect of reservoir (Li and Zhang, 1997; Shuai et al., 2013; Luo et al., 2018; Xi et al., 2019; Zhao et al., 2020). The existence of natural fractures will reduce the strength of the rock mass significantly, and even make the rock lose its “strength”. For the fracturing of wells with natural fractures, it is generally believed that the problem of continuous expansion of fractures under the action of fracturing fluid can also generate new fracturing fractures (Zou et al., 2013; Yin and Wu, 2020). Moreover, due to the differences in the mechanical properties, occurrence, quantity, and distribution of fractures in and around the well, the problems of fracture propagation and energy loss during fracturing become very complicated. For tight oil reservoirs, the injection-production well pattern and the natural fracture system must have a reasonable configuration relationship. The previous often adopted the well pattern deployment with parallel fracture main strikes (Ma et al., 2019; Zhao et al., 2020).
In the fracturing and well pattern optimization simulation process, the construction of the fracture network is very important, and the commonly used methods are usually based on the finite element and discrete element principles (Zhao et al., 2020). In addition, the fracturing effect can be verified by comparing with the microseismic monitoring results (Shuai et al., 2013; Luo et al., 2018). The finite element and discrete element models can quantitatively characterize the coupling relationship between fluid and solid and the extension law of hydraulic fractures.
In this study, taking the Upper Triassic Yanchang Formation in the western margin of the Ordos Basin with relatively developed fractures as an example, the numerical simulation of volume fracturing and well pattern optimization of tight oil based on multiple porous media model were systematically conducted. This study can provide a reference for the integrated construction of geology and engineering of continental tight oil.
In this study, a physical model for volume fracturing of tight oil based on multiple porous media was established (Figure 1). It is based on the dual continuum model and can well describe the matrix and natural fracture systems. Moreover, the DFN (discrete fracture network) model was used to describe the network fracture system. Obviously, the complex fracture network formed by volume fracturing is integrated into the matrix and the natural fracture systems at the same time (Figure 1). The assumptions are: 1) The multi-porous medium is fully saturated and isotropic; 2) Reservoir matrix framework, fractures and fluids are compressible; 3) The deformation of the rock skeleton is a linear elastic micro-deformation, and it follows the Terzaghi effective stress principle; 4) The seepage of the fluid in the fracture obeys Darcy’s law, and there is a quasi-steady-state channeling flow between the matrix and the fracture system; 5) The initial stress field is uniformly distributed and isothermal, single-phase seepage occurs without considering the effect of gravity; 6) The porosity, permeability and compressibility of multi-porous media are all dynamically variable.
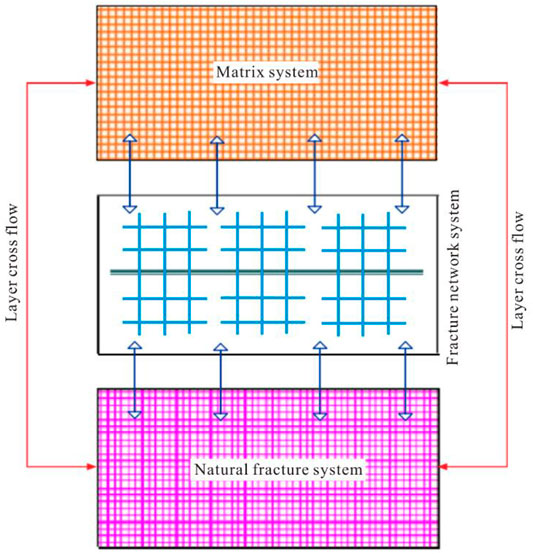
FIGURE 1. Schematic diagram of the physical model of volume fracturing based on multi-porous media model (Modified after Ren et al., 2019).
In addition, in order to more accurately and intuitively characterize the water flooding process in the well pattern and the effect of fracture seepage on the productivity of the fractured wells, the logarithmic grid refinement technology was used in the modeling. The use of this technique can not only describe the hydraulic fractures finely, but also avoid the problems of long calculation time and non-convergence of the Local Refinement Grid (LGR) method (Gurocak et al., 2012; Lommatzsch et al., 2015).
In this study, an enhancement function was introduced to describe the propagation of hydraulic fractures. This function is mainly used to describe the dynamic propagation of the fracture tip. The function representing the displacement of the fracture cover is:
In the formula, NI(x) is the shape function of the set nodes; uI is the displacement vector; H(x) is the discontinuous function related to the fracture surface activity; aI and bIα are the degrees of freedom of the nodes in the model, respectively; Fα(x) is the asymptotic function of the propagated fracture tip.
The initiation and propagation of hydraulic fractures are directly related to the stress and pore pressure of the rock skeleton:
where σ and
Then, the equilibrium equation of the formation is:
In the formula, σ is the total stress matrix; f is the physical force matrix; t is the surface force matrix; δv is the virtual work matrix; n is the unit normal vector of the vertical fracture surface.
The continuity equation representing the fluid flow capability of the reservoir is:
In the formula, J is the volume ratio of the reservoir rock after deformation and before deformation; ρw, ϕ and vw are the fluid density, rock porosity and fluid seepage velocity, respectively.
During artificial fracture monitoring, the monitoring system have six microseismic observation stations around the fracturing well with the mid-deep point of the fracturing layer as the center. The shape, orientation, height and occurrence of fractures in fracturing wells can be obtained through on-site monitoring, and then the spatial distribution of the complex fracture network in the formation can be obtained.
When artificial fractures are formed by fracturing a well, microseisms will inevitably occur along the fracture surface. The distribution of the microseismic source reflects the contour of the artificial fracture, and the microseismic source location formula is:
In the formula, t1, t2, … t5 are the microseismic moments recorded by the geophone; t0 is the seismic moment; vp is the p-wave velocity; (x1, y1), (x2, y2), (x3, y3), (x4, y4), (x5, y5) are the coordinates of the monitoring station; Z is the depth of the seismic source. In this study, it is stipulated that the X-axis is along the east-west direction, and the east is the positive direction; the Y-axis is along the north-south direction, and the north is the positive direction; the Z-axis is the vertical direction. t0, x0, y0, z are the seek unknowns.
The study area is located in Block X of the Western Margin Thrust Belt of the Ordos Basin, and the target layer is the Chang 6 Member of the Yanchang Formation. The Chang 6 Member in this area belongs to the delta front sediments, and distributary channel and interdistributary bay microfacies are developed. Reservoirs are mainly distributed in distributary channel sand bodies. The distributary river channel facies mainly develop coarse sandstones, while on both sides of the main river channel, siltstone and silty mudstone are mainly developed (Figure 2). The interdistributary bay is dominated by silty mudstone and mudstone, and the natural potential (GR) curve is low and flat.
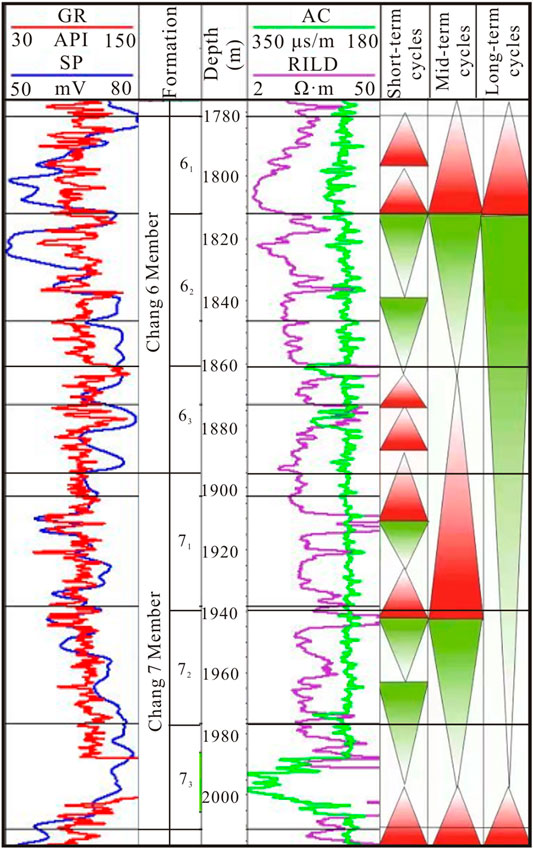
FIGURE 2. Sedimentary characteristics of Chang 6 and Chang 7 Members of the Upper Triassic Yanchang Formation in Well Z1. GR—natural gamma; SP spontaneous potential; AC—longitudinal wave time difference; RILD—resistivity.
The tight sandstone of Chang 6 Member was formed under relatively strong hydrodynamic conditions, and wavy and lenticular bedding structures are developed (Figure 3A). Compaction, pressure solution, cementation, dissolution and tectonic rupture are the main types of diagenesis in the Chang 6 Member. It can be observed under the microscope that the debris particles have obvious fixed distribution characteristics. Also, the particles are usually in close concavo-convex line contacts. Some of the rigid particles are crushed and broken. After bending deformation, plastic minerals (such as mudstone debris and mica) are squeezed into intergranular pores to form pseudo-matrix, which in turn leads to a large reduction in the quanty of original pores of the reservoir (Figures 3B,C).
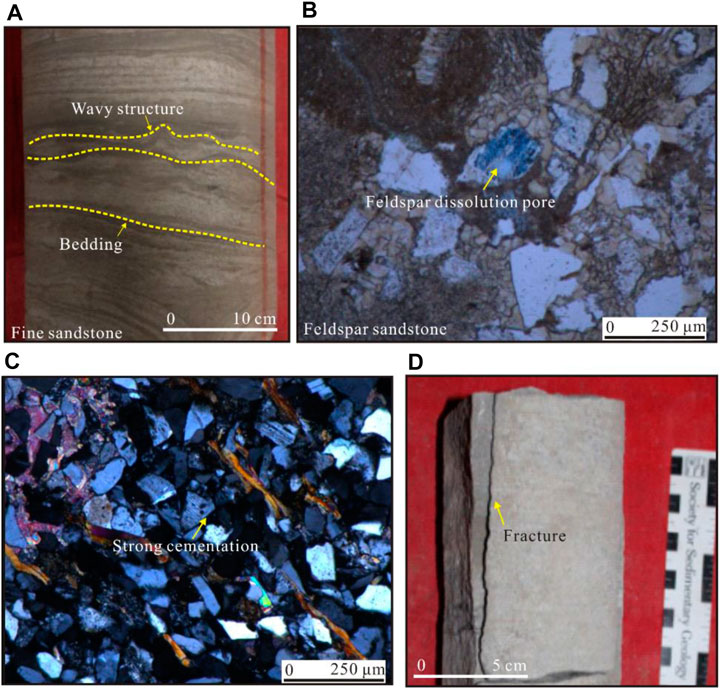
FIGURE 3. Core and thin section observations of the target formation (Chang 6 Member) in the study area. (A) Well A1, 1707.87 m, wavy and lenticular bedding; (B) Well A2, 1840 m, feldspar dissolution pores; (C) Well B1, 1739 m, strongly cemented feldspar sandstone; (D) Well B2, 623 m, vertical fracture.
The dissolution types in the Chang 6 reservoir in the study area include the dissolutions of clastic minerals (quartz, feldspar, debris and mica), matrix and authigenic minerals (such as calcium). Among them, feldspar dissolution is the most common, which can significantly improve the petrophysical properties of the reservoir (Figure 3B).
The cementation types in the Chang 6 Member include clay, siliceous, calcareous and feldspar cementations (Figure 3C). Clay cements include kaolinite, illite and chlorite, and their content is 1–9%, with an average of 2.85%. The clay cements usually grow perpendicular to the pore surface and toward the pore center. The contents of siliceous cements range from 0 to 0.5%, with an average of 0.1%. They are mainly derived from montmorillonite, illite and pressure solution process. The contents of carbonate cements range from 0.5 to 30%, with an average of 6.05%. The carbonate cements are dominated by iron calcite components. In addition, fractures are also developed in the Chang 6 Member, and these fractures are mainly vertical fractures with shearing properties (Figure 3D). Fractures can significantly improve the seepage capacity of the reservoir.
Through the analysis of diagenesis of Chang 6 sandstones in the Yanchang Formation, it can be seen that the clastic particles in the Chang 6 sand bodies are mainly in line contacts. Moreover, iron carbonate minerals and authigenic quartz crystals are relatively developed, and Type I quartz overgrowth is common. Under the microscope, pores are always filled with kaolinite, and hair-like aggregates of illite and chlorite envelope can be seen as well. Moreover, the reservoir spaces of the target reservoir are mainly composed of primary intergranular and dissoltion pores, and carbonate cement dissolution pores can be seen as well. However, the dissolution effect of the target layer is not too strong. Based on the comprehensive information, the sandstone reservoir of the Chang 6 Member in the study area is in the mid-diagenetic A stage.
According to the microseismic fracture monitoring, the three-dimensional spatial distribution information of the fractures can be obtained (Figure 4). In this study, there are a total of six base station observation stations from A to F for microseismic fracture monitoring. In this way, the extension direction, length and height of the fractures can be observed in an all-round and intuitive manner.
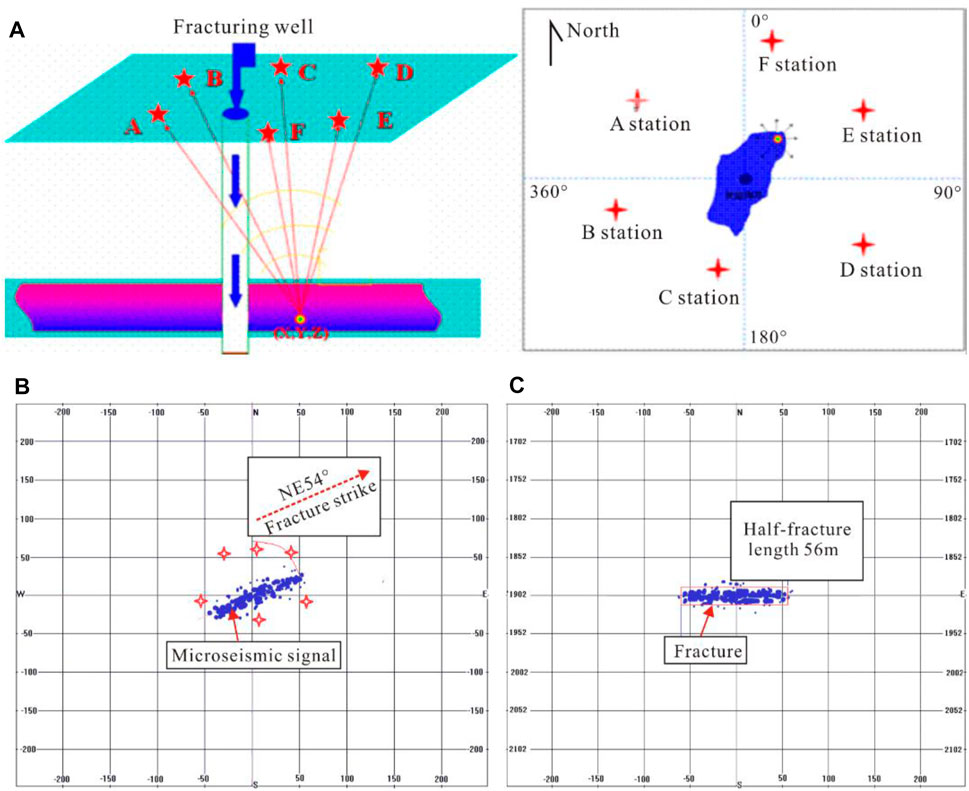
FIGURE 4. Microseismic fracture monitoring of Well N1. (A) Distribution of 6 seismic monitoring stations; (B) Main strike of hydraulic fractures; (C) Half-length of hydraulic fractures.
The shape and spatial distribution of hydraulic fractures in the fractured segment of Well N1 are shown in Figure 4C. It can be seen that the fracture spreads along the NE45° direction, the half-length of the fractures is 56 m, and the height of the fractures is 20 m. Statistics show that the natural fractures in the Chang 6 Member of the study area are mainly distributed along the direction of NE40°∼70°. In addition, the maximum principal stress of the Chang 6 Member is in the NE direction. Therefore, fracturing along the NE direction can achieve the best fracturing effect.
The comparison of hydraulic fracture parameters obtained based on microseismic monitoring and fracturing simulation is shown in Figure 5. FracPT software was used for hydraulic fracturing simulation. It can be seen that the fracture simulation results are in good agreement with the microseismic monitoring interpretation. The length and height of the hydraulic fractures obtained from the simulation are well consistent with the measured results, and the relative error of the calculated results is less than 5% (Figure 5). Therefore, the fracture simulation results in this study are reliable.
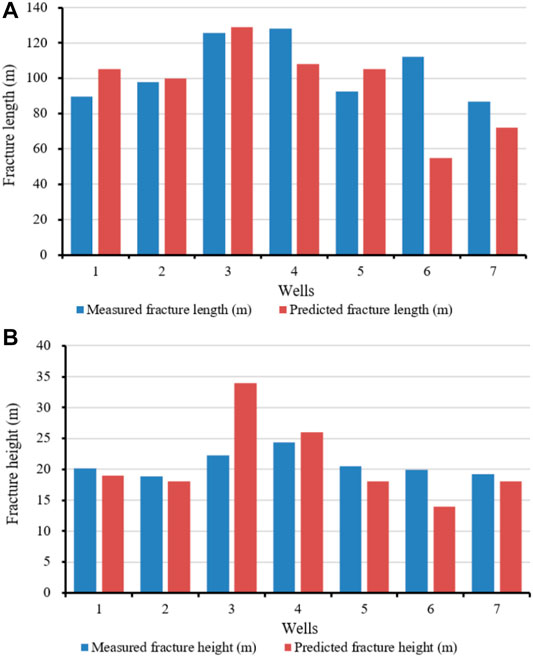
FIGURE 5. Comparison of hydraulic fracture parameters for fracturing simulation and microseismic monitoring. (A) Distribution of fracture length; (B) Distribution of fracture height.
The tight sandstone reservoirs of Chang 6 Member in the study area are developed by water injection (Liu et al., 2020; Hower and Groppo, 2021). The injection of water can increase the energy of the formation, thereby displacing the crude oil. The main factor that determines the quality of fracturing construction is the optimal selection of fracturing reconstruction measures, that is, the improvement of fracturing construction technology and the optimization of fracturing parameters. In this study, the effects of pre-fluid, sand-carrying fluid and displacement on the fracturing effect were analyzed.
The difference between the pre-fluid and the sand-carrying fluid is that the pre-fluid does not contain proppant, while their other conditions are exactly the same (Mahmoodi et al., 2019; Li and Li., 2021; Zhao et al., 2021). The main function of the pre-fluid is to press open the formation under the action of a large pressure, thereby providing space for the subsequent injected sand-carrying fluid. The optimum amount of pad fluid is when the pump injection is complete, the pad fluid is just completely filtered off into the formation and forms good fracture support. Furthermore, a higher conductivity can be maintained (Peng et al., 2018; Zhang et al., 2020; Qie et al., 2021; Yang et al., 2021).
The pre-fluid has a certain influence on the fracture morphology. Excessive pre-fluid will overextend the fracture length and narrow the fracture width, thus reducing the proppant laying concentration. Large amounts of fracturing fluid leaching into the formation can cause damage to the formation (Santosh and Feng, 2020; Zang et al., 2020; Wang and Wang, 2021). If the amount of pre-fluid is too small, the fracture length cannot meet the design requirements, and sand plugging may occur, resulting in economic losses.
The amount of pre-fluid affects the length and width of hydraulic fractures and the laying concentration of proppants. Generally, the volume of pre-fluid in reservoirs with poor petrophysical properties should not be too large. The pre-fluid volume of the Chang 6 Member in the study area is mainly 10–30 cubic meters. It can be seen from Figure 6A that the amount of pre-fluid has a certain relationship with the amount of fluid produced after fracturing. Theoretically, for reservoirs with better petrophysical properties, the larger the amount of pre-fluid, the larger the scale of fractures, and the greater the probability of obtaining larger test oil production. However, for reservoirs with poor physical properties, the amount of pre-fluid should not be too large. If it exceeds a certain range, it will damage the reservoir, which is not conducive to improving the production of fracturing oil testing.
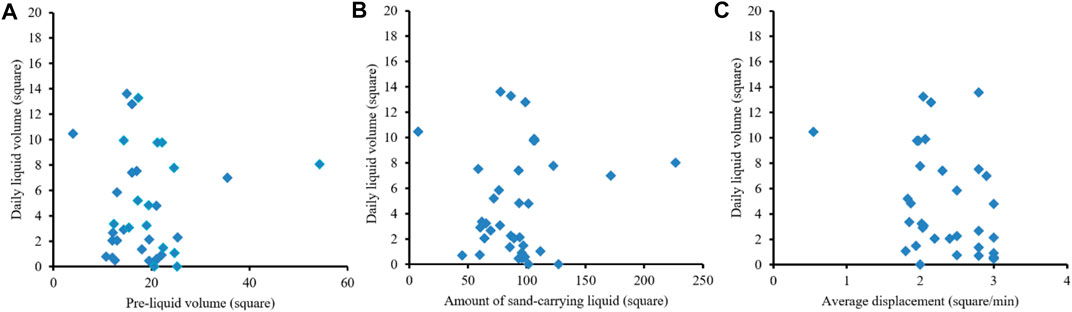
FIGURE 6. Effects of pre-fluid volume, sand-carrying fluid and displacement on fluid production during fracturing. (A) Pre-liquid volume and daily liquid volume; (B) Amount of sand-carrying liquid and daily liquid volume; (C) Average displacement and daily liquid volume.
The sand-carrying fluid is injected into the formation after the fore-fluid has opened the formation. It carries the proppant into the fractures, thereby increasing the conductivity of oil and gas (Bhatti et al., 2020; Bello et al., 2021; Guo et al., 2021). Then, the amount of sand-carrying fluid is also crucial to the fracturing effect. The amount of sand-carrying liquid is affected by the amount of sand added and the sand ratio. The greater the amount of sand-carrying liquid, the lower the laying concentration, and the larger the amount of sand-carrying liquid, the less effective the fracturing. Statistics show that the amount of sand-carrying liquid in the Chang 6 member of the study area is mainly in the range of 50–130 cubic meters (Figure 6B).
In addition, displacement also has a significant effect on the size of the reservoir being reformed. Excessive displacement will make the upper and lower extension heights of hydraulic fractures too high, which is not conducive to laying of proppants. Excessive displacement affects the propping efficiency of the proppants and the conductivity of hydraulic fractures, and also increases the friction of the formation. It has a detrimental effect on fracturing equipments. Too low displacement is not conducive to the sand-carrying effect of fracturing fluid, especially in the case of high sand ratio. In addition to this, low displacement increases the fracturing construction time. The fracturing displacement of the Chang 6 Member in the study area is mainly 1.5–3.0 cubic meters per minute (Figure 6C).
In general, for reservoirs with good petrophysical properties, the larger the displacement, the larger the scale of hydraulic fractures and the higher the productivity. However, for reservoirs with poor petrophysical properties, if the fracturing displacement is too large, the hydraulic fracture height will be larger. In this case, the hydraulic fractures may also penetrate the formation, so the displacement should also be properly controlled.
In this study, the effect of natural fractures on the fracturing effect was analyzed. When natural fractures exist, the fracturing morphology under the combined conditions of injection and production wells is shown in Figure 7. In Figure 7A, the fracturing direction is parallel to the main strike (NE45°) of natural fractures, and in Figure 7B, the fracturing direction is perpendicular to the main strike (NE45°) of natural fractures. The simulation results show that the extension distance of the hydraulic fractures parallel to the main fracture strike is long and the fracturing scale is large. In addition, when the fracture is deflected to the injection well to a certain extent, it spreads in the direction away from the injection well. During the whole fracturing process, the pore pressure changed stably and steadily expanded from the water injection area to the fracturing area of the oil well (Figure 7). According to the statistical results, the length of hydraulic fractures when fracturing parallel to the main strike of natural fractures is 1.3 times of that when they are perpendicular to the strike of natural fractures.
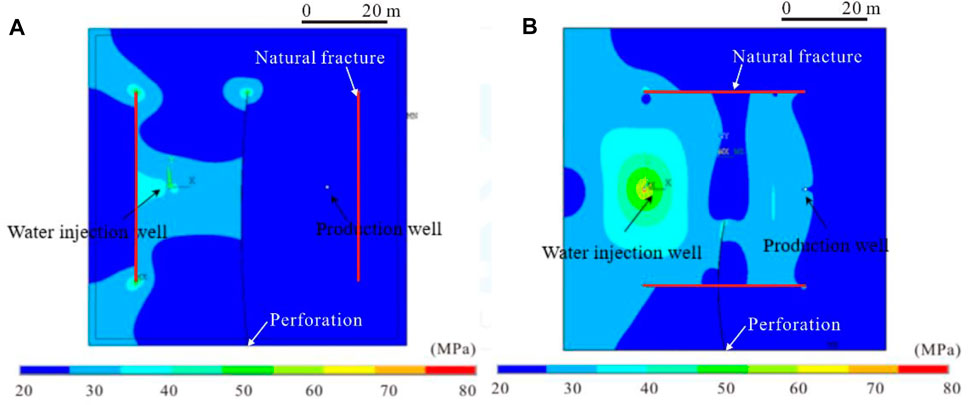
FIGURE 7. Hydraulic fracturing effect under the condition that the fracturing direction is parallel or perpendicular to the main strike of natural fractures. (A) The fracturing direction is parallel to the main strike of natural fractures; (B) the fracturing direction is perpendicular to the main strike of natural fractures.
When the main strike of natural fractures is orthogonal to the fracturing direction, the results of hydraulic fracture expansion are shown in Figure 8. In such cases, the extension distance of the hydraulic fractures is short, the scale of fracturing expansion is small, but the opening is wide. The fractures were also deflected to some extent towards the injection well. During the whole fracturing process, the change of pore pressure is unstable, which is not conducive to the uniform advancement of the injected water to the oil well, and it is easy to form water channeling (Figure 8). Statistical results show that when the fracturing is oblique to the main strike of natural fractures, the length of the hydraulic fractures is half of the hydraulic fractures parallel to the main strike of natural fractures.
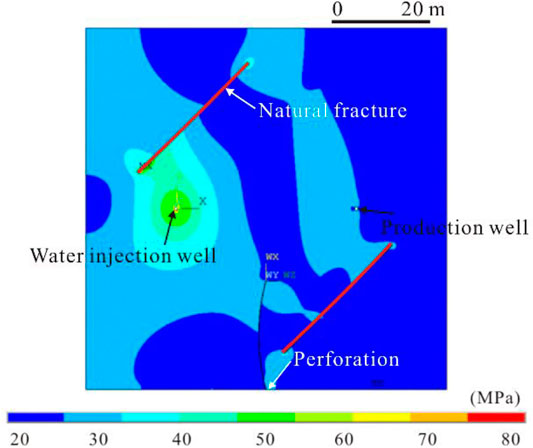
FIGURE 8. Effect of hydraulic fracturing under the condition that the fracturing direction is oblique to the main strike of natural fractures.
The correlations between fracturing construction and hydraulic fracture parameters are shown in Figure 9. Some fracturing construction parameters, such as pre-fluid and sand-carrying fluid, have a good positive correlation with the simulated fracture length, height and width (Figures 9A–D). However, the correlation between displacement and fracture length, especially fracture height, was not significant (Figures 9E,F). Figure 9E shows a weak correlation due to several high-displacement and low-fracture-length points. This shows that the excessively high displacement cannot effectively increase the volume of fracturing.
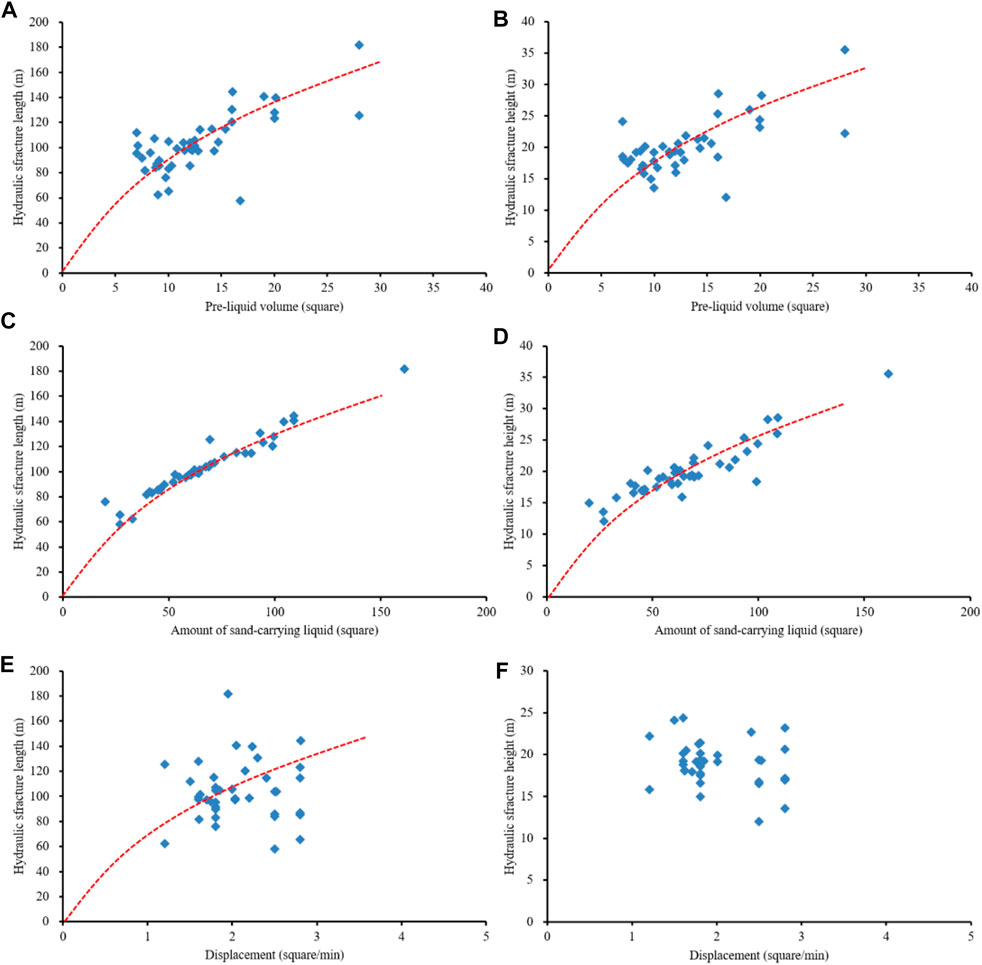
FIGURE 9. Relationship between fracturing construction parameters and hydraulic fracture parameters. (A) Pre-liquid volume and hydraulic fracture length; (B) Pre-liquid volume and hydraulic fracture height; (C) Amount of sand-carrying liquid and hydraulic fracture length; (D) Amount of sand-carrying liquid and hydraulic fracture height; (E) Displacement and hydraulic fracture length; (F) Displacement and hydraulic fracture height.
Further, we compared the simulated hydraulic fracture morphologies under different displacements (Figure 10). The results show that in the process of displacement changed from 0 to 2 cubic meters/min, the fracture length and height gradually increased; however, when the displacement was greater than 2 cubic meters/min, the reservoir reformed volume didn’t increase significantly. Excessive displacement will also cause hydraulic fractures to penetrate the adjacent layers, so the displacement should be controlled at 2∼3 cubic meters/min, and the sand ratio should be controlled at 25%. For the tight sandstone of the Chang 6 Member in the study area, the optimized fracture half-length is 120 m and the half-fracture height is 20 m.
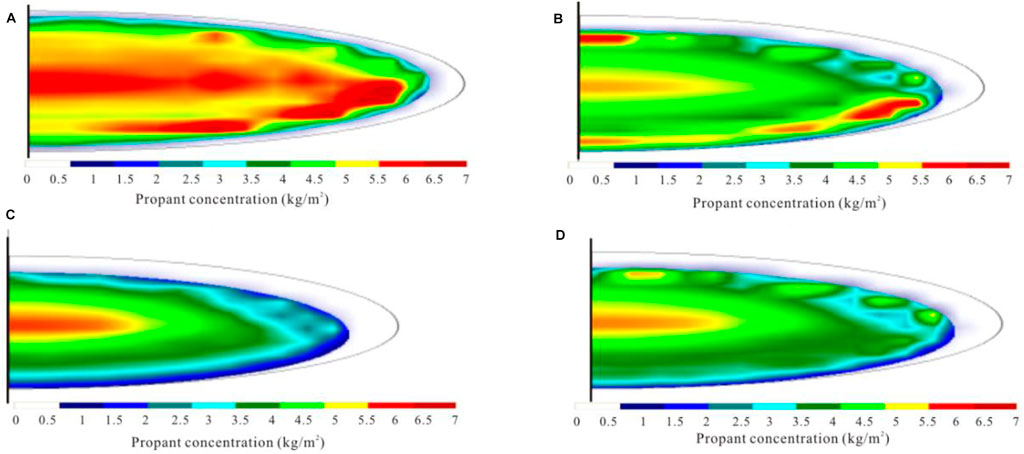
FIGURE 10. Simulation results of hydraulic fracture morphology under different displacement conditions in Well A1. (A) 1.0 m3/min; (B) 2.0 m3/min; (C) 3.0 m3/min; (D) 4.0 m3/min.
The fracture height should be effectively controlled during the fracturing process of tight reservoirs. Generally, the main means of controlling fracture height include: high in-situ stress barrier, reducing fracturing fluid viscosity, and reducing displacement. The horizontal minimum principal stress difference between the fracturing layer and the shielding layer is the most significant factor affecting the fracture height. Artificial “floating temporary plugging agent” or “settling temporary plugging agent” is to use artificial barrier to control the fracture height. When the stress difference is greater than 2 MPa, hydraulic fractures are generally not easy to penetrate the formation. Figure 11 shows the effect of the stress difference and elastic modulus of the fracturing layer and the shielding layer on the fracture height. It can be seen that the greater the stress difference between the fracturing layer and the shielding layer, the lower the elastic modulus, and the easier it is to control the fracture height.
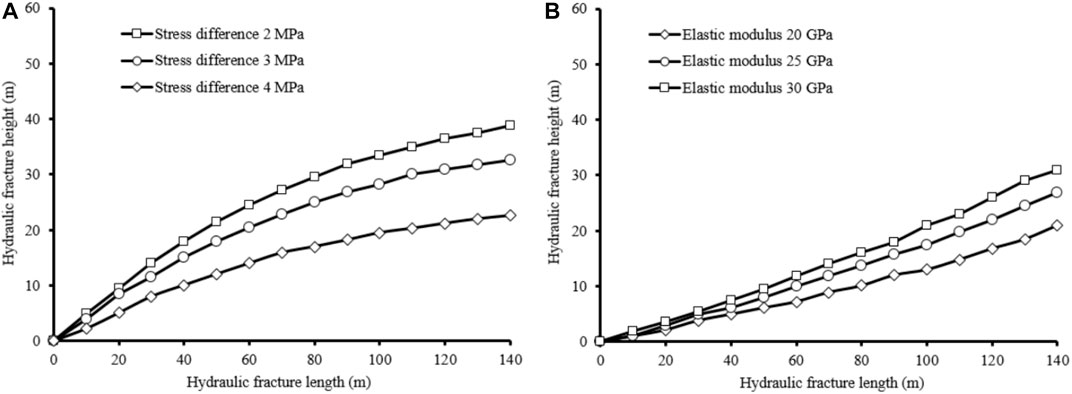
FIGURE 11. Influence of in-situ stress and elastic modulus on hydraulic fracture height. (A) The influence of the stress difference between the fracturing layer and the shielding layer on the hydraulic fracture height; (B) The influence of the elastic modulus on the extension scale of the hydraulic fracture height.
Well spacing optimization requires the determination of the ultimate recovery factor first. The empirical formulas for ultimate recovery of tight oil sandstone reservoirs are:
where ER is the recovery factor; k is the average absolute permeability; µo is the viscosity of crude oil in the original formation; ϕ is the effective porosity of the formation; S is the well pattern density; and Wf is the degree of water flooding control.
According to the above formulas, the water flooding recovery factors of the Chang 6 Member are 15.8, 7.3 and 37.4%, respectively, and the average value is 20.2%. Based on the actual data of 144 oil fields or development units in China, Beijing Petroleum Exploration and Development Research Institute has calculated the coupling relationship between ultimate recovery factor and well pattern density according to fluid mobility in tight reservoirs (Figure 12). Since fractures are relatively developed in the tight sandstone reservoirs of the Chang 6 Member, the well spacing is appropriately widened. Finally, the optimized well spacing and row spacing of Chang 6 Member are 480 and 150 m, respectively.
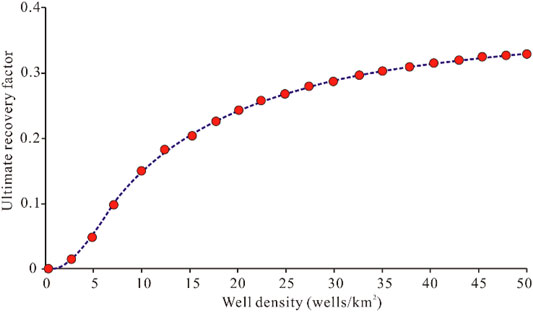
FIGURE 12. Relationship between well pattern density and ultimate recovery factor.
In order to improve the development effect of tight oil reservoirs, the injection-production well pattern and fracture system need to achieve a reasonable configuration system. The direction of well rows should be parallel to the main strike of natural fractures. Deploying wells parallel to the fracture strike can realize water injection of fracture-parallel direction and oil displacement of fracture-perpendicular direction.
The well pattern deployment forms suitable for tight oil sandstone reservoirs mainly include the reverse five-point, seven-point and nine-point methods. Among them, the inverse five-point method is suitable for low-amplitude area reservoirs with weak development of natural fractures. When the matrix permeability is strong, and the water absorption capacity of the water injection well is equivalent to the liquid production capacity of the oil production well, the square inverse five-point method is suitable. When the matrix permeability is weak, and the water absorption capacity of the water injection well is not equivalent to the liquid production capacity of the oil production well, the rectangular reverse five-point method is more suitable.
The reverse seven-point injection-production well pattern is suitable for reservoirs with relatively developed natural fractures with a fixed strike. When the water absorption capacity of the water injection well is greater than twice that of the oil production well, the reverse seven-point method is most suitable.
The reverse nine-point injection-production well pattern is suitable for low-amplitude structural areas where natural fractures are generally less developed. The line connecting the water injection well and the well angle should be parallel to the fracture trend, so as to enlarge the injection-production well spacing in the fracture direction or reduce the row spacing. In this way, the fracturing scale and productivity can be increased.
Figure 13 shows the variation of formation pressure around the well under different production cycle conditions under the reverse five-point well pattern. It can be seen that a pressure drop funnel is formed around the oil well, and the hydrocarbon pressure inrushes along the fracture direction. As the development cycle increases, the formation pressure decreases gradually (Figure 13).
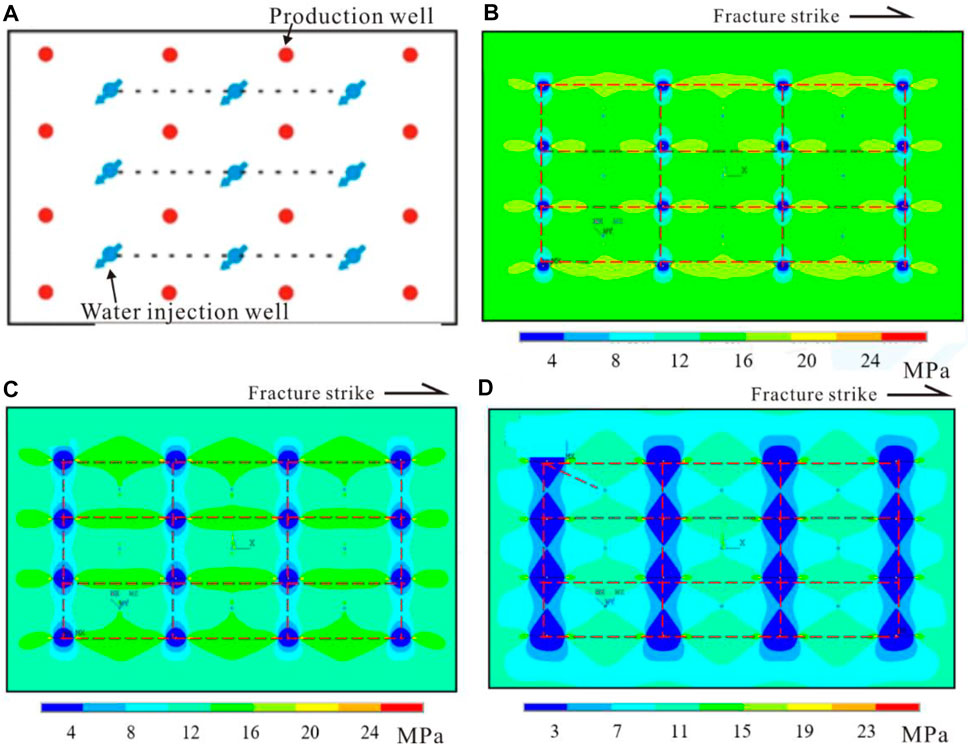
FIGURE 13. Simulation results of pressure changes at different times based on well pattern design of reverse five -point method. (A) Reverse five-point well pattern design; (B) Pressure change after 10 years; (C) Pressure change after 20 years; (D) Pressure change after 30 years.
For the reverse seven-point and nine-point well patterns, the stress changes around the well in different production periods have similar characteristics. Combining the actual production capacity of different types of well patterns, it is found that the initial productivity of the anti-seven and anti-nine point well patterns is high, but its productivity declines relatively quickly for fractured reservoirs. The comparison results show that the production capacity of the reservoir with the reverse five-spot well pattern is relatively stable. Therefore, the reverse five-spot well pattern is more suitable for the efficient development of the continental tight oil reservoirs in the Chang 6 Member of the Yanchang Formation.
1) Natural fractures have a significant effect on the extension of hydraulic fractures. When the fracturing is parallel to the main strike of natural fractures, the extension distance of the fracturing fracture is long and the scale of fracturing expansion is large; while when the fracturing is orthogonal or oblique to the strike of natural fractures, the extension distance of the hydraulic fracture is significantly reduced.
2) Statistics show that the average length of hydraulic fractures when fracturing parallel to natural fractures is 1.3 times of that when fracturing perpendicular to natural fractures. In addition, the optimization results of fracturing parameters show that the displacement should be controlled at 2–3 cubic meters/min, and the sand ratio should be controlled at 25%. The smaller the horizontal minimum principal stress difference between the fracturing layer and the shielding layer, the lower the elastic modulus, and the easier it is to control the fracture height.
3) Microseismic monitoring results show that the half-fracture length and fracture height of fractures are mainly distributed in 80–140 m and 15–25 m, respectively. Finally, we optimized the fracturing construction parameters, and the optimized fracture half-length was 120 m and the half-fracture height was 20 m.
4) Finally, the well pattern of the target layer is optimized considering natural fractures. Through this study, we found that the reverse five-spot well pattern is suitable for the efficient development of tight oil reservoirs of the Chang 6 member in this area.
The original contributions presented in the study are included in the article/Supplementary Material, further inquiries can be directed to the corresponding author.
JL is responsible for the idea and writing of this paper and ZZ, HT, JY, XZ, and BW are responsible for the data interpretation.
This research was financially supported by the Forward Looking Basic Strategic Technology Research Projects of China National Petroleum Corporation (Study on Reservoir Forming Law and the Key Technology of Lithologic Stratigraphic Reservoirs) (No. 2021DJ0406).
Authors ZZ and XZ were employed by the PetroChina Changqing Oilfield Company and authors HT, JY, and BW were employed by the PetroChina Yumen Oilfield Company.
The remaining author declares that the research was conducted in the absence of any commercial or financial relationships that could be construed as a potential conflict of interest.
All claims expressed in this article are solely those of the authors and do not necessarily represent those of their affiliated organizations, or those of the publisher, the editors and the reviewers. Any product that may be evaluated in this article, or claim that may be made by its manufacturer, is not guaranteed or endorsed by the publisher.
Abouzar, M., and Ghanbarian, B. (2021). A New Methodology for Grouping and Averaging Capillary Pressure Curves for Reservoir Models. Energ. Geosci. 2 (1), 52–62. doi:10.1016/j.engeos.2020.09.001
Bello, A. M., Jones, S., Gluyas, J., Acikalin, S., and Cartigny, M. (2021). Role Played by clay Content in Controlling Reservoir Quality of Submarine Fan System, Forties Sandstone Member, Central Graben, North Sea. Mar. Pet. Geology. 128, 105058. doi:10.1016/j.marpetgeo.2021.105058
Bhatti, A. A., Ismail, A., Raza, A., Gholami, R., Rezaee, R., Nagarajan, R., et al. (2020). Permeability Prediction Using Hydraulic Flow Units and Electrofacies Analysis. Energ. Geosci. 1, 81–91. doi:10.1016/j.engeos.2020.04.003
Chitrala, Y., Moreno, C., Sondergeld, C., and Rai, C. (2013). An Experimental Investigation into Hydraulic Fracture Propagation under Different Applied Stresses in Tight Sands Using Acoustic Emissions. J. Pet. Sci. Eng. 108, 151–161. doi:10.1016/j.petrol.2013.01.002
Ding, F., Xie, C., Zhou, X., Jiang, C., Li, K., Wan, L., et al. (2021). Defining Stratigraphic Oil and Gas Plays by Modifying Structural Plays: A Case Study from the Xihu Sag, east China Sea Shelf Basin. Energ. Geosci. 2 (1), 41–51. doi:10.1016/j.engeos.2020.08.002
Dong, S., Zeng, L., Lyu, W., Xia, D., Liu, G., Wu, Y., et al. (2020). Fracture Identification and Evaluation Using Conventional Logs in Tight Sandstones: A Case Study in the Ordos Basin, China. Energ. Geosci. 1 (3–4), 115–123. doi:10.1016/j.engeos.2020.06.003
Du, Y., and Aydin, A. (1993). The Maximum Distortional Strain Energy Density Criterion for Shear Fracture Propagation with Applications to the Growth Paths ofEn Échelonfaults. Geophys. Res. Lett. 20, 1091–1094. doi:10.1029/93gl01238
Gao, F. Q. (2021). Influence of Hydraulic Fracturing of strong Roof on Mining-Induced Stress Insight from Numerical Simulation. J. Mining Strata Control. Eng. 3 (2), 023032. doi:10.13532/j.jmsce.cn10-1638/td.20210329.001
Guo, L. L., Zhou, D. W., Zhang, D. M., and Zhou, B. H. (2021). Deformation and Failure of Surrounding Rock of a Roadway Subjected to Mining-Induced Stresses. J. Mining Strata Control. Eng. 3 (2), 023038. doi:10.13532/j.jmsce.cn10-1638/td.20200727.001
Gurocak, Z., Solanki, P., Alemdag, S., and Zaman, M. M. (2012). New Considerations for Empirical Estimation of Tensile Strength of Rocks. Eng. Geology. 145-146, 1–8. doi:10.1016/j.enggeo.2012.06.005
He, X., Zhang, P., He, G., Gao, Y., Liu, M., Zhang, Y., et al. (2020). Evaluation of Sweet Spots and Horizontal-Well-Design Technology for Shale Gas in the basin-margin Transition Zone of southeastern Chongqing, SW China. Energ. Geosci. 1, 134–146. doi:10.1016/j.engeos.2020.06.004
Hong, D., Cao, J., Wu, T., Dang, S., Hu, W., and Yao, S. (2020). Authigenic clay Minerals and Calcite Dissolution Influence Reservoir Quality in Tight Sandstones: Insights from the central Junggar Basin, NW China. Energ. Geosci. 1 (1–2), 8–19. doi:10.1016/j.engeos.2020.03.001
Hower, J. C., and Groppo, J. G. (2021). Rare Earth-Bearing Particles in Fly Ash Carbons: Examples from the Combustion of Eastern Kentucky Coals. Energ. Geosci. 2 (2), 90–98. doi:10.1016/j.engeos.2020.09.003
Jaeger, J. C., and Cook, N. G. W. (1976). Fundamentals of Rock Mechanics. London: Chapman & Hall, 128–130.
Khan, E. U., Saleem, M., Naseem, A. A., Ahmad, W., Yaseen, M., and Khan, T. U. (2020). Microfacies Analysis, Diagenetic Overprints, Geochemistry, and Reservoir Quality of the Jurassic Samanasuk Formation at the Kahi Section, Nizampur Basin, NW Himalayas, Pakistan. Carbonates Evaporites 35 (3), 95–96. doi:10.1007/s13146-020-00622-4
Li, L., Huang, B., Li, Y., Hu, R., and Li, X. (2018). Multi-scale Modeling of Shale Laminas and Fracture Networks in the Yanchang Formation, Southern Ordos Basin, China. Eng. Geology. 243, 231–240. doi:10.1016/j.enggeo.2018.07.010
Li, L., and Li, S. J. (2021). Evolution Rule of Overlying Strata Structure in Repeat Mining of Shallow Close Distance Seams Based on Schwarz Alternating Procedure. J. Mining Strata Control. Eng. 3 (2), 023515. doi:10.13532/j.jmsce.cn10-1638/td.20210225.001
Li, Y., Zhou, D., Wang, W., Jiang, T., and Xue, Z. (2020). Development of Unconventional Gas and Technologies Adopted in China. Energ. Geosci. 1 (1–2), 55–68. doi:10.1016/j.engeos.2020.04.004
Li, Z. M., and Zhang, J. C. (1997). Crustal Stress and Hydrocarbon Exploration and Development. Beijing: Petroleum Industry Press, 138–140.
Liu, Y., Gao, M., and Zhao, H. (2020). Detection of Overlying Rock Structure and Identification of Key Stratum by Drilling and Logging Technology. J. Mining Strata Control. Eng. 2 (2), 023038. doi:10.13532/j.jmsce.cn10-1638/td.2020.02.004
Lommatzsch, M., Exner, U., Gier, S., and Grasemann, B. (2015). Dilatant Shear Band Formation and Diagenesis in Calcareous, Arkosic Sandstones, Vienna Basin (Austria). Mar. Pet. Geology. 62, 144–160. doi:10.1016/j.marpetgeo.2015.02.002
Luo, Y., Huang, H., Yang, Y., Hao, Y., Zhang, S., and Li, Q. (2018). Integrated Prediction of deepwater Gas Reservoirs Using Bayesian Seismic Inversion and Fluid Mobility Attribute in the South China Sea. J. Nat. Gas Sci. Eng. 59, 56–66. doi:10.1016/j.jngse.2018.08.019
Ma, S. W., Ren, D. Z., Zhou, L. F., Dong, F. J., Shi, S., Mumuni, A., et al. (2019). Impacts of Diagenesis of Tight sandstone Gas Reservoir on Reservoir Physical Properties: A Case Study, Sulige Gas Field, Ordos Basin, China. Interpretation 7 (3), 1–4. doi:10.1190/int-2018-0173.1
Mahmoodi, S., Abbasi, M., and Sharifi, M. (2019). New Fluid Flow Model for Hydraulic Fractured wells with Non-uniform Fracture Geometry and Permeability. J. Nat. Gas Sci. Eng. 68, 1–14. doi:10.1016/j.jngse.2019.102914
Mahmud, H., Hisham, M., Mahmud, M., Leong, V., and Shafiq, M. (2020). Petrophysical Interpretations of Subsurface Stratigraphic Correlations, Baram Delta, Sarawak, Malaysia. Energ. Geosci. 1 (3–4), 100–114. doi:10.1016/j.engeos.2020.04.005
McBride, E. F. (1989). Quartz Cement in Sandstones: A Review. Earth-Science Rev. 26, 69–112. doi:10.1016/0012-8252(89)90019-6
Peng, J., Wong, L. N. Y., and Teh, C. I. (2018). A Re-examination of Slenderness Ratio Effect on Rock Strength: Insights from DEM Grain-Based Modelling. Eng. Geology. 246, 245–254. doi:10.1016/j.enggeo.2018.10.003
Qie, L., Shi, Y. N., and Liu, J. S. (2021). Experimental Study on Grouting Diffusion of Gangue Solid Filling Bulk Materials. J. Mining Strata Control. Eng. 3 (2), 023011. doi:10.13532/j.jmsce.cn10-1638/td.20201111.001
Salamon, M. D. G. (1984). Energy Considerations in Rock Mechanics: Fundamental Results. J. South. Afr. Inst. Min. Metall. 84, 233–246.
Santosh, M., and Feng, Z. Q. (2020). New Horizons in Energy Geoscience. Energ. Geosci. 1 (1–2), 1–2. doi:10.1016/j.engeos.2020.05.005
Shuai, Y., Zhang, S., Mi, J., Gong, S., Yuan, X., Yang, Z., et al. (2013). Charging Time of Tight Gas in the Upper Paleozoic of the Ordos Basin, central China. Org. Geochem. 64, 38–46. doi:10.1016/j.orggeochem.2013.09.001
Wang, J., and Wang, X. L. (2021). Seepage Characteristic and Fracture Development of Protected Seam Caused by Mining Protecting Strata. J. Mining Strata Control. Eng. 3 (3), 033511. doi:10.13532/j.jmsce.cn10-1638/td.20201215.001
Wang, M., Yang, Z., Shui, C., Yu, Z., Wang, Z. Y., and Cheng, Y. (2019). Diagenesis and its Influence on Reservoir Quality and Oil-Water Relative Permeability: A Case Study in the Yanchang Formation Chang 8 Tight sandstone Oil Reservoir, Ordos Basin, China. Open Geosciences 11 (1), 37–47. doi:10.1515/geo-2019-0004
Xi, K., Cao, Y., Liu, K., Wu, S., Yuan, G., Zhu, R., et al. (2019). Diagenesis of Tight sandstone Reservoirs in the Upper Triassic Yanchang Formation, Southwestern Ordos Basin, China. Mar. Pet. Geology. 99, 548–562. doi:10.1016/j.marpetgeo.2018.10.031
Xue, F., Liu, X. X., and Wang, T. Z. (2021). Research on Anchoring Effect of Jointed Rock Mass Based on 3D Printing and Digital Speckle Technology. J. Mining Strata Control. Eng. 3 (2), 023013. doi:10.13532/j.jmsce.cn10-1638/td.20201020.001
Yang, J. X., Luo, M. K., Zhang, X. W., Huang, N., and Hou, S. J. (2021). Mechanical Properties and Fatigue Damage Evolution of Granite under Cyclic Loading and Unloading Conditions. J. Mining Strata Control. Eng. 3 (3), 033016. doi:10.13532/j.jmsce.cn10-1638/td.20210510.001
Yin, S., Lv, D., and Ding, W. (2018). New Method for Assessing Microfracture Stress Sensitivity in Tight sandstone Reservoirs Based on Acoustic Experiments. Int. J. Geomechanics 18 (4), 1–11. doi:10.1061/(asce)gm.1943-5622.0001100
Yin, S., and Wu, Z. (2020). Geomechanical Simulation of Low-Order Fracture of Tight sandstone. Mar. Pet. Geology. 100, 1–10. doi:10.1016/j.marpetgeo.2020.104359
Yoshida, M., and Santosh, M. (2020). Energetics of the Solid Earth: An Integrated Perspective. Energ. Geosci. 1, 28–35. doi:10.1016/j.engeos.2020.04.001
Zang, D., Bao, Z., Li, M., Fu, P., Li, M., Niu, B., et al. (2020). Sandbody Architecture Analysis of Braided River Reservoirs and Their Significance for Remaining Oil Distribution: A Case Study Based on a New Outcrop in the Songliao Basin, Northeast China. Energy Exploration & Exploitation 38 (6), 2231–2251. doi:10.1177/0144598720951280
Zhang, B., Shen, B., and Zhang, J. (2020). Experimental Study of Edge-Opened Cracks Propagation in Rock-like Materials. J. Mining Strata Control. Eng. 2 (3), 033035. doi:10.13532/j.jmsce.cn10-1638/td.20200313.001
Zhang, S., Huang, H., Dong, Y., Yang, X., Wang, C., and Luo, Y. (2017). Direct Estimation of the Fluid Properties and Brittleness via Elastic Impedance Inversion for Predicting Sweet Spots and the Fracturing Area in the Unconventional Reservoir. J. Nat. Gas Sci. Eng. 45, 415–427. doi:10.1016/j.jngse.2017.04.028
Zhao, K. K., Jiang, P. F., Feng, Y. J., Sun, X. D., Cheng, L. X., and Zheng, J. W. (2021). Investigation of the Characteristics of Hydraulic Fracture Initiation by Using Maximum Tangential Stress Criterion. J. Mining Strata Control. Eng. 3 (2), 023520. doi:10.13532/j.jmsce.cn10-1638/td.20201217.001
Zhao, Z., Wu, K., Fan, Y., Guo, J., Zeng, B., and Yue, W. (2020). An Optimization Model for Conductivity of Hydraulic Fracture Networks in the Longmaxi Shale, Sichuan basin, Southwest China. Energ. Geosci. 1, 47–54. doi:10.1016/j.engeos.2020.05.001
Zou, C. N., Yang, Z., Tao, S. Z., Yuan, X. J., Zhu, R. K., Hou, L. H., et al. (2013). Continuous Hydrocarbon Accumulation over a Large Area as a Distinguishing Characteristic of Unconventional Petroleum: The Ordos Basin, North-Central China. Earth-Science Rev. 126, 358–369. doi:10.1016/j.earscirev.2013.08.006
Keywords: tight oil sandstone, hydraulic fracturing, natural fractures, microseismic monitoring, numerical simulation
Citation: Liao J, Zhang Z, Tang H, Yang J, Zhang X and Wang B (2022) Simulation of Fracturing and Well Pattern Optimization of Fractured Tight Sandstone Reservoirs. Front. Earth Sci. 10:873617. doi: 10.3389/feart.2022.873617
Received: 11 February 2022; Accepted: 18 February 2022;
Published: 10 March 2022.
Edited by:
Wenlong Ding, China University of Geosciences, ChinaReviewed by:
Shaoke Feng, Chengdu University of Technology, ChinaCopyright © 2022 Liao, Zhang, Tang, Yang, Zhang and Wang. This is an open-access article distributed under the terms of the Creative Commons Attribution License (CC BY). The use, distribution or reproduction in other forums is permitted, provided the original author(s) and the copyright owner(s) are credited and that the original publication in this journal is cited, in accordance with accepted academic practice. No use, distribution or reproduction is permitted which does not comply with these terms.
*Correspondence: Jianbo Liao, bGpiMTc3M0AxMjYuY29t
Disclaimer: All claims expressed in this article are solely those of the authors and do not necessarily represent those of their affiliated organizations, or those of the publisher, the editors and the reviewers. Any product that may be evaluated in this article or claim that may be made by its manufacturer is not guaranteed or endorsed by the publisher.
Research integrity at Frontiers
Learn more about the work of our research integrity team to safeguard the quality of each article we publish.