
94% of researchers rate our articles as excellent or good
Learn more about the work of our research integrity team to safeguard the quality of each article we publish.
Find out more
ORIGINAL RESEARCH article
Front. Earth Sci., 25 March 2022
Sec. Atmospheric Science
Volume 10 - 2022 | https://doi.org/10.3389/feart.2022.873040
This article is part of the Research TopicENSO Nonlinearity and Complexity: Features, Mechanisms, Impacts and PredictionView all 14 articles
The reversal of winter surface air temperature anomalies (SATAs) over Central Asia (CA) between December and January is investigated in this study and found to be closely related to the sea surface temperature anomalies (SSTAs) over the central tropical Pacific (CTP). The cold CTP SSTAs can lead to positive (negative) SATAs over CA in December (January). The different responses of SATAs over CA to the SSTAs are attributed to different Rossby wave propagations. In December, a wave train from the North Pacific directly reaches CA, while in January it mainly propagates in the meridional direction and cannot reach CA. The January SATAs of CA are influenced by a wave train from the North Atlantic, which is induced by CTP SSTAs indirectly. The wave trains from the North Pacific are mainly driven by the Gill-type response to the cold CTP SSTA in both December and January. In January, since the climatological subtropical jet stream over the North Pacific is stronger and situated more towards the equator, a stronger Gill-type response is excited and causes the meridional propagation of the Rossby waves. Then, this stronger Gill-type response can cause strong zonal wind anomalies over the East Pacific. Local anomalies of the synoptic-scale transient eddy can be further caused by the zonal wind anomalies and travel eastward to the North Atlantic. The eddy-induced geopotential anomalies over the North Atlantic can further trigger Rossby waves and cause the negative SATAs over CA. Numerical simulations reproduce these mechanisms.
Central Asia (35°–65°N, 50°–100°E, CA), lying in the hinterland of the Eurasian continent and far from the ocean, is characterized by a typical continental climate (Lioubimtseva and Henebry 2009; Mirzabaev 2013; Li et al., 2015). During the winter season (November‒February), the surface air temperature (SAT) over CA not only reaches its minimum but also shows its largest variability in the annual cycle (Figure 1A). Variation of winter SAT over CA can cause severe damage in terms of population health (Grjibovski et al., 2013; Zafren 2013; Nyssanbayeva et al., 2019), livestock (Kerven et al., 2004) and environment (Darynova et al., 2018). Thus, further studies on the winter SAT over CA and its variability are necessary for the socioeconomic development of this region.
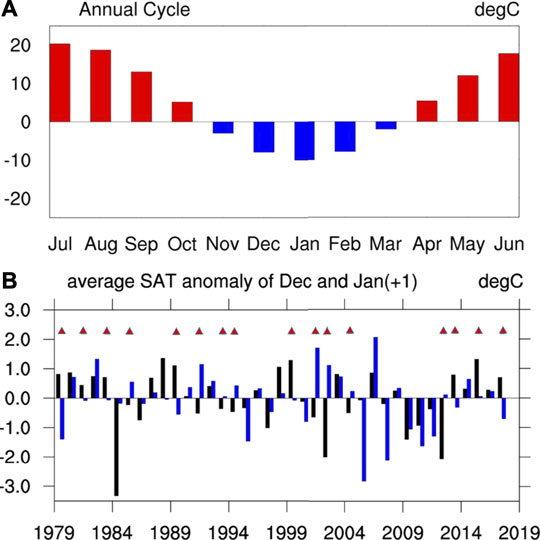
FIGURE 1. (A) Annual cycle of monthly mean SAT of CA (35°–65°N, 50°–100°E) (bars; °C) and its standard deviation (black line; °C) during the period 1979–2018 (B) Anomalies of monthly mean SAT of CA (°C) in December (black bars) and the following January (blue bars) during the period 1979–2018. The red triangles represent the year in which the December and following-January SATA are of opposite sign.
Previous studies have revealed that the leading mode of SAT anomalies (SATAs) over CA, as a part of the Eurasian continent, is characterized by a same-sign pattern in winter (Miyazaki and Yasunari 2008; Wu and Chen 2020). The variation of winter Eurasian SATAs is largely controlled by the large-scale atmospheric circulation and teleconnections over this region. As a critical semi-permanent winter system over the Eurasian continent, the Siberian high plays an important role (Cohen et al., 2001; Gong and Ho 2002; Kim et al., 2005; Wu et al., 2011). A strengthened Siberian high is associated with cooling over most of the Eurasian continent, which may be due to the associated change in the radiation condition and heat budget over this region (Cohen et al., 2001; Gong and Ho 2002). Previous studies have also found that the positive (negative) phase of the Arctic Oscillation (AO)/North Atlantic Oscillation (NAO) is associated with positive (negative) winter Eurasian SATAs (Hurrell and Van Loon 1997; Thompson and Wallace 2000; Cattiaux et al., 2010). In addition, Liu et al. (2014) pointed out that the three types of Eurasian (EU) patterns (i.e., the traditional EU pattern, Scandinavian pattern, and East Atlantic/West Russia pattern) can exert different influences on the Eurasian SATAs in winter.
Besides the atmospheric circulation and teleconnections, the Eurasian SATAs can also be affected by remote forcing, such as the El Niño–Southern Oscillation (ENSO) (Graf and Zanchettin 2012; Zhang et al., 2015; Feng et al., 2017; García-Serrano et al., 2017), sea surface temperature (SST) anomalies (SSTAs) over the North Atlantic (Liu et al., 2014; Wang et al., 2019; Chen et al., 2020), sea ice (Mori et al., 2014; Chen H. W. et al., 2016; Chen et al., 2019; Cohen et al., 2019), and snow cover (Cohen et al., 2001; Saito et al., 2001; Chen S. et al., 2016).
Zhang et al. (2015) and Feng et al. (2017) found that the central Pacific (CP) El Niño (La Niña) can lead to negative (positive) AO/NAO-like atmospheric responses with negative (positive) geopotential height anomalies over the subtropical Atlantic and Eurasia as well as a cooler (warmer) winter, and part of the mechanism can be explained by the tropospheric bridge according to Graf and Zanchettin (2012).
The role of North Atlantic SSTAs has been studied, revealing that through a sea-air interaction, the North Atlantic SSTAs can cause anomalous atmospheric circulation and Rossby wave trains and impact the Eurasian SATAs. For example, wave trains can be emanated by the North Atlantic SSTAs and directly influence the Eurasian SATAs (Liu et al., 2014; Chen et al., 2020); the North Atlantic SSTAs in preceding summer and autumn can impact the winter NAO pattern and subsequently influence the Eurasian SATAs indirectly (Czaja and Frankignoul 1999; Czaja and Frankignoul 2002; Tian and Fan 2015). The North Atlantic SSTAs can also modulate the influence of ENSO on Eurasian SATAs (Chen and Wu 2017; Chen et al., 2018). Arctic sea ice also plays an important role in the variation of Eurasian SATAs (Mori et al., 2014; Vihma 2014). The decline in Arctic sea ice in preceding summer/autumn may modulate the winter Eurasian SATAs via the increasing heat flux from ocean to atmosphere, which may cause a negative phase of the AO/NAO (Vihma 2014) or lead to more frequent Eurasian blocking situations (Mori et al., 2014). Similar relationship was also found between the autumn Arctic sea ice and spring AO (Chen et al., 2019). The association between snow cover and the variation of Eurasian SATAs has also been researched. Saito et al. (2001) suggested that the autumn Eurasian snow cover anomalies may influence the winter Eurasian SATAs not only by acting as a lower boundary forcing to the tropospheric circulation but also by changing the upward propagating Rossby waves that can influence the AO. Chen H. W. et al. (2016) found that in spring, the snow cover anomalies can contribute partly to Eurasian SATAs by modulating surface net shortwave radiation.
Most of the studies mentioned above focused on the variation of the seasonal average SATAs over Eurasia; however, the sub-seasonal variation of the SATAs in this region has largely been ignored, especially the sub-seasonal out-of-phase variation, which may cause huge socioeconomic impacts. For example, Begzsuren et al. (2004) pointed out that severe winter weather such as sudden cooling and snowfall may be one of the main reasons behind pastoral livestock mortality in cold and dry regions; and Casson et al. (2019) highlighted that a warm period followed by a cold period may cause damage to vegetation, as the warm weather can break the dormancy of vegetation and the subsequent cold weather can result in significant damage. In CA, a reversal of the SATAs between winter months occurs frequently. In Figure 1B, we can see that 16 of the total 39 winters, which amounts to 40%, show opposite signs of SATAs between December and January during the period 1979–2018. Such a monthly reversal of SATAs could be hidden by taking a simple seasonal average, and is therefore worthy of further investigation.
The monthly reversal of the winter SATAs in East Asia has attracted considerable attention among scientists in recent years (Geng et al., 2017; Xu et al., 2018; Dai et al., 2019; Lü et al., 2019). For example, Geng et al. (2017) pointed out that the rapid reversal of East Asia from a warm spell to a cold surge can be attributed to the super El Niño during the boreal winter of 2015/16, which caused a northward shift of the subtropical jet and led to the reversal of the NAO phase. Dai et al. (2019) suggested that the reversal of the winter SATAs over Northeast China between December and January–February can be attributed to the variations of sea ice in different Arctic regions. Li et al. (2021) found that the CP ENSO-related cooling SSTAs may be responsible for the reversal of SATAs over China in December and January since 1997. They found that, compared with the period before 1997, a westward-extended Walker circulation can be caused by the CP ENSO-related cooling SSTAs the over the South China Sea and Kuroshio Extension. The westward-extended Walker circulation, coupled with the different climatological circulation between December and January, can lead to different meridional circulations over China and its SATAs in the months. Although previous studies have focused on this topic, there is still no research concerning the December–January reversal of the SATAs over CA.
As one of the most important predictors for global climate variations, tropical Pacific SSTAs can impact the atmospheric circulation (Zhang et al., 2015; Feng et al., 2017; García-Serrano et al., 2017). It would therefore be interesting to discuss whether the tropical Pacific SSTAs can influence the monthly reversal of the winter SATAs of CA. Accordingly, we seek to answer the following questions in this paper:
(1) What are the main features of the December–January reversal of the SATAs over CA and how can we describe these features?
(2) What’s the relationship between the monthly reversal of SATAs and the variation of the SSTAs over the tropical Pacific?
(3) How the monthly reversal of SATAs is influenced by the tropical Pacific SSTAs?
The rest of the paper is organized as follows: Section 2 describes the data and methods employed in the study. Section 3 details the out-of-phase mode of the December–January SATAs over CA, its connection to the central tropical Pacific SSTAs (CTP SSTAs), and an analysis of the possible mechanisms behind the connection. Section 4 provides a summary and some further discussion.
Four datasets were employed in this study, each spanning a period of 40°years from 1979 to 2018, as follows:
(1) The atmospheric reanalysis data used in this study are from the National Centers for Environmental Prediction/National Center for Atmospheric Research (NCEP/NCAR), with a 2.5 horizonal resolution from 1,000 to 10 hPa comprising 17 pressure levels (Kalnay et al., 1996), including the monthly mean SAT, geopotential height, and zonal and meridional winds.
(2) The monthly mean SAT from Global Historical Climatology Network (GHCN) weather stations is also employed to further examine the change in SAT over CA (Peterson and Vose 1997). Moreover, the missing values in these records in each year are excluded and the processed SAT records then interpolated to the 2.5 × 2.5 grid for further verification.
(3) The monthly mean SST data are derived from the Japan Meteorological Agency Centennial Observation-Based Estimates of SST dataset, version 2, with a 1.0° horizonal resolution (Hirahara et al., 2014).
(4) The monthly mean interpolated outgoing longwave radiation (OLR) with a 2.5° horizonal resolution provided by the National Oceanic and Atmospheric Administration (Liebmann and Smith 1996) are employed as the proxy of the intensity of convective heating.
The multivariate empirical orthogonal function (MV-EOF) analysis method (Wang 1992) is adopted here to distinguish the leading variability modes that combine the variations of the December and following-January SATAs of CA during 1979–2018. In this study, an area-weighted correlation coefficient matrix is constructed for the combined SATA (weighted by the square root of the cosine of latitude) over CA in December and the following January during 1979–2018 to carry out the MV-EOF. The method has been widely applied in climate research. For example, Li et al. (2021) pointed out that the MV-EOF method can distinguish the mode of the reversal of December and January SATAs over China.
The wave activity flux (Takaya and Nakamura 2001) is employed to describe the stationary Rossby wave propagation. This wave flux is parallel to the local group velocity of a stationary Rossby wave train in the Wentzel–Karmers–Brillouin approximation. The horizontal flux is calculated as follows:
where P is the pressure scaled by 1,000 hPa, (U, V) denotes the horizonal mean winds,
The strength of the synoptic-scale transient eddy activity (STEA) is measured by
where Z is the monthly mean geopotential height; g is the gravitational acceleration;
The Student’s t-test was used to estimate levels of statistical significance, and the linear trends of all data used for regression and correlation were removed. The number of equivalent degrees of freedom for regression was calculated following Zwiers and von Storch (1995).
An atmospheric general circulation model, ECHAM5 (Roeckner et al., 2003), is employed to validate the mechanisms given in this study. The ECHAM5 simulations were performed with the spectral T63 horizontal resolution and 19 vertical levels (T63L19). The detailed experimental design is given in section 3d.
Figure 2 shows the spatial patterns of the first two leading modes (MV-EOF1 and MV-EOF2) and corresponding time series (PC1 and PC2). The first and the second leading modes explain 30.7 and 22.3% of the total covariance, respectively, and are both well separated in accordance with the method given by North et al. (1982). MV-EOF1 is an in-phase variation mode, which has similar spatial patterns in December and January, with strong amplitudes situated over the middle and northern part of CA (Figure 2A,B). MV-EOF2, meanwhile, shows maximum amplitudes distributed along the northeast–southwest of CA in December and exhibits nearly opposite anomalies in the same region in January (Figure 2C,D), which presents the out-of-phase nature of the SATAs between December and January. Similar in-phase and out-of-phase modes can be separated using the GHCN dataset, which have nearly the same spatial distributions as MV-EOF1 and MV-EOF2 (not shown), and the corresponding time series are also highly correlated with PC1 and PC2 (higher than 0.97). Thus, the reversal of the SATAs between December and January over CA can be represented by MV-EOF2.
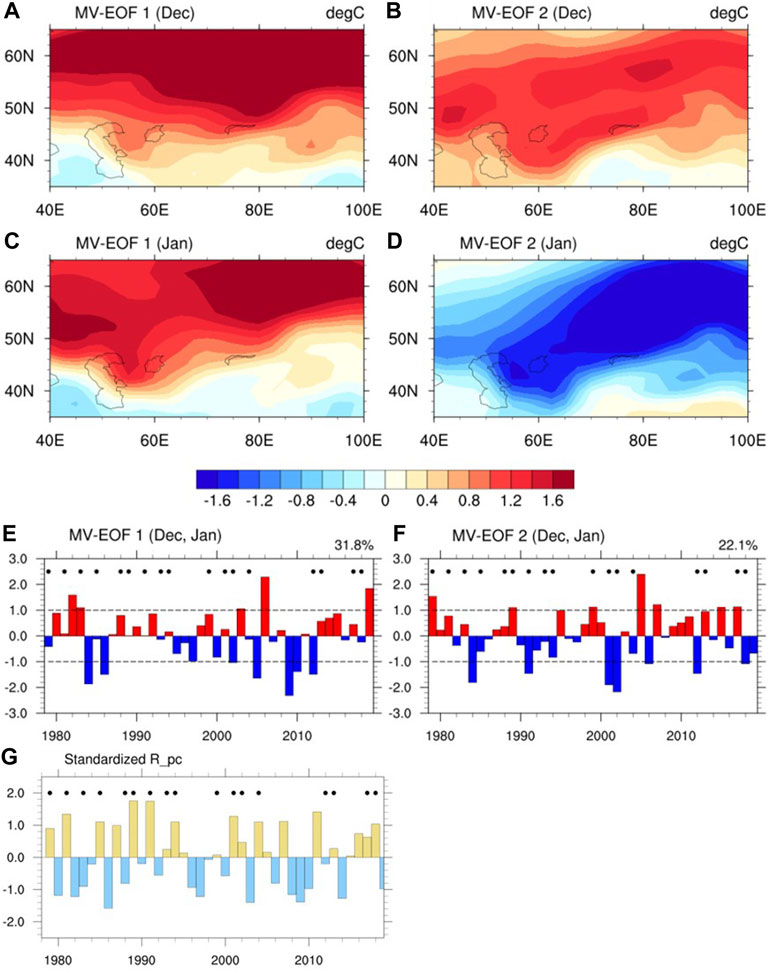
FIGURE 2. Spatial distributions of the first MV-EOF mode of (A) December and (C) January SATAs during 1979–2017 (E) Normalized time series of the standardized first principal component (PC1), with the proportion of the explained covariance of the first mode given in the top-right corner (B,D,F) As in (A,C,E) but for the second MV-EOF mode and PC2 (G) Time series of the standardized
To examine the atmospheric circulation anomalies associated with MV-EOF2, the PC2-related SATAs and the 850 and 300 hPa geopotential height and wind anomalies in December and January are analyzed (Figure 3). The positive PC2 corresponds to the remarkable December warming and January cooling (Figures 3A,B). In December, anomalous southeasterlies can be seen over CA at 850-hPa, with a southwest‒northeast distribution pattern (Figure 3C). The distribution pattern of the anomalous southeasterlies corresponds well with that of the SATAs (Figure 3A,C), which indicates that the anomalous warm advection brought by the southeasterlies may contribute to the SATAs in December. Besides, significant southwest‒northeast positive height anomalies appear at 300 hPa (Figure 3E), which can induce a decline in cloud cover. Thus, enhanced downward shortwave radiation may also contribute to the warm SATAs over CA in December. In January, significant positive geopotential height anomalies appear over the north side of CA at both 850 hPa and 300 hPa (Figure 3E), accompanied by anomalous northeasterlies over CA. The cold advection brought by these anomalous northeasterlies may cause the cold anomalies over northern CA. The contrasting atmospheric circulation anomalies between December and January play an essential role in the reversal of the SATAs over CA.
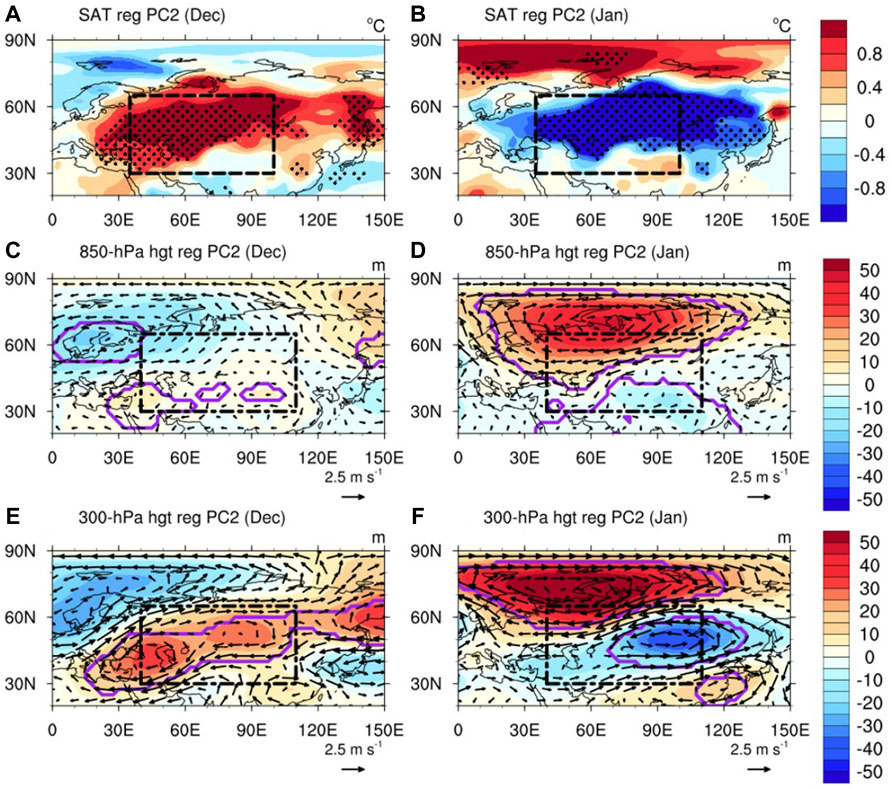
FIGURE 3. Regressions of December (A) SAT (shading; °C) and (C) 850 hPa and (E) 300 hPa geopotential height (shading; m) and winds (vectors; m s−1) onto the PC2 for the period 1979–2017 (B,D,F) As in (A,C,E) but for January during 1980–2018. The black dashed boxes show the region of CA; anomalies significant at the 95% confidence level are denoted by dots and purple contour lines, as estimated by the Student’s t-test.
Because MV-EOF2 represents an out-of-phase relationship between the December and January SATAs, the signs of the mean SATAs of the 2 months are more likely to be opposite when the amplitude of MV-EOF2 is “relatively stronger” than that of MV-EOF1. Years with opposite signs are marked in Figure 2E,F. A higher PC2 is likely to appear in these years. To verify this, the index
To reveal the remarkable remote SST forcing that modulates the reversal of the SATAs between December and January over CA, the PC2-related SSTAs and outgoing longwave radiation (OLR) in December and January are analyzed (Figure 4). Significant negative SSTAs appear over CTP within the Niño4 region (5°S‒5°N, 160°‒150°W) in both December and January (Figure 4A,B), and the pattern of the SSTAs resembles that of CP La Niña (Yuan and Yan, 2013, see their Figure 2B). Furthermore, positive OLR anomalies appear in the Niño4 region in both December and January, and these positive OLR anomalies correspond well to the SSTAs (Figure 4C,D). This indicates that the PC2-related diabatic heating is directly associated with the SSTAs in the 2 months. As the Niño4 index is defined as the area-averaged SSTA over the Niño4 region (Kug et al., 2009), the −Niño4 index is adopted to represent the variation of the CTP SSTAs. The correlation coefficients between the −Niño4 index in December and January and PC2 are 0.37 and 0.38 (both statistically significant at the 99% level), respectively. Thought the correlation coefficients are not too high, the result still suggests that a significant correlation exist between the between the cold CTP SSTAs and the MV-EOF2.
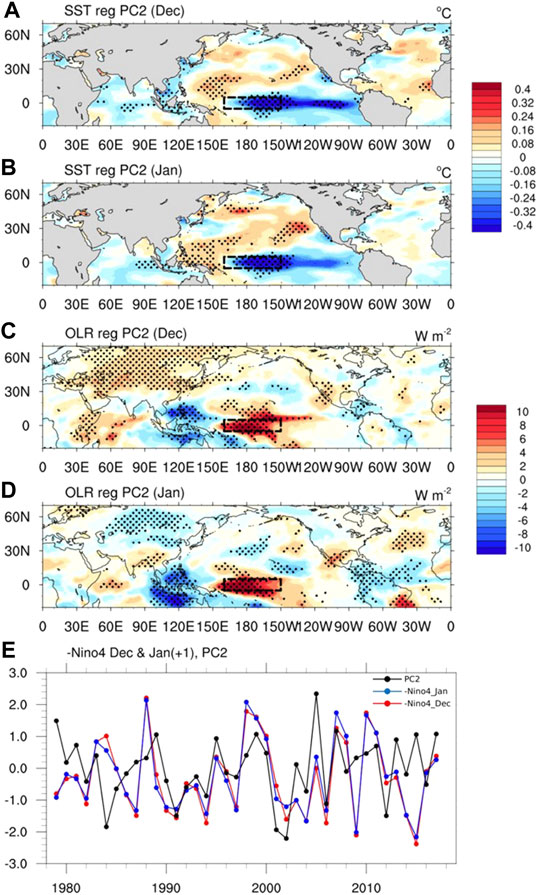
FIGURE 4. Regressions of (A) SST (shading; °C) and (C) OLR (shading; W m−2) onto the PC2 for the period 1979–2017 (B,D) As in (A,C) but for January during 1980–2018 (E) Time series of the standardized −Niño4 index in December (red line), January (blue line) and PC2 (black line) during 1979–2018. Anomalies significant at the 95% confidence level are denoted by dots, as estimated by the Student’s t-test. The black dashed boxes in (A, B, C, D) show the Niño4 region (5°S‒5°N, 160°‒150°W).
Moreover, the −Niño4-related SATAs and circulation anomalies over CA are analyzed (Figure 5). In December, weak positive SATAs are located over northern and western CA, corresponding to the anomalous southerlies and southwesterlies over western and northern CA at both 850 and 300 hPa (Figures C and E). The warm advection by the anomalous winds may induce the weak positive SATAs in December. In January, negative SATAs appear over CA, corresponding to the significant negative geopotential height anomalies at 300 hPa and anomalous northeasterlies at both 850 and 300 hPa (Figures 5B,F), which indicates the cold advection by the anomalous winds may cause the cold anomalies over CA. Besides, the decline of the downward shortwave radiation caused by the negative geopotential height anomalies at 300 hPa may also contribute to the cold anomalies. Though differences exist between the PC2 and −Niño4-related warm SATAs over CA in December (Figures 3A, 5A), similarity at some level still exists between the PC2 and −Niño4-related anomalous geopotential height and winds. Furthermore, the abrupt change in the influence of the cold CTP SSTAs on the SATAs in December and January may contribute to the reversal of the SATAs over CA. The results also imply that the cold CTP SSTAs may not be the single factor for the reversal of SATAs over CA, however, it is out of the scope of this study but deserves further investigations in the future.
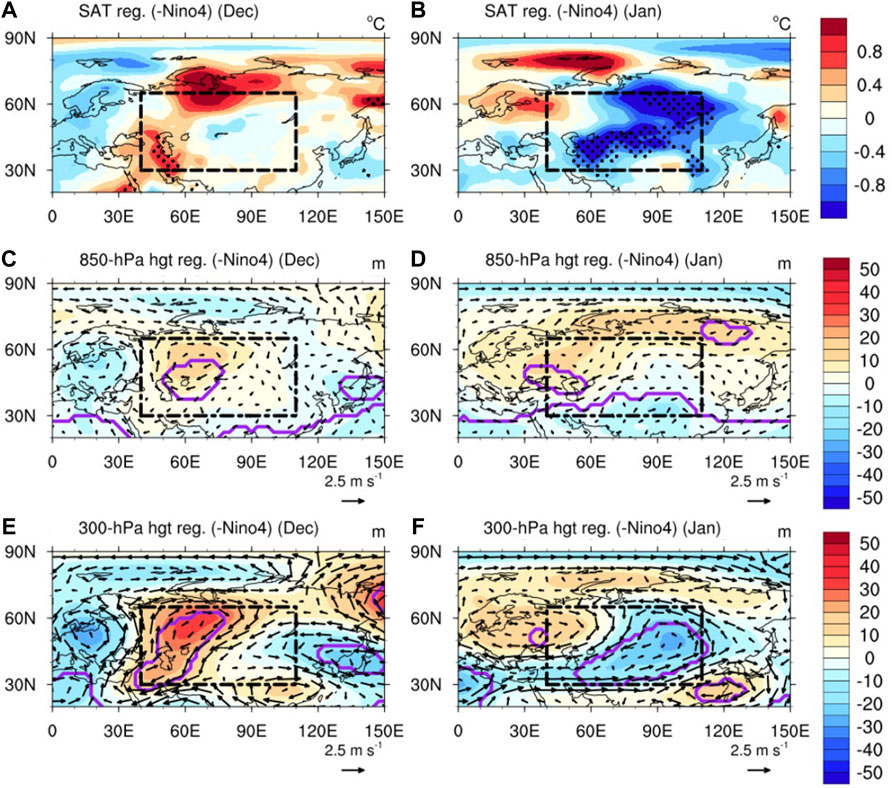
FIGURE 5. Regressions of December (A) SAT (shading; °C) and (C) 850 hPa and (E) 300 hPa geopotential height (shading; m) and winds (vectors; m s−1) onto the −Niño4 for the period 1979–2017 (B,D,F) As in (A,C,E) but for January during 1980–2018. The black dashed boxes show the region of CA; anomalies significant at the 95% confidence level are denoted by dots and purple contour lines, as estimated by the Student’s t-test.
To explore the possible physical mechanisms behind the impact of remote SST forcing on the reversal of SATAs between December and January over CA, the −Niño4-related 300 hPa geopotential height anomalies and the wave activity fluxes in December and January are analyzed (Figure 6). In December, a wave train extends from the North Pacific to CA, crossing North America and the North Atlantic. This wave train consequently results in the positive geopotential height anomalies over CA (Figure 6A). In contrast, in January, the wave train originates from the mid-latitude North Pacific and mainly propagates in the meridional direction (Figure 6B). This wave train cannot reach CA to influence the local SATAs. Interestingly, a wave train starting from the North Atlantic could reach CA and result in the local negative geopotential anomalies and SATAs. Therefore, two questions are raised regarding the possible mechanisms underlying the different roles of the wave trains associated with the −Niño4 between December and January: 1) why does the propagation of the wave train from the North Pacific differ between December and January; and 2) how do the cold CTP SSTAs in January cause the negative SATAs over CA in January?
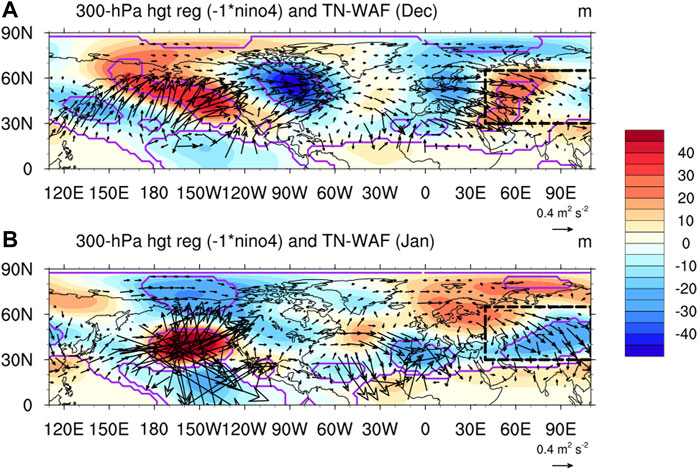
FIGURE 6. (A) Regression of December 300 hPa geopotential height (shading; m) onto the −Niño4 for the period 1979–2017; and the associated horizonal components of the wave activity flux (vectors; m2 s−2) (B) As in (a) but for January during 1980–2018. Anomalies significant at the 95% confidence level are denoted by purple contour lines, as estimated by the Student’s t-test.
For the first question, the different Gill-type responses to the cold CTP SSTA between December and January may play a key role. The Gill-type response is the stationary Rossby wave response to the tropical SST anomalies (Gill, 1980). The Gill-type response corresponding to the cooling SST anomalies of La Niña winters can be characterized by a pair of low-level anticyclonic anomalies residing at the northern and southern sides of the equator, along with low-level easterly wind anomalies and cyclonic anomalies symmetrical about the equator at the upper level of the troposphere (Yuan and Yan, 2013; Zhang et al., 2015). In Figure 7, the Gill-type response to the CTP SSTAs is remarkable: on the one hand, anomalous easterlies and symmetric anticyclones at 1,000 hPa appear around the region (20°S‒20°N, 170°E‒120°W) in both December and January (Figures 7A,B), and the easterly anomalies are relatively stronger in January than in December; whilst on the other hand, in both December and January, a pair of cyclonic anomalies appears over the CTP at 300 hPa, and these anomalous cyclones in January are much stronger than they are in December (Figure 7C,D). The result implies that the Gill-type response to the cold CTP SSTAs in January is stronger than in December.
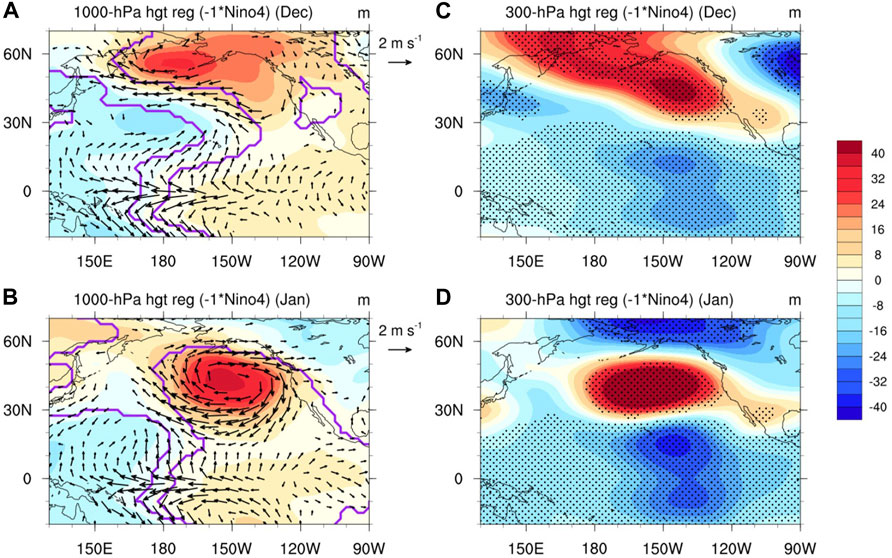
FIGURE 7. Regressions of the December (A) 1,000 hPa geopotential height (shading; m) and winds (vectors; m s−1), and (C) 300 hPa geopotential height (shading; m) onto the −Niño4 for the period 1979–2017 over the Pacific (B,D) As in (A, C) but for January during 1980–2018. Anomalies significant at the 95% confidence level are denoted by dots and purple contour lines, and vectors represent the anomalous winds significant at the 95% confidence level, as estimated by the Student’s t-test.
With the enhanced Gill-type response in January, the influence of cold CTP SSTAs on the extratropical atmosphere over the North Pacific are strengthened. In January, corresponding to the enhanced 300 hPa cyclonic anomalies in the region (0°‒20°N, 160°‒130°W), stronger positive geopotential height anomalies appear in the region (30°‒60°N, 180°‒150°W) (Figure 7C,D). Consequently, intensified wave activity fluxes are driven by the positive geopotential height anomalies, as seen in Figure 6. Also, the more remarkable meridional dipole structure of the geopotential height anomalies over the North Pacific might cause the meridional propagation of the Rossby waves.
Additionally, the reason why the Gill-type response to the cold CTP SSTAs in January is stronger than that in December is explored. Previous studies have revealed that a strengthening of the tropical heating could lead to a stronger Gill-type response (Xing et al., 2014). Besides, Lee et al. (2009) suggested that a stronger and more equatorward jet stream could result in a stronger Gill-type response in the tropical atmosphere, along with stronger responses in the extratropical atmosphere. Figure 8 shows the CTP SSTI-related SSTAs and the climatological 300 hPa zonal winds in December and January. The cold SSTAs in the CTP region in January are slightly stronger than these in December, but their difference is not statistically significant (Figure 8A–C). Additionally, the subtropical jet stream over the North Pacific in January is stronger and situated more towards the equator (Figure 8D–F), which may lead to the strengthened Gill-type response in the tropics, as indicated by Lee et al. (2009). Thus, the CTP SSTAs in December and January may excite different Gill-type responses in the tropical atmosphere due to the difference in the climatological jet stream. Subsequently, the different Gill-type and extratropical atmospheric responses finally lead to a different propagation of Rossby waves between December and January.
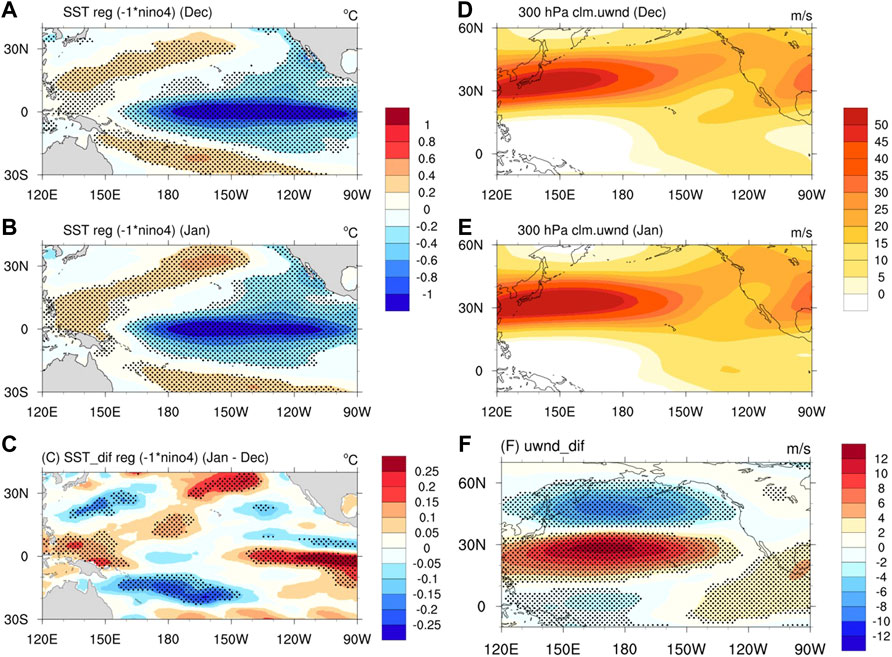
FIGURE 8. (A) Regressions of December SST over the Pacific onto the −Niño4 (shading; °C) for the period 1979–2017 (B) As in (A) but for January during 1980–2018 (C). Regression of the SST difference between January and December over the Pacific onto the −Niño4 (shading; °C) for the period 1979–2017 (D) Climatological December 300 hPa zonal wind (shading; m s−1) for the period 1979–2017 (E) As in (D) but for January (F) Difference in the climatological 300 hPa zonal wind between January and December (shading; m s−1) for the period 1979–2017. Anomalies significant at the 95% confidence level are denoted by dots, as estimated by the Student’s t-test.
In terms of the second question, the strong 300 hPa zonal wind anomalies associated with the CTP SSTAs may play a crucial role. In January, significant positive and negative 300 hPa zonal wind anomalies appear in the regions (40°‒60°N, 180°‒120°W) and (20°‒40°N, 180°‒120°W), respectively (Figure 9A). The meridional structure of the anomalous zonal wind can be linked to the dipole structure of the geopotential height anomalies in the January (Figure 7D). Corresponding to the wind anomalies, significant positive and negative STEA anomalies appear over the eastern North Pacific (Figure 9A,B). These STEA anomalies can travel eastwards to the North Atlantic via the downstream development of wave packets (Rivière and Orlanski, 2007; Li and Lau 2012a, Li and Lau 2012b). Accordingly, the strength of STEA over the North Atlantic shows non-significant positive anomalies over (40°‒60°N, 60°‒30°W) and significant negative anomalies over (20°‒40°N, 60°‒30°W) (Figure 9B). Such a dipole structure of STEA anomalies facilitates a positive geopotential height tendency over the region (40°‒50°N, 60°‒30°W) (Lau and Holopainen 1984), which may lead to the positive geopotential height anomalies associated with the −Niño4 index (Figure 9C). Hence, the CTP SSTAs may influence the STEA over the North Atlantic, by which the positive geopotential height over the North Atlantic can be forced, and then the Rossby waves excited by the positive geopotential height can propagate to CA to cause the local cold SATAs in January. Moreover, the positive geopotential height over northwestern CA forced by the anomalous STEA may also contribute to the driving of the Rossby waves and the cold SATAs.
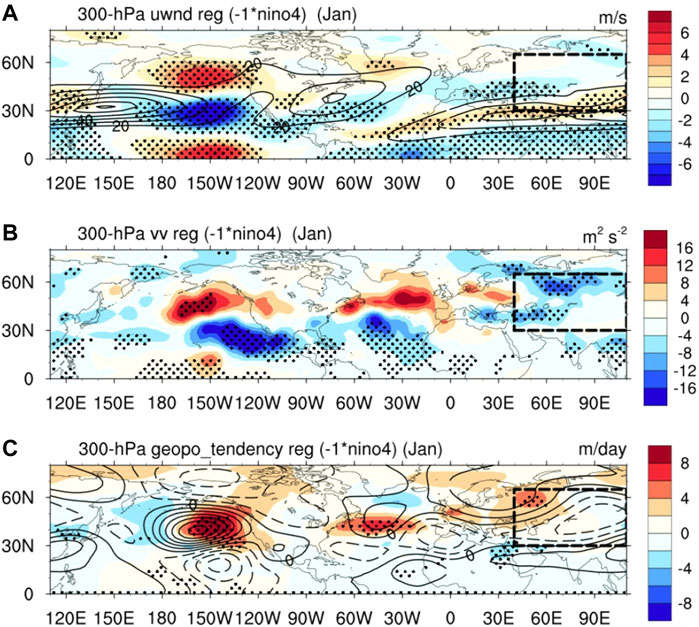
FIGURE 9. (A) Regression of January 300 hPa zonal wind onto the −Niño4 (shading; m s−1) and the climatological January 300 hPa zonal wind (contours; m s−1) for the period 1980–2018 (B) Regression of January 300 hPa STEA onto the −Niño4 (shading; m2 s−2) for the period 1980–2018 (C) Regression of the January 300 hPa eddy-induced geopotential height tendency (shading; m day−1) and geopotential height (contours; m) onto the −Niño4 for the period 1980–2018. In (C), zero contours are omitted and negative values are dashed. The black dashed boxes show the region of CA; anomalies significant at the 95% confidence level are denoted by dots, as estimated by the Student’s t-test.
In this section, three experiments were designed to validate the mechanisms given above. The first one forces the model with the climatological seasonal cycle of global SST and sea ice (referred to as Ctrl). Ctrl was integrated for 50°years, and the first 20°years were used for model spin-up and the remaining years were used for analysis. In the second experiment (referred to as Run1), the boundary forcing was changed to the climatological seasonal cycle of global SST with additional SSTAs over the tropical Pacific region (10°S‒10°N, 150°E‒90°W) from December to the following January. The SSTAs used here were the regressions of the December (January) SST onto the simultaneous −Niño4 index during 1979–2017 (1980–2018), and keeping the same value in December (January). Run1 included 30 members. Each member was integrated from 30 November to 31 January of the following year with the initial conditions taken from Ctrl. The third experiment (referred to as Run2) was similar to Run1, except that the SSTAs added to the climatological seasonal cycle of the global SST in December and January were both from the regression of the December SST onto the −Niño4 index during 1979–2017.
The composite differences in the SAT and 300 hPa geopotential height between Run1 and the control run are given in Figure 10. In December, although the SATAs over CA in Run1 are weak and non-significant (Figure 10A), the geopotential height in December is similar to the −Niño4 index-related geopotential height anomalies (Figure 10C). The Gill-type geopotential height anomalies appear over the tropical Pacific and match with the obvious result. Furthermore, the positive anomalies over the Bering Strait, the negative anomalies over North America, and the weak negative anomalies over western Europe in Run1 correspond to the −Niño4 index-related geopotential height anomalies. Thus, the numerical experiments roughly reproduce the mechanism of the −Niño4 index’s impacts on CA in December. In January, strong and significant negative SATAs appear over CA (Figure 10B), and the geopotential height anomalies are similar to the observational anomalies (Figure 10D). Interestingly, the Gill-type geopotential height anomalies over the tropical Pacific are stronger than in December, as expected. The results from Run1 in December and January support the proposed mechanism. On the one hand, in December, there is a similarity between the geopotential height anomalies and the −Niño4-related geopotential height anomalies, which validates the suggestion that an eastward-propagating Rossby wave train may be excited by the anomalous cold CTP SSTA in December. On the other hand, in January, a stronger Gill-type response in the tropical Pacific is excited by −Niño4-related SSTAs, and may cause significant negative SATAs over CA.
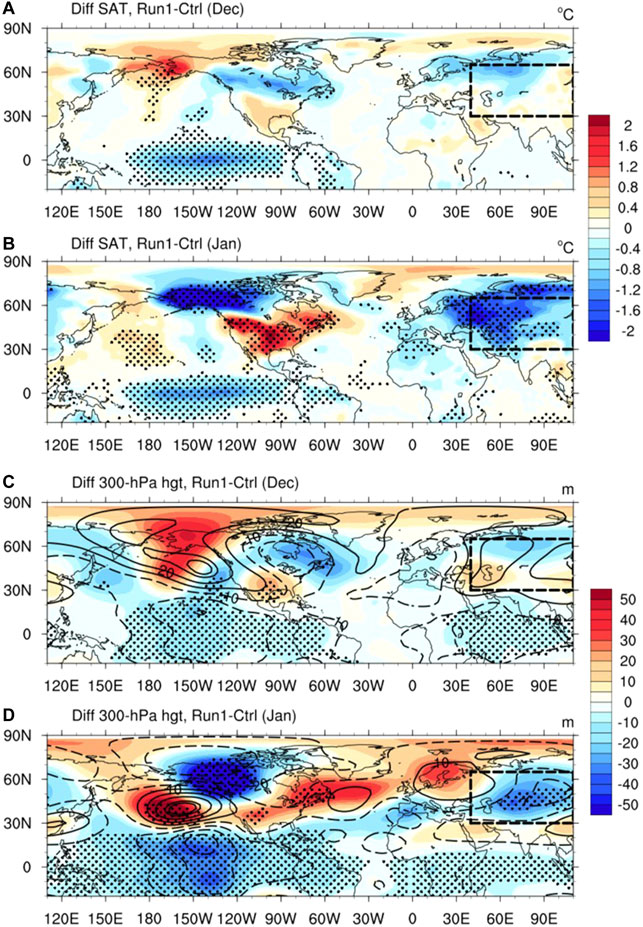
FIGURE 10. Composite difference in the (A) December SAT (shading; °C) and (C) geopotential height (shading; m) between Run1 and Ctrl (B,D) As in (A, C) but for January. The contours in (C, D) show the regression of the 300 hPa geopotential height onto the −Niño4 index for December during 1979–2017 and January during 1980–2018, respectively, in which zero contours are omitted and negative values are dashed. The black dashed boxes show the region of CA; anomalies significant at the 95% confidence level are denoted by dots, as estimated by the Student’s t-test.
Since the SST forcings used in Run1 in December and January were different, as shown in Figure 8C, it is possible that the different responses in Run1 are caused by the difference in the SST forcings. Thus, in Run2, the same SST forcing [the −Niño4-related SSTAs over the region (10°S‒10°N, 150°E‒90°W) in December] was added in December and January. The composite differences in the SAT and 300 hPa geopotential height between Run2 and Ctrl are given in Figure 11. The results closely resemble those of Run1. The similarity between Run1 and Run2 provides further support to the notion that changing climatological background winds might play an important role in the reversal of the SATAs over CA.
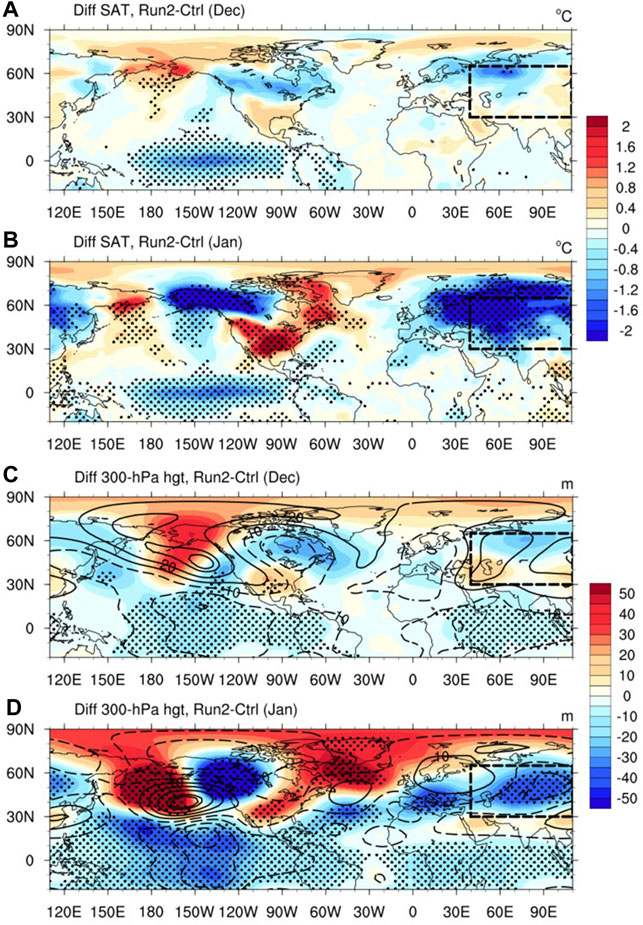
FIGURE 11. As in Figure 10 but for Run2.
Subseasonal changes in winter SATAs over CA can cause severe damage in terms of socioeconomic development in this region. In this study, the monthly reversal of the December and January SATAs over CA was investigated.
The MV-EOF analysis method was employed to identify the leading modes of the monthly variation of the SATAs. The second leading mode of MV-EOF represents the monthly reversal of the SATAs, which corresponds to contrasting geopotential height anomalies between December and January (Figure 3C‒F). The relationship between the MV-EOF2 and remote forcing of the cold CTP SSTAs was studied. Significant negative SSTAs appear over the CTP within the Niño4 region in both December and January, and the −Niño4 index was adopted to represent the variation of the CTP SSTAs (Figure 4). The −Niño4-related SATAs and geopotential potential height anomalies were checked. In December, the CTP SSTAs can lead to positive but weak SATAs over western and northern CA, while in January, the CTP SSTAs may lead to strong cold SATAs over CA (Figure 5). The abrupt change in the influence of the cold CTP SSTAs on the SATAs in the 2 months can contribute to the reversal of the SATAs over CA.
The mechanisms behind the different impacts of remote SST forcing in December and January were studied, and two interesting phenomena were noticed (Figure 6). First, in December, the wave train from the North Pacific can reach CA, while in January the wave train form the North Pacific mainly propagates in the meridional direction and cannot reach CA. Second, the January SATAs of CA are influenced by the wave train from the North Atlantic. The following research of this study revolved around these two phenomena.
Firstly, the difference between the wave train propagation in December and January was researched. It was found that the negative CTP SSTAs in December and January can excite a Gill-type response in the tropical atmosphere of the Pacific. In December, the Gill-type response can excite eastward-propagating Rossby waves over the North Pacific, which can then directly cause the positive geopotential height anomalies and positive SATAs over CA. In January, as the climatological subtropical jet stream over the North Pacific is stronger and situated more towards the equator, the Gill-type response over the North Pacific is stronger than that in December. The Rossby wave train over the North Pacific propagates mainly in the meridional direction and is unable to reach CA.
Secondly, the process was studied by which the cold CTP SSTAs can cause the cold SATAs over CA in January. The intensified positive and negative wind anomalies in January over the North Pacific can cause stronger STEA, which can extend to the North Atlantic and influence the local STEA. Accordingly, the eddy-induced positive geopotential height anomalies will excite Rossby waves and cause the negative geopotential height anomalies and negative SATAs in January. To validate the mechanism, especially the roles of the SSTAs and changing climatological background winds, two sensitivity experiments were designed. The results roughly reproduced the influence of the cold CTP SSTAs on CA, and therefore lend support to the proposed mechanism.
In this work, the impact of the CTP SSTAs on the reversal of SATAs over CA in December and January was treated as the major remote forcing to be investigated. However, it is also true that the correlation coefficient between the −Niño4 index and PC2 is not large, and the PC2-related SATAs over CA in December are different from the −Niño4-related SATAs and the model results over CA. The differences between the PC2 and −Niño4-related SATAs in December imply that other climatic factors may also roles in the reversal of SATAs over CA. The atmospheric circulation over northern Eurasia could be very important in driving the response of the SATAs over CA. For example, the positive phase of Scandinavian Pattern is associated with cooling over central Russia and western Europe (Bueh and Nakamura, 2007; Liu et al., 2014). Besides, boundary forcings, such as North Atlantic SST, Arctic sea ice and snow cover may also have an influence (Mori et al., 2014; Chen et al., 2019; Chen et al., 2020). For example, Mori et al. (2014) pointed out that the SATAs over Eurasia could be influenced by the Warm Arctic–Cold Continental pattern, which is modulated by the Arctic sea-ice variability. As to the model results, two possible reasons may be responsible the differences between the model results and the PC2-related SATAs in December. First, the performance of the AGCM may be limited for the variability of atmospheric circulation at monthly scale. Second, as discussed above, other possible climatic factors may play a role in the reversal of SATAs over CA, such as the North Atlantic SSTAs. However, the cold CTP SSTAs is the only boundary forcing that are added in our experiment, which may lead to a deviation from the observational results. Though the performance of the AGCM in December is different from our expectation, the sudden cooling in the January is well simulated by the AGCM. The significantly different influence on the SATAs over CA shown in the experiments indicates that the cold CTP SSTAs plays an important role in the reversal of the SATAs over CA. In short, consideration of other factors and careful experimental design are needed to provide a full understanding of the reversal of the SATAs over CA in December and January.
The original contributions presented in the study are included in the article/Supplementary Material, further inquiries can be directed to the corresponding author.
HL: Conceptualization, Methodology, Software, Investigation, Formal Analysis, Writing—Original Draft; KF: Conceptualization, Methodology, Supervision, Validation, Project Administration, Funding Acquisition, Review and Editing HL: Conceptualization, Methodology, Software, Review and Editing ZX: Methodology, Software, Review and Editing.
This research was supported by the National Natural Science Foundation of China (grant number 41730964 and 42088101), the National Key R&D Program of China (grant number 2017YFA0603802), the Innovation Group Project of Southern Marine Science and Engineering Guangdong Laboratory (Zhuhai) (No 311021001).
The authors declare that the research was conducted in the absence of any commercial or financial relationships that could be construed as a potential conflict of interest.
All claims expressed in this article are solely those of the authors and do not necessarily represent those of their affiliated organizations, or those of the publisher, the editors and the reviewers. Any product that may be evaluated in this article, or claim that may be made by its manufacturer, is not guaranteed or endorsed by the publisher.
Begzsuren, S., Ellis, J. E., Ojima, D. S., Coughenour, M. B., and Chuluun, T. (2004). Livestock Responses to Droughts and Severe winter Weather in the Gobi Three Beauty National Park, Mongolia. J. Arid Environments 59 (4), 785–796. doi:10.1016/j.jaridenv.2004.02.001
Bueh, C., and Nakamura, H. (2007). Scandinavian Pattern and its Climatic Impact. Q.J.R. Meteorol. Soc. 133 (629), 2117–2131. doi:10.1002/qj.173
Casson, N. J., Contosta, A. R., Burakowski, E. A., Campbell, J. L., Crandall, M. S., Creed, I. F., et al. (2019). Winter Weather Whiplash: Impacts of Meteorological Events Misaligned with Natural and Human Systems in Seasonally Snow‐Covered Regions. Earth's Future 7 (12), 1434–1450. doi:10.1029/2019EF001224
Cattiaux, J., Vautard, R., Cassou, C., Yiou, P., Masson-Delmotte, V., and Codron, F. (2010). Winter 2010 in Europe: A Cold Extreme in a Warming Climate. Geophys. Res. Lett. 37 (20), L20704. doi:10.1029/2010GL044613
Chen, H. W., Alley, R. B., and Zhang, F. (2016). Interannual Arctic Sea Ice Variability and Associated winter Weather Patterns: A Regional Perspective for 1979-2014. J. Geophys. Res. Atmos. 121 (24), 14433–14455. doi:10.1002/2016JD024769
Chen, S., Wu, R., and Chen, W. (2019). Enhanced Impact of Arctic Sea Ice Change during Boreal Autumn on the Following spring Arctic Oscillation since the Mid-1990s. Clim. Dyn. 53 (9), 5607–5621. doi:10.1007/s00382-019-04886-y
Chen, S., and Wu, R. (2017). Interdecadal Changes in the Relationship Between Interannual Variations of Spring North Atlantic SST and Eurasian Surface Air Temperature. J. Clim. 30 (10), 3771–3787. doi:10.1175/jcli-d-16-0477.1
Chen, S., Wu, R., and Chen, W. (2018). Modulation of Spring Northern Tropical Atlantic Sea Surface Temperature on the El Niño-Southern Oscillation-East Asian Summer Monsoon Connection. Int. J. Climatol. 38 (13), 5020–5029. doi:10.1002/joc.5710
Chen, S., Wu, R., Chen, W., Hu, K., and Yu, B. (2020). Structure and Dynamics of a Springtime Atmospheric Wave Train over the North Atlantic and Eurasia. Clim. Dyn. 54 (11), 5111–5126. doi:10.1007/s00382-020-05274-7
Chen, S., Wu, R., and Liu, Y. (2016). Dominant Modes of Interannual Variability in Eurasian Surface Air Temperature during Boreal Spring. J. Clim. 29 (3), 1109–1125. doi:10.1175/jcli-d-15-0524.1
Cohen, J., Saito, K., and Entekhabi, D. (2001). The Role of the Siberian High in Northern Hemisphere Climate Variability. Geophys. Res. Lett. 28 (2), 299–302. doi:10.1029/2000gl011927
Cohen, J., Zhang, X., Francis, J., Jung, T., and Yoon, J. (2019). Divergent Consensuses on Arctic Amplification Influence on Midlatitude Severe winter Weather. Nat. Clim. Change 10 (6), 1–10. doi:10.1038/s41558-019-0662-y
Czaja, A., and Frankignoul, C. (1999). Influence of the North Atlantic SST on the Atmospheric Circulation. Geophys. Res. Lett. 26 (19), 2969–2972. doi:10.1029/1999GL900613
Czaja, A., and Frankignoul, C. (2002). Observed Impact of Atlantic SST Anomalies on the North Atlantic Oscillation. J. Clim. 15 (6), 606–623. doi:10.1175/1520-0442(2002)015<0606:oioasa>2.0.co;2
Dai, H., Fan, K., and Liu, J. (2019). Month-to-Month Variability of Winter Temperature over Northeast China Linked to Sea Ice over the Davis Strait-Baffin Bay and the Barents-Kara Sea. J. Clim. 32 (19), 6365–6384. doi:10.1175/jcli-d-18-0804.1
Darynova, Z., Maksot, A., Kulmukanova, L., Malekipirbazari, M., Sharifi, H., Torkmahalleh, M. A., et al. (2018). Evaluation of NO2 Column Variations over the Atmosphere of Kazakhstan Using Satellite Data. J. Appl. Rem. Sens. 12 (4), 042610. doi:10.1117/1.JRS.12.042610
Feng, J., Chen, W., and Li, Y. (2017). Asymmetry of the Winter Extra-Tropical Teleconnections in the Northern Hemisphere Associated With Two Types of ENSO. Clim. Dyn. 48 (7), 2135–2151. doi:10.1007/s00382-016-3196-2
García-Serrano, J., Cassou, C., Douville, H., Giannini, A., and Doblas-Reyes, F. J. (2017). Revisiting the ENSO Teleconnection to the Tropical North Atlantic. J. Clim. 30 (17), 6945–6957. doi:10.1175/jcli-d-16-0641.1
Geng, X., Zhang, W., Stuecker, M. F., and Jin, F.-F. (2017). Strong Sub-seasonal Wintertime Cooling over East Asia and Northern Europe Associated with Super El Niño Events. Sci. Rep. 7 (1), 3770. doi:10.1038/s41598-017-03977-2
Gill, A. E. (1980). Some Simple Solutions for Heat-Induced Tropical Circulation. Q. J. R. Meteorol. Soc. 106 (449), 447–462. doi:10.1002/qj.49710644905
Gong, D.-Y., and Ho, C.-H. (2002). The Siberian High and Climate Change over Middle to High Latitude Asia. Theor. Appl. Climatology 72 (1), 1–9. doi:10.1007/s007040200008
Graf, H.-F., and Zanchettin, D. (2012). Central Pacific El Niño, the "subtropical Bridge," and Eurasian Climate. J. Geophys. Res. 117 (D1), D01102. doi:10.1029/2011JD016493
Grjibovski, A., Kozhakhmetova, G., Kosbayeva, A., and Menne, B. (2013). Associations between Air Temperature and Daily Suicide Counts in Astana, Kazakhstan. Medicina 49 (8), 59. doi:10.3390/medicina49080059
Hirahara, S., Ishii, M., and Fukuda, Y. (2014). Centennial-Scale Sea Surface Temperature Analysis and its Uncertainty. J. Clim. 27 (1), 57–75. doi:10.1175/jcli-d-12-00837.1
Hurrell, J. W., and Van Loon, H. (1997). Decadal Variations in Climate Associated with the North Atlantic Oscillation. Clim. Change 36 (3), 301–326. doi:10.1023/A:1005314315270
Kalnay, E., Kanamitsu, M., Kistler, R., Collins, W., Deaven, D., Gandin, L., et al. (1996). The NCEP/NCAR 40-Year Reanalysis Project. Bull. Amer. Meteorol. Soc. 77 (3), 437–471. doi:10.1175/1520-0477(1996)077<0437:tnyrp>2.0.co;2
Kerven, C., Alimaev, I. I., Behnke, R., Davidson, G., Franchois, L., Malmakov, N., et al. (2004). Retraction and Expansion of Flock Mobility in Central Asia: Costs and Consequences. Afr. J. Range Forage Sci. 21 (3), 159–169. doi:10.2989/10220110409485848
Kim, D.-W., Byun, H.-R., and Lee, Y.-I. (2005). The Long-Term Changes of Siberian High and winter Climate over the Northern Hemisphere. Asia-Pacific J. Atmos. Sci. 41 (2-1), 275–283.
Kug, J.-S., Jin, F.-F., and An, S.-I. (2009). Two Types of El Niño Events: Cold Tongue El Niño and Warm Pool El Niño. J. Clim. 22 (6), 1499–1515. doi:10.1175/2008jcli2624.1
Lau, N.-C., and Holopainen, E. O. (1984). Transient Eddy Forcing of the Time-Mean Flow as Identified by Geopotential Tendencies. J. Atmos. Sci. 41 (3), 313–328. doi:10.1175/1520-0469(1984)041<0313:tefott>2.0.co;2
Lau, N.-C., and Nath, M. J. (2014). Model Simulation and Projection of European Heat Waves in Present-Day and Future Climates. J. Clim. 27 (10), 3713–3730. doi:10.1175/jcli-d-13-00284.1
Lee, S.-K., Wang, C., and Mapes, B. E. (2009). A Simple Atmospheric Model of the Local and Teleconnection Responses to Tropical Heating Anomalies. J. Clim. 22 (2), 272–284. doi:10.1175/2008jcli2303.1
Li, C., Zhang, C., Luo, G., Chen, X., Maisupova, B., Madaminov, A. A., et al. (2015). Carbon Stock and its Responses to Climate Change in C Entral A Sia. Glob. Change Biol. 21 (5), 1951–1967. doi:10.1111/gcb.12846
Li, H., Fan, K., He, S., Liu, Y., Yuan, X., and Wang, H. (2021). Intensified Impacts of Central Pacific ENSO on the Reversal of December and January Surface Air Temperature Anomaly over China since 1997. J. Clim. 34 (5), 1601–1618. doi:10.1175/jcli-d-20-0048.1
Li, Y., and Lau, N.-C. (2012a). Contributions of Downstream Eddy Development to the Teleconnection between ENSO and the Atmospheric Circulation over the North Atlantic. J. Clim. 25 (14), 4993–5010. doi:10.1175/jcli-d-11-00377.1
Li, Y., and Lau, N.-C. (2012b). Impact of ENSO on the Atmospheric Variability over the North Atlantic in Late Winter-Role of Transient Eddies. J. Clim. 25 (1), 320–342. doi:10.1175/jcli-d-11-00037.1
Liebmann, B., and Smith, C. A. (1996). Description of a Complete (Interpolated) Outgoing Longwave Radiation Dataset. Bull. Am. Meteorol. Soc. 77 (6), 1275–1277.
Lioubimtseva, E., and Henebry, G. M. (2009). Climate and Environmental Change in Arid Central Asia: Impacts, Vulnerability, and Adaptations. J. Arid Environments 73 (11), 963–977. doi:10.1016/j.jaridenv.2009.04.022
Liu, Y., Wang, L., Zhou, W., and Chen, W. (2014). Three Eurasian Teleconnection Patterns: Spatial Structures, Temporal Variability, and Associated winter Climate Anomalies. Clim. Dyn. 42 (11), 2817–2839. doi:10.1007/s00382-014-2163-z
Lü, Z., He, S., Li, F., and Wang, H. (2019). Impacts of the Autumn Arctic Sea Ice on the Intraseasonal Reversal of the Winter Siberian High. Adv. Atmos. Sci. 36 (2), 173–188. doi:10.1007/s00376-017-8089-8
Mirzabaev, A. (2013). Impacts of Weather Variability and Climate Change on Agricultural Revenues in Central Asia. Q. J. Int. Agric. 52 (3), 1–16. doi:10.22004/ag.econ.173648
Miyazaki, C., and Yasunari, T. (2008). Dominant Interannual and Decadal Variability of Winter Surface Air Temperature over Asia and the Surrounding Oceans. J. Clim. 21 (6), 1371–1386. doi:10.1175/2007jcli1845.1
Mori, M., Watanabe, M., Shiogama, H., Inoue, J., and Kimoto, M. (2014). Robust Arctic Sea-Ice Influence on the Frequent Eurasian Cold winters in Past Decades. Nat. Geosci 7 (12), 869–873. doi:10.1038/ngeo2277
North, G. R., Bell, T. L., Cahalan, R. F., and Moeng, F. J. (1982). Sampling Errors in the Estimation of Empirical Orthogonal Functions. Mon. Wea. Rev. 110 (7), 699–706. doi:10.1175/1520-0493(1982)110<0699:seiteo>2.0.co;2
Nyssanbayeva, A. S., Cherednichenko, A. V., Cherednichenko, V. S., Abayev, N. N., and Madibekov, A. S. (2019). Bioclimatic Conditions of the winter Months in Western Kazakhstan and Their Dynamics in Relation to Climate Change. Int. J. Biometeorol. 63 (5), 659–669. doi:10.1007/s00484-018-1513-7
Peterson, T. C., and Vose, R. S. (1997). An Overview of the Global Historical Climatology Network Temperature Database. Bull. Amer. Meteorol. Soc. 78 (12), 2837–2849. doi:10.1175/1520-0477(1997)078<2837:aootgh>2.0.co;2
Ren, X., Yang, X., and Chu, C. (2010). Seasonal Variations of the Synoptic-Scale Transient Eddy Activity and Polar Front Jet over East Asia. Front. Jet Over East. Asia 23 (12), 3222–3233. doi:10.1175/2009jcli3225.1
Rivière, G., and Orlanski, I. (2007). Characteristics of the Atlantic Storm-Track Eddy Activity and its Relation with the North Atlantic Oscillation. J. Atmos. Sci. 64 (2), 241–266. doi:10.1175/jas3850.1
Roeckner, E., Bäuml, G., Bonaventura, L., Brokopf, R., Esch, M., Giorgetta, M. S., et al. (2003). The Atmospheric General Circulation Model ECHAM 5. PART I: Model Description. Max Planck Institute for Meteorology. MPI-Report No. 349.
Saito, K., Cohen, J., and Entekhabi, D. (2001). Evolution of Atmospheric Response to Early-Season Eurasian Snow Cover Anomalies. Mon. Wea. Rev. 129 (11), 2746–2760. doi:10.1175/1520-0493(2001)129<2746:eoarte>2.0.co;2
Takaya, K., and Nakamura, H. (2001). A Formulation of a Phase-independent Wave-Activity Flux for Stationary and Migratory Quasigeostrophic Eddies on a Zonally Varying Basic Flow. J. Atmos. Sci. 58 (6), 608–627. doi:10.1175/1520-0469(2001)058<0608:afoapi>2.0.co;2
Thompson, D. W. J., and Wallace, J. M. (2000). Annular Modes in the Extratropical Circulation. Part I: Month-To-Month Variability*. J. Clim. 13 (5), 1000–1016. doi:10.1175/1520-0442(2000)013<1000:amitec>2.0.co;2
Tian, B., and Fan, K. (2015). A Skillful Prediction Model for Winter NAO Based on Atlantic Sea Surface Temperature and Eurasian Snow Cover. Weather Forecast. 30 (1), 197–205. doi:10.1175/waf-d-14-00100.1
Vihma, T. (2014). Effects of Arctic Sea Ice Decline on Weather and Climate: A Review. Surv. Geophys. 35 (5), 1175–1214. doi:10.1007/s10712-014-9284-0
Wang, B. (1992). The Vertical Structure and Development of the ENSO Anomaly Mode during 1979-1989. J. Atmos. Sci. 49 (8), 698–712. doi:10.1175/1520-0469(1992)049<0698:tvsado>2.0.co;2
Wang, L., Liu, Y., Zhang, Y., Chen, W., and Chen, S. (2019). Time-varying Structure of the Wintertime Eurasian Pattern: Role of the North Atlantic Sea Surface Temperature and Atmospheric Mean Flow. Clim. Dyn. 52 (3), 2467–2479. doi:10.1007/s00382-018-4261-9
Wu, B., Su, J., and Zhang, R. (2011). Effects of Autumn-Winter Arctic Sea Ice on Winter Siberian High. Chi. Sci. Bull. 56 (30), 3220. doi:10.1007/s11434-011-4696-4
Wu, R., and Chen, S. (2020). What Leads to Persisting Surface Air Temperature Anomalies from Winter to Following Spring over Mid- to High-Latitude Eurasia? J. Clim. 33 (14), 5861–5883. doi:10.1175/jcli-d-19-0819.1
Xing, N., Li, J., and Li, Y. (2014). Response of the Tropical Atmosphere to Isolated Equatorially Asymmetric Heating. Chin. J. Atmos. Sci. 38 (6), 1147–1158. doi:10.3878/j.issn.1006-9895.1401.13275
Xu, X., Li, F., He, S., and Wang, H. (2018). Subseasonal Reversal of East Asian Surface Temperature Variability in Winter 2014/15. Adv. Atmos. Sci. 35 (6), 737–752. doi:10.1007/s00376-017-7059-5
Yuan, Y., and Yan, H. (2013). Different Types of La Niña Events and Different Responses of the Tropical Atmosphere. Chin. Sci. Bull. 58 (3), 406–415. doi:10.1007/s11434-012-5423-5
Zafren, K. (2013). Frostbite: Prevention and Initial Management. High Alt. Med. Biol. 14 (1), 9–12. doi:10.1089/ham.2012.1114
Zhang, W., Wang, L., Xiang, B., Qi, L., and He, J. (2015). Impacts of Two Types of La Niña on the NAO during Boreal winter. Clim. Dyn. 44 (5), 1351–1366. doi:10.1007/s00382-014-2155-z
Keywords: central Asia, surface air temperature anomaly, sea surface temperature anomaly, central tropical Pacific, Rossby wave
Citation: Li H, Fan K, Li H and Xu Z (2022) Impacts of Central Tropical Pacific SST on the Reversal of December and January Surface Air Temperature Anomalies Over Central Asia. Front. Earth Sci. 10:873040. doi: 10.3389/feart.2022.873040
Received: 10 February 2022; Accepted: 09 March 2022;
Published: 25 March 2022.
Edited by:
Wenjun Zhang, Nanjing University of Information Science and Technology, ChinaReviewed by:
Han-Ching Chen, University of Hawaii at Manoa, United StatesCopyright © 2022 Li, Fan, Li and Xu. This is an open-access article distributed under the terms of the Creative Commons Attribution License (CC BY). The use, distribution or reproduction in other forums is permitted, provided the original author(s) and the copyright owner(s) are credited and that the original publication in this journal is cited, in accordance with accepted academic practice. No use, distribution or reproduction is permitted which does not comply with these terms.
*Correspondence: Ke Fan, ZmFuazhAbWFpbC5zeXN1LmVkdS5jbg==
Disclaimer: All claims expressed in this article are solely those of the authors and do not necessarily represent those of their affiliated organizations, or those of the publisher, the editors and the reviewers. Any product that may be evaluated in this article or claim that may be made by its manufacturer is not guaranteed or endorsed by the publisher.
Research integrity at Frontiers

Learn more about the work of our research integrity team to safeguard the quality of each article we publish.