- 1State Key Laboratory of Oil and Gas Reservoir Geology and Exploitation, Chengdu University of Technology, Chengdu, China
- 2School of Communication Engineering, Chengdu University of Information Technology, Chengdu, China
The low-frequency strong reflection of coal seams always makes the gas detection of the adjacent gas reservoir difficult in a tight sandstone reservoir. An adaptive decomposition processing approach is introduced in this study to inspect the ability to target the weak seismic response of the gas reservoirs interfered by the adjacent coal seams. The variational mode decomposition (VMD)–based highlight volumes extraction approach is used to better detect the weak seismic response of the gas reservoirs concealed by the adjacent strong reflection of coal seams in a tight sandstone reservoir. The amplitudes above the average and peak frequency volumes are extracted from each intrinsic mode functions after VMD for gas detection. Field data examples show that the VMD highlights the weak seismic responses of the geological and stratigraphic information and hydrocarbon-related contents. The results obtained from the VMD-based highlight volumes extraction approach are in close agreement with previous logging interpretations and the drilling information of wells, and the lateral extent of hydrate-bearing strata is estimated with increased accuracy. When the influence of the strong reflection amplitudes caused by the coal seams is not suppressed, the characterization of the weak seismic responses in the reservoirs would prevent the detection of gas or overestimate the lateral distribution of the gas strata. The adaptive decomposition processing methodology has the ability to detect the weak seismic responses in reservoirs interfered or concealed by adjacent coal seams and yields a better hydrocarbon-related interpretation.
Introduction
In seismic exploration, the coal seams which have the characteristics of the low-frequency, strong reflection, similar seismic response to the gas layers always shield the reflection anomalies that reveal the geological characteristics of the adjacent gas reservoir and seriously interferes with effective prediction of the gas reservoir. The lateral resolution of seismic reflection waves will also be reduced by the coal seams. To address the problems of gas detection in weak seismic responses of the target reflection interfered or concealed by the coal seams, many methods and technologies, including the deconvolution technique, inverse Q-filtering, and multiple wavelet decomposition, have been traditionally adopted to broaden the frequency band of the seismic data or exclude the frequency band of the coal seams from the seismic data before the application of the gas detection technologies (Guo and Wang, 2004; An, 2006a; An, 2006b; Zhao et al., 2007; Wang et al., 2015; Liu et al., 2017). However, there are some limitations for the adoption of these methods. For example, the deconvolution methods always assume that the seismic wavelet that has the minimum phase and reflection coefficient is a white noise sequence, which is not always true for the actual seismic data. Noise boosting always exists in the inverse Q-filtering and accurate Q estimation is difficult for actual seismic data. The multiple wavelet decomposition technology has poor lateral continuity. The limited and inaccurate pre-processing procedure always hinders the subsequent gas detection with high precision.
Spectral decomposition is a widely used effective method to delineate the frequency response of reservoirs and subsurface rocks with respect to time, and it highlights some seismic responses buried in some special frequency bands by transforming the seismic data into the time–frequency domain by time–frequency methods (Chakraborty and Okaya, 1995; Castagna and SunSiegfried, 2003; Wu and Liu, 2009; Xue et al., 2014; Xue et al., 2016b; Yuan et al., 2019). The strong amplitude anomalies at low frequencies can always be detected by employing spectral decomposition. This is mainly caused by the fact that, compared with lower frequencies, higher frequencies are attenuated more rapidly owing to the attenuation of seismic waves in gas-prone sediments (Anderson and Hampton, 1980; Xue et al., 2014).
The newly developed variational mode decomposition (VMD) method, which is more suitable for handling non-linear and non-stationary data, can decompose the seismic data into a series of intrinsic mode functions (IMFs) with narrow-band properties in an adaptive and quasi-orthogonal way (Dragomiretskiy and Zosso, 2014). Each mode with different frequency band may highlight different geological and stratigraphic information. Compared to the empirical mode decomposition and its derived algorithms, VMD is theoretically well founded and has stronger local decomposition ability. Furthermore, it has more noise robustness owing to the Wiener filtering embedded in its mode update process, which makes the IMFs to have more physical meaning (Dragomiretskiy and Zosso, 2014; Xue et al., 2016a). Compared to the other traditional time–frequency methods, the VMD-based method with significantly higher time and frequency resolution shows its advantages in highlighting subtle geologic structure features and the hydrocarbon information while removing the noise (Xue et al., 2016a; Liu et al., 2017; Xue et al., 2018).
Based on the previous studies, this study investigates a VMD-based improved spectral decomposition approach for gas detection in the area of the 8th section, Xiashihezi Formation, and the 1st section, Shanxi Formation, where the seismic responses of the main target gas layers are interfered or concealed by the strong reflection of the adjacent coal seams. Here, we present the results from an attenuation study based on seismic data from the 8th section, Xiashihezi Formation, and the 1st section, Shanxi formation, in the Ordos Basin, China, showing that such adaptive decomposition processing methodology has the ability to target the weak seismic response of the reservoirs interfered by the adjacent coal seams. The proposed methodology will introduce new vitality into gas detection when interfered or concealed by the strong amplitude reflection caused by coal seams.
Materials and methods
Seismic data
The post-stack migrated seismic data from the gas field located in the Ordos Basin, China is collected. The main gas-bearing strata are distributed in the 8th section, Xiashihezi Formation, and the 1st section, Shanxi Formation, of the Permian, Upper Paleozoic. The effective gas-bearing reservoir, which has average porosity of less than 10% and permeability generally less than
Here, the post-stack migrated seismic data from the Paleozoic target area of a 2D line (86.88 km) are analyzed. The sampling frequency of the seismic data is 1,000 Hz. In total, two typical gas-saturated wells, with the names of A and B, respectively, are located in the 2D line. Well A is a less prolific well when compared with well B. The seismic sections passing through well A and well B from the original seismic volume are, respectively, shown in Figures 1, 2. The study areas are, respectively, indicated by a pink rectangle for the seismic sections passing through well A and well B in Figures 1, 2. The horizon lines, which show the bottom of the 8th section of the Xiashihezi Formation and the top of the 1st section of the Shanxi Formation, are also marked by a black line for the seismic sections passing through well A and well B. A strong reflection amplitude caused by the coal seams can be found around the horizon line for both seismic sections passing through well A and well B, respectively. Figures 3A,B show the seismic traces passing through well A and well B, respectively. Note that the gas reservoir is indicated by a pink ellipse in Figure 3. The logging curves and the corresponding interpretation of well A and well B in the 8th section, Xiashihezi Formation, and the top of the 1st section, Shanxi Formation, are respectively given in Figures 4, 5. From Figure 4, we can find that there are five scattered gas reservoirs distributed in the study formations and their cumulative thickness is 11.58 m. As shown in Figure 5, there are three scattered gas reservoirs distributed in the study formations and their cumulative thickness is 12.6 m. In the seismic scale, we can find that the responses of the gas reservoirs for both well A and well B are submerged within one wavelength of the strong amplitude responses caused by the coal seams (Figure 3).
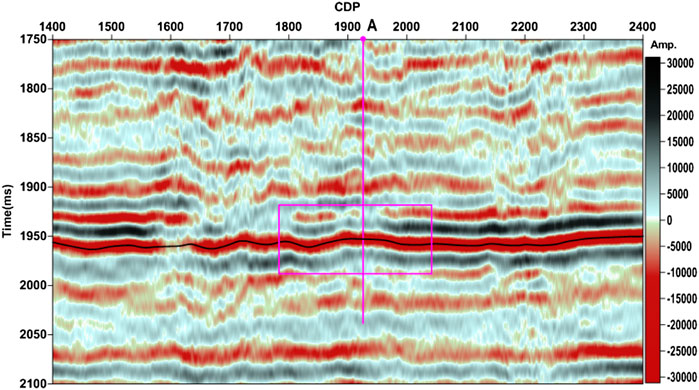
FIGURE 1. Seismic section intersecting well A. Note that the gas reservoir is marked by a pink rectangle. The horizon is marked by a black line.
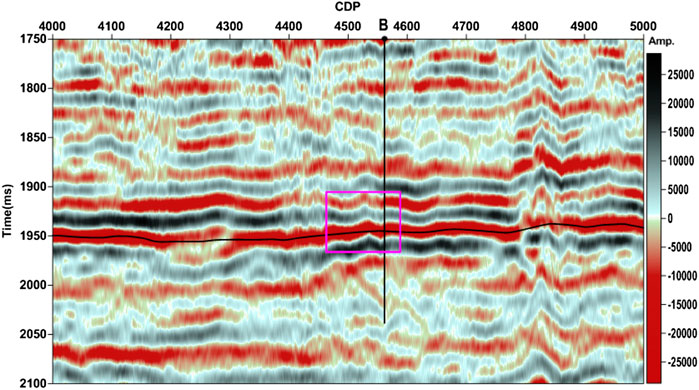
FIGURE 2. Seismic section intersecting well B. Note that the gas reservoir is marked by a pink rectangle. The horizon is marked by a black line.
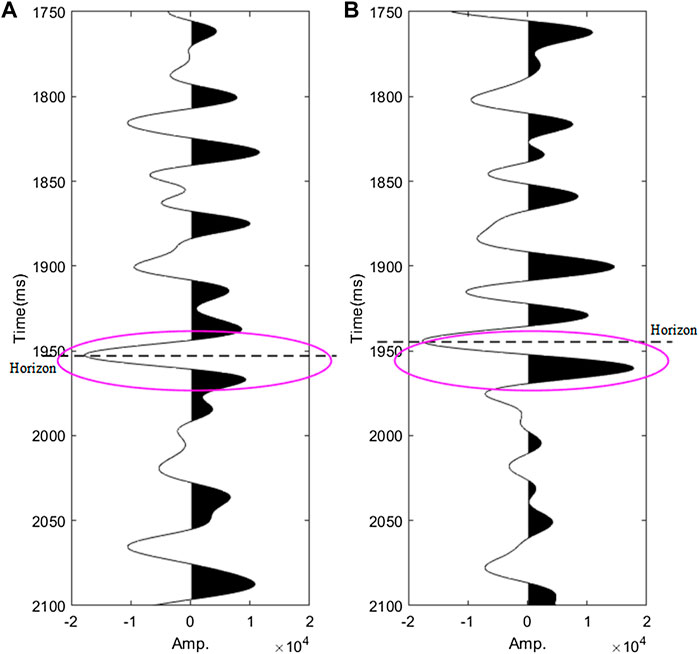
FIGURE 3. Seismic trace intersecting well A (A) and seismic trace intersecting well B (B). Note that the gas reservoir is marked by a pink ellipse.
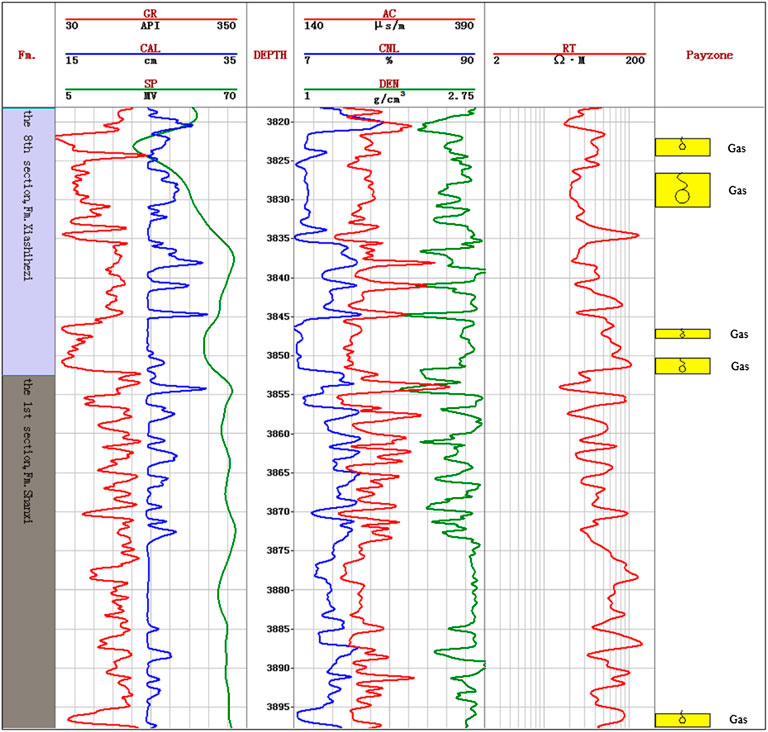
FIGURE 4. Logging curves and interpretation of well A in the 8th sections of the Xiashihezi Formation.
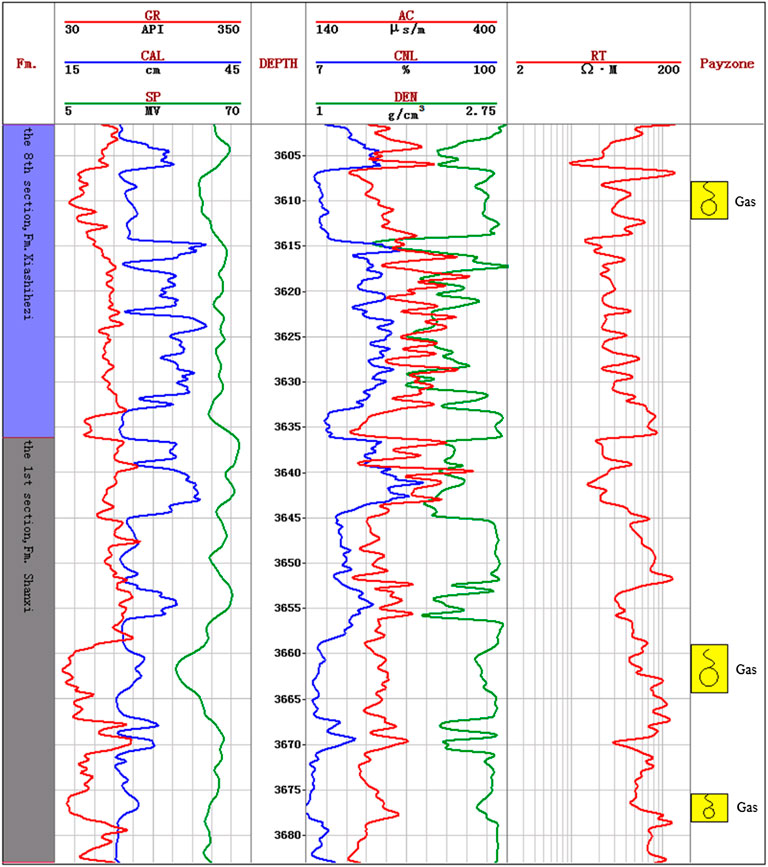
FIGURE 5. Logging curves and interpretation of well B in the 8th sections of the Xiashihezi Formation.
We first carried out a model test for evaluating the effectiveness of the VMD-based highlight volumes extraction method. Then a seismic section passing through the less prolific gas-saturated well A is used for an in-depth analysis to demonstrate how well the VMD-based method works with the weak seismic responses of the reservoir concealed by the strong amplitude reflections caused by the coal seams. A seismic section passing through the prolific gas-saturated well B is used for further validation of the VMD-based method in highlighting the gas-related contents effectively.
Variational mode decomposition–based highlight volumes extraction method
VMD combined with the Hilbert transform (HT) analysis is used as a new time–frequency method for seismic data with non-linear and non-stationary properties. It shows obvious advantages over any other conventional time–frequency methods, which mainly work with linear and stationary data or non-stationary data such as the short-time Fourier transform (STFT) and wavelet transform (Xue et al., 2016a; Liu et al., 2017).
In the VMD combined with the HT approach, a seismic signal
. The theory of VMD can be found in Supplementary Appendix A. After a VMD procedure, the original signal
where the phase
in which
Generally, we use the following equation to calculate the instantaneous frequency for avoiding ambiguities due to phase unwrapping in Eq. 2:
Thereafter, the joint time–frequency distribution of the signal is generalized by defining a three-dimensional space
The spectral decomposition can be carried out based on the obtained joint time–frequency distribution. For more clearly highlighting the hydrocarbon-related contents and reducing the needed number of series of common frequency volumes used in the spectral decomposition, we use highlight volumes which include the peak amplitude (PA) above the average volume and the peak frequency (PF) volume instead of the common frequency volumes (Blumentritt, 2008). These two attributes are shown to be more effective in highlighting the geological features of the layer of interest. The PA above the average volume is extracted as the maximum amplitude subtracting the average amplitude in the spectra of samples in the time–frequency domain. This attribute highlights more easily the amplitude anomalies. Large values indicate strong amplitude anomalies, and vice versa. The PF volume is extracted as the frequency at the maximum amplitude in the spectra of samples in the time–frequency domain. It is always related to the reservoir thickness. Small values indicate a thicker reservoir of the layer of interest, and vice versa. For VMD-based highlight volumes, we get the PA above the average volume
in which
The PF volume
These two attributes are all extracted sample-by-sample for each IMF of each trace in the time–frequency domain.
Results and discussion
Model test
For evaluating the effectiveness of the proposed workflow for the VMD-based PA above average volume extraction, a model test is carried out by using the diffusive-viscous wave equation, which embodies the diffusion and viscosity of the fluid-bearing porous media (Korneev et al.,2004). The geological model (Figure 6A) is designed based on the reservoir logging parameters of well A and the seismic data from the seismic section intersecting well A. The parameters of the seven layers are shown in Table 1. The data is sampled at 1 ms. The frequency of the wavelet is 30 Hz. The layer marked ③ with the thickness of 60 m denotes a coal seam layer. The layer marked ⑤ with the thickness of 20 m is a gas-bearing reservoir, whereas the adjoining layer marked ④ is a dry layer. The seismic response of the model is shown in Figure 6B. We can find that the response of the gas reservoir is submerged in the strong amplitudes because of the coal seam. After VMD, two IMF sections are generated. We can find that section IMF1 (Figure 6C) mainly reflects the information of the coal seam. The gas-bearing information and other formation information are reflected more in section IMF2 (Figure 6D). Therefore, we applied the VMD-based PA above average volume extraction method to section IMF2. The result (Figure 6E) targets the gas reservoir well compared with the traditional STFT-based PA above average volume (Figure 6F), which is unable to detect the gas reservoir because of the influence of the coal seam. Model test results show that the VMD-based PA above average volume extraction method works well with the gas detection concealed by the coal seam.
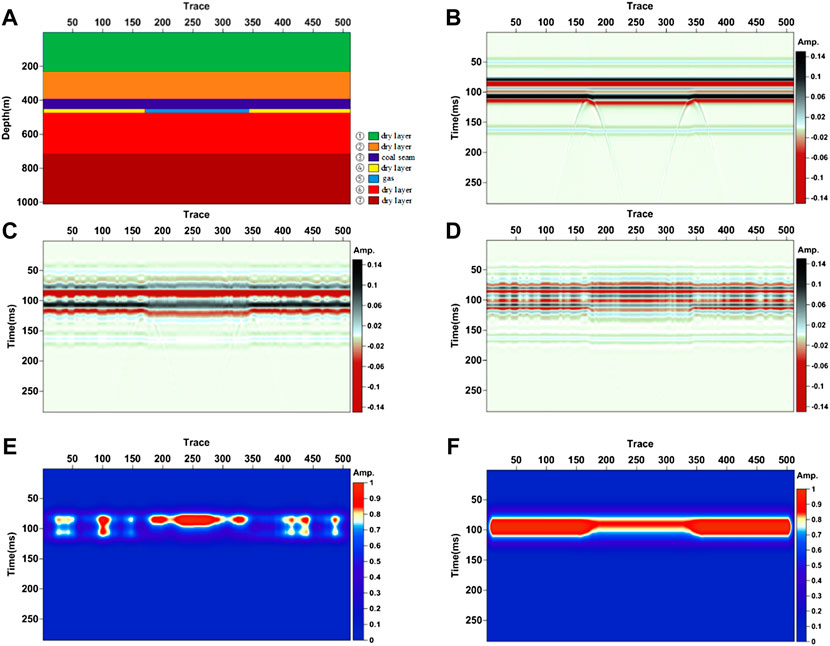
FIGURE 6. Model test. (A) Geology parameters of the model, (B) seismic response of the model, (C) IMF1 section of the model, (D) IMF2 section of the model, (E) PA above average section extracted by IMF2, (F) PA above average section generated by the traditional STFT for the model.

TABLE 1. Rock properties for geological model. Note that
Local features revealed by the VMD
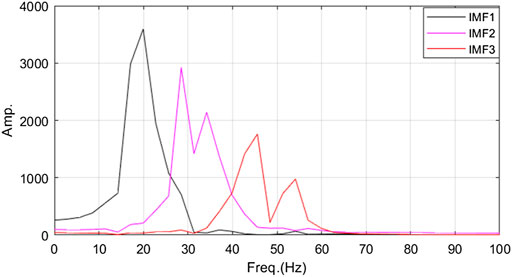
First, the seismic trace intersecting well A is taken for analysis. As a non-linear and non-stationary decomposition tool, VMD decomposes the seismic trace intersecting well A into three narrow-band IMFs (Figures 7B–D). IMF1 (Figure 7B), which has a lower frequency band (Figure 8), shows a larger time-scale seismic response. The strong amplitudes in the gas reservoir marked by a pink rectangle in IMF1 mainly reveal the coal seams. IMF2 and IMF3 (Figures 7C,D), which have relatively higher frequency bands (Figure 8), show smaller time-scale seismic responses and they mainly reflect geological and stratigraphic information and hydrocarbon-related contents.
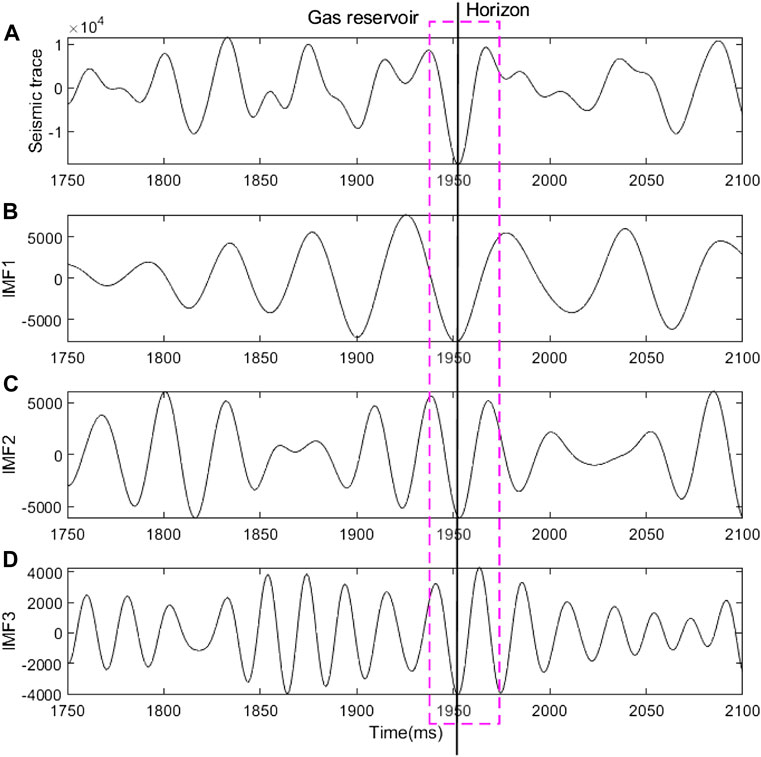
FIGURE 7. IMFs after VMD for the seismic trace intersecting well A. (A) Seismic trace intersecting well A, (B) IMF1 section, (C) IMF2 section, (D) IMF3 section. The decomposition level is set to 3. The parameters used in VMD are
The time–frequency distribution of the seismic trace passing through well A using the different methods is shown in Figure 9. Here, we compare the VMD combined with HT method with the two traditional time–frequency methods, the STFT and the continuous wavelet transform (CWT), and one high-resolution time–frequency method, the synchrosqueezed wavelet transform (SSWT). From Figure 9, one can find that the VMD combined with HT method and the SSWT show the highest time–frequency resolution and present the more detailed temporal and spatial distributions of the oscillation modes buried in the seismic data. The VMD combined with HT method and the SSWT (Figures 9A,D) mainly show three similar oscillations. These two techniques, which produce very close results based on completely different algorithms, further illustrate that these oscillations are indeed correct. Some rapid frequency modulations, especially the spectral lines around 50 Hz, are missing in the CWT and the STFT (Figures 9B,C) owing to the fact that these conventional techniques cannot achieve a high localization in both time and frequency.
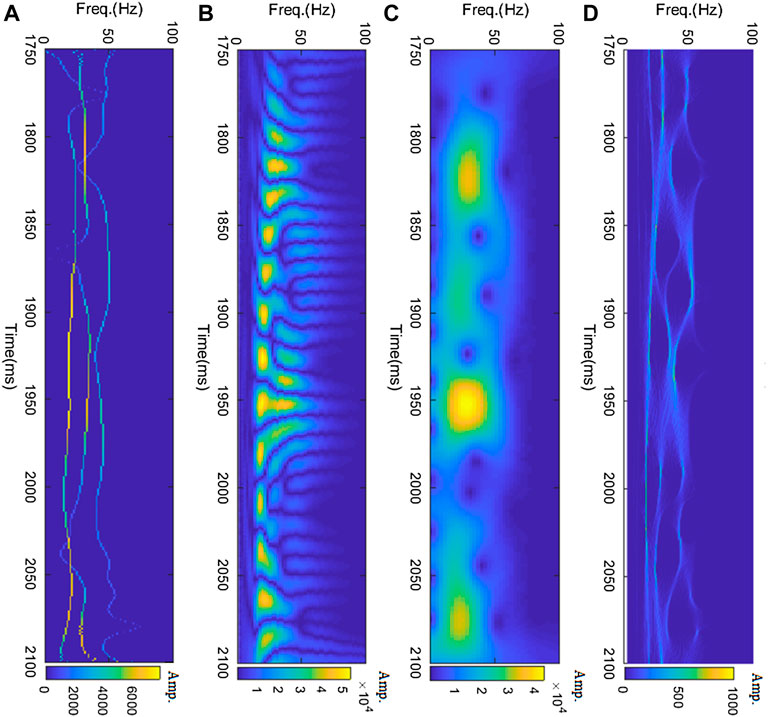
FIGURE 9. Time–frequency distribution of the seismic trace intersecting well A using the different methods. (A) VMD combined with HT. A 5 × 5 Gaussian smoothing is used on the joint time–frequency distribution for display purpose. (B) CWT. A Morlet wavelet is used. (C) STFT. A Hamming window with a length of 61 is used. (D) SSWT.
The IMFs generated by the VMD for the seismic section passing through well A are displayed in Figure 10. The strong amplitudes related to the coal seams are mainly revealed in the IMF1 section, in which only strong amplitudes reflections are found in the study area marked by a pink rectangle (Figure 10A). Further details are reflected in section IMF2, which are related to the geology and stratum that are underneath the concealment of the seismic responses of the coal seams in the original seismic section. We can find that there are some strong amplitudes around the horizon in the study area (Figure 10B) but these features are not revealed in the original seismic section in Figure 1. Section IMF3 (Figure 10C), which has the highest frequency bands, embodies additional minor details that may be caused by some subtle changes in the geological or fluid contents. Note that there are some very small amplitudes for some traces. These small amplitudes seem to create the discontinuity of the lateral distribution. However, this illustrates the fact that VMD has the ability to reveal different time-scale information and mirror the subtle changes that cannot be identified in the traditional methods. The same characteristics are found in the IMFs after the VMD for the seismic section passing through well B (Figure 11). Therefore, in the following gas detection, we mainly use the IMF2 and IMF3 components.
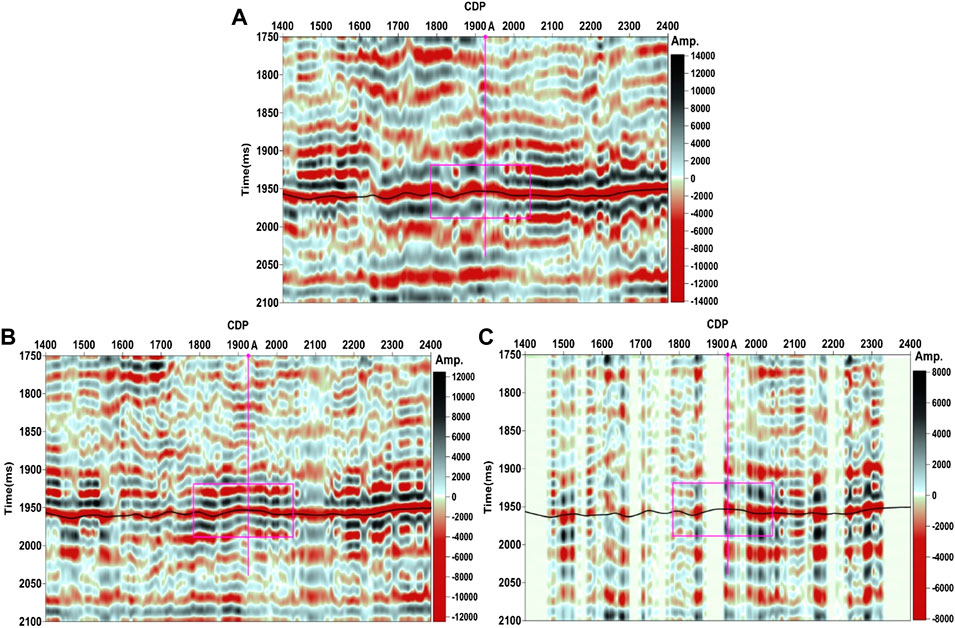
FIGURE 10. IMFs after VMD for the seismic section intersecting well A. (A) First IMF (IMF1), (B) second IMF (IMF2), (C) third IMF (IMF3).
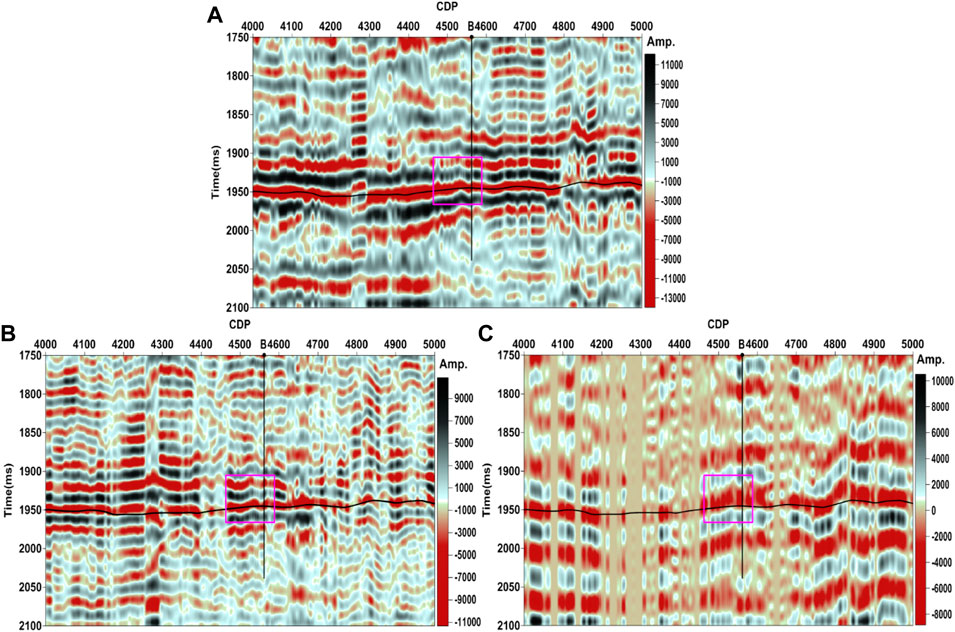
FIGURE 11. IMFs after VMD for the seismic section intersecting well B. (A) First IMF (IMF1), (B) second IMF (IMF2), (C) third IMF (IMF3).
A comparison study of the VMD-based spectral decomposition and the conventional spectral decomposition methods
In this section, we compare the PA above average volumes generated by the high-resolution VMD-based method and the conventional STFT and CWT methods. The comparison shows the superiority of the high-resolution VMD-based method in addressing subtle changes in the amplitude anomaly distribution and its effectiveness in targeting the weak seismic responses in the reservoir concealed by the coal seams.
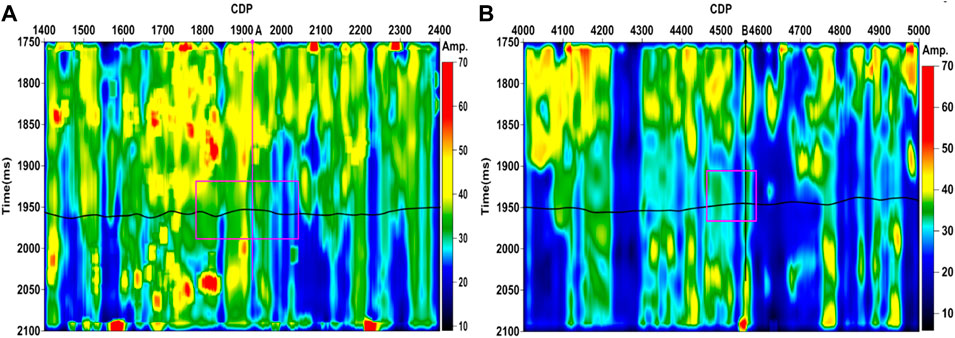
When the whole seismic data is involved in the calculation, the extracted PA above average volumes by the different methods are shown in Figures 12B–D. We can find that the VMD combined with HT method (Figure 12B) generates similar results to those obtained with the STFT (Figure 12C) and CWT (Figure 12D). The VMD combined with HT method (Figure 12B) shows more detailed changes in amplitude anomalies, especially in the right part of the PA above average volume, than the STFT (Figure 12C) and CWT (Figure 12D). However, none of the results can detect the amplitude anomalies around well A. Only some of the strongest amplitude anomalies in the right part of the study area and some strong amplitude anomalies in the left part of the study area are shown. The fact that all the other results cannot target the gas reservoir is mainly caused by the equivalent Q-filtering effect generated by the interference effect of sequential reflectivity spikes with short two-way travel time (Yuan et al., 2017). Therefore, the traditional workflow of these methods is unable to detect the gas reservoir because of the influence of coal seam.
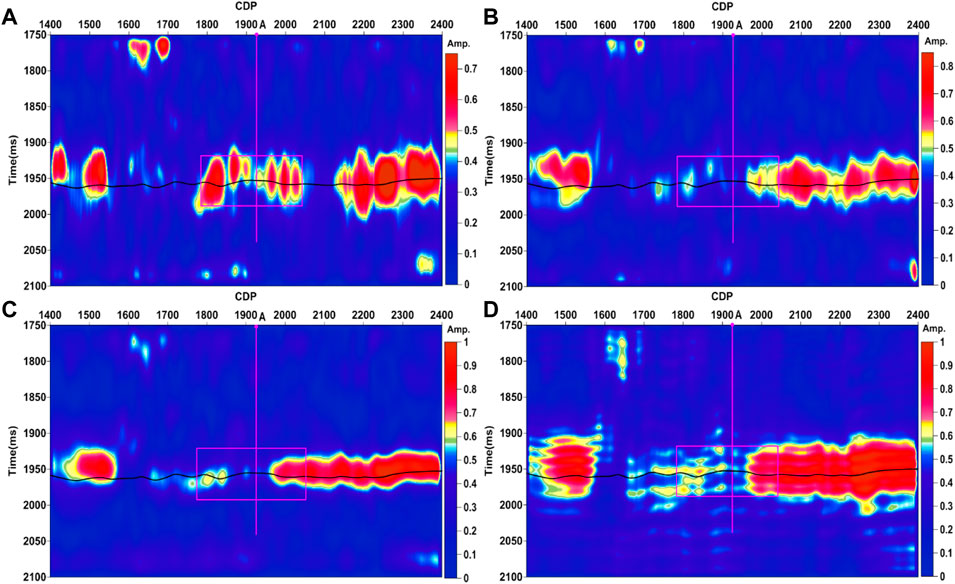
FIGURE 12. Comparison of PA above average volume for the seismic section intersecting well A. (A) Generated by VMD combined with HT using sections IMF2 and IMF3. (B) Generated by VMD combined with HT using the original seismic section. (C) Generated by STFT using the original seismic section; a Hamming window with a length of 61 is used. (D) Generated by CWT using the original seismic section; a Morlet wavelet is used.
Considering the analysis of the VMD features in the previous section, we use the IMF2 and IMF3 sections, which mainly reflect the geological and stratigraphic information and hydrocarbon-related contents, and reduce the strong amplitude responses of the coal seams for further gas detection. Figure 12A shows the PA above average volumes generated by the VMD combined with HT approach using sections IMF2 and IMF3. The violent amplitude anomalies are obviously detected in the reservoir marked by a pink rectangle. Compared with the other results in Figures 12B–D, Figure 12A provides a better hydrocarbon-related interpretation. This comparison shows that VMD can detect the weak seismic responses of the reservoir concealed by the strong amplitude reflections of the coal seams. Further gas detection using the IMFs, except those mainly reflecting the strong amplitude reflections of the coal seams, can provide an improved and better hydrocarbon-related interpretation, more consistent with the interpretation of the logging data.
Gas detection
Given that there is mainly sandstone in the study formations and the lateral distribution is stable, the amplitude anomalies are mainly caused by hydrocarbon-related contents. For the less prolific gas well A, the stronger amplitude anomalies are detected in the study area marked by a pink rectangle (Figure 12A) and it yields a hydrocarbon-related interpretation. The result is consistent with the logging interpretation and drilling information of well A. Figure 13 shows the amplitude above average volumes generated by the VMD combined with HT using the IMF2 and IMF3 sections intersecting well B (Figure 13A) and the STFT using the original seismic section (Figure 13B). One can find that the strongest amplitude anomalies are found in Figure 13A, and the conventional method is unable to detect the amplitude anomalies especially in the traces around well B. The consistency of the result suggested by Figure 13A and the logging interpretation and drilling information of well B further illustrate that the VMD effectively detects the weak seismic responses of the reservoir concealed by the coal seams. Moreover, the spectral decomposition using the VMD combined with HT yields an enhanced hydrocarbon-related interpretation. Both the PF volumes (Figure 14) for the sections intersecting well A and well B show larger frequencies that are distributed in the study area and indicate that the reservoir is thin.
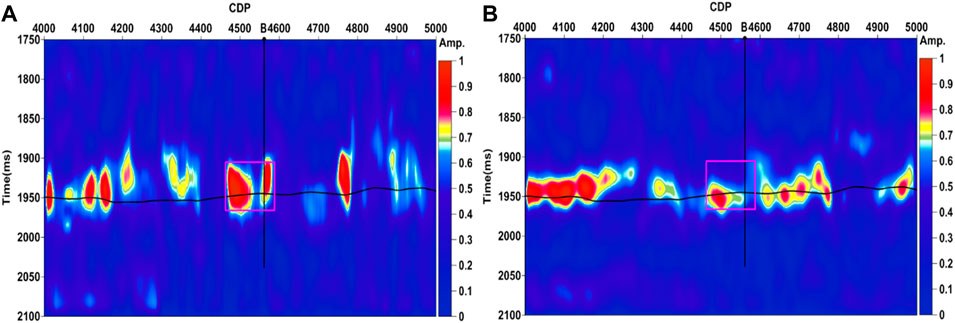
FIGURE 13. PA above average volumes generated by VMD combined with HT using the sections IMF2 and IMF3 intersecting well B (A) and STFT using the original seismic section (B), respectively. A Hamming window with a length of 61 is used in STFT.
Future works
Aiming at the weak seismic response of the gas reservoirs concealed by the adjacent strong reflection of coal seams in tight sandstone reservoirs, the VMD-based highlight volumes extraction approach is introduced in this paper. Model test is first used to evaluate the effectiveness of the proposed method. Then the VMD-based highlight volumes extraction approach is applied to the seismic sections intersecting the gas wells. By comparing with the traditional STFT and CWT based methods, we show the superiority of the proposed method. We also give the characteristics comparison between the whole seismic data used and the selected IMFs used. Model test results and field data application show that the VMD-based highlight volumes extraction approach using the selected IMFs can effectively detect the weak response of the gas reservoirs concealed by the adjacent strong reflection of coal seams for tight sandstone reservoirs.
The limitation of the proposed method is that the VMD-based highlight volumes extraction approach is carried out trace-by-trace. Therefore, there exists some lateral consistency problems in the results. Further research on improving the lateral consistency and applications of the proposed method in other tight sandstone reservoirs may provide more practical understanding of this method.
Conclusion
The characteristics of seismic responses related to coal seams, the geological and stratigraphic information, and the hydrocarbon-related contents covering different frequency bands are analyzed using VMD. The application of VMD-based highlight volumes extraction approach in the seismic sections intersecting well A and well B from a 2D line (86.88 km) in the Ordos Basin, China demonstrates that the characterization of the weak seismic responses in the reservoir concealed by the coal seams are mirrored to a significant extent. The comparison of the amplitude above average volumes generated by the VMD combined with HT and the conventional STFT and CWT using the whole data set shows that the highly precise VMD-based highlight volumes extraction approach targets the amplitude anomalies with temporal and spatial changes in more detail. The amplitude above average volumes generated by the VMD combined with HT using the selected IMFs, which remove the main information of the coal seams, yield a better hydrocarbon-related interpretation. The VMD-based highlight volumes extraction approach is adaptive and easy to perform, and its effectiveness is significant. Such adaptive decomposition processing methodology will introduce new vitality to the gas detection interfered or concealed by adjacent coal seams or other source rocks for tight sandstone reservoirs. The characterization of weak seismic responses in reservoirs concealed by coal seams that does not suppress the influence of the strong reflection amplitudes caused by the coal seams would often fail to detect the gas reservoirs or overestimate the lateral distribution of the gas strata.
Data availability statement
The raw data supporting the conclusion of this article will be made available by the authors, without undue reservation.
Author contributions
X-JW and Y-JX designed the project. X-JW processed the synthetic and field data. X-JW wrote the manuscript. Y-JX reviewed the manuscript.
Funding
This work was supported by the National Natural Science Foundation of China under Grant 42074163, 41674112 and the Special Project of Local Science and Technology Development guided by the Central Government in Sichuan (No. 2021ZYD0030).
Conflict of interest
The authors declare that the research was conducted in the absence of any commercial or financial relationships that could be construed as a potential conflict of interest.
Publisher’s note
All claims expressed in this article are solely those of the authors and do not necessarily represent those of their affiliated organizations, or those of the publisher, the editors, and the reviewers. Any product that may be evaluated in this article, or claim that may be made by its manufacturer, is not guaranteed or endorsed by the publisher.
Supplementary material
The Supplementary Material for this article can be found online at: https://www.frontiersin.org/articles/10.3389/feart.2022.872525/full#supplementary-material
References
An, P. (2006a). Application of multi-wavelet seismic trace decomposition and reconstruction to seismic data interpretation and reservoir characterization. SEG Tech. Program Expand. Abstr. 2006, 973–977. doi:10.1190/1.2370419
An, P. (2006b). Case studies on stratigraphic interpretation and sand mapping using volume-based seismic waveform decomposition. 2006 SEG Annual Meeting, New Orleans, Louisiana, SEG-2006-0496. doi:10.1190/1.2370307
Anderson, A. L., and Hampton, L. D. (1980). Acoustics of gas-bearing sediments I. Back- ground. J. Acoust. Soc. Am. 67 (6), 1865–1889. doi:10.1121/1.384453
Blumentritt, C. H. (2008). Highlight volumes: Reducing the burden in interpreting spectral decomposition data. Lead. Edge 27 (3), 330–333. doi:10.1190/1.2896623
Castagna, J. P., Sun, S., and Siegfried, R. W. (2003). Instantaneous spectral analysis: Detection of low-frequency shadows associated with hydrocarbons. Lead. Edge 22, 120–127. doi:10.1190/1.1559038
Chakraborty, A., and Okaya, D. (1995). Frequency-time decomposition of seismic data using wavelet-based methods. Geophysics 60, 1906–1916. doi:10.1190/1.1443922
Dragomiretskiy, K., and Zosso, D. (2014). Variational mode decomposition. IEEE Trans. Signal Process. 62 (3), 531–544. doi:10.1109/tsp.2013.2288675
Guo, J., and Wang, Y. H. (2004). Recovery of a target reflection underneath coal seams. J. Geophys. Eng. 1 (1), 46–50. doi:10.1088/1742-2132/1/1/005
Korneev, V. A., Goloshubin, G. M., Daley, T. M., and Silin, D. B. (2004). Seismic low frequency effects in monitoring fluid-saturated reservoirs. Geophysics 69 (2), 522–532. doi:10.1190/1.1707072
Liu, J. Z., Shi, L., Dong, N., Xia, H. M., and Wang, J. B. (2017). The processing technique of improving the resolution for the thin hydrocarbon reservoir with coal seam. Geophys. Prospect. Petroleum 56 (2), 216–221. (in Chinese). doi:10.3969/j.issn.1000-1441.2017.02.008
Liu, W., Cao, S., and Chen, Y. (2016). Applications of variational mode decomposition in seismic time-frequency analysis. Geophysics 81 (5), V365–V378. doi:10.1190/geo2015-0489.1
Liu, W., Cao, S., Wang, Z., Kong, X., and Chen, Y. (2017). Spectral decomposition for hydrocarbon detection based on VMD and Teager-Kaiser energy. IEEE Geosci. Remote Sens. Lett. 14 (4), 539–543. doi:10.1109/lgrs.2017.2656158
Ren, J. H., Zhang, L., Ezekiel, J., Ren, S., and Meng, S. Z. (2014). Reservoir characteristics and productivity analysis of tight sand gas in Upper Paleozoic Ordos Basin China. J. Nat. Gas Sci. Eng. 19, 244–250. doi:10.1016/j.jngse.2014.05.014
Wang, Y., Feng, X. Y., Qin, S., Wang, M. H., Yan, K. X., Liu, H., et al. (2015). Application of wavelet decomposition and reconfiguration technique for identification of CBM in Zhengzhuang of Shanxi. China Pet. Explor. 20 (1), 78–83. (in Chinese). doi:10.3969/j.issn.1672-7703.2015.01.009
Wu, X., and Liu, T. (2009). Spectral decomposition of seismic data with reassigned smoothed pseudo Wigner–Ville distribution. J. Appl. Geophys. 68, 386–393. doi:10.1016/j.jappgeo.2009.03.004
Xue, Y. J., Cao, J. X., Du, H. K., Zhang, G. L., and Yao, Y. (2016b). Does mode mixing matter in EMD-based highlight volume methods for hydrocarbon detection? Experimental evidence. J. Appl. Geophys. 132, 193–210. doi:10.1016/j.jappgeo.2016.07.017
Xue, Y. J., Cao, J. X., and Tian, R. F. (2014). EMD and Teager–Kaiser energy applied to hydrocarbon detection in a carbonate reservoir. Geophys. J. Int. 197 (1), 277–291. doi:10.1093/gji/ggt530
Xue, Y. J., Cao, J. X., Wang, D. X., Du, H. K., and Yao, Y. (2016a). Application of the variational-mode decomposition for seismic time–frequency analysis. IEEE J. Sel. Top. Appl. Earth Obs. Remote Sens. 9 (8), 3821–3831. doi:10.1109/jstars.2016.2529702
Xue, Y. J., Cao, J. X., Wang, D. X., Tian, R. F., and Shu, Y. X. (2013). Detection of gas and water using HHT by analyzing P-and S-wave attenuation in tight sandstone gas reservoirs. J. Appl. Geophys. 98, 134–143. doi:10.1016/j.jappgeo.2013.08.023
Xue, Y. J., Du, H. K., Cao, J. X., Jin, D., Chen, W., Zhou, J., et al. (2018). Application of a variational mode decomposition-based instantaneous centroid estimation method to a carbonate reservoir in China. IEEE Geosci. Remote Sens. Lett. 15 (3), 364–368. doi:10.1109/lgrs.2017.2788467
Yuan, S., Ji, Y., Shi, P., Zeng, J., Gao, J., Wang, S., et al. (2019). Sparse Bayesian learning-based seismic high-resolution time-frequency analysis. IEEE Geosci. Remote Sens. Lett. 16 (4), 623–627. doi:10.1109/lgrs.2018.2883496
Yuan, S., Wang, S., Ma, M., Ji, Y., and Deng, L. (2017). Sparse Bayesian learning-based time-variant deconvolution. IEEE Trans. Geosci. Remote Sens. 55 (11), 6182–6194. doi:10.1109/tgrs.2017.2722223
Zhao, S., Li, Z. D., Xu, H. M., and Li, X. G. (2007). Using multiple wavelet decomposition technique to detect the sandstone reservoir with coal layer. Nat. Gas. Ind. 27 (9), 44–47. (in Chinese). doi:10.3321/j.issn:1000-0976.2007.09.013
Zhu, H., Chen, K., Liu, K., and He, S. (2008). A sequence stratigraphic model for reservoir sand-body distribution in the Lower Permian Shanxi Formation in the Ordos Basin, northern China. Mar. Petroleum Geol. 25 (8), 731–743. doi:10.1016/j.marpetgeo.2008.03.007
Keywords: gas detection, sandstone gas reservoir, coal seams, variational mode decomposition, spectral decomposition
Citation: Wang X-J and Xue Y-J (2022) Gas detection with the influence of a coal layer using a variational mode decomposition–Based highlight volumes extraction method in a tight sandstone reservoir. Front. Earth Sci. 10:872525. doi: 10.3389/feart.2022.872525
Received: 09 February 2022; Accepted: 07 July 2022;
Published: 08 August 2022.
Edited by:
Orietta Nicolis, Andres Bello University, ChileReviewed by:
Qiang Guo, China Jiliang University, ChinaAli Abedini, Urmia University, Iran
Chong Xu, Ministry of Emergency Management, China
Copyright © 2022 Wang and Xue. This is an open-access article distributed under the terms of the Creative Commons Attribution License (CC BY). The use, distribution or reproduction in other forums is permitted, provided the original author(s) and the copyright owner(s) are credited and that the original publication in this journal is cited, in accordance with accepted academic practice. No use, distribution or reproduction is permitted which does not comply with these terms.
*Correspondence: Ya-Juan Xue, eHVleWowODY5QDE2My5jb20=
 Xing-Jian Wang
 Ya-Juan Xue