 Samuli Helama1*
 Hannu Herva1
 Laura Arppe2
 Björn Gunnarson3,4
 Thomas Frank5Jari Holopainen6
 Pekka Nöjd7
 Harri Mäkinen7
 Kari Mielikäinen7Raimo Sutinen8
 Mauri Timonen1Joonas Uusitalo2Markku Oinonen2
- 1Natural Resources Institute Finland, Rovaniemi, Finland
- 2Laboratory of Chronology, University of Helsinki, Helsinki, Finland
- 3Department of Physical Geography, Stockholm University, Stockholm, Sweden
- 4Bolin Centre for Climate Research, Stockholm University, Stockholm, Sweden
- 5Department of Earth Sciences, Uppsala University, Uppsala, Sweden
- 6Natural Resources Institute Finland, Helsinki, Finland
- 7Natural Resources Institute Finland, Espoo, Finland
- 8Geological Survey of Finland, Rovaniemi, Finland
Tree-ring records constitute excellent high-resolution data and provide valuable information for climate science and paleoclimatology. Tree-ring reconstructions of past temperature variations agree to show evidence for annual-to-centennial anomalies in past climate and place the industrial-era warming in the context of the late Holocene climate patterns and regimes. Despite their wide use in paleoclimate research, however, tree rings have also been deemed unsuitable as low-frequency indicators of past climate. The arising debate concerns whether the millennia-long tree-ring records show signals of orbital forcing due to the Milankovitch cycles. Here, we produce a summer-temperature reconstruction from tree-ring chronology running through mid- and late-Holocene times (since 5486 BCE) comprising minimum blue channel light intensity (BI). The BI reconstruction correlates with existing and new tree-ring chronologies built from maximum latewood density (MXD) and, unlike the MXD data, shows temperature trends on Milankovitch scales comparable to various types of sedimentary proxy across the circumpolar Arctic. Our results demonstrate an unrevealed potential of novel, unconventional tree-ring variables to contribute to geoscience and climate research by their capability to provide paleoclimate estimates from inter-annual scales up to those relevant to orbital forcing.
Introduction
Tree rings form a core component of late Holocene climate reconstruction. Since the seminal work of H. C. Fritts (1976), dendroclimatic analyses have become almost a routine of climate research, and their use has even intensified and diversified over the past decades with a constantly evolving array of analytical techniques and multidisciplinary approaches (Domínguez-Delmás, 2020; Pearl et al., 2020). In terms of modern paleoclimatology, the benefits of tree-ring proxy data could be itemized first by their exact dating using dendrochronological methods; second, by the potential of their climatic reconstructions to be calibrated and verified directly against the instrumental meteorological records; and third, by the length of the long tree-ring chronologies now enabling their use for the Holocene event-stratigraphic approaches similar to ice-core and speleothem records (Helama and Oinonen, 2019). Even so, however, tree rings have been notorious, especially in the older literature, for their value as low-frequency indicators of past climate (e.g., Broecker, 2001; Mann, 2002). Much of this reputation could be seen to have stemmed from methodological problems of how to remove the biological “noise” from the data, while not removing any portion of the actual climatic “signal,” when both operate on similar time scales (Cook et al., 1995). Methodological improvements by Briffa et al. (1992, 1996), with further refinements for the methods presented in the subsequent literature (see Helama et al., 2017), however, have paved the way for new tree-ring reconstructions with low-frequency indications demonstrating the structure and climate variability over the past millennium and through the Little Ice Age and Medieval Climate Anomaly (e.g., Wilson et al., 2016; Anchukaitis et al., 2017). This discussion was settled for some time, meanwhile the tree-ring records were increasingly used for temperature reconstructions over the past millennium over which period majority of the longest chronologies still today extend.
More recently, a new form of the low-frequency issue has addressed the question of whether the tree-ring records show the signals of orbital forcing due to the Milankovitch cycles, in particular, the high-latitude summer-temperature cooling expected from decreasing insolation through the Holocene, with comparisons over the Common Era (Klippel et al., 2020; Luecke et al., 2021). Indeed, several tree-ring chronologies covering the mid- and late-Holocene times were published for the first time 20 years ago (Briffa and Matthews, 2002). Temperature-sensitive records were constructed from the ring widths of Pinus and Larix, representing northern Eurasian sites, and appeared to show no appreciable trends attributable to the summer cooling over the corresponding preindustrial periods because of orbital forcing (Eronen et al., 2002; Grudd et al., 2002; Gunnarson and Linderholm, 2002; Hantemirov and Shiyatov, 2002; Helama et al., 2002; Naurzbaev et al., 2002). The lack of such temperature trends became contrasted by phytogeographical data collected from nearby sites showing altitudinal and latitudinal retreats of timberlines in the same region, indicative of long-term temperature decline because of the fact that the regeneration of high-altitude and -latitude trees is strongly linked to warmer than average summer temperatures (e.g., Kullman, 1992). Similar long-term trends linked with orbital forcing have been commonly detected from Holocene-long summer temperature reconstructions based on pollen and other microfossil and macrofossil data recovered from sedimentary archives in the same region (e.g., Seppä et al., 2002; Helama et al., 2004a; Seppä et al., 2008; Seppä et al., 2009; Helama et al., 2012; Edvardsson et al., 2022). Later, an MXD chronology representing Scots pine tree rings from northern Finland was constructed over the past two millennia. In contrast to indications from tree-ring width data, the temperature reconstruction from this chronology was used to demonstrate a preindustrial summertime cooling of 0.31°C (±0.03°C) per millennium for the same region (Esper et al., 2013).
Several research questions remain open, however, not only for the characteristics of the MXD data but also for the multiple sources of new types of dendroclimatic data available from tree-ring materials, especially so with chronologies now intended to be extended over the mid- and late-Holocene times. With these regards, a more detailed analysis of the long-term cooling trend and its estimation using the foregoing MXD-dataset from northern Finland (Esper et al., 2013) and a slightly shorter one from northern Sweden (Melvin et al., 2013) showed that the characteristics of the long-term trends in these data may possibly relate to the origin of the tree-ring materials (Matskovsky and Helama 2016). That is, comparisons over their common period (517–2006 CE) found a positive trend in temperature in the data originally (Bartholin and Karlén 1983) collected from dry mountainous terrains (Melvin et al., 2013), while the other MXD-based reconstructions (dominated by subfossil materials from lacustrine archives) revealed negative temperature trends over this period for the past 1.5 thousand years. Whether this discrepancy arises from site- or taphonomy-related factors (or their combination) remains, to our knowledge, an open research question.
Clearly, the scarcity of similar data critically impairs not only our understanding of tree-ring properties and variables as proxy data but also our ability to conceive and address many fundamental questions for which high-resolution paleoclimate data are crucially required. Meanwhile, tree rings remain the only terrestrial source of past climate variability to reliably assign the annual and longer events to a calendric timeline without dating uncertainties. Here, we surmount these barriers by achieving a tree-ring chronology running through mid- and late-Holocene times and comprising the minimum blue channel light intensity (BI) of latewood, shown previously to provide a highly skilled surrogate for the MXD of Pinus sylvestris tree rings (Campbell et al., 2007). Our BI record was developed over the past decade of field and laboratory work from altogether 1,437 individual sample disks of subfossil P. sylvestris trees from 22 sites between the Arctic timberline and the Arctic Circle in northern Fennoscandia, with this chronology extending the timeframe of the longest MXD chronology by c. 5,500 years backward. The BI data were compared with existing and newly created MXD data for the same sites over the instrumental era and over shorter late- and mid-Holocene periods and with other summer temperature records representing various types of sedimentary proxy data known to bear temperature trends on Milankovitch scales across the circumpolar Arctic.
Materials and Methods
Tree-Ring Data
Subfossil tree trunks representing Scots pine wood (Pinus sylvestris L.) were collected from lake sediments in several sites at the Arctic timberline and at the Arctic Circle (Figures 1A,B; Supplementary Table S1). The trunks were pulled to the shore, sawn into disks, and returned to the lake. The samples were air-dried for 6 to 12 months and their cross-sectional surfaces were sanded down and scanned for digital images from which the series of tree-ring widths were measured using CooRecorder 7.7 software (Figure 2) (Rydval et al., 2014; Maxwell and Larsson, 2021). In addition to visual dating, the process of cross-dating was carried out using statistical tests (Holmes, 1983) using the tree-ring width data. Moreover, the surface reflectance of the wood was determined from the scanned images using the CooRecorder (Rydval et al., 2014; Maxwell and Larsson, 2021), and the minimum blue channel light intensity (BI) of the latewood portion of each annual ring was obtained. The BI data have been shown to provide a highly skilled surrogate for the MXD of P. sylvestris tree rings (Campbell et al., 2007). New MXD (maximum latewood density) data were produced for a smaller set of tree-ring samples from living and subfossil P. sylvestris trees using the standard protocols (Gunnarson et al., 2011). Regional Curve Standardization (RCS) (Briffa et al., 1992; Helama et al., 2017), in combination with signal-free implementation (Melvin and Briffa, 2008), was used for removing the non-climatic, age-related variations from the BI and MXD data. Age-related trends in tree-ring data were identified using the “Shah” and “Hugershoff” functions fitted to a cloud of tree-ring measurements (Björklund et al., 2013). The “Hugershoff” function (Bräker, 1981) is commonly used for modeling age-related trends in the MXD series (Briffa et al., 1992; Briffa et al., 1996). This function was found to be unsatisfactory as a model for the age-related changes in BI data, and the “Shah” function was used here for modeling the BI change as a function of tree biological age. The parameterizations of these functions were solved by the Levenberg–Marquardt algorithm (Moré, 1978). The series of (detrended) tree-ring indices were obtained by dividing BI and MXD measurement values by the respective values of the “Shah” (BIx = a + bx + cdx, where x is the tree age and a, b, c, and d are coefficients from modeling) and “Hugershoff” (MXDx = axbe−cx + d) functions. Cross-dated and detrended tree-ring indices were averaged into the mean BI and MXD chronologies. Statistical comparisons between the chronologies were carried out using Pearson’s product-moment correlation coefficient. Similar to a previous study (Esper et al., 2013), the chronologies were compared only over the well-replicated periods (replication, n ≥ 10 series per year). The earliest and latest dates fulfilling this criterion in our BI composite chronology (combining the sites at the Arctic timberline and at the Arctic Circle) are 5487 BCE and 1811 CE, respectively. The common period for the MXD-based records of Matskovsky and Helama (2014) [built previously using the MXD data from the same region by Schweingruber et al. (1988), Grudd (2008), Esper et al. (2013), and Melvin et al. (2013) (https://www.ncdc.noaa.gov/paleo-search/study/17264)] and of this study with n ≥ 10 series per year was achieved for the 1823–2010 CE period. The temperature-sensitivity of the BI data was tested by calculating Pearson’s correlations between the BI chronology and monthly and seasonal temperature records. Such temperature data representing the region of Lapland and overlapping with the BI records were available from the Tornio/Yli-Tornio district. These data cover the years from 1738 to 1835 CE, with gaps (number of years with data varied from 47 to 48, depending on the monthly variable) (Holopainen and Vesajoki, 2001; Helama et al., 2004b). Calculation and homogenization of daily temperature values were carried out using the established methodology (Moberg and Bergström, 1997), which accounted for changing measurement time of observations, as described previously by Vesajoki et al. (1995) and Holopainen and Vesajoki (2001). Later, Klingbjer and Moberg (2003) suggested excluding the observations of this temperature dataset from the year 1815 CE because of potential outliers. Here, we calculated the correlations first for a full set of temperature data (Holopainen and Vesajoki, 2001; Helama et al., 2004a) and then for data from which values of that particular year (1815 CE) have been removed. For comparison, similar correlations were calculated for the MXD-based records of Matskovsky and Helama (2014).
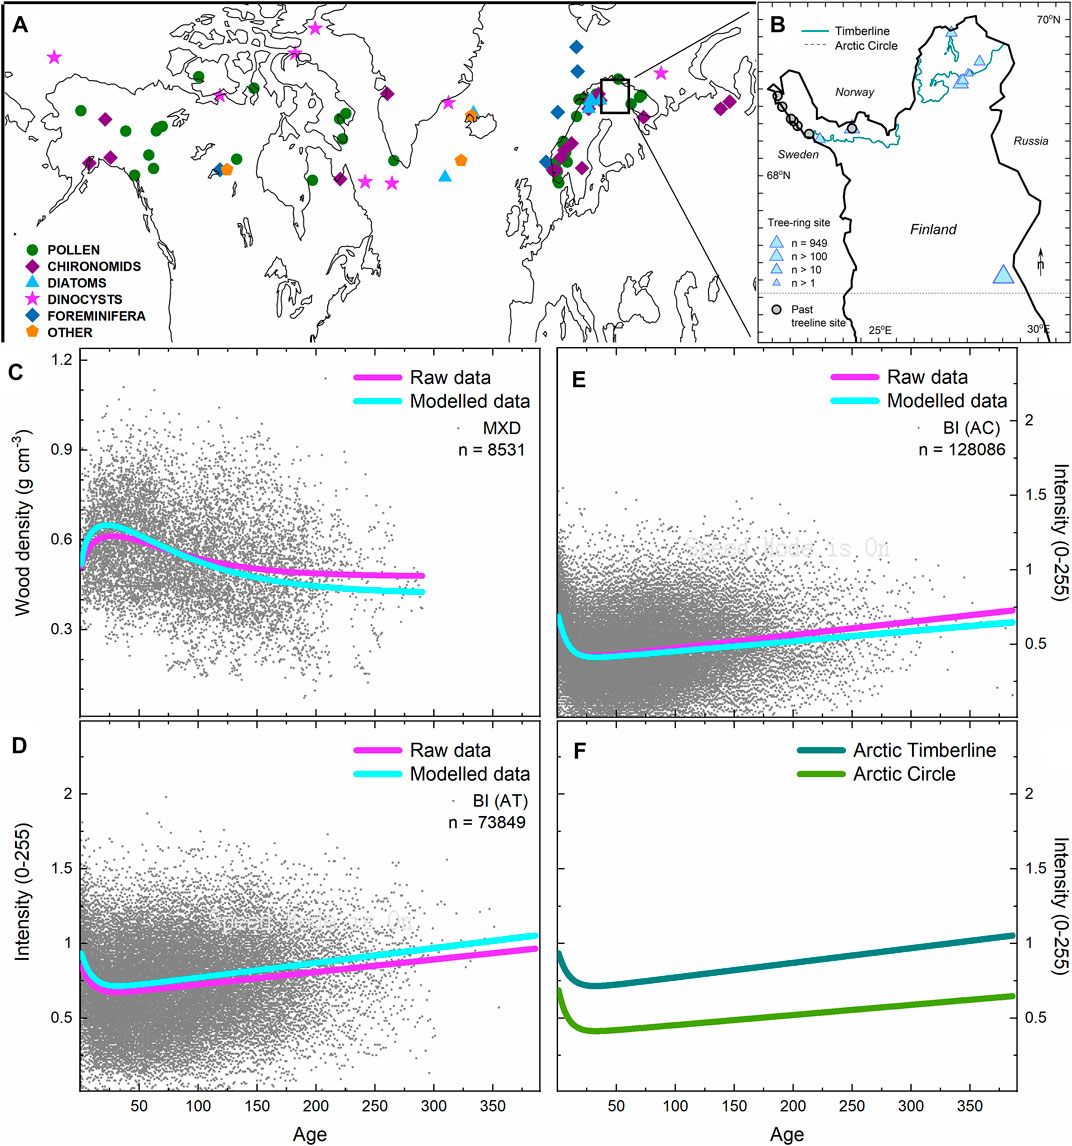
FIGURE 1. Data characterization. (A) Tree-ring and other proxy sites around the Arctic region and (B) in Finnish Lapland. Tree-ring sites represent new data of this study. Multiproxy data represent previously archived (Sundqvist et al., 2014) temperature records. Past tree-line sites represent published (Seppä et al., 2002; Helama et al., 2004a) and new data. Tree-ring data from Pinus sylvestris trees show age-related trends in (C) maximum latewood density (MXD) and minimum blue channel light intensity (BI) from the trees at (D) Arctic Timberline (AC) and (E) Arctic Circle (AC). Growth trends were determined for raw and modeled (Melvin and Briffa, 2008) tree-ring data. (F) BI data from the Arctic Timberline exhibit higher BI values than from the Arctic Circle.
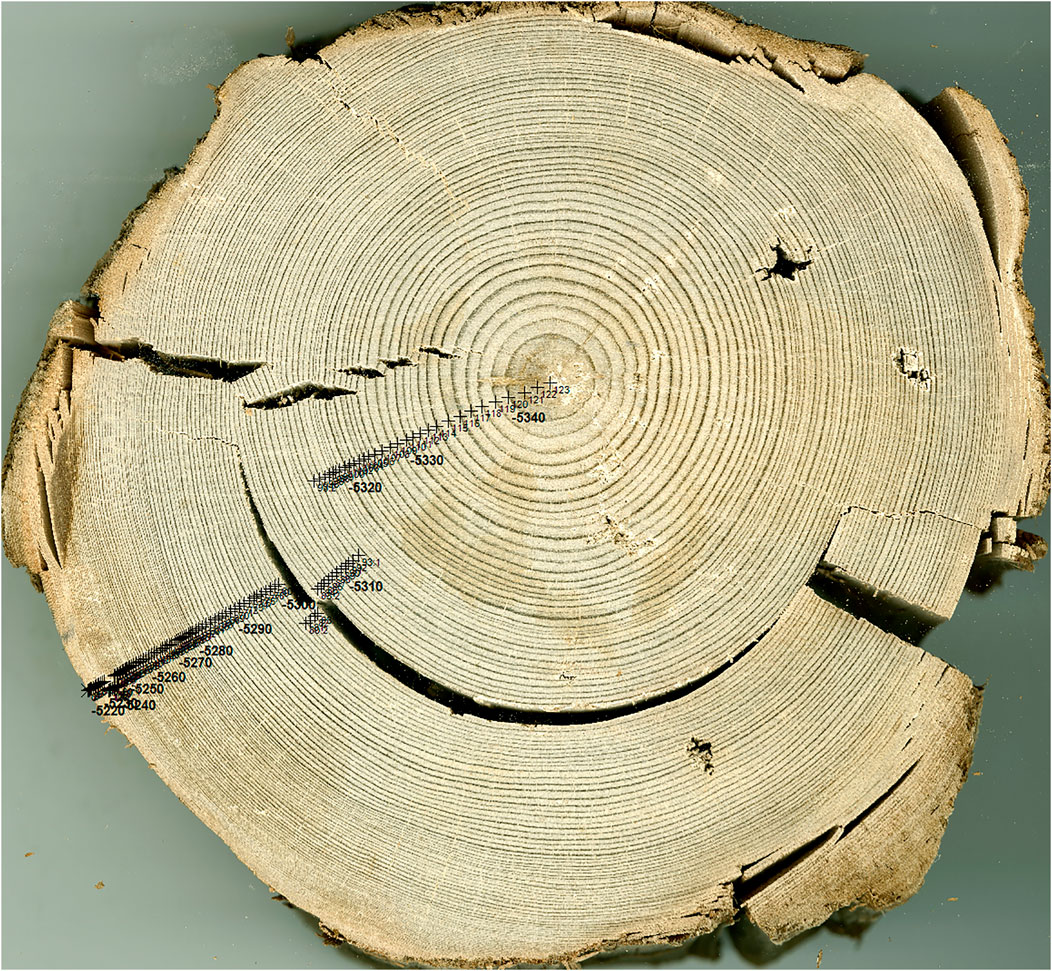
FIGURE 2. Scanned cross-section of a typical subfossil pinewood sample with tree rings measured in CooRecorder software (Rydval et al., 2014; Maxwell and Larsson, 2021). Measurements of this sample were carried out in three longer and one short separate segment, minding the gap formed during the shrinkage, perpendicularly to ring boundaries. Image by Hannu Herva (22 April 2013).
Temperature Reconstructions
The data of the new MXD record were transformed into a temperature scale first by 1) linear regression and then, as an alternative, 2) by setting the mean and standard deviation of the new data equal to the mean and standard deviation of the existing temperature reconstruction (Matskovsky and Helama, 2014) over the same period. Our third approach was 3) to set the mean and standard deviation of the regression-based reconstruction 1) equal to the mean and standard deviation of the existing temperature reconstruction (Matskovsky and Helama, 2014). The 117–1811 CE period was known to have a replication of n ≥ 10 and was used for the calibration of the BI chronology, over which period this record was transformed into annually-resolved temperature estimates by 1) regression, 2) scaling, and 3) regression after scaling. The data withheld from calibration were used to verify the reconstruction skill, and the MXD- and BI-based temperature reconstructions were compared with the existing temperature record (Matskovsky and Helama, 2014). Calibration and verification statistics (Tables 1, 2) calculated over the instrumental and preindustrial periods included the coefficient of determination (Rcal2), variance explained (rver2), the reduction of error (RE) (Fritts, 1976), and the coefficient of efficiency (CE) (Briffa et al., 1988). The scaled temperatures resulted in equal outcomes in the case of Rcal2 and rver2 for their regression-based counterparts, but negative RE and CE results indicated that scaling was not a proper approach for transforming the tree-ring values into paleoclimate estimates. Compared to scaling, multiple regression models benefit from using more than one explaining variable in the time domain. In practice, regression models explaining the temperature in a year (t) with tree-ring values in concurrent (t), previous (t−1), and forthcoming (t + 1) years can result in improved calibration and verification statistics (Briffa et al., 1988; Briffa et al., 1992; Helama et al., 2009). Improvements in Rcal2 and rver2 statistics also indicate reconstructed temperature amplitudes that are closer to those observed in the explained variable (Esper et al., 2005; Helama et al., 2009). In the case of our MXD and BI data, multiple regression models showed higher Rcal2 and rver2 than scaling or regression models with one explaining variable. Combined with scaling, the multiple regression models resulted in positive RE and CE outcomes and were chosen as our paleoclimate reconstructions. These reconstructions showed higher temperature amplitudes due to both higher Rcal2 and scaling (here, subsequent to regression) (see Esper et al., 2005). Confidence intervals were estimated for the reconstruction using the same calibration method. Regarding the MXD data, a set of 50 tree-ring values was randomly selected from the 1823–2010 CE period and used for the calibration and production of temperature reconstructions over the 117–2010 CE period. A similar approach was applied to BI data, but a set of 100 tree rings was randomly selected from the 117–1811 CE period and used for calibrating and producing temperature reconstructions over the full preindustrial period (5487 BCE –1811 CE). This process was repeated n = 1,000 times and the 97.5 th and 2.5 th percentiles from the n = 1,000 reconstructions (calculated separately for MXD and BI data) were adopted as the confidence intervals for each annual estimate of the reconstructions.
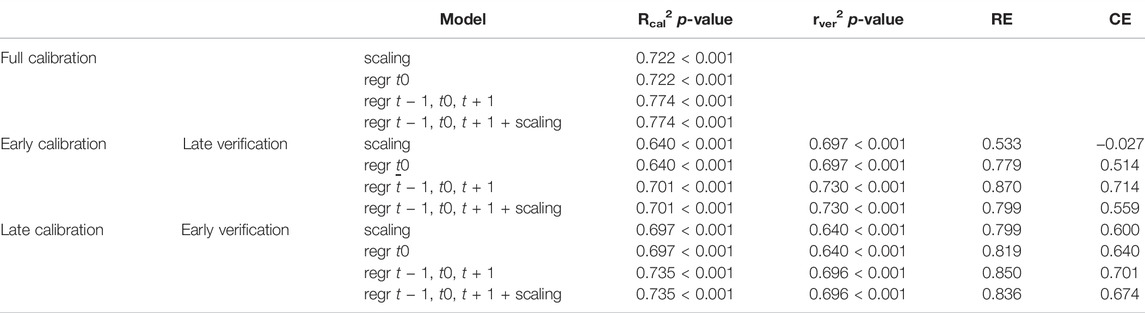
TABLE 1. Calibration and verification statistics over the instrumental period. The MXD (maximum latewood density) record transformed into the temperature scale over the full, early, and late calibration periods (1823–2010 CE, 1823–1916 CE, and 1917–2010 CE, respectively) and the obtained temperature reconstructions verified over the late and early verification periods [1917–2010 CE and 1823–1916 CE, respectively). The calibration/verification statistics include the coefficient of determination (Rcal2) and variance explained (rver2), given with their Monte Carlo–based p-values, and the reduction of error (RE) and the coefficient of efficiency (CE). Regression models (regr) with one (t0; concurrent of dependent value) or multiple independent variables (t−1, t0, t + 1; predating, concurrent, and lagging the dependent value) are included. For regression-based reconstructions, the RE and CE statistics are positive for both sub-periods, indicating real skill in the reconstruction.
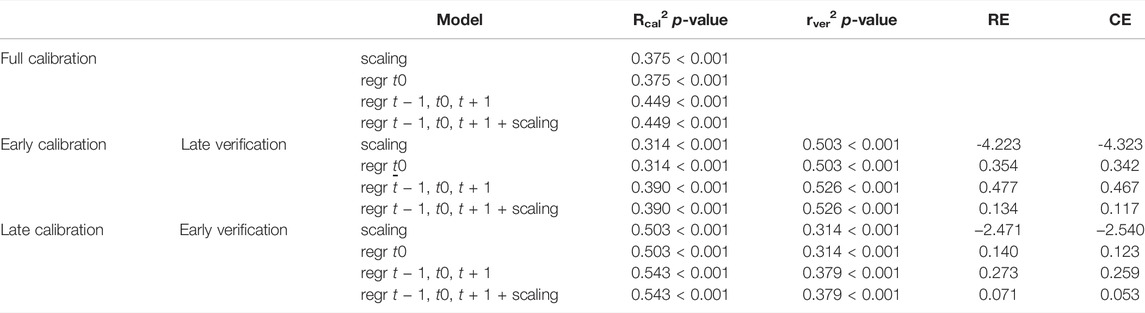
TABLE 2. Calibration and verification statistics over the pre-industrial period. The BI (minimum blue channel light intensity) record transformed into a temperature scale over the full, early, and late calibration periods (117–1811 CE, 117–964 CE, and 965–1811 CE, respectively) and the obtained temperature reconstructions verified over the late and early verification periods (965–1811 CE and 117–964 CE, respectively). The calibration/verification statistics include the coefficient of determination (Rcal2) and variance explained (rver2), given with their Monte Carlo–based p-values, and the reduction of error (RE) and the coefficient of efficiency (CE). Regression models (regr) with one (t0; concurrent of dependent value) or multiple independent variables (t − 1, t0, t + 1; predating, concurrent, and lagging the dependent value) are included. For regression-based reconstructions, the RE and CE statistics are positive for both sub-periods, indicating real skill in the reconstruction.
Multi-Proxy Comparisons
Linear regression was used to estimate the slope of the temperature trends. This statistic, with the standard error value for the slope, was calculated for the temperature estimates from our BI data over the full preindustrial period (5487 BCE–1811 CE) and for sedimentary summer temperature records (Sundqvist et al., 2014) over the corresponding interval between 7,440 and 140 cal BP. These records represent various types of sedimentary proxy data (e.g., pollen, chironomids, and diatoms) and across the circumpolar Arctic sites (https://www.ncdc.noaa.gov/paleo-search/study/15444) (Sundqvist et al., 2014). Compared with tree-ring records, the data in these series were of much coarser resolution (temporal resolution of c. 120 years for Fennoscandian records, see Table 1 in Sundqvist et al., 2014), dated mainly by means of 14C ages and resulting age-depth models and, as a result, not equidistant. Only quantitative reconstructions indicative of summer (warm season) temperatures transformed into the centigrade scale (°C) and given in years converted to the calendar timeline (expressed as cal BP ages i.e., years before 1950 CE) were included. If the site had more than one record with the same proxy type, same climate variable, and same geochronology (age estimates), the available temperature values were averaged before trend estimation to avoid overrepresentation of that one proxy source. The one-sample Wilcoxon signed-rank test (Conover, 1980) was used for comparing the median of a set of temperature slopes (obtained for the sedimentary proxy data) against the slope obtained for the tree-ring temperature reconstruction. The 95% confidence intervals for the medians were obtained from bootstrapping, repeating the resampling n = 9,999 times (Hammer et al., 2001). Our tree-ring–based temperature record was compared with those originating from other Fennoscandian proxy data [excerpted from the database of Sundqvist et al. (2014)]. These data show mean temperatures negatively correlating with site latitude and standard deviations of c. 0.4°C (latitude-independent), which is similar to the standard deviation of our tree-ring–based temperatures over the preindustrial period (see following section). For visual comparisons, the individual Fennoscandian sedimentary proxy records were normalized to a mean of zero and a standard deviation of c. 0.4°C over this period. Then, the transformed data of the three proxy types (pollen, chironomids, and diatoms) were regionally averaged for 100-year periods (2010–1911 CE, 2000–2001 CE, 1990–1891 CE.) and spline functions acting as “low-pass” filters (Cook and Peters, 1981) representing a 500-year rigidity were applied to those three records for illustrating their temperature variations on centennial and millennial timescales. The BI (5487 BCE–1811 CE) and MXD (1823–2010 CE) records were combined into one temperature record by placing them sequentially. This record was averaged for 100-year periods and smoothed to correspond to the sedimentary proxy records for the purpose of this comparison. The sedimentary records (pollen, chironomids, and diatoms) were correlated with tree-ring records, and Monte Carlo tests (Macias-Fauria et al., 2012) were used for determining the exact p-values.
Results
Millennia-Long Tree-Ring Record
Our tree-ring data show non-climatic (age-related) values for both the MXD and BI data (Figures 1C–E). Trees from the Arctic timberline show higher BI values than those from the Arctic Circle as is demonstrated by age-related growth trends with differing levels of BI values (Figure 1F). This is consistent with the expectation to find lower wood density and thus higher BI (due to their negative correlation) under colder (timberline) climates. Using state-of-the-art dendroclimatic methods (Briffa et al., 1992; Briffa et al., 1996; Melvin and Briffa 2008; Melvin et al., 2013; Helama et al., 2017), these trends were removed from the tree-ring data from the Arctic Circle and timberline by their respective age-models. The resulting BI chronologies portrayed variations indicative of climate variability on inter-annual to longer scales (Figure 3). The chronologies from the Arctic timberline and Arctic Circle were generally similar in their growth characteristics. Overall, these BI chronologies correlate with r = 0.547 with each other over the well-replicated periods, thus demonstrating a common signal in their mean records with consistent latewood growth patterns (see Table 3 for correlations between the BI chronologies over multiple periods). The mean composite BI record (all trees included) compares also well with the existing MXD record (Figures 4A,B) as they correlate with r = −0.586 over their common interval 117–1811 CE. The mean BI data are also found to correlate with the instrumental summer (June–August) temperatures recorded in Lapland, with coefficients comparable (Figure 5A) and even slightly higher (Figure 5B) than those observed between the MXD data and June–August temperatures, despite the much lower replication of BI data over this instrumental period (Figure 5C).
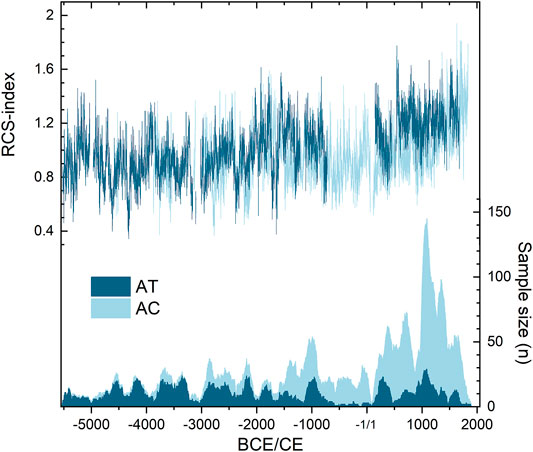
FIGURE 3. Chronologies of the minimum blue channel light intensity (BI). The BI data are shown as their mean indices shown for replication n ≥ 5 series per year after the Regional Curve Standardization (RCS), representing the Arctic timberline (AT) and Arctic Circle (AC) sites, with the number of subfossil samples.
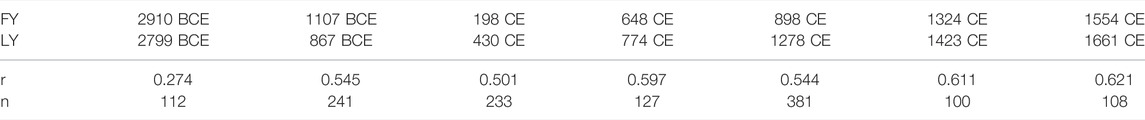
TABLE 3. Correlations between the tree-ring chronologies based on the minimum blue channel light intensity of subfossil wood (BI) representing the sites at the Arctic timberline and at the Arctic Circle calculated over the well-replicated periods (replication, n ≥ 10 series per year). Segments with at least 100 years of continuous data are shown with their first (FY) and last (LY) calendar years, the Pearson product-moment correlation coefficient (r), and the number of years (n) used to calculate the correlation.
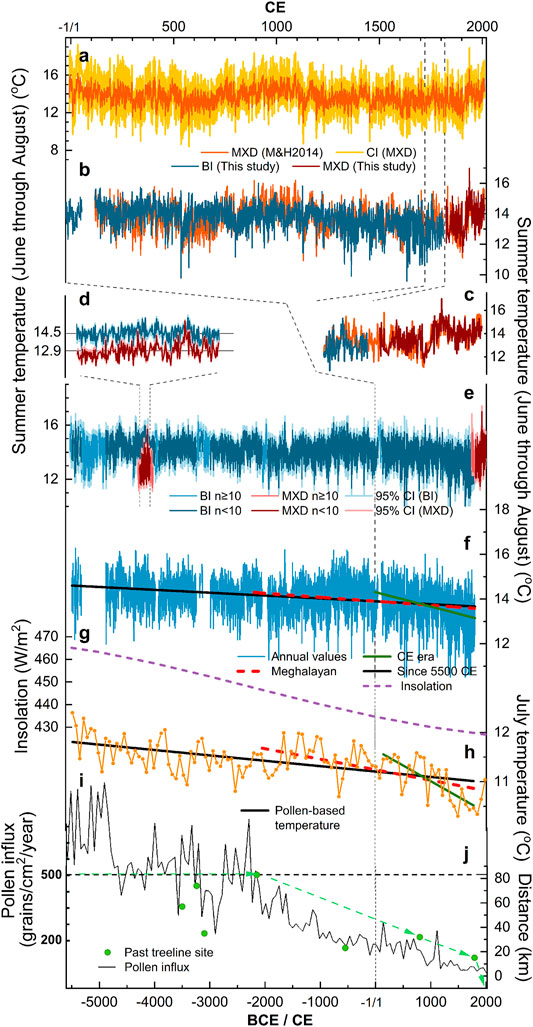
FIGURE 4. Paleoclimatic records. (A,B) 2,000-year temperature (June–August) records based on the maximum latewood density (MXD) of this and previous studies (M&H2014; Matskovsky and Helama 2014) and minimum blue channel light intensity of subfossil wood (BI, this study). CI stands for 95% confidence intervals. (C) MXD and BI temperature records of this and M&H2014 studies. (D,E) 7,500-year BI temperature for the full period (5486 BCE–1811 CE) and MXD temperature records over the 4260–4071 BCE and 1823–2011 CE periods. Dark and light lines indicate periods with replication in the BI chronology above and below 10 (but at least five) trees, respectively. The inlet (D) shows the BI- and MXD-based temperatures relative to their mean levels for the period 4260–4071 BCE. (F) Linear, preindustrial trends in the BI temperature record since 5486 BCE, 2190 BCE (Meghalayan), and from 1 CE until 1811 CE. (G) Mid-July insolation 65N for July in W/m2 (Berger and Loutre, 1991). (H,I) Pollen-based temperatures with trend lines and Pinus sylvestris pollen influx from northwestern-most Finland (Seppä and Birks, 2001; Seppä et al., 2002), with a horizontal dashed line (500 pollen grains/cm2/year) marking the local presence/absence limit for the species. (J) Past tree-line sites showing the phytogeographical data (Seppä et al., 2002; Helama et al., 2004b this study) with evidence for the last presence of P.sylvestris in the studied sites relative to the modern tree line position in northwest Finnish Lapland (for site locations, see Figure 1A).
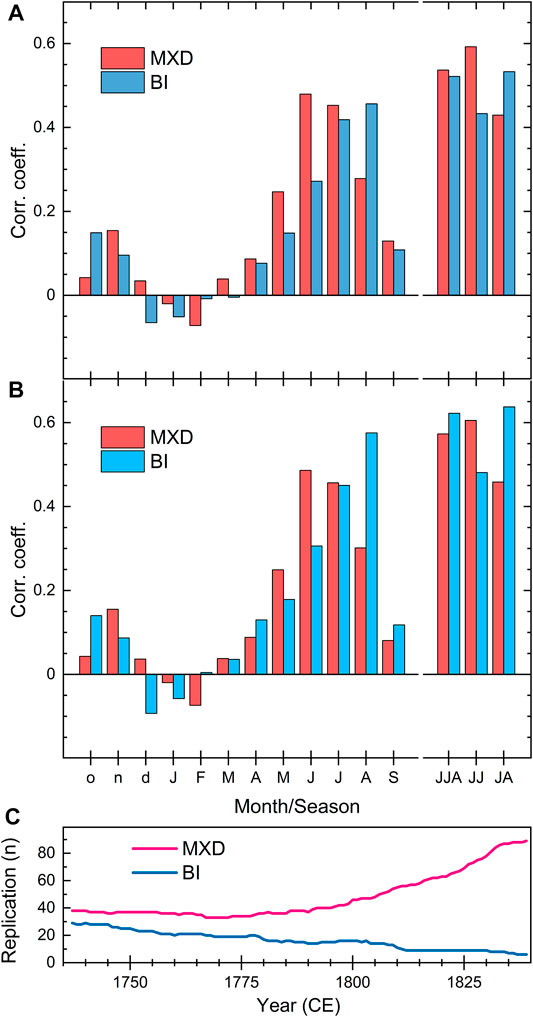
FIGURE 5. Dendroclimatic relations. (A) Pearson correlations calculated for the full set of temperature data originating from the studies of Holopainen and Vesajoki (2001) and Helama et al. (2004a). (B) Correlations excluding the year 1815 CE. (C) Replication of maximum latewood density (MXD) of a previous study (Matskovsky and Helama 2014) and minimum blue channel light intensity of subfossil wood (BI, this study). Tree-ring records were related to monthly and seasonal temperature variables of the previous (small letters) and concurrent year (capital letters). Seasonal variables include June–August (JJA), June–July (JJ), and July–August (JA) temperatures (1737–1838 CE). Note the reversed vertical axis for BI correlations for comparative purposes.
Transforming the new MXD and BI records into temperature data using statistical calibrations over the instrumental (Figure 4C) and preindustrial periods results in statistically significant correlations and positive verification statistics with data withheld from regression-based fitting (Tables 1, 2). Produced by linear scaling, the reconstructed values show higher temperature amplitudes than regression (Figure 6A), which accords with the paleoclimate literature on this method (Esper et al., 2005), but the scaling-based temperature values do not verify satisfactorily over the withheld data (Tables 1, 2). When scaling is performed after multiple regression, the verification statistics remain positive with preserved (i.e., higher) temperature amplitudes. Here, we also compare the temperature amplitudes with existing data from sedimentary proxy records (Sundqvist et al., 2014) over the same preindustrial period. These records show a mean temporal resolution of c. 120 years (Sundqvist et al., 2014) and a standard deviation of c. 0.4°C during the preindustrial period (Figure 6B). These values are nearly identical to those based on our tree-ring record, which exhibits temperature variability with a standard deviation of 0.4°C on similar 100–150 year time scales (Figure 6A). Combining scaling with multiple regressions resulted in improved calibration and verification statistics (in comparison to simple scaling and univariate regression), including higher Rcal2 and rver2 and, accordingly, in higher reconstructed temperature amplitudes, which were compatible with the temperature evidence of sedimentary proxy data. These examinations further validate our BI data to constitute a reconstruction with temperature low-frequency amplitudes comparable to those of sedimentary records.
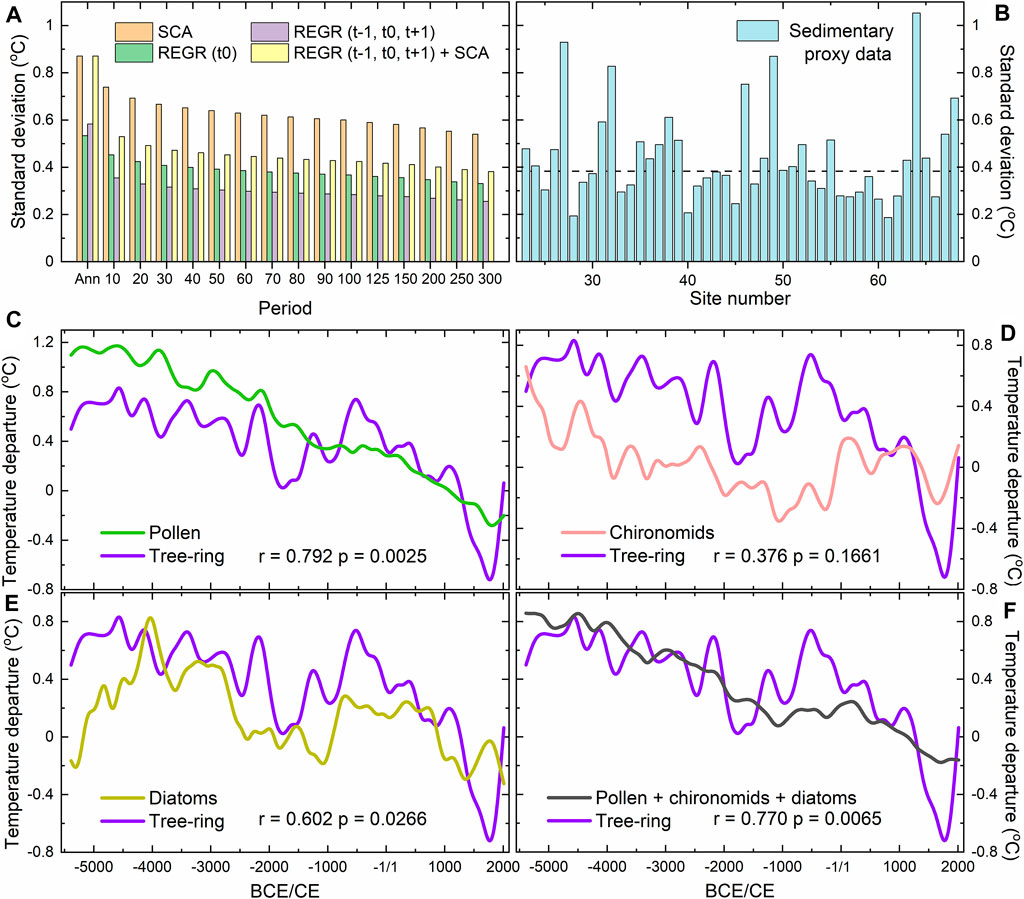
FIGURE 6. Temperature variability. (A) Standard deviations of temperatures inferred from the minimum blue channel light intensity of subfossil wood (BI) based on linear scaling (SCA) and regression (REGR) methods and (B) from Fennoscandian sedimentary proxy records (Sundqvist et al., 2014) (see Supplementary Table S2 for site numbers) calculated between 117 and 1811 CE for both types (A,B) of proxy records. The period indicates the rigidity of spline function in years used to smooth the tree-ring records as low-pass filter and “Ann” stands for annual, unfiltered data. Regression models explaining the temperature used tree-ring values in concurrent (t), previous (t − 1), and forthcoming (t + 1) years. The horizontal dashed line marks the median level of standard deviations for sedimentary records. (C–F) Long-term temperature comparisons of tree-ring (this study) and pollen (C), chironomid (D), diatom (E,F) mean (pollen, chironomids, and diatoms) evidence on centennial and millennial scales in Fennoscandian proxy data averaged and filtered using spline function.
Trends in Tree-Ring Data
Our new high-latitude, high-resolution temperature reconstruction from BI data shows a negative temperature trend over mid- and late-Holocene times (Figures 4D,E). Computed over the well-replicated periods, this trend suggests that summer temperature has decreased by 0.13°C (±0.01°C) per millennium between 5486 BCE and 1811 CE (Figure 4F) and it parallels the coeval decrease observed in insolation values demonstrating the coterminous change in orbital forcing (Figure 4G). Over the Meghalayan Stage and Common Era, the trends are stronger showing a cooling of 0.18°C (±0.01°C) and 0.69°C (±0.04°C) per millennium, respectively (see Figure 4F), thus outweighing the previous MXD-based cooling estimate of 0.31°C (±0.03°C) per millennium for the same region over the Common Era (Esper et al., 2013). Apparently, these estimations are sensitive to shorter, sub-Milankovitch climate variations (e.g., low temperatures over the latest CE centuries due to the “Little Ice Age”) that are superimposed on the predictable long-term change. In any case, similar estimates of the temperature slope are obtained for a pollen record (Seppä and Birks 2001) central to our tree-ring sites showing a cooling of 0.11°C (±0.02°C), 0.21°C (±0.04°C), and 0.64°C (±0.12°C) over the full preindustrial period, Meghalayan Stage, and Common Era, respectively (see Figure 4H).
Differing temperature values are, however, observed when comparing the mid-Holocene temperature reconstructions from BI and MXD data. Despite the high correlation between the two reconstructions at year-to-year scales over this period (r = 0.749), the mean level of the BI-based temperatures (14.5°C) exceeds the MXD estimates (12.9°C) by 1.6°C as observed over their common interval 4260–4071 BCE (Figures 4D). Overall, the MXD-based temperatures appear anomalously low in the context of the-mid Holocene temperatures, as inferred from the BI data (for other sedimentary proxy records, see the following section). These findings suggest low-frequency decoupling of the BI and MXD data and incomparability of their paleoclimatic signals on orbital scales whereby the MXD (unlike BI) data remain insensitive to similar long-term temperature changes. Despite this, a high correlation between the mid-Holocene BI and MXD records, at year-to-year scales, provides strong evidence for their reliability as indicators of high-resolution, high-frequency climate variability.
Discussion
Differing Signals of Orbital Forcing
Phytogeographical data show altitudinal and latitudinal retreats of the Pinus sylvestris timberline in the region of NW Finnish Lapland (for sites, see Figure 1B) since 2000 BCE, corresponding to 300 m downslope and 85 km toward the Equator (Figures 4I,J). Postglacial isostatic land uplift was found to explain no more than ca. 20 m of this change over the past 4,000 years (Helama et al., 2004b) and was not considered here. Using a temperature lapse rate of 0.5°C per 100 m (Laaksonen 1976), this change (300 m) translates into a summer temperature change of 1.5°C over the past 4,000 years. As a result, these estimates agree to show a cooling trend of 0.375°C per millennium at least since 2000 BCE, which markedly exceeds the trend seen in our BI reconstruction with a cooling of 0.18°C per millennium over the same interval (see Figure 4F). The trend obtained for our BI reconstruction agrees markedly with the slope of the trends obtained for all the circumpolar Arctic sedimentary proxy records over the full preindustrial period (Figure 7). More contrasting estimates of long-term cooling are, however, observed for the subsets of the Arctic records. The trends for pollen records and in Fennoscandian sites (where pollen data dominate the number of records) are generally stronger than for chironomid records and in other regions. As a result, the slope of the trend estimated for our BI-based temperatures is more gradual than the median of pollen and that of all Fennoscandian records but stronger than the median of all non-Fennoscandian and that of chironomid records. Likewise, the tests for comparing these medians against the slope of our BI temperatures (Supplementary Table S3) suggest comparability of the new BI-based cooling in a wider circumpolar Arctic context, excluding the pollen estimates.
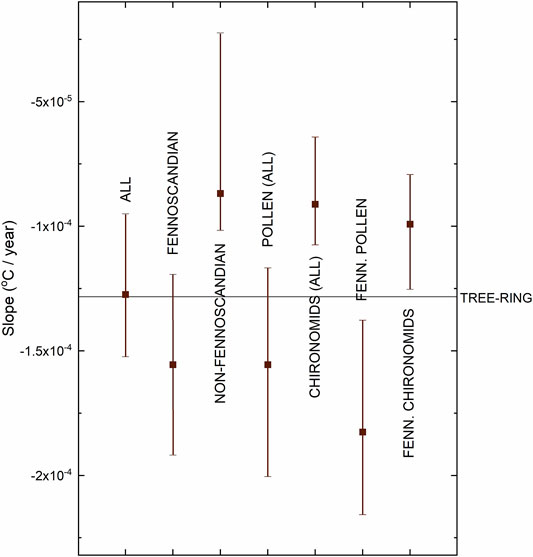
FIGURE 7. Cooling on orbital scales. Comparison of the slopes in our tree-ring–based temperature record from the minimum blue channel light intensity of subfossil wood and in temperature records of other proxy types representing high-latitude sites (north of 60°N) (Sundqvist et al., 2014) (see Figure 1A for site locations) between 7,440 and 140 cal BP. Medians of the slope are shown with 95% confidence intervals for all non–tree-ring records (n = 87), Fennoscandian (n = 45), non-Fennoscandian (n = 42), pollen (n = 67), chironomid (n = 20), Fennoscandian pollen (n = 26), Fennoscandian chironomid (n = 14), and Fennoscandian diatom (n = 6) records. Negative slopes indicate long-term cooling. The horizontal line denotes the slope estimate of our tree-ring–based temperature record. For actual values, see Supplementary Table S2.
Combined, the Fennoscandian proxy records have many similarities but also some unique features, with high and statistically significant correlations against tree-ring data, especially with pollen and diatom records (Figures 6C–F). Here, we neither aimed to check for their further inconsistencies nor attempted to evaluate their veracity but calculated the mean temperature records for different proxy types. In keeping with the Milankovitch scale forcing, these records show varying but generally declining summer temperatures over the mid- and late-Holocene times until the first millennium BCE, after which the tree-ring and especially the diatom and chironomid data indicate a transient rise in temperatures, followed by a subsequent temperature decline toward the coolest centuries of all records, in accordance with the “Little Ice Age” climate as frequently recorded in several types of proxy evidence around the circumpolar Arctic sites (Kaufman et al., 2009; Nicolle et al., 2018; Helama et al., 2021). Clearly, different types of proxy data come with their own characteristics. As evident from the circumpolar Arctic sites, pollen data appear to contain stronger trends of cooling than other proxy records (Figure 7). In the study region, discrepancies between the pollen and other sedimentary proxy records have recently been related to inaccuracies in the models transforming the pollen data into temperature estimates, to climatic disequilibrium of vegetation migration patterns, and to site-specific factors (Luoto et al., 2014b; Shala et al., 2017). Chironomid-based records, however, may be affected by limnic factors (Luoto et al., 2014a).
Data Characteristics and Limitations
Tree-ring data are the most widespread source of high-resolution, annually resolved, and annually dated proxy climate information, but their value as low-frequency indicators of past climate variability is discussed (Klippel et al., 2020; Luecke et al., 2021) and even questioned (Broecker 2001; Mann 2002) from time to time. Our results demonstrate that extraordinarily long tree-ring chronologies may show temperature trends on orbital scales similar to sedimentary proxy records at least over the Northgrippian and Meghalayan Stages, given that methods of data production are based on procedures preserving the signal. That even the highly correlating MXD and BI records, produced by the same state-of-the-art dendroclimatic methods (Briffa et al., 1992; Briffa et al., 1996; Helama et al., 2017), differed by their mid-Holocene temperature levels demonstrates an array of intricate hardships potentially involved in the efforts to create the records. Instead of trying to figure out which proxy is better than the other, multiple biological and physical mechanisms, albeit hypothetical, behind the discrepancy, may be itemized. It remains possible that the difference results from the structural materials of wood cell walls, which the MXD and BI disproportionally represent, or from their potentially selective degradation, as a consequence of their refractory characters in waterlogged depositional settings over the millennia. Lignin, assumingly recorded by BI data (Campbell et al., 2007), is expected to be more refractory to undergo degradation than polysaccharides under similar conditions (Obst et al., 1991; Cowie et al., 1992). Lignin content in the secondary cell wall also reflects temperature in the latest part of the summer (Gindl et al., 2000), for which season the signals of orbital forcing were previously found to be more prevalent in proxy and modeling evidence (Luecke et al., 2021). Supportive evidence for this explanation was found from our correlations demonstrating that BI data correlate relatively stronger with late-summer temperatures (August/July–August), in comparison with MXD data which show stronger correlations with early-summer (June/June–July) temperatures (Figure 5). As a result, both phenomena could possibly explain the proxy-dependent difference (Figure 4D).
Also, even slight differences in preparing the subfossil samples for radiodensitometric techniques may alter the obtained wood density values (Kłusek and Grabner, 2016), thus making the results sensitive to laboratory-dependent procedures, which indeed are generally known to produce offsets in the mean levels of MXD measurements available from different laboratories (Björklund et al., 2019). The question then arises as to whether some of the procedures can be taken as artificial factors generating the difference between the mid-Holocene temperature reconstructions from BI and MXD data. Indeed, in addition to pitfalls in MXD data, the BI records also have been shown to contain potential biases due to taphonomy (i.e., factors related mostly to post-mortem conditions in the sedimentary environment) that may then lead to offsets in BI-based temperature estimates between living and subfossil trees (Wang et al., 2020). Here, we used no living trees for the production of the BI data, thus avoiding this principal divergence. However, the question may remain whether the longer preservation of geologically older subfossil trees in waterlogged conditions could gradually intensify similar effects for BI values from taphonomic processes, such as those suggested to have been caused by dissolved iron penetrating into the wood preserved in sedimentary archives (Wang et al., 2020), and thus potentially leading to at least partly non-climatic bias in temperature estimates over the Northgrippian and Meghalayan stages. We note that this hypothesis is not supported by the fact that the temperature decline we obtained was not stable over the full study period but experienced changes with a stronger slope over the Common Era, in comparison with earlier periods (Figure 4F), and we find no reason to suggest stepwise penetration of dissolved components into the wood over millennial scales. Instead, the interpretation that these long-term changes have been driven by climatic forcing was further supported by similar trend estimates observed over the full period, Meghalayan stage, and Common Era, as detected for the temperature reconstruction from the local pollen data (Figure 4H).
Moreover, the slope of the trend over the full period was conservative for the BI-based temperatures, as compared with the slope of the sedimentary proxy evidence (Figure 7), suggesting no anomalous temperature excursions due potentially to non-climatic effects. Our BI dataset also benefits from being produced comprehensively in one laboratory with time-invariant protocols and techniques. This did not include chemical pretreatment to remove extractives which could have possibly altered the acquired BI values in a way similar to density measurements (Kłusek and Grabner, 2016). Wood extractives are generally resistant to changes during tree aging (Fengel, 1991), but their content is expected to slightly decrease over longer depositional periods of time (Fengel and Wegener, 1988). Generally, the extraction of pinewood results in lower density values (Helama et al., 2010b). Given similar effects on BI data, extraction would have likely yielded even a stronger tree-ring–based estimate of long-term cooling. Additional hardships of deriving multimillennial climatic trends are represented by diversifying methodologies developed recently to adjust the latewood BI data by earlywood BI values (Björklund et al., 2014; Björklund et al., 2015). While the adjustment has since been shown to remove discoloration bias due to subaerial versus sedimentary origin (Wang et al., 2020), the applicability of the method to operate on millennial timescales has not, to our knowledge, been rigorously tested. Contrary to the well-known sensitivity of latewood density to summer temperatures, the density of earlywood seems to reflect spring temperatures (Helama et al., 2012). Postulating similar relations for earlywood/latewood BI data would mean that the adjustment (Björklund et al., 2014; Björklund et al., 2015) removes the spring temperature signal (pertaining to earlywood BI values) from summer temperature (i.e., latewood BI) data. Such an approach, in turn, could potentially lead to a mix of seasonal climate signals and equivocal paleoclimatic conclusions, especially now that the season of orbital forcing is a question to be critically evaluated by proxy and modeling evidence (Luecke et al., 2021).
An intriguing question to be solved also remains about the actual constituent(s) of the wood and the variations the BI data represent. Although the BI is widely cited to reflect lignin content (McCarroll et al., 2002; Campbell et al., 2007), comparisons between the latewood samples stained in blue (by applying safranin and Astra blue; Piermattei et al., 2015) and latewood BI were not recently found to result in consistent results (Björklund et al., 2021). As the blue staining is expected to result from lack of lignification (Piermattei et al., 2015), the result would indirectly demonstrate the unrelatedness of blue staining and reflectance (i.e., BI) in latewood samples specifically due to lignin. Yet, similar to lignin content (Hinterstoisser et al., 2001), the variations in the BI data from Scots pine trees remain in correlation with the summer temperature in the study region (Figure 5) (McCarroll et al., 2002; Björklund et al., 2021). These connections demonstrate the value of the BI data for reconstructions of calendar year–dated pre-instrumental temperature variations, irrespective of the underlying hypotheses on the cell wall components, on both short- and long-term scales.
Final Remarks
Disentangling the signals of orbital forcing from contrasting proxy evidence requires fresh undertakings, and the long-term, multimillennial trend in our BI reconstruction shows the reserve of new tree-ring variables. Methods to produce new types of data are more laborious than those leading to conventional tree-ring chronologies. Yet, their potential remains to be fully explored for paleoclimate research. Tree-ring chronologies remain the only source of calendar year–dated pre-instrumental climate variations on both short- and long-term scales. Our results demonstrate the long-disputed capability of tree-ring records to increasingly contribute to paleoclimate estimates at scales relevant to orbital forcing.
Data Availability Statement
The raw data supporting the conclusion of this article will be made available by the authors, without undue reservation.
Author Contributions
SH, PN, HM, KM, and MO designed the study. SH, HH, LA, PN, KM, RS, MT, JU, and MO contributed to the fieldwork. SH wrote the manuscript with support from all authors and performed all analyses under the supervision of PN, KM, and MO. HH conducted the production and preliminary analyses of the minimum blue channel light intensity data. BG and TF conducted the production and preliminary analyses of the maximum latewood density data. JH contributed to analyses of instrumental climate records as principal investigator of this data.
Funding
This work was supported by the Academy of Finland (Grant Nos. 251287, 251441, 288083, 288267, 292788, and 339788).
Conflict of Interest
The authors declare that the research was conducted in the absence of any commercial or financial relationships that could be construed as a potential conflict of interest.
Publisher’s Note
All claims expressed in this article are solely those of the authors and do not necessarily represent those of their affiliated organizations, or those of the publisher, the editors, and the reviewers. Any product that may be evaluated in this article, or claim that may be made by its manufacturer, is not guaranteed or endorsed by the publisher.
Acknowledgments
This study is a result of a series of fieldwork seasons 2012–2016 assisted by HH, Jari Hietanen, Jari Jukkola, Tauno Luosujärvi, Raimo Pikkupeura, and Jouni Unga. We are also grateful for help in the joiner’s workshops in Rovaniemi and Kolari by Pasi Aatsinki, Tarmo Aalto, Esko Jaskari, Pekka Närhi, Aarno Niva, Kuisma Ranta, Kullervo Ruotsalainen, and Eero Siivola. Two reviewers are thanked for corrections, suggestions, and comments on the manuscript.
Supplementary Material
The Supplementary Material for this article can be found online at: https://www.frontiersin.org/articles/10.3389/feart.2022.871641/full#supplementary-material
References
Anchukaitis, K. J., Wilson, R., Briffa, K. R., Büntgen, U., Cook, E. R., D'Arrigo, R., et al. (2017). Last Millennium Northern Hemisphere Summer Temperatures from Tree Rings: Part II, Spatially Resolved Reconstructions. Quat. Sci. Rev. 163, 1–22. doi:10.1016/j.quascirev.2017.02.020
Bartholin, T. S., and Karlén, W. (1983). Dendrokronologi I Lapland. Dendrokronol. Sällskapet 5, 3–16.
Berger, A., and Loutre, M. F. (1991). Insolation Values for the Climate of the Last 10 Million Years. Quat. Sci. Rev. 10, 297–317. doi:10.1016/0277-3791(91)90033-q
Björklund, J., von Arx, G., Nievergelt, D., Wilson, R., Van den Bulcke, J., Günther, B., et al. (2019). Scientific Merits and Analytical Challenges of Tree‐ring Densitometry. Rev. Geophys. 57. doi:10.1029/2019RG000642
Björklund, J. A., Gunnarson, B. E., Krusic, P. J., Grudd, H., Josefsson, T., Östlund, L., et al. (2013). Advances towards Improved Low-Frequency Tree-Ring Reconstructions, Using an Updated Pinus Sylvestris L. MXD Network from the Scandinavian Mountains. Theor. Appl. Climatol. 113, 697–710. doi:10.1007/s00704-012-0787-7
Björklund, J. A., Gunnarson, B. E., Seftigen, K., Esper, J., and Linderholm, H. W. (2014). Blue Intensity and Density from Northern Fennoscandian Tree Rings, Exploring the Potential to Improve Summer Temperature Reconstructions with Earlywood Information. Clim. Past. 10, 877–885. doi:10.5194/cp-10-877-2014
Björklund, J., Fonti, M. V., Fonti, P., Van den Bulcke, J., and von Arx, G. (2021). Cell Wall Dimensions Reign Supreme: Cell Wall Composition Is Irrelevant for the Temperature Signal of Latewood Density/blue Intensity in Scots Pine. Dendrochronologia 65, 125785. doi:10.1016/j.dendro.2020.125785
Björklund, J., Gunnarson, B. E., Seftigen, K., Zhang, P., and Linderholm, H. W. (2015). Using Adjusted Blue Intensity Data to Attain High-Quality Summer Temperature Information: A Case Study from Central Scandinavia. Holocene 25, 547–556. doi:10.1177/0959683614562434
Bräker, O. U. (1981). Alterstrend bei Jahrringdichten und Jahrringbreiten von Nadelhölzern und sein Ausgleich. Mittl. Forstl. Bundesversuchanstalt 142, 75–102.
Briffa, K. R., Jones, P. D., Bartholin, T. S., Eckstein, D., Schweingruber, F. H., Karlén, W., et al. (1992). Fennoscandian Summers from AD 500: Temperature Changes on Short and Long Timescales. Clim. Dyn. 7, 111–119. doi:10.1007/bf00211153
Briffa, K. R., Jones, P. D., Pilcher, J. R., and Hughes, M. K. (1998). Reconstructing Summer Temperatures in Northern Fennoscandia Back to AD 1700 Using Tree-Ring Data from Scots Pine. Arct. Alp. Res. 20, 385–394. doi:10.1080/00040851.1988.12002691
Briffa, K. R., Jones, P. D., Schweingruber, F. H., Karlén, W., and Shiyatov, S. G. (1996). “Tree-ring Variables as Proxy-Climate Indicators: Problems with Low-Frequency Signals,” in Climatic Variations and Forcing Mechanisms of the Last 2000 Years. Editors P. D. Jones, R. S. Bradley, and J. Jouzel (Berlin: Springer), 9–41. doi:10.1007/978-3-642-61113-1_2
Briffa, K. R., and Matthews, J. A. (2002). ADVANCE-10K: a European Contribution towards a Hemispheric Dendroclimatology for the Holocene. Holocene 12 (6), 639–642. doi:10.1191/0959683602hl576ed
Broecker, W. S. (2001). Was the Medieval Warm Period Global? Science 291, 1497–1499. doi:10.1126/science.291.5508.1497
Campbell, R., McCarroll, D., Loader, N. J., Grudd, H., Robertson, I., and Jalkanen, R. (2007). Blue Intensity in Pinus Sylvestris Tree-Rings: Developing a New Palaeoclimate Proxy. Holocene 17, 821–828. doi:10.1177/0959683607080523
Cook, E. R., Briffa, K. R., Meko, D. M., Graybill, D. A., and Funkhouser, G. (1995). The 'segment Length Curse' in Long Tree-Ring Chronology Development for Palaeoclimatic Studies. Holocene 5, 229–237. doi:10.1177/095968369500500211
Cook, E. R., and Peters, K. (1981). The Smoothing Spline: a New Approach to Standardizing Forest Interior Tree-Ring Series for Dendroclimatic Studies. Tree-Ring Bull. 41, 45–53.
Cowie, G. L., Hedges, J. I., and Calvert, S. E. (1992). Sources and Relative Reactivities of Amino Acids, Neutral Sugars, and Lignin in an Intermittently Anoxic Marine Environment. Geochimica Cosmochimica Acta 56, 1963–1978. doi:10.1016/0016-7037(92)90323-b
Domínguez-Delmás, M. (2020). Seeing the Forest for the Trees: New Approaches and Challenges for Dendroarchaeology in the 21st Century. Dendrochronologia 62, 125731. doi:10.1016/j.dendro.2020.125731
Edvardsson, J., Helama, S., Rundgren, M., and Nielsen, A. B. (2022). The Integrated Use of Dendrochronological Data and Paleoecological Records from Northwest European Peatlands and Lakes for Understanding Long-Term Ecological and Climatic Changes-A Review. Front. Ecol. Evol. 10. doi:10.3389/fevo.2022.781882
Eronen, M., Zetterberg, P., Briffa, K. R., Lindholm, M., Meriläinen, J., and Timonen, M. (2002). The Supra-long Scots Pine Tree-Ring Record for Finnish Lapland: Part 1, Chronology Construction and Initial Inferences. Holocene 12, 673–680. doi:10.1191/0959683602hl580rp
Esper, J., Frank, D. C., Timonen, M., Zorita, E., Wilson, R. J. S., Luterbacher, J., et al. (2013). Orbital Forcing of Tree-Ring Data. Nat. Clim. Change 2, 862–866. doi:10.1038/NCLIMATE1589
Esper, J., Frank, D. C., Wilson, R. J. S., and Briffa, K. R. (2005). Effect of Scaling and Regression on Reconstructed Temperature Amplitude for the Past Millennium. Geophys. Res. Lett. 32. doi:10.1029/2004GL021236
Fengel, D. (1991). Aging and Fossilization of Wood and its Components. Wood Sci. Technol. 25, 153–177. doi:10.1007/bf00223468
Fengel, D., and Wegener, G. (1988). Chemische Analysen von Fichtenholz nach 17jähriger Wasserlagerung. Holz als Roh-und Werkst. 46, 7–8. doi:10.1007/bf02630546
Gindl, W., Grabner, M., and Wimmer, R. (2000). The Influence of Temperature on Latewood Lignin Content in Treeline Norway Spruce Compared with Maximum Density and Ring Width. Trees 14, 409–414. doi:10.1007/s004680000057
Grudd, H., Briffa, K. R., Karlén, W., Bartholin, T. S., Jones, P. D., and Kromer, B. (2002). A 7400-year Tree-Ring Chronology in Northern Swedish Lapland: Natural Climatic Variability Expressed on Annual to Millennial Timescales. Holocene 12, 657–665. doi:10.1191/0959683602hl578rp
Grudd, H. (2008). Torneträsk Tree-Ring Width and Density Ad 500-2004: a Test of Climatic Sensitivity and a New 1500-year Reconstruction of North Fennoscandian Summers. Clim. Dyn. 31, 843–857. doi:10.1007/s00382-007-0358-2
Gunnarson, B. E., and Linderholm, H. W. (2002). Low-frequency Summer Temperature Variation in Central Sweden since the Tenth Century Inferred from Tree Rings. Holocene 12, 667–671. doi:10.1191/0959683602hl579rp
Gunnarson, B. E., Linderholm, H. W., and Moberg, A. (2011). Improving a Tree-Ring Reconstruction from West-Central Scandinavia: 900 Years of Warm-Season Temperatures. Clim. Dyn. 36, 97–108. doi:10.1007/s00382-010-0783-5
Hammer, Ø., Harper, D. A. T., and Ryan, P. D. (2001). Past: Paleontological Statistics Software Package for Education and Data Analysis. Palaeontol. Electron. 4.
Hantemirov, R. M., and Shiyatov, S. G. (2002). A Continuous Multimillennial Ring-Width Chronology in Yamal, Northwestern Siberia. Holocene 12, 717–726. doi:10.1191/0959683602hl585rp
Helama, S., Bégin, Y., Vartiainen, M., Peltola, H., Kolström, T., and Meriläinen, J. (2012). Quantifications of Dendrochronological Information from Contrasting Microdensitometric Measuring Circumstances of Experimental Wood Samples. Appl. Radiat. Isotopes 70, 1014–1023. doi:10.1016/j.apradiso.2012.03.025
Helama, S., Holopainen, J., Timonen, M., Ogurtsov, M. G., Lindholm, M., Meriläinen, J., et al. (2004a). Comparison of Living-Tree and Subfossil Ringwidths with Summer Temperatures from 18th, 19th and 20th Centuries in Northern Finland. Dendrochronologia 21, 147–154. doi:10.1078/1125.7865.00049
Helama, S., Lindholm, M., Timonen, M., and Eronen, M. (2004b). Dendrochronologically Dated Changes in the Limit of Pine in Northernmost Finland during the Past 7.5 Millennia. Boreas 33, 250–259. doi:10.1080/03009480410001253
Helama, S., Lindholm, M., Timonen, M., Meriläinen, J., and Eronen, M. (2002). The Supra-long Scots Pine Tree-Ring Record for Finnish Lapland: Part 2, Interannual to Centennial Variability in Summer Temperatures for 7500 Years. Holocene 12, 681–687. doi:10.1191/0959683602hl581rp
Helama, S., Makarenko, N. G., Karimova, L. M., Kruglun, O. A., Timonen, M., Holopainen, J., et al. (2009). Dendroclimatic Transfer Functions Revisited: Little Ice Age and Medieval Warm Period Summer Temperatures Reconstructed Using Artificial Neural Networks and Linear Algorithms. Ann. Geophys. 27, 1097–1111. doi:10.5194/angeo-27-1097-2009
Helama, S., Melvin, T. M., and Briffa, K. R. (2017). Regional Curve Standardization: State of the Art. Holocene 27, 172–177. doi:10.1177/0959683616652709
Helama, S., and Oinonen, M. (2019). Exact Dating of the Meghalayan Lower Boundary Based on High-Latitude Tree-Ring Isotope Chronology. Quat. Sci. Rev. 214, 178–184. doi:10.1016/j.quascirev.2019.04.013
Helama, S., Seppä, H., Birks, H. J. B., and Bjune, A. E. (2010a). Reconciling Pollen-Stratigraphical and Tree-Ring Evidence for High- and Low-Frequency Temperature Variability in the Past Millennium. Quat. Sci. Rev. 29, 3905–3918. doi:10.1016/j.quascirev.2010.09.012
Helama, S., Stoffel, M., Hall, R. J., Jones, P. D., Arppe, L., Matskovsky, V. V., et al. (2021). Recurrent Transitions to Little Ice Age-like Climatic Regimes over the Holocene. Clim. Dyn. 56, 3817–3833. doi:10.1007/s00382-021-05669-0
Helama, S., Vartiainen, M., Kolström, T., and Meriläinen, J. (2010b). Dendrochronological Investigation of Wood Extractives. Wood Sci. Technol. 44, 335–351. doi:10.1007/s00226-009-0293-y
Hinterstoisser, B., Jalkanen, R., Nowotny, M., and Schwanninger, M. (2001). Lignification of Scots Pine Trees from Arctic Circle up to Timberline. Búvísindi Icel. Agr. Sci. 14, 55–59.
Holmes, R. L. (1983). Computer-assisted Quality Control in Tree-Ring Dating and Measurement. Tree-Ring Bull. 43, 69–75.
Holopainen, J., and Vesajoki, H. (2001). Varhainen Lämpötilahavaintosarja Torniosta Vuosilta 1737–1749. Terra 113, 196–201.
Kaufman, D. S., Schneider, D. P., McKay, N. P., Ammann, C. M., Bradley, R. S., Briffa, K. R., et al. (2009). Recent Warming Reverses Long-Term Arctic Cooling. Science 325, 1236–1239. doi:10.1126/science.1173983
Klingbjer, P., and Moberg, A. (2003). A Composite Monthly Temperature Record from Tornedalen in Northern Sweden, 1802-2002. Int. J. Climatol. 23, 1465–1494. doi:10.1002/joc.946
Klippel, L., St. George, S., Büntgen, U., Krusic, P. J., and Esper, J. (2020). Differing Pre-industrial Cooling Trends between Tree Rings and Lower-Resolution Temperature Proxies. Clim. Past. 16, 729–742. doi:10.5194/cp-16-729-2020
Kłusek, M., and Grabner, M. (2016). X-ray Densitometry of Norway Spruce Subfossil Wood from the Austrian Alps. Tree Ring Res. 72, 23–34. doi:10.3959/1536-1098-72.01.23
Kullman, L. (1992). Orbital Forcing and Tree-Limit History: Hypothesis and Preliminary Interpretation of Evidence from Swedish Lappland. Holocene 2, 131–137. doi:10.1177/095968369200200204
Laaksonen, K. (1976). The Dependence of Mean Air Temperatures upon Latitude and Altitude in Fennoscandia (1921-1950). Ann. Acad. Sci. Fenn. 119 A, 5–19.
Lücke, L. J., Schurer, A. P., Wilson, R., and Hegerl, G. C. (2021). Orbital Forcing Strongly Influences Seasonal Temperature Trends during the Last Millennium. Geophys. Res. Lett. 48. doi:10.1029/2020GL088776
Luoto, T. P., Kaukolehto, M., Weckström, J., Korhola, A., and Väliranta, M. (2014b). New Evidence of Warm Early-Holocene Summers in Subarctic Finland Based on an Enhanced Regional Chironomid-Based Temperature Calibration Model. Quat. Res. 81, 50–62. doi:10.1016/j.yqres.2013.09.010
Luoto, T. P., Kaukolehto, M., and Nevalainen, L. (2014a). The Relationship between Water and Air Temperature in Chironomid-Based Paleoclimate Reconstructions: Records from Boreal and Subarctic Finland. Holocene 24, 1584–1590. doi:10.1177/0959683614544056
Macias-Fauria, M., Grinsted, A., Helama, S., and Holopainen, J. (2012). Persistence Matters: Estimation of the Statistical Significance of Paleoclimatic Reconstruction Statistics from Autocorrelated Time Series. Dendrochronologia 30, 179–187. doi:10.1016/j.dendro.2011.08.003
Mann, M. E. (2002). The Value of Multiple Proxies. Science 297, 1481–1482. doi:10.1126/science.1074318
Matskovsky, V., and Helama, S. (2016). Direct Transformation of Tree-Ring Measurements into Palaeoclimate Reconstructions in Three-Dimensional Space. Holocene 26, 439–449. doi:10.1177/0959683615609748
Matskovsky, V. V., and Helama, S. (2014). Testing Long-Term Summer Temperature Reconstruction Based on Maximum Density Chronologies Obtained by Reanalysis of Tree-Ring Data Sets from Northernmost Sweden and Finland. Clim. Past. 10, 1473–1487. doi:10.5194/cp-10-1473-2014
Maxwell, R. S., and Larsson, L.-A. (2021). Measuring Tree-Ring Widths Using the CooRecorder Software Application. Dendrochronologia 67, 125841. doi:10.1016/j.dendro.2021.125841
McCarroll, D., Pettigrew, E., Luckman, A., Guibal, F., and Edouard, J.-L. (2002). Blue Reflectance Provides a Surrogate for Latewood Density of High-Latitude Pine Tree Rings. Arct. Antarct. Alp. Res. 34, 450–453. doi:10.1080/15230430.2002.12003516
Melvin, T. M., and Briffa, K. R. (2008). A "Signal-free" Approach to Dendroclimatic Standardisation. Dendrochronologia 26, 71–86. doi:10.1016/j.dendro.2007.12.001
Melvin, T. M., Grudd, H., and Briffa, K. R. (2013). Potential Bias in 'updating' Tree-Ring Chronologies Using Regional Curve Standardisation: Re-processing 1500 Years of Torneträsk Density and Ring-Width Data. Holocene 23, 364–373. doi:10.1177/0959683612460791
Moberg, A., and Bergström, H. (1997). Homogenization of Swedish Temperature Data. Part III: The Long Temperature Records from Uppsala and Stockholm. Int. J. Climatol. 17, 667–699. doi:10.1002/(SICI)1097-0088(19970615)17:7<667::AID-JOC115>3.0.CO;2-J
Moré, J. J. (1978). The Levenberg-Marquardt Algorithm: Implementation and Theory. Lect. Notes Math 630, 105–116.
Naurzbaev, M. M., Vaganov, E. A., Sidorova, O. V., and Schweingruber, F. H. (2002). Summer Temperatures in Eastern Taimyr Inferred from a 2427-year Late-Holocene Tree-Ring Chronology and Earlier Floating Series. Holocene 12, 727–736. doi:10.1191/0959683602hl586rp
Nicolle, M., Debret, M., Massei, N., Colin, C., deVernal, A., Divine, D., et al. (2018). Climate Variability in the Subarctic Area for the Last 2 Millennia. Clim. Past. 14, 101–116. doi:10.5194/cp-14-101-2018
Obst, J. R., McMillan, N. J., Blanchette, R. A., Christensen, D. J., Faix, O., Han, J. S., et al. (1991). Characterization of Canadian Arctic Fossil Woods. Geol. Surv. Can. Bull. 403, 123–146. doi:10.4095/131951
Pearl, J. K., Keck, J. R., Tintor, W., Siekacz, L., Herrick, H. M., Meko, M. D., et al. (2020). New Frontiers in Tree-Ring Research. Holocene 30, 923–941. doi:10.1177/0959683620902230
Piermattei, A., Crivellaro, A., Carrer, M., and Urbinati, C. (2015). The "blue Ring": Anatomy and Formation Hypothesis of a New Tree-Ring Anomaly in Conifers. Trees 29, 613–620. doi:10.1007/s00468-014-1107-x
Rydval, M., Larsson, L-Å., McGlynn, L., Gunnarson, B. E., Loader, N. J., Young, G. H. F., et al. (2014). Blue Intensity for Dendroclimatology: Should We Have the Blues? Experiments from Scotland. Dendrochronologia 32, 191–204. doi:10.1016/j.dendro.2014.04.003
Schweingruber, F. H., Bartholin, T., Schär, E., and Briffa, K. R. (1988). Radiodensitometric Dendroclimatological Conifer Chronologies from Lapland (Scandinavia) and the Alps (Switzerland). Boreas 17, 559–566. doi:10.1111/j.1502-3885.1988.tb00569.x
Seppä, H., and Birks, H. J. B. (2001). July Mean Temperature and Annual Precipitation Trends during the Holocene in the Fennoscandian Tree-Line Area: Pollen-Based Climate Reconstructions. Holocene 11, 527–539. doi:10.1191/095968301680223486
Seppä, H., Bjune, A. E., Telford, R. J., Birks, H. J. B., and Veski, S. (2009). Last Nine-Thousand Years of Temperature Variability in Northern Europe. Clim. Past. 5, 523–535. doi:10.5194/cp-5-523-2009
Seppä, H., MacDonald, G. M., Birks, H. J. B., Gervais, B. R., and Snyder, J. A. (2008). Late- Quaternary Summer Temperature Changes in the Northern-European Tree-Line Region. Quat. Res. 69, 404–412. doi:10.1016/j.yqres.2008.02.002
Seppä, H., Nyman, M., Korhola, A., and Weckström, J. (2002). Changes of Treelines and Alpine Vegetation in Relation to Post-glacial Climate Dynamics in Northern Fennoscandia Based on Pollen and Chironomid Records. J. Quat. Sci. 17, 287–301. doi:10.1002/jqs.678
Shala, S., Helmens, K. F., Luoto, T. P., Salonen, J. S., Väliranta, M., and Weckström, J. (2017). Comparison of Quantitative Holocene Temperature Reconstructions Using Multiple Proxies from a Northern Boreal Lake. Holocene 27, 1745–1755. doi:10.1177/0959683617708442
Sundqvist, H. S., Kaufman, D. S., McKay, N. P., Balascio, N. L., Briner, J. P., Cwynar, L. C., et al. (2014). Arctic Holocene Proxy Climate Database - New Approaches to Assessing Geochronological Accuracy and Encoding Climate Variables. Clim. Past. 10, 1605–1631. doi:10.5194/cp-10-1605-2014
Vesajoki, H., Narinen, M., and Holopainen, J. (1995). “The Early Temperature Records from Tornio, Northern Finland 1737-1749,” in International Conference of the Past, Present and Future Climate. Editor P. Heikinheimo (Helsinki: Publications of the Academy of Finland), 6, 183–186.
Wang, F., Arseneault, D., Boucher, É., Yu, S., Ouellet, S., Chaillou, G., et al. (2020). Chemical Destaining and the Delta Correction for Blue Intensity Measurements of Stained Lake Subfossil Trees. Biogeosciences 17, 4559–4570. doi:10.5194/bg-17-4559-2020
Keywords: paleoclimate, Milankovitch cycles, dendrochronology, Subarctic, Holocene
Citation: Helama S, Herva H, Arppe L, Gunnarson B, Frank T, Holopainen J, Nöjd P, Mäkinen H, Mielikäinen K, Sutinen R, Timonen M, Uusitalo J and Oinonen M (2022) Disentangling the Evidence of Milankovitch Forcing From Tree-Ring and Sedimentary Records. Front. Earth Sci. 10:871641. doi: 10.3389/feart.2022.871641
Received: 08 February 2022; Accepted: 09 May 2022;
Published: 23 June 2022.
Edited by:
Nadia Solovieva, University College London, United KingdomCopyright © 2022 Helama, Herva, Arppe, Gunnarson, Frank, Holopainen, Nöjd, Mäkinen, Mielikäinen, Sutinen, Timonen, Uusitalo and Oinonen. This is an open-access article distributed under the terms of the Creative Commons Attribution License (CC BY). The use, distribution or reproduction in other forums is permitted, provided the original author(s) and the copyright owner(s) are credited and that the original publication in this journal is cited, in accordance with accepted academic practice. No use, distribution or reproduction is permitted which does not comply with these terms.
*Correspondence: Samuli Helama, c2FtdWxpLmhlbGFtYUBsdWtlLmZp