 Farrage M. Khaleal1
 El Saeed R. Lasheen
 Samir Z. Kamh
- 1Nuclear Materials Authority, Cairo, Egypt
- 2Geology Department, Faculty of Science, Al-Azhar University, Cairo, Egypt
- 3Department of Civil Engineering, Engineering College, Taif University, Taif, Saudi Arabia
- 4Geology Department, Faculty of Science, Tanta University, Tanta, Egypt
A net of pegmatite veins crosscut gneiss and dismembered ophiolitic ultramafic rocks are abundant in the Migif-Hafafit culmination area, South Eastern Desert, Egypt. Some of these pegmatites are corundum-bearing. Corundum-bearing pegmatites are studied in eight localities around the Migif-Hafafit complex. The present study aims to integrate field investigation, whole rock and corundum chemistry, remote sensing studies, and the conventional methods to detect the corundum-bearing pegmatites, which led to finding out the genesis of the corundum mineralization. In addition, the tectonic regime has been detected using bulk rock geochemistry. False-color composite (FCCs), band ratio (BR), principal component analysis (PCA), minimum noise fraction (MNF), decorrelation stretch (DS), and the constrained energy minimization (CEM) image processing algorithms were proposed and applied on Landsat-8 OLI, and Sentinel-2A data to discriminate the exposed lithological units and to detect the corundum-bearing pegmatites in the study area. These detected pegmatites are structurally controlled following the NW-SE direction. The ultramafic rocks are the host of six areas and the gneisses are the host rocks of the two others. Gneisses and pegmatites are characterized by a steep slope of LREEs relative to HREEs with week Eu negative anomaly. The studied pegmatites have both plumasite and marundite. On the other hand, the studied corundum has Al2O3 content up to 99.72 wt% in pegmatite-gneiss and up to 100 wt.% in pegmatite-ultramafics. Corundum is ascribed to metamorphic/metasomatic type according to its chromosphere. Desilication in pegmatites led to the excess of alumina content in the residual melt producing corundum mineralization.
1 Introduction
Corundum is the hardest mineral after diamond with a specific gravity of about 4 (Bonewitz, 2012). It is composed mainly of alumina (Al2O3) with a few various trace elements such as Cr, Fe, and Ti (Abduriyim and Kitawaki, 2006); in addition, little amounts of other elements such as V, Ga, and Mg (Guillong and Gunther, 2001; Ranking et al., 2003). The pure corundum is colorless but chromophores such as Cr, Ti, and Fe trace elements can replace Al in the corundum crystal structure forming ruby (red gem type of corundum) and sapphire (certainly blue gem one) (Dill, 2015). The red ruby gem of high quality is important as diamond (expensive), which attracts the attention of many exploration authorities (Shor and Weldon, 2009).
In the field of petrology, corundum represents an accessory mineral of under saturated silica (Ahmed and Gharib, 2018), which occurs in igneous rocks (mafics-ultramafics) (Hattori et al., 2010), metamorphic or by the hydrothermal activity of Al-spinel phases of ultramafics (Nozaka, 2011) and sedimentary rocks (Watt, 1994). In addition, it is commonly found in pegmatite whether it is marundite (corundum with margarite) or plumasite (corundum with plagioclase, Bucher et al., 2005). Plumasite is also named corundum-bearing desilicate pegmatites as veins within ultramafics (Dill, 2015). Corundum deposits can be classified into primary and secondary deposits. The former is either crystallized in the rock or as xenoliths, whilst the secondary ones are of sedimentary origin. The primary deposits can be subdivided into magmatic and metamorphic/metasomatic deposits. Magmatic deposits as those hosted in alkali basalt (Sutherland et al., 1998), lherzolite (Coenraads et al., 1990), lamprophyre (Brownlow and Komorowski, 1988), syenite (Hughes, 1997), and kimberlite (Hutchinson et al., 2004), whereas metamorphic one like those hosted in marble, granulite, gneiss, migmatite, and metapelite (Themelis, 2008). Metamorphic/metasomatic deposits are characterized by high fluid-rock interaction and metasomatism (Simonet et al., 2008; Giuliani et al., 2014). This metasomatic process is achieved when hot igneous injecting the cool older rocks causing gain/loss of some chemical components as a result of solution/rock interactions (Pirajno, 2013).
Remote sensing can be a powerful resource in geology to delineate target exploration areas for a lot of mineral deposits. Worldwide, it has been used in mineral exploration since the 1970s (Cardoso-Fernandes et al., 2019). The 20th century witnessed a huge development in remote sensing sensors and its associated image analysis techniques, which minimized the geologist’s efforts before and during field expeditions (Gabr et al., 2015). The newly developed sensors offer detailed information on the mineralogy of different rock types comprising the Earth’s surface (Zhang et al., 2007). The processed remotely sensed data are used to detect volcanogenic massive sulfide ore deposits (e.g., Berger et al., 2003) epithermal gold deposits and hydrothermal gold exploration (e.g., Crósta et al., 2003; Feizi et al., 2016; Ramezanali et al., 2020a; Ramezanali et al., 2020b), porphyry copper deposits (e.g., Pour and Hashim, 2015; Feizi et al., 2017), and Li-bearing pegmatites (Cardoso-Fernandes et al., 2019; Cardoso-Fernandes et al., 2020). In the Egyptian Nubian Shield (ENS), many authors are pointed out that Landsat-8 with (OLI) sensors is considered as one of the most effective data widely and successfully used for lithological mapping and exploration targets (Gabr et al., 2015; Hassan et al., 2015; Aboelkhair et al., 2020; Hamimi et al., 2020). They used Landsat-8 OLI and Sentinel 2A data to discriminate the exposed lithological units of gneisses, ophiolites, island arc metavolcanic-metasedimentary association, granitoid, and their associated mineralization at the Eastern Desert of Egypt (northern part, e.g., Mohy et al., 2017; central part, e.g., Mohammad et al., 2019, and southern part, e.g., Zoheir et al., 2019, Abd El-Wahed et al., 2021).
The Migif-Hafafit area is located at the south Eastern Desert, Egypt, between latitudes 24° 38′ and 24° 51′ N and longitudes 34° 26′ and 34° 34′ E, covering about 327 km2 (Figure 1A). It is considered as one of the famous Precambrian metamorphic complexes in the Nubian Shield representing metamorphic, structural, and economic interests (Ahmed and Gharib, 2018; El Ramy et al., 1993). It is a well-known locality in Egypt containing a unique industrial to semi-gem corundum within corundum-bearing pegmatite veins (Serotta and Carò, 2014). Although the pegmatite veins are widely distributed in the Precambrian rocks of the Eastern Desert of Egypt, the corundum-bearing pegmatites are concentrated in some sites in the Migif-Hafafit area. Most of the previous studies have investigated the corundum-bearing pegmatites in the study area based on the mineralogical and geochemical studies only (e.g., Gharib, 1999; Ahmed and Gharib, 2018). Therefore, the present study aims to use an integrated analysis of remote sensing data, petrography, and bulk rock geochemistry, electron microprobe analysis (EPMA) of corundum, and field investigations, to detect the occurrences, distribution, and the genesis of the corundum-bearing pegmatites in the study area. Eight localities in the Migif-Hafafit area, including Wadi El Qarn, Um Karba, Um Maiat, Abu Merikhat, Um Nimr, North El Hima, South El Hima, and Um Shegera have been chosen to achieve the goal of this study, because of the abundance of corundum-bearing pegmatites hosted by gneisses and ultramafic rocks in these areas (Figure 1B).
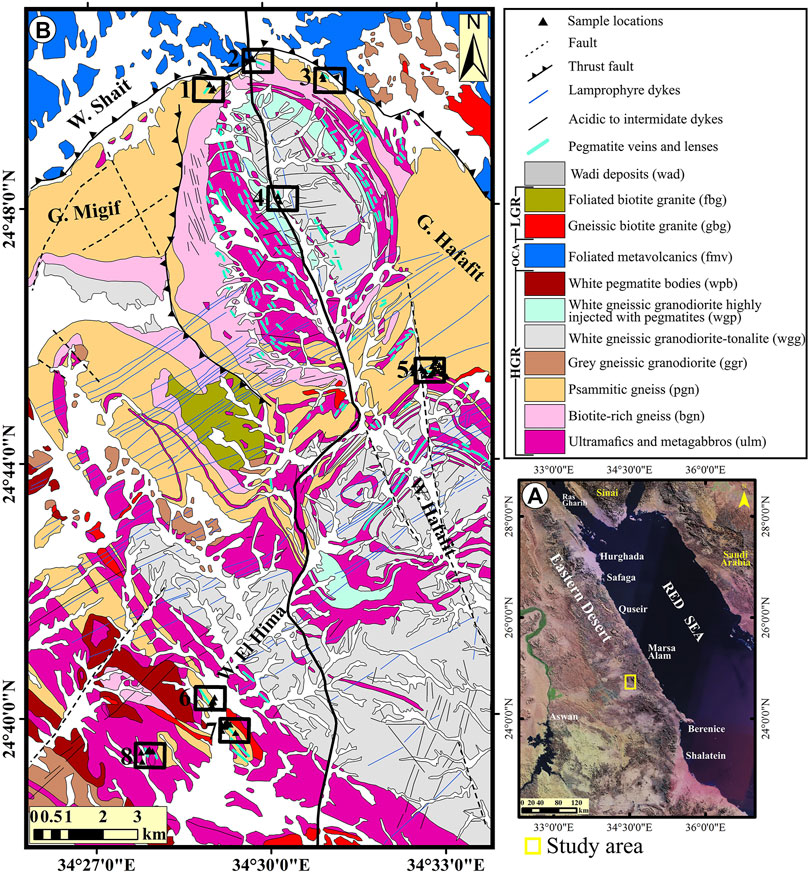
FIGURE 1. (A) Location map of the study area and (B) Detailed geological map of Migif-Hafafit area (updated and modified after El Ramly and Greiling, 1988). The black boxes represent the location of the eight studied areas, which were selected to detect corundum-bearing pegmatites and host rocks. 1: Um Karba, 2: Wadi El Qarn, 3: Um Maiat, 4: Abu Merikhat, 5: Um Nimr, 6: North El Hima, 7: Um Shegera and 8: South El Hima. HGR = Migif-Hafafit gneisses and associated rocks, OCA = Ophiolitic and Calc-alkaline assemblages, and LGR = Late granitoid. The thick black line represents asphaltic road from Marsa Allam to El-Sheikh El-Shazly.
2 Geological Setting
Neoproterozoic crystalline rocks of Egypt are considered as the northern sector of the Arabian Nubian Shield (ANS) that represent the northern extension of the highly metamorphosed Mozambique belt (El Mezayen et al., 2019; Lasheen et al., 2021a; Saleh et al., 2022). The ANS is interpreted as a juvenile crust that is formed by the collision of East and West Gondwana and the closing of the Mozambique Ocean (Lasheen et al., 2021b). On two flanks of ANS, Nubian shield on one hand (western side) and the Arabian shield on the other hand (eastern side), infrastructure gneiss complex and suprastructure rocks (low-metamorphic-ophiolitic rocks, arc metavolcaniclasts, and metavolcanic assemblages as well as syn to post granitic intrusions) are widely distributed (El Gaby et al., 1990).
The Migif-Hafafit complex represents the largest gneissic metamorphic core in the Egyptian Eastern Desert (more than 55 km). It extends from Wadi Shait in the north to Wadi El Gemal in the south. Moreover, it represents one of the most stunning metamorphic core as a result of its economic constituents (Ahmed and Gharib, 2018; Abu Elatta and Ali, 2020). It represents a huge doubly plunging anticline trending in the NW-SE with five separated gneissic domes, which are dissected by major faults trending in NE-SW, N-S, and NNW-SSE (Figure 1B). The main rock units exposed in Hafafit complexes are gneiss rocks, dismembered masses of ophiolitic rocks (ultramafics and metagabbros), granodiorites, younger granites, and variable size of pegmatites (Figure 1B).
Gneisses rocks are represented by biotite-rich gneiss and gneiss that are widely distributed in Wadi El Qarn and um Karaba areas (Figures 2, 3A). The gneiss rocks are characterized by banding and are resistant to weathering processes. The study areas exhibit vast areas of gray and white gneissose granodiorite and tonalite (Figure 1B), where the last one is highly injected by pegmatite veins and lenses. The superastructure of the Neoproterozoic ultramafic rocks (serpentinites), occurs with different sizes, shapes, and exhibits variable alteration degrees certainly along shear zones. They are widely distributed in Um Maiat, Abu Merikhat, Um Nimr, North El Hima, South El Hima, and Um Shegera areas. Numerous pegmatites are recorded in the Hafafit complex and surrounding areas cutting basement rocks (Figures 2, 3B–D). They can be easily distinguished from the surrounding rocks by their white-red color with variable width (>20 cm) and length (ranges from 0.06 up to 1.16 km). They also appeared in the southwest of the study area as a pegmatite body trending NW (Figures 1B, 2). They follow the structures of the Hafafit area with variable ages (Abu Elatta and Ali, 2020). Their economic importance is related to corundum mineralization that is used as abrasive materials (Serotta and Carò, 2014). Intrusion of felsic magma (pegmatite) within ultramafics (serpentinites) produces an alteration zone with new minerals (as a result of metasomatic reactions). The new mineral associations include actinolite, anthophyllite, and vermiculite within serpentinized ultramafics (silica deficient rocks), and alumina rich minerals such as Al-rich mineral phases such as corundum, hercynite, and almandine were formed in Al-rich veins (pegmatite) (Ahmed and Gharib, 2018).
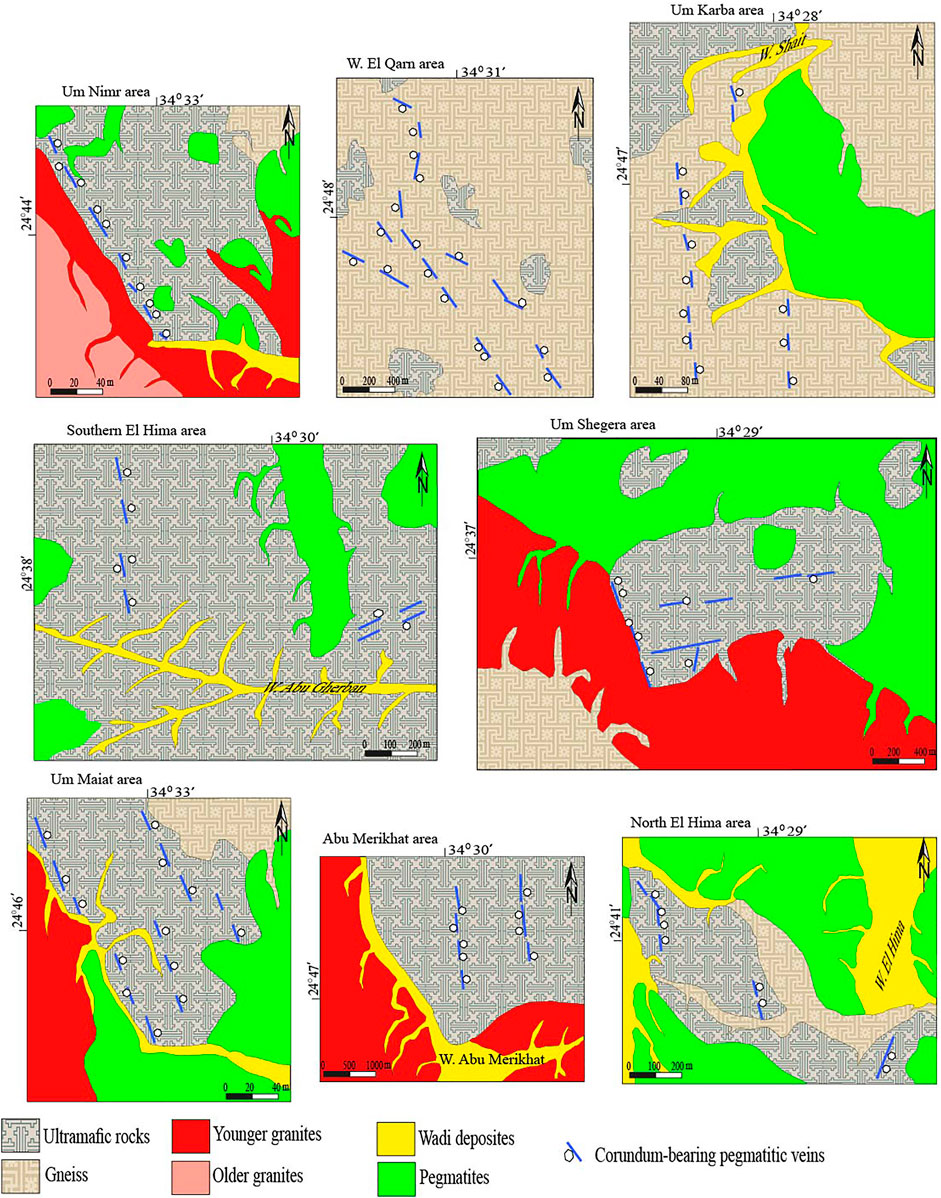
FIGURE 2. Field-scale geologic maps of the eight studied areas showing the distribution of the corundum-bearing pegmatites in the host rocks (ultramafics and gneisses). For locations, Figure 1.
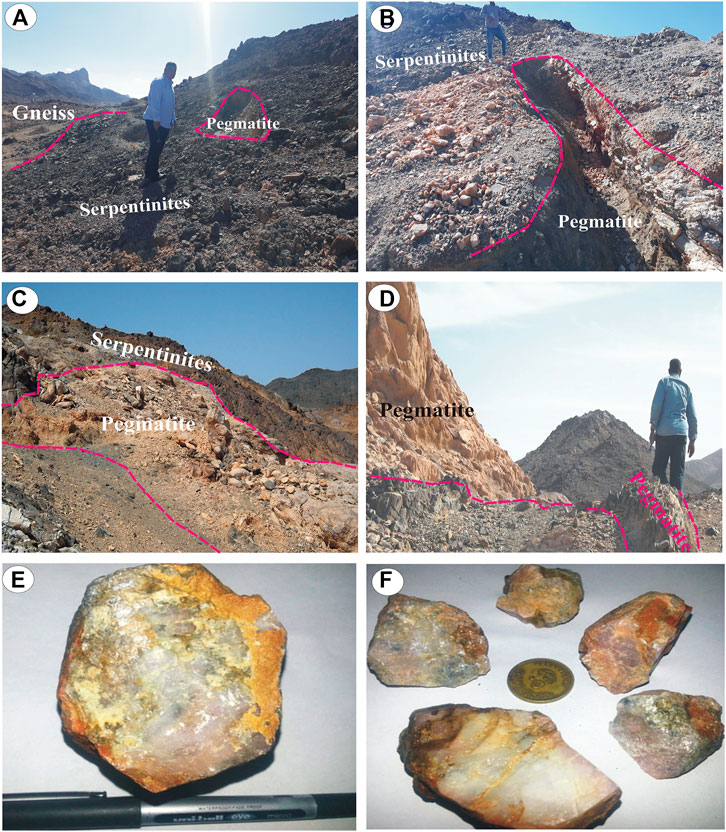
FIGURE 3. Field photographs showing corundum-bearing pegmatite veins invading (A) gneiss and (B–D) Serpentinite rocks and (E,F) hand specimen of corundum minerals.
Dykes are widespread in the Migif-Hafafit area with two main types. The first one is composed mainly of lamprophyre dykes and trending dominantly NE-SW, whereas the second type is composed mainly of acidic and intermediate dykes, which have NE-SW, N-S, and NW-SE trends (Figure 1B). The two types have crosscutting relationships explaining that the NE-SW direction is the youngest one.
3 Materials and Techniques
Herein, the geological mapping is planned to update the geological boundaries of the map produced by El Ramly and Greiling, (1988) for the study area. The generation of the updated version of the geological map and detection of corundum-bearing pegmatites has been carried out using different satellite image processing techniques, microscopic examination, geochemical, and mineral chemistry analyses in addition to the field relations and observations.
3.1 Remotely Sensed Data
For the digital image processing and interpretation, Landsat-8 OLI and Sentinel-2A multispectral images were used because their spectral ranges are more adequate for lithological discrimination and mineral detection. This is due to important absorption mineral features in the near-infrared (NIR) and short-wave infrared (SWIR) that must be covered by the specificc band’s spectral ranges (Cardoso-Fernandes et al., 2019). For detailed information on the spectral and spatial characteristics of Landsat-8 OLI and Sentinel-2A, see the supplementary data file (Supplementary Section S1 and Supplementary Table S1).
Two cloud-free and georeferenced scenes of level-1T Landsat-8 and level-1C Sentinel-2A were obtained from the USGS platform and processed in this study. The preprocessing techniques of pixel resampling, subsetting, radiometric, and atmospheric corrections were considered and performed. The atmospheric correction is used to minimize the influences of atmospheric factors in multispectral data (Liang and Wang, 2020; Van der Meer et al., 2014). The Landsat-8 digital numbers (DNs) were converted to top of the atmosphere (TOA) reflectance. The Landsat-8 is subjected to the dark object subtraction (DOS) atmospheric correction to convert TOA reflectance to surface reflectance (Chavez, 1996). The Sentinel-2A image is already provided in TOA reflectance. The internal average relative reflection (IARR) method was applied to the Sentinel-2A data. The IARR technique for mineral mapping does not need prior knowledge of the geological features (Ben-Dor et al., 1994). The IARR normalizes the images to a scene with an average spectrum. The image processing is performed using ENVI v. 5.3 and the Sentinel Application Platform (SNAP v. 7) software for the image processing where the output of geologic and geospatial maps are carried out by the ArcGIS v. 10.5 packages.
3.2 Geochemical Techniques
Major, trace, and rare earth elements (REEs) were carried out by (ICP-MS) in ACME Labs, Vancouver, Canada, following fusion with lithium tetraborate/metaborate with digestion by nitric acid. Calibration of the ICP-MS was carried out using standards. The analytical precision, as calculated from replicate analyses, was 0.5% for major oxides and varied from 2 to 20% for trace elements. The detection limits for trace elements and major oxides were 0.01–0.5 ppm and 0.001 wt%-0.04 wt%, respectively. Some samples were tested for major elements using the method of Shapiro and Brannock (1962) using lithium tetraborate as a fux at the laboratories of the Nuclear Materials Authority, Cairo, Egypt. The corundum was analyzed with a JEOL JXA-733 electron probe microanalysis (University of New Brunswick) equipped with ds spec and dQant32 automation (Geller Micro Analytical Labs). An accelerating voltage of 15 kV and a probe current of 30 nA. The peak counting times were 30 s (Al and Si), 90 s (Ti, V, Cr, and Cs), and 120 s (Na, Mg, K, Ca, Mn, Fe, and Ni. The environmental scanning electron microscope (ESEM) investigation was done at the Nuclear Material Authority (NMA). The ESEM is equipped with link analytical AN-1000/855 energy dispersive X-ray spectrometer (EDX) calibrated using natural standards to identify elements and detect, semi-quantitatively, the corundum compositions.
4 Satellite Data Based Lithological and Mineralogical Mapping
The multispectral remote sensing sensors become an efficient tool in lithological and mineralogical mapping in metallogenic zones (Zoheir et al., 2019). The possible detection of corundum-bearing pegmatites using the remotely sensed data in the study area was made based on two approaches: the first one; the outline of the ultramafics, gneisses, and gneissose granodiorite which are injected by the pegmatite veins. The second one is the identification of hydrothermally altered zones associated with the pegmatites (through the discrimination of iron oxides and clay minerals), which in turn detect the corundum-bearing pegmatites. In the present study, Landsat-8 OLI and Sentinel-2A data were used to discriminate lithological units, alteration zones and pegmatites bodies, veins and lenses, and their associated ore deposits (e.g., corundum). Three bands of Sentinel-2A (1, 9, and 10) were excluded from the image processing, as they do not contain geological/mineralogical information. These bands contain information related to atmospheric issues (e.g., aerosol scattering, water vapor absorption, and detection of thin cirrus, Supplementary Table S1) irrelevant to the present study (Paganelli et al., 2003). False-color composites (FCCs) (e.g., Pour and Hashim, 2015), band ratio (BR) (e.g., Mahboob et al., 2019), principal component analysis (PCA) (e.g., Cheng et al., 2011), minimum noise fraction (MNF) (e.g., Green et al., 1988), decorrelation stretch (DS) (e.g., Asran and Hassan, 2021), and the constrained energy minimization (CEM) spectral mapping techniques (Harsanyi, 1993) were adopted to discriminate lithologies, alteration zones, pegmatites, and their associated mineralization in the study area.
Image processing is promoted by the end-member/training areas collection from the image scene, which can help choose the best bands in the processing technique. The training areas are defined as a distinct spectral response and may represent individual minerals or mixtures of minerals. Eleven spectral signatures of the widely exposed rock units in the study area were identified manually from the Landsat-8 and Sentinel-2A images (Supplementary Figures 1A,B). Supplementary Figure 1A illustrates all rock units including pegmatites have moderate absorption around Landsat-8 bands 2 and 3 and strong absorption around bands 5 and 7. In addition, the average spectral characteristics diagram (Supplementary Figure 1B) shows that all rock units have moderate absorption around Sentinel-2A bands 3 and 5 and strong absorption around bands 8, 8A, and 12.The pegmatites bodies give absorption around Sentinel-2A bands 3, 5, 8A, and 12.
4.1 Lithological Mapping
4.1.1 False-Color Composites
False-color composites (FCCs), also known as red-green-blue (RGB) combination is a very useful image enhancement technique, which offered powerful means to visually interpret multispectral satellite data (Novak and Soulakellis, 2000). Pour and Hashim (2015) stated that the color composites image can easily enhance hydrothermally altered rocks and lithological units at a regional scale. Some minerals and mineral groups in hydrothermally altered rocks have unique absorption characteristics in the electromagnetic spectrum. For example, clay and carbonate minerals have absorption features from 2.1 to 2.4 μm and reflectance from 1.55 to 1.75 μm (Ali and Pour, 2014); iron oxides commonly have a strong reflectance near red and low blue reflectance (Han and Nelson, 2015). In the present study, FCCs of Landsat-8 bands and their equivalent in Sentinel-2A were tested. To identify hydrothermally altered rocks, Landsat-8 (L8) RGB-567 (Pour and Hashim, 2015) (Supplementary Figure 2A) and Sentinel-2A (S2) RGB-81112 (Cardoso-Fernandes et al., 2019) (Supplementary Figure 2B) were produced, whereas L8 RGB-257 (Ali and Pour, 2014) and S2 RGB-2812 (Cardoso-Fernandes et al., 2019) were used to locate the iron oxides and clay minerals. Also, Cardoso-Fernandes et al. (2019) used L8 RGB-327 (Figure 4A) and S2 RGB-3212 (Figure 4B) to detect the pegmatite veins and their associated mineralization.
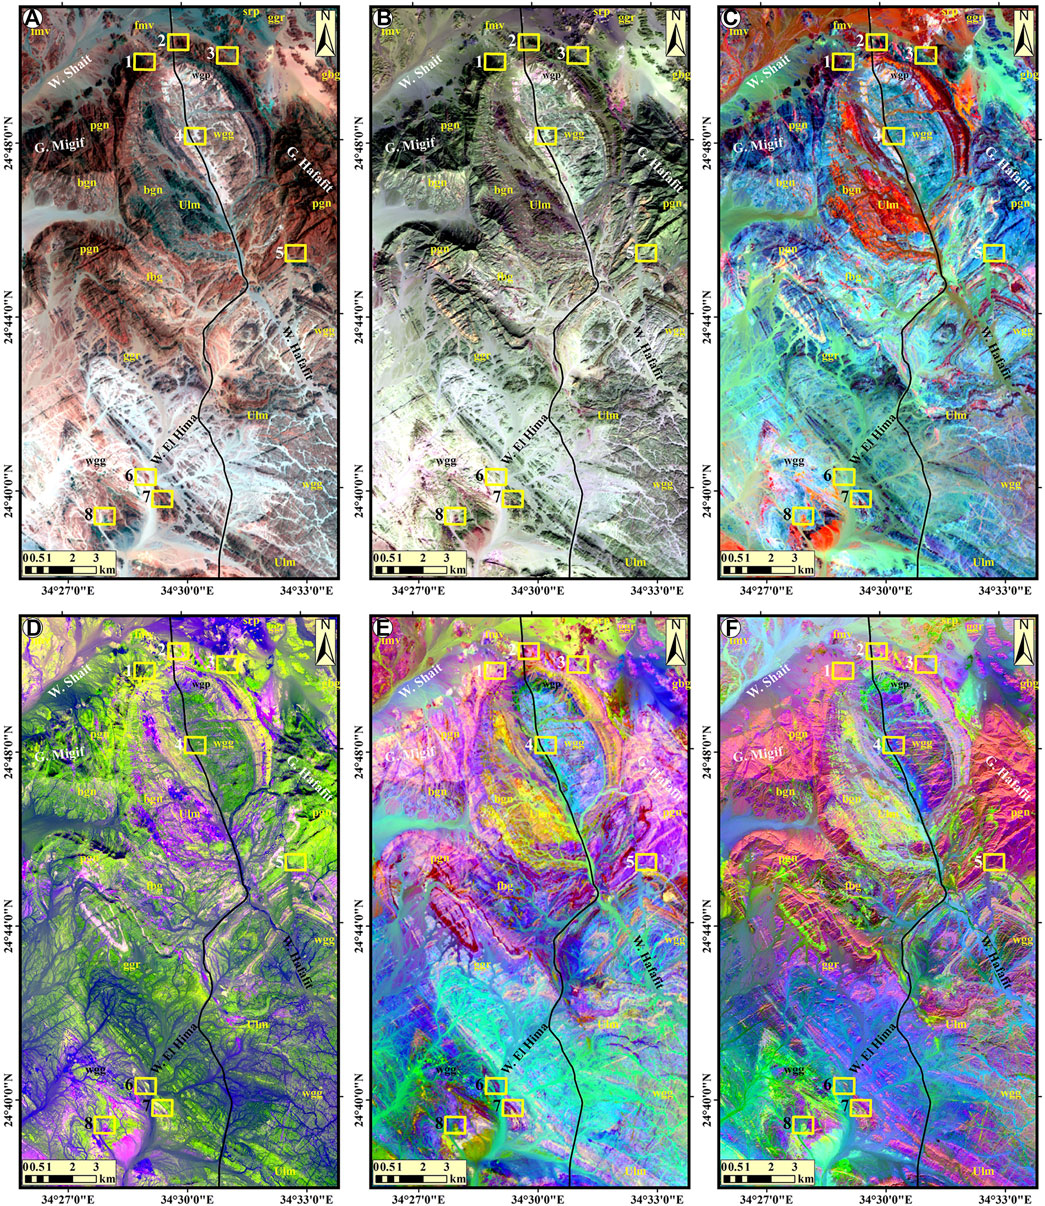
FIGURE 4. Lithological discrimination based on (A) Landsat-8 (RGB-327), (B) Sentinel-2A (RGB-3212), (C) Landsat-8 (RGB-6/7, 4/3, 5/4), (D) Sentinel-2A (RGB-11/7, 12/5, 11/12), (E) Landsat-8 PCA123 and (F) Sentinel-2A PCA145. The yellow boxes represent the selected areas. For abbreviations, see the legend of Figure 1.
4.1.2 Band Ratio
The band ratio is an image processing technique that enhances the contrast between features by dividing a measure of reflectance for the pixels in one band by that of the pixels in another band of the same satellite image (Mahboob et al., 2019). This technique has been widely used for visualizing and mapping hydrothermally altered rocks. For lithological mapping, Abrams ratio (L8 RGB-6/7, 4/3, 5/4; Figure 4C), Chica-Olma ratio (L8 RGB-6/7, 6/5, 4/2; (Supplementary Figure 2C), S2 RGB-11/7, 12/5, 11/12 (Figure 4D), and S2 RGB-12/8A, 11/8A, 12/11 (Supplementary Figure 2D) were produced. These ratios successfully discriminate ultramafics, gneisses, gneissose granodiorite, and associated pegmatites.
4.1.3 Principal Component Analysis
PCA is a multivariate statistical method used to study associations between variables. It transformed several correlated variables into uncorrelated combinations (eigenvector loadings) of principal components (PCs) based on their covariance or correlation matrix (Loughlin, 1991). PCA reduces the dimensionality and redundancy of data sets and is commonly applied to enhance information interpretability (Cheng et al., 2011). The eigenvector matrix for the Landsat-8 and Sentinel-2A data derived from the PCA are given in Supplementary Tables S2, S3, respectively. The principal component (PC) image with moderate to high eigenvector loadings for the indicative bands (reflection and/or absorption bands) and opposite signs enhances efficient discrimination of a certain mineral. If the loading value is positive, the mineral appears with a bright pixel but if it is negative it will appear as a dark pixel (Zoheir, et al., 2019). Commonly, the three first PCA images (PC1, PC2, and PC3), containing the highest topographical and spectral information, are suitable for lithological discrimination (Cheng et al., 2011). In the present study, a PCA123 (Figure 4E) and PCA432 (Supplementary Figure 2E) for Landsat-8 and PCA145 (Figure 4F) and PCA643 (Supplementary Figure 2F) for Sentinel-2A were produced to enhance the geological contacts and mineralogical targets.
4.1.4 Minimum Noise Fraction
Minimum Noise Fraction (MNF) transformation is used to determine the inherent dimensionality of image data, segregate noise in the data, and reduce the computational requirements for subsequent processing (Green et al., 1988). The MNF imagery bands are effective for visualizing spectral variation and lithological discrimination within a scene through false-color RGB images. One of the most effective trials to build an MNF-531 image for the Landsat-8 bands is shown in Figure 5A, which promotes the geological contacts, especially for the ultramafics and different types of gneisses. The eigenvector matrix for the Landsat-8 data derived from the MNF is shown in Supplementary Table S4.
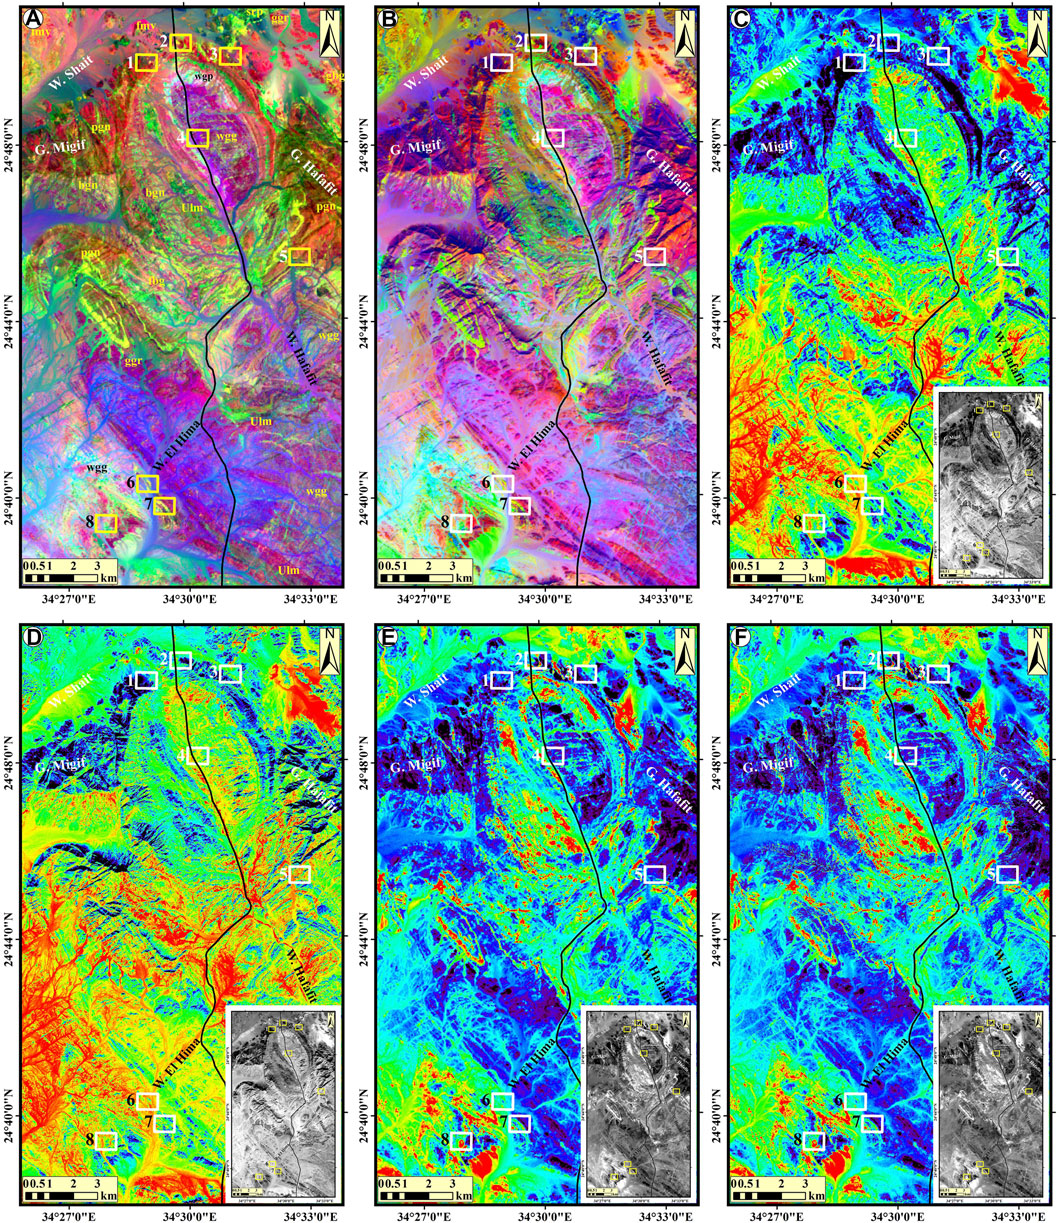
FIGURE 5. (A) Landsat-8 (MNF-531) and (B) Decorrelation stretch of Sentinel-2A (RGB-12118) discriminate the lithological contacts. Mineralogical detection (C) Landsat-8 (4/2) and (D) Sentinel-2A (4/2) for mapping iron oxides, (E) Land-sat-8 (6/7) and (F) Sentinel-2A (11/12) for mapping hydroxyl/clay minerals. The yellow and white boxes represent the selected areas. Note: the band ratio (C–F) is offered by the density slice method (high ratio values shown in red). Inset gray scale band ratios versions are also presented in (C–F).
4.1.5 Decorrelation Stretch
Decorrelation stretch technique removes the high correlation between multispectral satellite data and enhances the visual interpretation by producing more colorful color composite images (Asran and Hassan, 2021). The decorrelation stretche (DS) technique has been applied on spectral bands of Sentinel-2A data with a high spatial resolution (10 m) to enhance the pegmatite veins and different lithological contacts. In the present study, the decorrelation stretch was applied on 10 spectral bands of Sentinel-2A, the resultant decorrelations stretch of the color composite image (RGB-12118) is the most useful in discriminating the different rock units in the study area. Pegmatite bodies, veins, and lenses are highlighted well and appear in yellowish cyan tones (Figure 5B).
4.2 Pegmatites and Associated Mineralization Detection
Generally, all the mineral deposits show characteristic spectral signatures on multispectral spectral remote sensing systems based on their mineralogy and texture. As mentioned above the detection of pegmatites and associated mineralization in the examined area is based on the identification of the country rocks (ultramafics and gneisses) and the hydrothermally altered zones. The hydrothermal alteration zones are characterized by substantial contents of hydrous ferromagnesian silicate and iron oxides. Therefore, the band ratio technique was applied to Landsat-8 and Sentinel-2A data to recognize types of hydrothermal alteration. For the Landsat-8, the band ratios 4/2, 6/7, 4/3, and 6/5 (Figures 5C,E, Supplementary Figures 3A,C, respectively) are used to map iron oxides, OH-bearing minerals, ferric iron, and ferrous minerals, respectively. Where the band ratios of sentinel-2A of 4/2, 11/12, 11/8A, and 12/11 (Figures 5D,F, Supplementary Figures 3B,D, respectively) are used to map iron oxides, hydroxyl minerals, ferric oxides, and ferrous silicate, respectively. A density slice method was applied to enhance the band ratio results. The color ramp of this method offers the lower values (e.g., cyan) in cold colors and the higher values in hot colors (e.g., red). The resultant images emphasize subtle gray scale differences that may be imperceptible (Sabins, 1996).
Hunt (1977) pointed out that the corundum Al2O3 mineral type provides strong absorption in 2.10 µm and shows an intense absorption feature in 2.40 μm of the electromagnetic spectrum. Moreover, the standard spectral curve of corundum in the USGS spectral library shows that it provides high reflectance in 1.5 µm and high absorption in 2.1 µm (Figure 6A). Therefore, the band ratios 6/7 of Landsat-8 and 11/12 of Sentinel-2A are very helpful in detecting the corundum-bearing pegmatites and Al2O3 rich rocks in bright pixels in the study area. The constrained energy minimization (CEM) technique developed by Harsanyi (1993)has been used to solve the typical adaptive beam-forming problem in signal processing. CEM has become one of the most widely used techniques today for minerals mapping (Gabr et al., 2010). This technique was adopted in the present study as a spectral mapping method for detecting corundum-bearing pegmatites. It was applied to Landsat-8 bands to detect corundum minerals with reference to the USGS spectral library. The potential distribution of corundum-bearing pegmatites is dropped over gray scale band ratio of 6/7 of Landsat-8 (Figure 6B) as well as in El Qarn area and south El Hima areas (Figures 6C,D, respectively).
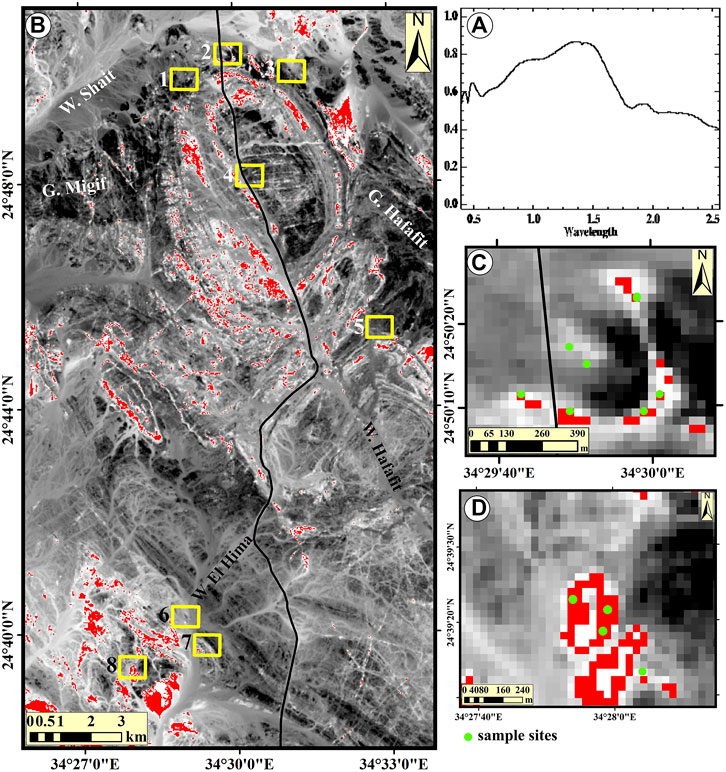
FIGURE 6. (A) Diagram showing the USGS spectra of corundum, (B) CEM results (red pixels) showing the pegmatites and associated corundum abundance in the study area drapped over Landsat-8 (6/7) band ratio, (C,D) showing the validation of the distribution of pegmatites using the matching of the sample locations in two areas; El Qarn area and South El Hima area, respectively.
The aforementioned processed color composite and gray scale images of Landsat-8 and Sentinel-2A integration with field investigations, petrographical, and geochemical data interpretation have been used to update the geological map of El Ramly and Greiling (1988) of the study area (Figure 1B). In addition, the new geologic map recognized the pegmatite bodies, veins, and lenses, which contain corundum mineralization in the study area.
5 Petrography
Representative samples of the examined ultramafics exhibit that they are completely serpentinite according to their mineralogical composition. Serpentinites are mainly composed of antigorite, with a subordinate amount of carbonates. Chromite and magnetite are the main opaques and accessories. Primary minerals such as olivine and pyroxene were not survived from serpentinization processes. The pseudomorphic texture of olivine and pyroxene is indicated by mesh and bastite textures. Antigorite occurs as fine-grains of fibro-lamellar with plumose textures and reveals irregular aggregates (Figure 7A). Carbonates occur either as scattered patches or veinlets crosscutting antigorite. Chromite is the main primary mineral that survived serpentinization and metamorphism. Gneiss rocks are fine-to medium-grained, massive to foliated and represented by gneiss. They mainly consist of quartz and feldspars (plagioclase and microcline) with subordinate biotite minerals. The main accessory minerals are zircon and iron oxides (Figure 7B). Corundum-bearing pegmatites are mainly composed of microcline, quartz and plagioclase, exhibiting often perthitic and micrographic textures. In the hand specimen, corundum is colorless to pale violet with high relief (Supplementary Figure 4A). Corundum reveals elongated and fractured crystals of different sizes. Its color varies from brown to black in cross-polarized light (Figures 7C,D). Occasionally, it is enclosing different minerals such as magnetite and allanite and is corroded by plagioclase and biotite. Moreover, corundum is indicated by ESEM and EDA analysis (Supplementary Figure 2B).
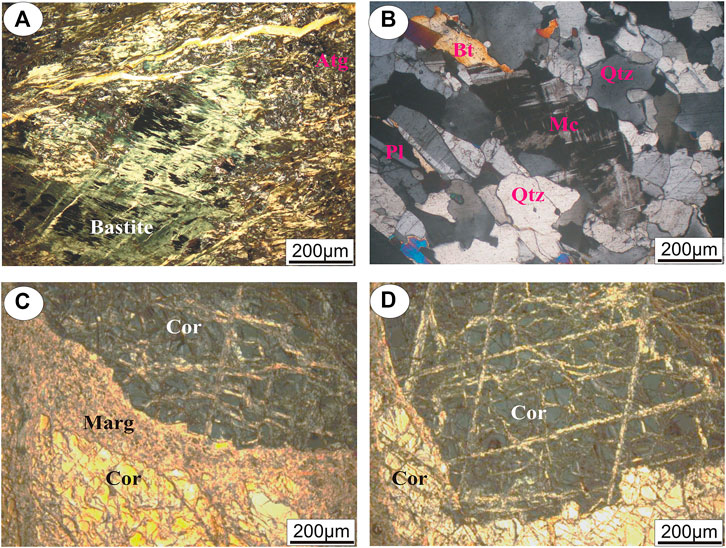
FIGURE 7. (A) Microveinlets of carbonates intersected antigorite (Atg); (B) Anhedral microcline (Mc) crystal corroded by quartz (Qtz) and plagioclase (Pl); (C,D) Margarite (Marg) between high relief anhedral and fractured corundum (Cor).
6 Geochemistry
6.1 Bulk Rock Geochemistry
6.1.1 Ultramafic Rocks
Bulk rock (major, trace, and REEs) analysis of the examined ultramafic samples collected from six localities (Um Nimr, Um Maiat-Abu Merikhat, Um Shegera, and North-South El Hima) are given in Table 1. Loss of ignitions (LOI) ranges from 3.85 wt.% (Um Shegera) to 5.6 wt.% (North-South El Hima), reflecting different serpentinization degrees. It is noticeable that all of the studied samples have TiO2, MnO, Na2O, K2O, and P2O5 contents lower than 1 wt.%. Moreover, they have low Al2O3 (1.45–1.8 wt.%) and very low contents of CaO (0.52–0.85 wt.%) that are comparable with Pan-African and fore-arc peridotite (Bodinier and Godard, 2003; Deschamps et al., 2013; El Mezayen et al., 2018), reflecting their refractory origin (e.g., Gamal El Dien et al., 2016). The studied samples are depleted in CaO and Al2O3 relative to the primitive mantle (PM) and depleted (DM) according to Salters and Stracke (2004) and Palme and O’Neill (2004). They possess a very low content of Al2O3/SiO2 (less than 0.06) relative to PM (McDonough and Sun, 1995) and SiO2/MgO ratio varies from 0.88 to 1.02, which is comparable with ophiolitic peridotite (Bodinier and Godard, 2003; Figure 8A). The examined ultramafics are classified as harzburgite (Li et al., 2004; Figure 8B).
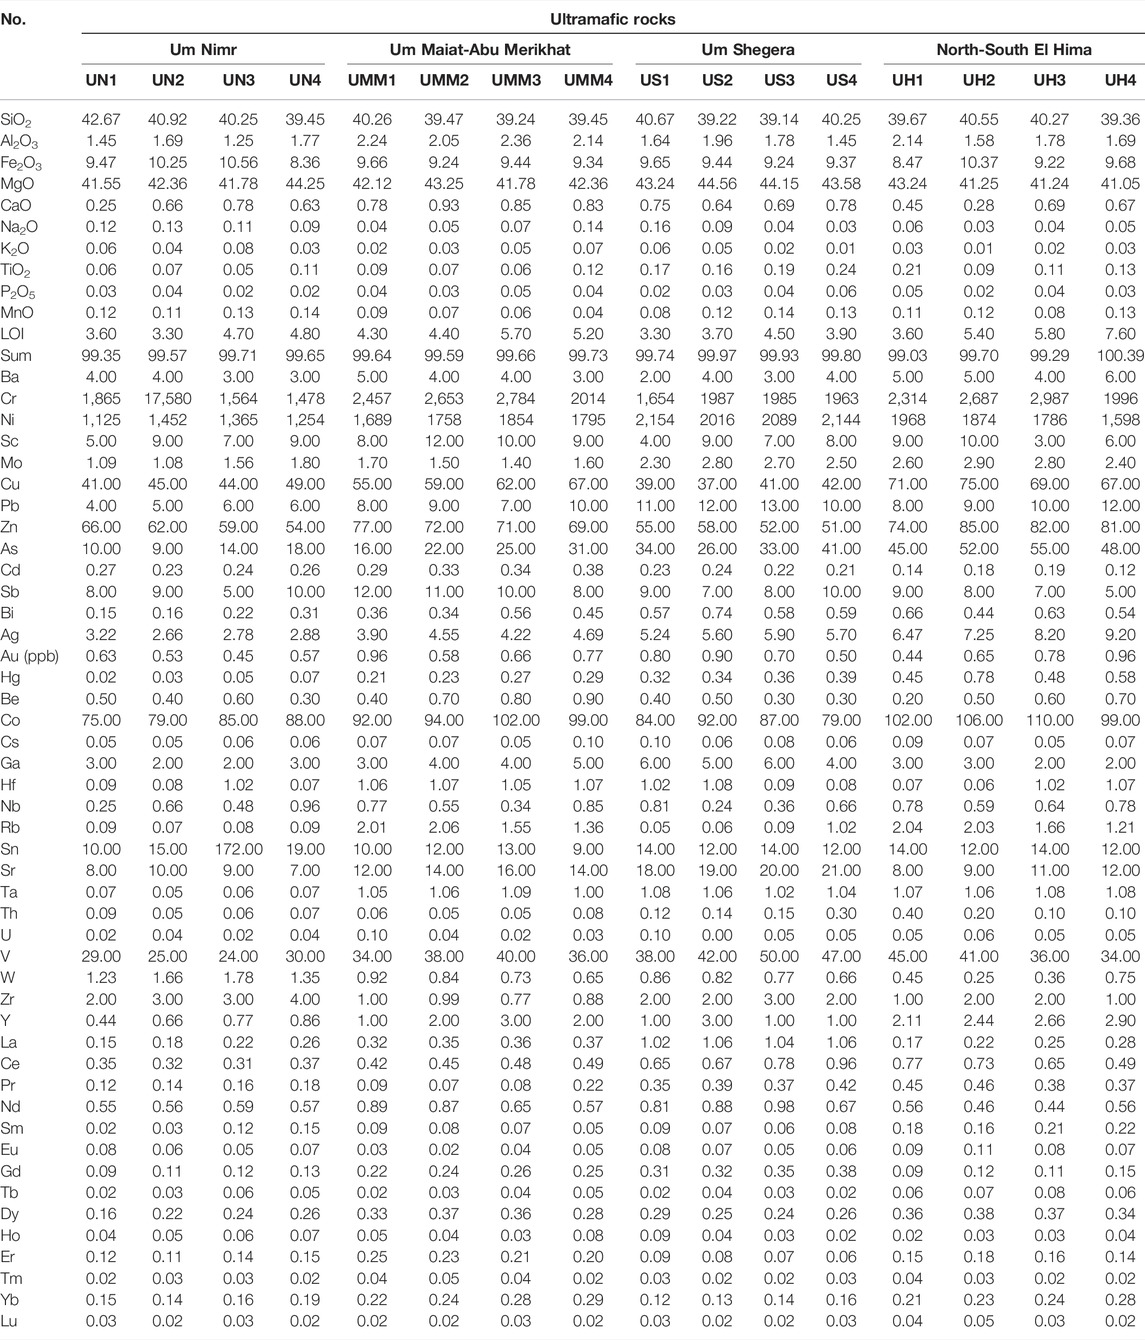
TABLE 1. Whole rocks (major, trace, and REEs) of Um Nimr, Um Maiat-Abu Merikhat, Um Shegera, and-North-South El Hima ultramafic rocks.
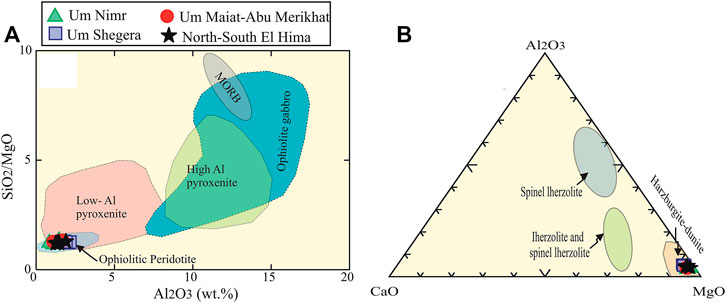
FIGURE 8. (A) Al2O3 against SiO2/MgO diagram of Bodinier and Godard (2003) and (B) CaO-Al2O3-MgO ternary diagram (Li et al., 2004).
On the other hand, the investigated ultramafics contain high concentrations of compatible elements such as Ni (1,125–2,154 ppm), Cr (1,478–2,987 ppm), and Co (75–110 ppm). This may be ascribed to the substitution process between these elements and Mg2+ in olivine. Furthermore, they encompass low concentrations of high field strength elements (HFSEs) such as Zr (0.77–4.0 ppm), Hf (0.06–1.08 ppm), Nb (0.24–0.96 ppm), and Y (0.44–3.0 ppm) as well as very low contents of low field strength elements (LFSEs) such as Rb (0.05–2.06 ppm), Ba (2–6 ppm) and Sr (7–21 ppm). Multi-elements patterns of the examined ultramafics normalized to PM of Sun and McDonough (1989) exhibit a clear strong positive anomaly of fluid mobile elements such as Pb (Figure 9A). Pb positive anomaly may be ascribed to fluid percolation during serpentinization processes (Deschamps et al., 2013). The studied rocks containing ∑REEs vary from 1.9 to 4.21 ppm. The patterns of the examined samples (normalized to (Cl) chondrite of Sun and McDonough (1989), exhibit slight enrichment of low rare Earth elements (LREEs) compared with high rare Earth elements (HREEs) (Figure 9B), which is consistent with fore-arc serpentinites (e.g., Deschamps et al., 2013) and Mariana fore-arc (Kodolanyi et al., 2012). This is related to their mobility of (LREEs) during subduction/alteration.
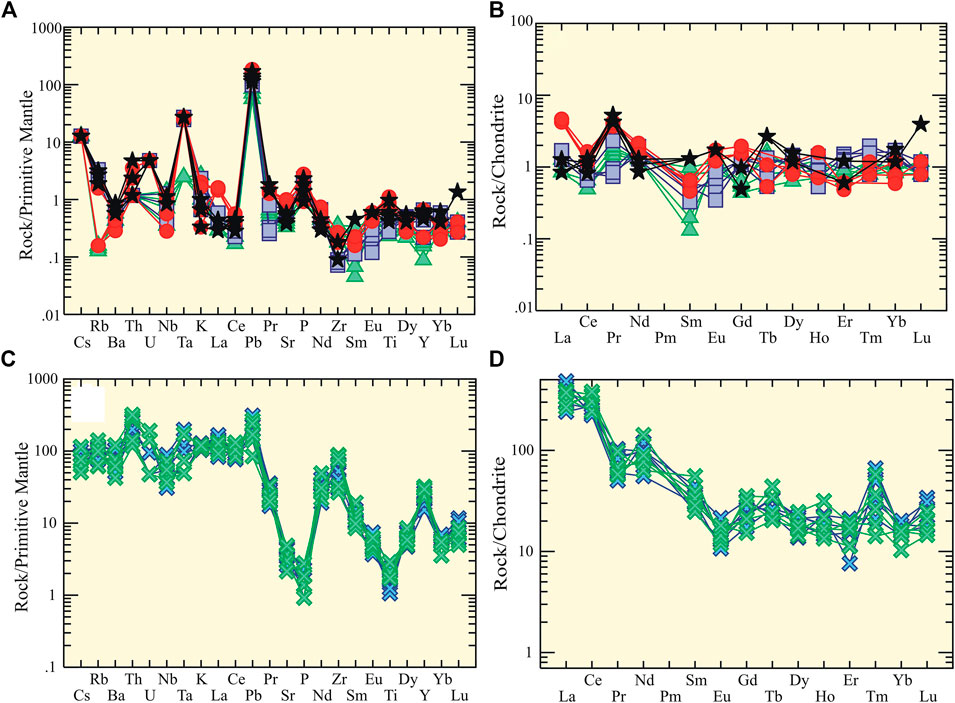
FIGURE 9. (A) Primitive mantle and (B) chondrite (Cl)-normalized trace element patterns of the examined ultramafic rocks after Sun and McDonough (1989); (C) Primitive mantle and (D) chondrite (Cl)-normalized trace element patterns of the examined gneissose rocks after Sun and McDonough (1989).
6.1.2 Gneiss Rocks
Whole-rock (major, trace, and REEs) analysis of the Wadi El Qarn and Um Karaba) are given in Table 2. Wadi El Qarn and Um Karaba gneisses are characterized by a high content of SiO2, which varies from 74.79 wt.% in Wadi El Qarn to 75.25 wt.%, and moderate amounts of Al2O3 (av. 11.54 wt.%), Fe2O3 (av. 3.8 wt.%), and Na2O + K2O (av. 7.93 wt.%). The relatively wide variation is observed in Ba (297–840 ppm), Sc (11–33 ppm), Cu (16–142 ppm), Zn (125–266 ppm) Sr (45–108 ppm, and Zr (298–987 ppm) (Table 2). Some trace elements are normalized to the primitive mantle of Sun and McDonough (1989), and their patterns exhibit strong P and Ti negative anomalies (Figure 9C). Rare Earth elements of the examined gneisses pattern reveal (enrichments) a steep slope of LREEs relative to HREEs with a weak Eu negative anomaly (Figure 9D).
TABLE 2. Whole rocks (major, trace and REEs) of Um Karaba and Wadi El Qarn gneisses rocks.
6.1.3 Pegmatites
Whole-rock (major, trace, and REEs) analysis of the studied pegmatite samples collected from eight areas, hosted in two gneiss localities (Wadi El Qarn and Um Karaba) and six ultramafic masses (Um Nimr, Um Maiat-Abu Merikhat, Um Shegera, and N-S El Hima) are given in Supplementary Table S5. Among the analyzed pegmatites hosted in ultramafics, Um Maiat-Abu Merikhat has the highest contents of SiO2 (55.02 wt.%), Ga (88.8 ppm), Rb (318 ppm), Sr (27.4 ppm), V (50.4 ppm), Cu (100 ppm) relative to those of other areas. On the other hand, Um Shegera contains the highest amounts of Al2O3 (40.57 wt.%), Fe2O3 (7.57 wt.%), CaO (5.22 wt.%), Zn (168 ppm), and La (105.6 ppm) relative to those of other localities. The high Al2O3 content of the examined pegmatites is related to the abundance of corundum mineralization. On the other hand, the studied pegmatites hosted in ultramafics contain high contents of Al2O3 (34.97 wt.%), and MgO + Fe2O3 (8.67 wt.%) relative to those hosted in gneiss rocks (22.15, 7.19 wt.%, respectively). The high contents of MgO + Fe2O3 may be ascribed to the contribution of serpentinite rocks. Multi-elements of the studied pegmatites normalized to the upper continental crust of Taylor and Mclennan (1985) and their pattern reveal strong Ba and Sr negative anomalies (Figure 10A). In addition, they exhibit a notable enrichment of LREEs with a steep slope relative to nearly flat HREEs (Figure 10B).
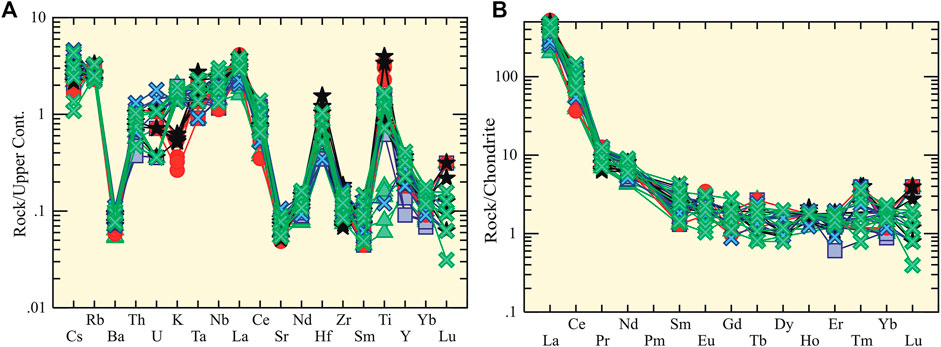
FIGURE 10. (A) Trace elements of the studied pegmatites normalized to the upper continental crust of Taylor and McLennan (1985); and (B) chondrite-normalized REEs of Sun and McDonough (1989).
6.2 Corundum Chemistry
Representative electron microprobe analysis (EMPA) of the examined corundum revealed that the Al2O3 is the dominant constituent (Supplementary Table S6). The Al2O3 reaches up to 99.72 wt.% in pegmatite-gneiss and up to 100 wt.% in pegmatite-ultramafics (Um Nimr area). Other constituents such as SiO2, MnO, CaO, MgO, FeO, Cr2O3, TiO2, Ga2O3, Na2O, and K2O have an average of less than 0.5 wt.%. The main differences in the examined corundum of all localities are in chromophores (traces) such as Ti, Cr, Fe, and Mg. The studied corundum of pegmatite hosted in-gneiss contain the lowest amounts (Maximum concentrations) of TiO2 (0.02 wt.%), FeO (0.36 wt.%) and Cr2O3 (0.29 wt.%) relative to those of pegmatite hosted in ultramafics (0.12, 0.42, and 1.88, respectively).
7 Discussion
7.1 Remote Sensing Data Analysis
The tested false-color composites are apt to discriminate between the different lithological units, lithological contacts, and structures in the study area. The composites that better identify hydrothermally altered rocks are RGB-567 for L8 in faint green tones (Supplementary Figure 2A). The RGB-2812 for S2A demarcates the iron oxides and clay minerals in whitish pink color (Supplementary Figure 2B). The two composites of RGB-327 for L8 (Figure 4A) and RGB-3212 for S2A (Figure 4B) manifest rocks enriched with ferromagnesian minerals by strong dark pixels, and the degree of pixel opacity decreases slightly for rocks with lower ferromagnesian content. The highly folded ultramafics and metagabbros can be easily detected in the pinkish-gray color of the white gneissic granodiorite. Al2O3 rich rocks are enhanced by the light to dark buff color as shown in Figure 4A.
The ultramafic rocks can be well identified in the band ratio of RGB-6/7, 4/3, 5/4 for (L8) (Figure 4C) with the dark to bright bloody color. These rocks are separated with sharp contacts from the dark blue pixels of biotite gneisses and pinkish-gray color of gneissose granodiorite. The pegmatite veins and bodies exhibit orange color. The band ratio RGB-11/7, 12/5, 11/12 of (S2A) (Figure 4D) shows the ultramafics in lemon green, gneisses in bright green, the highly injected white gneissic granodiorite with pegmatites in blue colors. The pegmatites are demarcated by the light magenta color. The Chica-Olma ratio RGB-6/7, 6/5, 4/2 of (L8) (Supplementary Figure 2C) highlights the ultramafics rocks in reddish yellow, gneisses in dark green, gneissic granodiorite-tonalite in light violet to dark blue color. The pale yellow color of pegmatite bodies can be detected well from the dark background colors of gneissic granitic rocks. In addition, the ultramafic rocks in the six studied areas of Um Maiat, Abu Merikhat, Um Nimr, North El Hima, South El Hima, and Um Shegera exhibit bright green colors in the band ratio RGB-12/8A, 11/8A, 12/11 of (S2A) (Supplementary Figure 2D). These ultramafics are injected by pale color pegmatite veins and lenses.
Loughlin (1991) pointed out that the magnitude and sign (positive or negative) of the eigenvectors depend on which spectral properties of rocks and/or minerals are responsible for the statistical variance mapped into each principal component (PC). The eigenvector loadings of PC1, PC2, PC3, and PC4 show high contributions with bands 5, 6, 7 of Landsat-8 (Supplementary Table S2). Therefore, PCA123 (Figure 4E) and PCA432 (Supplementary Figure 2E) were performed to highlight areas enriched with iron oxides and clay minerals, which are associated with the pegmatite veins. The dark red and blue pixels have a high surface abundance of iron oxide/hydroxide minerals, which are mostly associated with ultramafic rocks (Figure 4E and Supplementary Figure 2E). Al–OH mineral groups which occurred in the gneissic granitic rocks were enhanced by cyan and light green colors in Figure 4E and Supplementary Figure 2E, respectively. The pegmatite bodies are brought out by the dark red pixels in the two images. In accordance with the eigenvector loadings of the Sentinel-2A, the PC1, PC3, PC4, and PC6 have strong loadings of bands 8A, 11, and 12 (Supplementary Table S3). Therefore, the PCA145 (Figure 4F) and PCA643 (Supplementary Figure 2F) were produced to map the gneisses in pink pixels in Figure 4F and in pinkish-blue in supplementary Figure (2f). Al2O3 rich rock enhanced with bright green pixels in Figure 4F and yellowish pale green in Supplementary Figure 2F. Moreover, the MNF-531 of Landsat-8 (Figure 5A) and the decorrelation stretch for the RGB-12118 (Figure 5B) of Sentinel-2A shows good and useful discrimination of ultramafics (in green and light blue pixels), gneisses (in red pixels), biotite gneisses (greenish cyan pixels), and white gneissose granite (in cyan pixels). A good appearance of the pegmatite veins and lenses in a bright yellowish-green cut the ultramafics and gneissic background in the two images (Figures 5A,B).
To enhance the mineralization zones in the study area, specific band ratios were applied to Landsat-8 and Sentinel-2A data. The band ratios 4/2 to Landsat-8 (Figure 5C) and Sentinel-2A (Figure 5D) are used to delineate the iron oxides commonly in bright pixels in the gray scale version. The present study offers the color density slice version of the two gray scale ratios with red areas corresponding to the highest surface reflectance values and easy to detect. The band ratios 6/7 to Landsat-8 (Figure 5E) and 11/12 to Sentinel-2A (Figure 5F) enhanced in red color the areas rich with hydrothermal minerals, which are associated with the ultramafics and pegmatite bodies. To map the ferric oxides band ratios of 4/3 to Landsat-8 (Supplementary Figure 3A) and 11/8A to Sentinel-2A (Supplementary Figure 3B). Where the band ratios 6/5 to landsat-8 (Supplementary Figure 3C) and 12/11 to Sentinel-2A (Supplementary Figure 3D) are successful to map the ferrous minerals. The resultant images of the previous band ratios provide coinciding results from the Landsat-8 and Sentinel-2A band ratios and confirm each other. The distribution of the iron oxides and hydroxyl minerals helps in detecting the pegmatite veins and associated mineralization.
Figure 6B shows the potential areas to the presence of the corundum-bearing pegmatites based on the CEM technique appear in red color pixels drapped over the band ratio 6/7 of Landsat-8. The validation of this map is carried out using 32 ground control points or sample locations of corundum-bearing pegmatites. The accuracy assessment attained 90.6% where 29 points are failed over the detected potential pegmatites pixels. Figures 6C,D shows the matching of the sample locations with the corresponding potential pegmatites pixels in the Wadi El Qarn area (No. 2, corundum-bearing pegmatites hosted in gneisses, Figure 6C) and South Wadi El Hima area (No. 8, corundum-bearing pegmatites hosted in ultramafics, Figure 6D). One hundred and forty-one (141) pegmatite veins and lenses have been detected in the study area (Figure 1B). Their lengths are ranging between 0.06 and 1.16 km and with an average length of 0.21 km. Figure 11A shows the density map of these pegmatite veins drapped over the shade relief map of the study area. These pegmatite veins are trending mostly NW-SE which is affected by the foliation trend of the gneisses, and the foliated ultramafics. The distribution of Al2O3 content percent in the corundum-bearing pegmatites (Supplementary Table S6) drapped over the potential map of the pegmatite (Figure 11B) to reflect the coincide results of the geochemistry and remote sensing. Figure 11B shows the high Al2O3 content in the corundum-bearing pegmatites in the Um Shagara, North, and South El Hima areas but offers a moderate content in the rest of the studies areas.
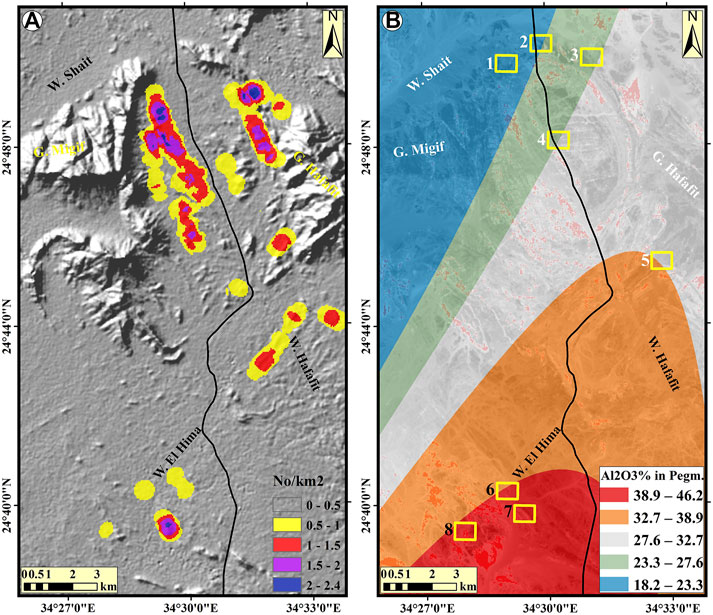
FIGURE 11. (A)Density map of the extracted pegmatite veins and lenses (Note: this map excluded the white pegmatite body in the southwestern part of the area, Figure 1 and (B) Geospatial distribution of Al2O3 content of the pegmatites veins and lenses based on the chemical analysis of the collected samples drapped over the potential abundance of pegmatites produced by the remotely sensed data.
7.2 Tectonic Setting of the Studied Ultramafic Rocks
These rocks are remnants of oceanic crust that are related to Neoproterozoic ophiolitic rocks (Figure 12A). Serpentinization processes reflect low-grade metamorphism (Greenschist facies) affecting the rocks. Bulk-rock composition of the examined ultramafics can be used to manifest post magmatic processes affecting the protolith, including metasomatism and partial melting (El Mezayen et al., 2018; Lasheen et al., 2021a).
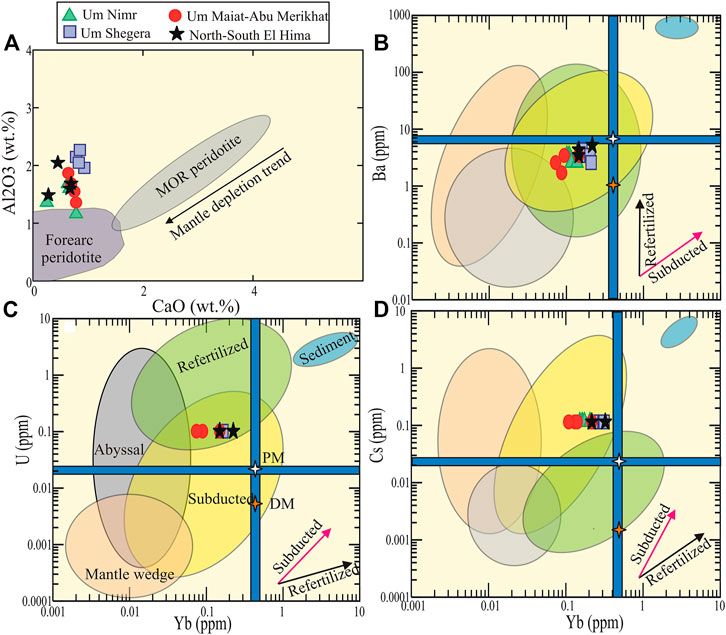
FIGURE 12. (A) CaO against Al2O3 of bulk rock (Ishii et al., 1992); (B–D) Ba, U, and Cs vs. Yb (ppm) for the examined ultramafic rocks (Deschamps et al., 2013). White and red stars are of the primitive mantle (PM) and depleted mantle (DM) are after McDonough and Sun (1995) and Salters and Stracke (2004), respectively. Field of sedimentary poles is after Li and Schoonmaker (2003).
Despite different tectonic signatures of the ophiolitic rocks in the Eastern Desert of Egypt, recent studies can infer the applicable environment based on primary mantle minerals certainly Cr-spinels and olivine relics. Most studies suggest that the Egyptian ophiolitic ultramafics are formed in sub-arc and emplaced in fore-arc (e.g., Azer and Stern, 2007; El Mezayen et al., 2018; Lasheen et al., 2021a). Bulk rocks analysis (hydrous) show that they have SiO2 content that varies from 39.14 to 42.67 wt.%, MgO from 41.05 to 44.56 wt.%, Fe2O3 from 8.36 to 10.56 wt.%, CaO from 0.25 to 0.93 wt.%, and TiO2 from 0.05–0.24 wt.%, suggesting high partial melting degrees (Uysal et al., 2012). Further constraints, the studied ultramafic rocks have high contents of MgO (40.05 wt.%), Ni (1745 ppm), Cr (2,134 ppm), and Co (92 ppm), reflecting their depleted mantle sources (Lasheen et al., 2021a). Moreover, their lower contents of Nb and Zr suggest their depleted source (Geng et al., 2011). SiO2, as well as Al2O3 of the ultramafics, are relatively immobile compared to CaO (e.g., Niu, 2004) and their ratios can be used to infer the tectonic setting (Hattori and Guillot, 2007). The studied ultramafics possess an Al2O3/SiO2 ratio (av. 0.05) lower than that of PM (McDonough and Sun, 1995) and MgO/SiO2 ratios (av. 1.06) higher than that of PM (∼0.85), which compares with fore-arc peridotites. The examined samples straddle in and are akin to (due to higher content of Al2O3) fore-arc field (Ishii et al., 1992; Pearce et al., 2000; Niu, 2004; Figure 12A). Further supporting, Ahmed and Gharib (2018) concluded that the Cr-spinel composition (Cr# > 0.7) of Hafafit ultramafics reflects high partial melting degrees and formed within the fore-arc environment. On the other hand, mantle wedge, subducted, and abyssal ultramafics can be separated from each other’s using some trace and REEs. In terms of, U, Ba, and Cs (ppm) against Yb (ppm), the examined rocks are located far from the terrestrial array in the subducted field (Figures 12B–D).
7.3 Origin and Petrogenesis of Gneiss Rocks
Different origins of the examined gneiss can be deduced using several discrimination diagrams. To infer their igneous origin, the examined samples were plotted on a binary diagram of Tarney (1977). The analyzed samples occupy the igneous source (Figure 13A). Therefore, they are treated as igneous (plutonic/volcanic) rocks in their classification, magma type, and tectonic regime. According to Cox et al. (1979), the analyzed gneisses plotted in the granite field (Figure 13B) and in granite and alkali granite based on De la Roche et al. (1980) (Figure 13C) diagram. Due to the enrichment of total alkalis of the examined gneisses, their parental magma has the chemical composition of A-type granites (Figure 13D) according to Whalen et al. (1987). Therefore, the parent rocks of the examined gneisses can be inferred using some geochemical diagrams such as Nb against Y of Pearce et al. (1984). The protolith of the examined gneisses seems to be formed within the plate tectonic regime (Figure 13E).
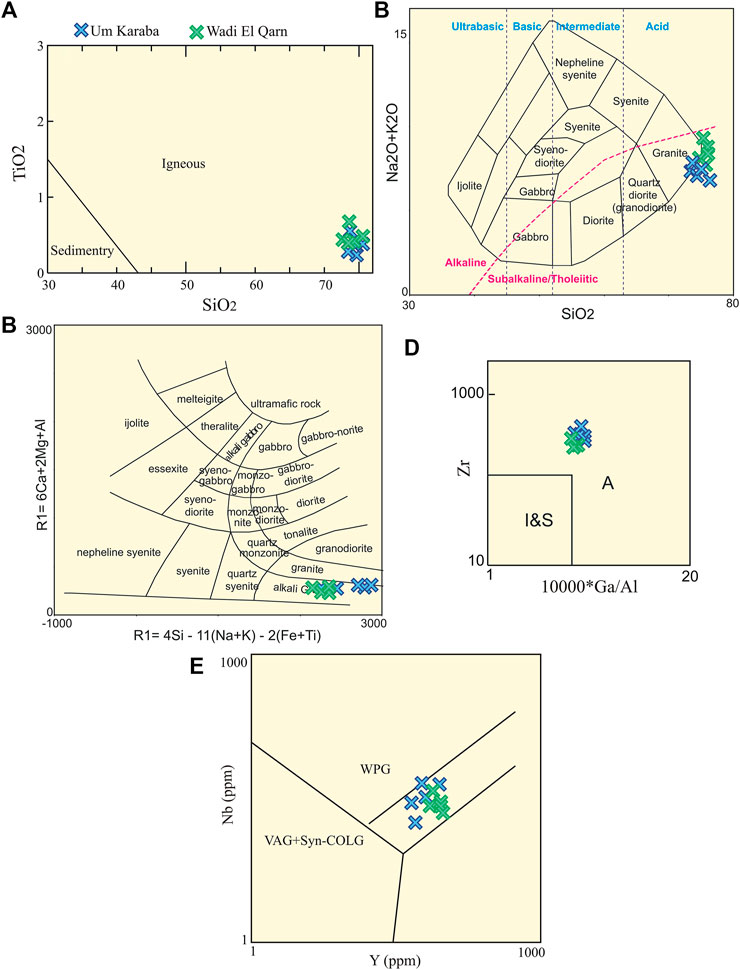
FIGURE 13. (A) SiO2 versus TiO2 variation diagram of Tarney (1977). Discrimination diagrams; (B) SiO2 vs., Na2O + K2O of Cox et al. (1979), (C) R1-R2 diagram of De la Roche et al. (1980), (D) 10,000*Ga/Al vs. Zr, and (E) Y against Nb diagram of Pearce et al. (1984).
7.4 Origin of Corundum
Corundum is commonly found in pegmatite either associated with margarite (marundite) or plagioclase (plumasite) (Bucher et al., 2005; Dill, 2015). Corundum-bearing pegmatites in the Hafafit area have both plumasite and marundite (Ahmed and Gharib, 2018). Corundum can be formed by magmatic as well as metasomatic/metamorphic processes (Peucat et al., 2007; Giuliani et al., 2014; Karmakar et al., 2017). Chromophores (e.g., Cr, Mg, V, Ga, Fe, and Ti) can be used as reliable for corundum origin (Peucat et al., 2007; Giuliani et al., 2014; Ahmed and Gharib, 2018).
The magmatic types can be distinguished by high Ga and low Cr contents with Cr2O3/Ga2O3 ratio less than one, whereas the metamorphic suites are characterized by high Cr and low Ga contents with Cr2O3/Ga2O3 ratio of more than 3 (Sutherland et al., 1998). The composition of the examined corundum has Cr2O3/Ga2O3 values ranging from 2.5 to 134, reflecting their metamorphic origin. In addition, the Ga/Mg ratio is used to differentiate between magmatic and metamorphic types. Magmatic corundum is defined by Ga/Mg more than six and less than three for metamorphic and metasomatic types (Giuliani et al., 2014), due to Ga substitute for Al and the Ga/Al ratio is constant in the continental crust (Peucat et al., 2007).
It is noticeable that the investigated corundum has Ga/Mg ratio ≤3, reflecting metamorphic/metasomatic sources (Figure 14A). Further constraints, Fe/Mg ratio is used to differentiate between magmatic and metamorphic corundum. This ratio is high for magmatic (>100) and low for metamorphic and metasomatic types (<100), (Peucat et al., 2007). The studied corundum has a composition that contains Fe/Mg less than 100, suggesting its metamorphic origin. Fe-Mg*100-Ti*10 diagram can be used to differentiate between metamorphic and magmatic corundum (Peucat et al., 2007). The investigated corundum has low Fe and Ti and high Mg contents, therefore it straddles metamorphic/metasomatic field (Figure 14B).
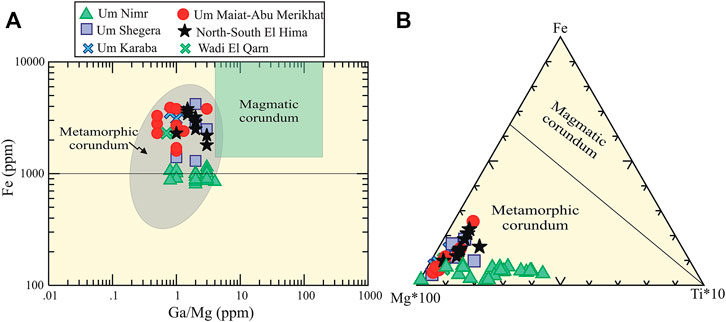
FIGURE 14. (A) Fe versus Ga/Mg (ppm) and (B) Mg-Fe-Ti (ppm) diagrams of the examined corundum. Fields of metamorphic and magmatic are obtained from Peucat et al. (2007).
Therefore, the examined corundum is originated through interaction processes between the intrusive pegmatite and the host rocks (ultramafics and gneiss). Desilication of these pegmatites led to an excess of alumina in the residual melt producing corundum mineralization. The studied corundum contains low Fe and high Mg contents as typical metamorphic corundum, which is indicated by Mg-Fe-Ti ternary diagram (Peucat et al., 2007). Figure 15 shows a simple schematic model that illustrates the metasomatic interaction between felsic magma (pegmatite) and ultramafic rocks and gneisses. The emplacement of pegmatite (silica and alumina rich) within ultramafic rocks (serpentinites/silica deficient rocks), the mineralized zone has been formed with new mineral associations in serpentinites. The newly formed minerals include actinolite, anthophyllite, and vermiculite. The residual melt becomes more Al-rich due to silica diffusion. Therefore, alumina-rich minerals have been formed such as corundum, hercynite, and almandine. On the other hand, the tourmaline-rich zone was formed at pegmatite and gneiss (containing B-rich fluids) contact. In addition, the small scale of corundum-bearing pegmatites within ultramafics rocks represent the main factor for preventing ruby (red corundum) due to less remobilization of Cr and Fe.
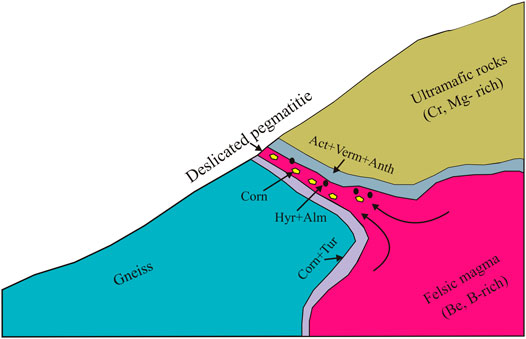
FIGURE 15. Schematic model showing the metasomatic interaction between felsic magma (pegmatite) and ultramafic rocks, from one hand, and gneiss with the other hand. The emplacement of pegmatite (silica and alumina rich) within ultramafic rocks (serpentinites/silica deficient rocks), the mineralized zone has been formed with new mineral associations in serpentinites. The newly formed minerals include actinolite (Act), anthophyllite (Anth), and vermiculite (Verm). The residual melt becomes more Al-rich due to silica diffusion. Therefore, alumina-rich minerals have been formed such as corundum (Corn), hercynite (Hyr), and almandine (Alm). On the other hand, the tourmaline-rich zone was formed at pegmatite and gneiss (containing B-rich fluids) contact.
8 Conclusion
The remotely sensed data were integrated with petrography, geochemical analyses, and comprehensive field investigation to detect and deduce the petrogenesis of corundum-bearing pegmatites in eight occurrences in the Migif-Hafafit area, Egypt. Different digital image processing algorithms and techniques were applied to map the corundum-bearing pegmatites and host rocks. The band ratio, principal component analysis, and constrained energy minimization techniques proved to be more significant and efficient for corundum-bearing pegmatites exploration. The field and microscopic investigations revealed that the host rocks are gneisses and ophiolitic ultramafic, which are represented by serpentinites with harzburgitic protolith. Moreover, the corundum is represented by elongated and fractured crystals of different sizes in the thin sections. The geochemical data revealed that the host rocks possess low Al2O3 (1.45–1.8 wt.%) and CaO (0.52–0.85 wt.%), as well as high concentration of Ni (1,125–2,154 ppm), Cr (1,478–2,987 ppm), and Co (75–110 ppm), reflecting depleted sources and forearc setting. Corundum is formed as a result of the intrusion of pegmatitic melt within ultramafics and gneiss rocks. Its chromophore such as Cr, Mg, Ga, Fe, and Ti can be used as reliable for corundum origin. They have Ga/Mg ratio ≤3, Cr2O3/Ga2O3 values ranging from 2.5 to 134, and Fe/Mg less than 100, suggesting metamorphic/metasomatic sources. This study concluded that the automated remote sensing mapping of corundum-bearing pegmatites and host rocks, which has been verified by fieldwork, petrography, and geochemical analyses, introduces a successful approach for identifying pegmatites and associated corundum mineralization in the study area. It is highly recommended to apply this approach to explore new potential occurrences of the corundum-bearing pegmatites in a similar geologic environment.
Data Availability Statement
The raw data supporting the conclusion of this article will be made available by the authors without undue reservation.
Author Contributions
FK, GS, EL, and SK are contributed in conceptualization, writing the draft manuscript, data processing, and software manipulation. AA assisted in methodology and funding acquisition. All authors have read and agreed to the published version of the manuscript.
Conflict of Interest
FK and GS were employed by the company Nuclear Materials Authority.
The remaining authors declare that the research was conducted in the absence of any commercial or financial relationships that could be construed as a potential conflict of interest.
Publisher’s Note
All claims expressed in this article are solely those of the authors and do not necessarily represent those of their affiliated organizations, or those of the publisher, the editors, and the reviewers. Any product that may be evaluated in this article, or claim that may be made by its manufacturer, is not guaranteed or endorsed by the publisher.
Acknowledgments
The authors sincerely thank D. R. Lentz, Department of Earth Sciences, University of New Brunswick, Fredericton, NB, Canada, for his help during the EPMA analysis. Also, the authors are deeply thankful to late M. E. Ibrahim, NMA, Cairo, Egypt, for his assistance in the fieldwork.
Supplementary Material
The Supplementary Material for this article can be found online at: https://www.frontiersin.org/articles/10.3389/feart.2022.869828/full#supplementary-material
References
Abd El-Wahed, M., Zoheir, B., Pour, A. B., and Kamh, S. (2021). Shear-Related Gold Ores in the Wadi Hodein Shear Belt, South Eastern Desert of Egypt: Analysis of Remote Sensing, Field and Structural Data. Minerals 11, 474. doi:10.3390/min11050474
Abduriyim, A., and Kitawaki, H. (2006). Determination of the Origin of Blue Sapphire Using Laser Ablation Inductively Coupled Plasma Mass Spectrometry. J. Gemmo. 30 (1/2), 23–36. doi:10.15506/jog.2006.30.1.23
Aboelkhair, H., Abdelhalim, A., Hamimi, Z., and Al-Gabali, M. (2020). Reliability of Using ASTER Data in Lithologic Mapping and Alteration mineral Detection of the Basement Complex of West Berenice, Southeastern Desert, Egypt. Arab J. Geosci. 13, 287. doi:10.1007/s12517-020-5227-x
Ahmed, A. H., and Gharib, M. E. (2018). Formation of Corundum and Associated mineral Zones in the Hybrid Ultramafic-Pegmatite Association of the Neoproterozoic Hafafit Core Complex, South-Eastern Desert, Egypt. Ore Geology. Rev. 96, 72–97. doi:10.1016/j.oregeorev.2018.04.008
Ali, A., and Pour, A. (2014). Lithological Mapping and Hydrothermal Alteration Using Landsat 8 Data: a Case Study in Ariab Mining District, Red Sea hills, Sudan. Int. J. Basic Appl. Sci. 3 (3), 199–208. doi:10.14419/ijbas.v3i3.2821
Asran, A. M., and Hassan, S. M. (2021). Remote Sensing-Based Geological Mapping and Petrogenesis of Wadi Khuda Precambrian Rocks, South Eastern Desert of Egypt with Emphasis on Leucogranite. Egypt. J. Remote Sensing Space Sci. 24, 15–27. doi:10.1016/j.ejrs.2019.07.004
Azer, M. K., and Stern, R. J. (2007). Neoproterozoic (835-720 Ma) Serpentinites in the Eastern Desert, Egypt: Fragments of Forearc Mantle. J. Geology. 115, 457–472. doi:10.1086/518052
Ben-Dor, E., Kruse, F. A., Lefkoff, A. B., and Banin, A. (1994). Comparison of Three Calibration Techniques for the Utilization of GER 63 Channel Scanner Data of Makhtesh Ramon, Negev, Israel. Photogramm. Eng. Remote Sens. 60, 1339–1354.
Berger, B. R., King, T. V. V., Morath, L. C., and Phillips, J. D. (2003). Utility of High-Altitude Infrared Spectral Data in Mineral Exploration: Application to Northern Patagonia Mountains, Arizona. Econ. Geol. 98 (5), 1003–1018. doi:10.2113/gsecongeo.98.5.1003
Bodinier, J. L., and Godard, M. (2003). “Orogenic, Ophiolitic, and Abyssal Peridotites,” in The Mantle and Core: Treatise on Geochemistry. Editor R. W. Carlson (Amsterdam, Netherlands: Elsevier), 103–170.
Brownlow, A. H., and Komorowski, J.-C. (1988). Geology and Origin of the Yogo Sapphire deposit, Montana. Econ. Geol. 83, 875–880. doi:10.2113/gsecongeo.83.4.875
Bucher, K., de Capitani, C., and Grapes, R. (2005). The Development of a Margarite Corundum Blackwall by Metasomatic Alteration of a Slice of Mica Schist in Ultramafic Rock, Kvesjoen, Norwegian Caledonides. Can. Mineral. 43, 129–156. doi:10.2113/gscanmin.43.1.129
Cardoso-Fernandes, J., Teodoro, A. C., Lima, A., Mielke, C., Korting, F., Roda-Robles, E., et al. (2020). “Multi-scale Approach Using Remote Sensing Techniques for Lithium Pegmatite Exploration: First Results,” in IEEE International Geoscience and Remote Sensing Symposium, 5226–5229. IGARSS 2020. doi:10.1109/IGARSS39084.2020.9323705
Cardoso-Fernandes, J., Teodoro, A. C., and Lima, A. (2019). Remote Sensing Data in Lithium (Li) Exploration: A New Approach for the Detection of Li-Bearing Pegmatites. Int. J. Appl. Earth Observation Geoinformation 76, 10–25. doi:10.1016/j.jag.2018.11.001
Chavez, P. S. (1996). Image-based Atmospheric Corrections - Revisited and Improved. Photogramm. Eng. Remote Sensing 62, 1025–1036.
Cheng, Q., Bonham-Carter, G., Wang, W., Zhang, S., Li, W., and Qinglin, X. (2011). A Spatially Weighted Principal Component Analysis for Multi-Element Geochemical Data for Mapping Locations of Felsic Intrusions in the Gejiu mineral District of Yunnan, China. Comput. Geosciences 37, 662–669. doi:10.1016/j.cageo.2010.11.001
Coenraads, R. R., Lin Sutherland, F., and Kinny, P. D. (1990). The Origin of Sapphires: U-Pb Dating of Zircon Inclusions Sheds New Light. Mineral. Mag. 54, 113–122. doi:10.1180/minmag.1990.054.374.13
Cox, K. G., Bell, J. D., and Pankhurst, R. J. (1979). The Interpretation of Igneous Rocks. London: George. Allen and Unwin, 450.
Crósta, A. P., De Souza Filho, C. R., Azevedo, F., and Brodie, C. (2003). Targeting Key Alteration Minerals in Epithermal Deposits in Patagonia, Argentina, Using ASTER Imagery and Principal Component Analysis. Int. J. Remote Sens. 24 (21), 4233–4240. doi:10.1080/0143116031000152291
De la Roche, H., Leterrier, J., Grandclaude, P., and Marchal, M. (1980). A Classification of Volcanic and Plutonic Rocks Using R 1 R 2 -diagram and Major-Element Analyses - its Relationships with Current Nomenclature. Chem. Geology. 29, 183–210. doi:10.1016/0009-2541(80)90020-0
Deschamps, F., Godard, M., Guillot, S., and Hattori, K. (2013). Geochemistry of Subduction Zone Serpentinites: A Review. Lithos 178, 96–127. doi:10.1016/j.lithos.2013.05.019
Dill, H. G. (2015). “The Hagendorf-Pleystein Province: the center of Pegmatites in an Ensialic Orogeny,” in Modern Appro. In Solid Earth Scie (Switzerland: Springer Inter. Publ.), 15, 475.
El Gaby, S., List, F. K., and Tehrani, R. (1990). “The Basement Complex of the Eastern Desert and Sinai,” in The Geology of Egypt. Editor S. Rushdi (Rotterdam: Balkema), 175–184.
El Mezayen, A. M., Heikal, M. A., El-Feky, M. G., Shahin, H. A., Abu Zeid, I. K., and Lasheen, E. S. R. (2018). Ultramafic Hosting Talc, Chromite and Uranium-Bearing Magnesite of Sol Hamed Ophiolites South Eastern Desert, Egypt; Petrology, Geochemistry and Tectonic Evolution. Ann. Geol. Surv. Egypt 35, 71–96.
El Mezayen, A. M., Heikal, M. A., El-Feky, M. G., Shahin, H. A., Abu Zeid, I. K., and Lasheen, S. R. (2019). Petrology, Geochemistry, Radioactivity, and M-W Type Rare Earth Element Tetrads of El Sela Altered Granites, South Eastern Desert, Egypt. Acta Geochim 38 (1), 95–119. doi:10.1007/s11631-018-0274-7
El Ramly, M. F., Greiling, R. O., Rashwan, A. A., and Rasmy, A. H. (1993). Explanatory Note to Accompany the Geological and Structural Maps of Wadi Hafafit Area, Eastern Desert of Egypt. Egypt: Geological Survey of Egypt. Paper No. 68.
El Ramly, M. F., and Greiling, R. (1988). Wadi Hafafit Area 1:100,000 Geological Map. Berlin: Technische Fachhochschule.
Feizi, F., Karbalaei-Ramezanali, A., and Tusi, H. (2017). Mineral Potential Mapping via TOPSIS with Hybrid AHP-Shannon Entropy Weighting of Evidence: A Case Study for Porphyry-Cu, Farmahin Area, Markazi Province, Iran. Nat. Resour. Res. 26 (4), 553–570. doi:10.1007/s11053-017-9338-3
Feizi, F., Mansouri, E., and Karbalaei Ramezanali, A. (2016). Prospecting of Au by Remote Sensing and Geochemical Data Processing Using Fractal Modelling in Shishe-Botagh, Area (NW Iran). J. Indian Soc. Remote Sens 44 (4), 539–552. doi:10.1007/s12524-015-0510-0
Gabr, S., Ghulam, A., and Kusky, T. (2010). Detecting Areas of High-Potential Gold Mineralization Using ASTER Data. Ore Geol. Rev. 38 (1–2), 59–69. doi:10.1016/j.oregeorev.2010.05.007
Gabr, S. S., Hassan, S. M., and Sadek, M. F. (2015). Prospecting for New Gold-Bearing Alteration Zones at El-Hoteib Area, South Eastern Desert, Egypt, Using Remote Sensing Data Analysis. Ore Geology. Rev. 71, 1–13. doi:10.1016/j.oregeorev.2015.04.021
Gamal El Dien, H., Hamdy, M., Abu El-Ela, A. S., Abu-Alam, T., Hassan, A., Kil, Y., et al. (2016). Neoproterozoic Serpentinites from the Eastern Desert of Egypt: Insights into Neoproterozoic Mantle Geodynamics and Processes beneath the Arabian-Nubian Shield. Precambrian Res. 286, 213–233. doi:10.1016/j.precamres.2016.10.006
Geng, H., Sun, M., Yuan, C., Zhao, G., and Xiao, W. (2011). Geochemical and Geochronological Study of Early Carboniferous Volcanic Rocks from the West Junggar: Petrogenesis and Tectonic Implications. J. Asian Earth Sci. 42, 854–866. doi:10.1016/j.jseaes.2011.01.006
Gharib, M. E. (1999). Mineralogical and Geochemical Studies of Some Pegmatite Occurrences in Rod Umm El Farag and Hafafit Areas, Eastern Desert Egypt (Egypt: Faculty of Science, Minia University), 316. Ph.D. thesis.
Giuliani, G., Ohnenstetter, D., Fallick, A. E., Groat, L., and Fagan, A. G. (2014). The Geology and Genesis of Gem Corundum Deposits, 44. Tucson AZ: Mineralogical Association of Canada Short Course, 29–112.
Green, A. A., Berman, M., Switzer, P., and Craig, M. D. (1988). A Transformation for Ordering Multispectral Data in Terms of Image Quality with Implications for Noise Removal. IEEE Trans. Geosci. Remote Sensing 26 (1), 65–74. doi:10.1109/36.3001
Guillong, M., and Günther, D. (2001). Quasi 'non-Destructive' Laser Ablation-Inductively Coupled Plasma-Mass Spectrometry Fingerprinting of Sapphires. Spectrochimica Acta B: At. Spectrosc. 56, 1219–1231. doi:10.1016/s0584-8547(01)00185-9
Hamimi, Z., Hagag, W., Kamh, S., and El-Araby, A. (2020). Application of Remote-Sensing Techniques in Geological and Structural Mapping of Atalla Shear Zone and Environs, Central Eastern Desert, Egypt. Arab J. Geosci. 13, 414. doi:10.1007/s12517-020-05324-8
Han, T., and Nelson, J. (2015). “Mapping Hydrothermally Altered Rocks with Landsat 8 Imagery: a Case Study in the KSM and Snow Field Zones, Northwestern British Columbia,”. British Columbia Geological Survey Paper (British Columbia Ministry of Energy and Mines), 103–112.
Harsanyi, J. C. (1993). Detection and Classification of Subpixel Spectral Signatures in Hyperspectral Image Sequences (Baltimore, MD: University of Maryland), 116. Unpublished Ph.D. Thesis.
Hassan, S. M., Soliman, O. S., and Mahmoud, A. S. (2015). Optimized Data Input for the Support Vector Machine Classifier Using ASTER Data. Case Study: Wadi Atalla Area, Eastern Desert, Egypt. Carpa. J. Earth Environ. Sci. 10 (1), 15–26.
Hattori, K. H., and Guillot, S. (2007). Geochemical Character of Serpentinites Associated with High- to Ultrahigh-Pressure Metamorphic Rocks in the Alps, Cuba, and the Himalayas: Recycling of Elements in Subduction Zones. Geochem. Geophys. Geosyst. 8, 9. doi:10.1029/2007gc001594
Hattori, K. H., Guillot, S., Saumur, B.-M., Tubrett, M. N., Vidal, O., and Morfin, S. (2010). Corundum-bearing Garnet Peridotite from Northern Dominican Republic: A Metamorphic Product of an Arc Cumulate in the Caribbean Subduction Zone. Lithos 114, 437–450. doi:10.1016/j.lithos.2009.10.010
Hunt, G. R. (1977). Spectral Signatures of Particulate Minerals in the Visible and Near Infrared. Geophysics 42, 501–513. doi:10.1190/1.1440721
Hutchinson, M. T., Nixon, P. H., and Harley, S. L. (2004). Corundum Inclusions in Diamonds-Discriminatory Criteria and a Corundum Composition Dataset. Lithos 77, 273–286. doi:10.1016/j.lithos.2004.04.006
Ishii, T., Robinson, P. T., Maekawa, H., and Fiske, R. (1992). “Petrological Studies of Peridotites from Diapiric Serpentinite Seamounts in the Izu-Ogasawara-Mariana Fore-Arc, LEG125,” in Proceedings of the Ocean Drilling Program: Scientific Results: Ocean Drilling Program. Editors P. Fryer, J. A. Pearce, and L. B. Stokking (College Station, TX, USA: Ocean Drilling Program), 125, 445–485. doi:10.2973/odp.proc.sr.125.129.1992
Karbalaei Ramezanali, A., Feizi, F., Jafarirad, A., and Lotfi, M. (2020a). Application of Best-Worst Method and Additive Ratio Assessment in mineral Prospectivity Mapping: A Case Study of Vein-type Copper Mineralization in the Kuhsiah-E-Urmak Area, Iran. Ore Geology. Rev. 117, 103268. doi:10.1016/j.oregeorev.2019.103268
Karbalaei Ramezanali, A., Feizi, F., Jafarirad, A., and Lotfi, M. (2020b). Geochemical Anomaly and mineral Prospectivity Mapping for Vein-type Copper Mineralization, Kuhsiah-E-Urmak Area, Iran: Application of Sequential Gaussian Simulation and Multivariate Regression Analysis. Nat. Resour. Res. 29 (1), 41–70. doi:10.1007/s11053-019-09565-7
Karmakar, S., Mukherjee, S., Sanyal, S., and Sengupta, P. (2017). Origin of Peraluminous Minerals (Corundum, Spinel, and Sapphirine) in a Highly Calcic Anorthosite from the Sittampundi Layered Complex, Tamil Nadu, India. Contrib. Mineral. Petrol. 172, 67. doi:10.1007/s00410-017-1383-8
Kodolányi, J., Pettke, T., Spandler, C., Kamber, B. S., and Gméling, K. (2012). Geochemistry of Ocean Floor and Fore-Arc Serpentinites: Constraints on the Ultramafic Input to Subduction Zones. J. Pertol. 53, 235–270. doi:10.1093/petrology/egr058
Lasheen, E. S. R., Rashwan, M. A., Osman, H., Alamri, S., Khandaker, M. U., and Hanfi, M. Y. (2021a). Radiological Hazard Evaluation of Some Egyptian Magmatic Rocks Used as Ornamental Stone: Petrography and Natural Radioactivity. Materials 14, 7290. doi:10.3390/ma14237290
Lasheen, E. S. R., Saleh, G. M., Khaleal, F. M., and Alwetaishi, M. (2021b). Petrogenesis of Neoproterozoic Ultramafic Rocks, Wadi Ibib-Wadi Shani, South Eastern Desert, Egypt: Constraints from Whole Rock and Mineral Chemistry. Appl. Sci. 11, 10524. doi:10.3390/app112210524
Li, X.-P., Rahn, M., and Bucher, K. (2004). Serpentinites of the Zermatt-Saas Ophiolite Complex and Their Texture Evolution. J. Metamorph. Geol. 22, 159–177. doi:10.1111/j.1525-1314.2004.00503.x
Li, Y.-H., and Schoonmaker, J. E. (2003). “Chemical Composition and Mineralogy of Marine Sediments,” in Treatise on Geochemistry. Editor F. T. Mackenzie (Elsevier Science Ltd.), 1–35. doi:10.1016/b0-08-043751-6/07088-2
Liang, S., and Wang, J. (2020). “Advanced Remote Sensing: Terrestrial Information Extraction and Applications,” in Chapter 4 - Atmospheric Correction of Optical Imagery. Second Edition (Elsevier), 131156. doi:10.1016/C2017-0-03489-4
Lin Sutherland, F., Hoskin, P. W. O., Fanning, C. M., and Coenraads, R. R. (1998). Models of Corundum Origin from Alkali Basaltic Terrains: a Reappraisal. Contrib. Mineralogy Petrol. 133, 356–372. doi:10.1007/s004100050458
Loughlin, W. P. (1991). Principal Components Analysis for Alteration Mapping. Photogramm. Eng. Rem. Sens. 57, 1163–1169.
Mahboob, M. A., Genc, B., Celik, T., Ali, S., and Atif, I. (2019). Mapping Hydrothermal Minerals Using Remotely Sensed Reflectance Spectroscopy Data from Landsat. J. South. Afr. Inst. Min. Metall. 119, 279–289. doi:10.17159/2411-9717/2019/v119n3a7
Mahmoud, S. A. E. A., and Ali, H. H. (2020). Geology and Genesis of Vein-type Corundum Deposits in the Hafafit-Nugrus Area, South Eastern Desert, Egypt. Geologos 26, 181–197. doi:10.2478/logos-2020-0018
McDonough, W. F., and Sun, S.-s. (1995). The Composition of the Earth. Chem. Geology. 120, 223–253. doi:10.1016/0009-2541(94)00140-4
Mohammad, A., El Kazzaz, Y., Hassan, S., and Taha, M. (2019). Neoproterozoic Tectonic Evolution and Exhumation History of Transpressional Shear Zones in the East African Orogen: Implications from Kinematic Analysis of Meatiq Area, Central Eastern Desert of Egypt. Int. J. Earth Sci. 109, 253–279. doi:10.1007/s00531-019-01801-y
Mohy, H., Basta, F., Saber, S., and El Sobky, A. (2017). Using Landsat 8 and ASTER Data for Lithological Discrimination and Mapping in Wadi Hamad Area, North Eastern Desert, Egypt. J. Amer. Sci. 13 (7), 1–13. doi:10.7537/marsjas130717.01
Niu, Y. (2004). Bulk-rock Major and Trace Element Compositions of Abyssal Peridotites: Implications for Mantle Melting, Melt Extraction and post-melting Processes beneath Mid-ocean Ridges. J. Petrol. 45, 2423–2458. doi:10.1093/petrology/egh068
Novak, I. D., and Soulakellis, N. (2000). Identifying Geomorphic Features Using LANDSAT-5/TM Data Processing Techniques on Lesvos, Greece. Geomorphology 34, 101–109. doi:10.1016/s0169-555x(00)00003-9
Nozaka, T. (2011). Constraints on Anthophyllite Formation in Thermally Metamorphosed Peridotites from Southwestern Japan. J. Metamorphic Geol. 29, 385–398. doi:10.1111/j.1525-1314.2010.00921.x
Paganelli, F., Grunsky, E. C., Richards, J. P., and Pryde, R. (2003). Use of RADARSAT-1 Principal Component Imagery for Structural Mapping: A Case Study in the Buffalo Head Hills Area, Northern central Alberta, Canada. Can. J. Remote Sensing 29, 111–140. doi:10.5589/m02-084
Palme, H., and O’Neill, H. (2004). “Cosmochemical Estimates of Mantle Composition,” in Treatise on Geochemistry. Editors H. D. Holland, and K. K. Turrekian (Amsterdam, Netherlands: Elsevier), 2, 1–38.
Pearce, J. A., Barker, P. F., Edwards, S. J., Parkinson, I. J., and Leat, P. T. (2000). Geochemistry and Tectonic Significance of Peridotites from the South Sandwich Arc-basin System, South Atlantic. Contrib. Mineralogy Petrol. 139, 36–53. doi:10.1007/s004100050572
Pearce, J. A., Harris, N. B. W., and Tindle, A. G. (1984). Trace Element Discrimination Diagrams for the Tectonic Interpretation of Granitic Rocks. J. Petrol. 25, 956–983. doi:10.1093/petrology/25.4.956
Peucat, J. J., Ruffault, P., Fritsch, E., Bouhnik-Le Coz, M., Simonet, C., and Lasnier, B. (2007). Ga/Mg Ratio as a New Geochemical Tool to Differentiate Magmatic from Metamorphic Blue Sapphires. Lithos 98, 261–274. doi:10.1016/j.lithos.2007.05.001
Pirajno, F. (2013). “Effects of Metasomatism on mineral Systems and Their Host Rocks: Alkali Metasomatism, Skarns, Greisens, Tourmalinites, Rodingites, Black-wall Alteration and Listvenites,” in Metasomatism and Metamorphism: The Role of Fluids in Crustal and Upper Mantle Processes. Lecture Series in Earth Science. Editors D. Harlov, and H. Austrheim (Springer), 203–251. doi:10.1007/978-3-642-28394-9_7
Pour, A. B., and Hashim, M. (2015). Hydrothermal Alteration Mapping from Landsat-8 Data, Sar Cheshmeh Copper Mining District, South-Eastern Islamic Republic of Iran. J. Taibah Univ. Sci. 9 (2), 155–166. doi:10.1016/j.jtusci.2014.11.008
Rankin, A. H., Greenwood, J., and Hargreaves, D. (2003). Chemical Fingerprinting of Some East African Gem Rubies by Laser Ablation ICP-MS. Journ of Gemm 28 (8), 473–482. doi:10.15506/jog.2003.28.8.473
Sabins, F. F. (1996). in Remote Sensing Principles and Interpretation. Editor W. H. Freeman. 3rd ed. (New York, NY: W.H. Freeman and Co.), 494. XII.
Saleh, G. M., Khaleal, F. M., and Lasheen, E. S. R. (2022). Geochemistry and Paleoweathering of Metasediments and Pyrite-Bearing Quartzite during the Neoproterozoic Era, Wadi Ibib-Wadi Suwawrib, South Eastern Desert, Egypt. Arab. J. Geosci. 15, 51. doi:10.1007/s12517-021-09141-5
Salters, V. J. M., and Stracke, A. (2004). Composition of the Depleted Mantle. Geochem. Geophy. Geosyst. 5, 1–27. doi:10.1029/2003gc000597
Serotta, A., and Carò, F. (2014). Evidence for the Use of Corundum Abrasive in Egypt from the Great Aten Temple at Amarna. Horizon 14, 2–4.
Shapiro, L., and Brannock, W. W. (1962). Rapid Analysis of Silicate, Carbonate and Phosphate Rocks. U.S. Geol. Surv. Bull. 114 A, 56.
Shor, R., and Weldon, R. (2009). Ruby and Sapphire Production and Distribution: A Quarter Century of Change. Gems & Gemology 45 (4), 236–259. doi:10.5741/gems.45.4.236
Simonet, C., Fritsch, E., and Lasnier, B. (2008). A Classification of Gem Corundum Deposits Aimed towards Gem Exploration. Ore Geology. Rev. 34, 127–133. doi:10.1016/j.oregeorev.2007.09.002
Sun, S.-s., and McDonough, W. F. (1989). Chemical and Isotopic Systematics of Oceanic Basalts: Implications for Mantle Composition and Processes. Geol. Soc. Lond. Spec. Publications 42, 313–345. doi:10.1144/gsl.sp.1989.042.01.19
Tarney, J. (1977). Petrology, Mineralogy and Geochemistry of the Falkland Plateau Basement Rocks, Site 300. Initial Report. Deep Sea Drilling Project 36, 893–921.
Taylor, S. R., and Mclennan, S. M. (1985). The continental Crust: Its Composition and Evolution. Oxford: Blackwell, 312.
Uysal, I., Ersoy, E. Y., Karslı, O., Dilek, Y., Sadıklar, M. Y., Ottley, C. J., et al. (2012). Coexistence of Abyssal and Ultra-depleted SSZ Type Mantle Peridotites in a Neo-Tethyan Ophiolite in SW Turkey: Constraints from mineral Composition, Whole-Rock Geochemistry (Major-Trace-REE-PGE) and Re-os Isotope Systematic. Lithos 60, 132–133. doi:10.1016/j.lithos.2011.11.009
Van der Meer, F. D., van der Werff, H. M. A., and van Ruitenbeek, F. J. A. (2014). Potential of ESA's Sentinel-2 for Geological Applications. Remote Sensing Environ. 148, 124–133. doi:10.1016/j.rse.2014.03.022
Watt, G. R., Harris, J. W., Harte, B., and Boyd, S. R. (1994). A High-Chromium Corundum (Ruby) Inclusion in diamond from the São Luiz Alluvial Mine, Brazil. Mineral. Mag. 58, 490–493. doi:10.1180/minmag.1994.058.392.16
Whalen, J. B., Currie, K. L., and Chappell, B. W. (1987). A-type Granites: Geochemical Characteristics, Discrimination and Petrogenesis. Contrib. Mineral. Petrol. 95, 407–419. doi:10.1007/bf00402202
Zhang, X., Pazner, M., and Duke, N. (2007). Lithologic and mineral Information Extraction for Gold Exploration Using ASTER Data in the South Chocolate Mountains (California). ISPRS J. Photogrammetry Remote Sensing 62, 271–282. doi:10.1016/j.isprsjprs.2007.04.004
Keywords: Hafafit, corundum, pegmatite, gneiss, remote sensing, South Eastern desert, Egypt
Citation: Khaleal FM, Saleh GM, Lasheen ESR, Alzahrani AM and Kamh SZ (2022) Exploration and Petrogenesis of Corundum-Bearing Pegmatites: A Case Study in Migif-Hafafit Area, Egypt. Front. Earth Sci. 10:869828. doi: 10.3389/feart.2022.869828
Received: 07 February 2022; Accepted: 25 February 2022;
Published: 30 March 2022.
Edited by:
Mohammad Parsa, University of New Brunswick Fredericton, CanadaReviewed by:
Mehrdad Daviran, Shahrood University of Technology, IranAmir Abbas Karbalaei Ramezanali, Islamic Azad University, Iran
Copyright © 2022 Khaleal, Saleh, Lasheen, Alzahrani and Kamh. This is an open-access article distributed under the terms of the Creative Commons Attribution License (CC BY). The use, distribution or reproduction in other forums is permitted, provided the original author(s) and the copyright owner(s) are credited and that the original publication in this journal is cited, in accordance with accepted academic practice. No use, distribution or reproduction is permitted which does not comply with these terms.
*Correspondence: Samir Z. Kamh, c2thbWhAc2NpZW5jZS50YW50YS5lZHUuZWc=