 Sergio Gammaldi
 Amir Ismail
 Aldo Zollo
94% of researchers rate our articles as excellent or good
Learn more about the work of our research integrity team to safeguard the quality of each article we publish.
Find out more
ORIGINAL RESEARCH article
Front. Earth Sci., 06 June 2022
Sec. Volcanology
Volume 10 - 2022 | https://doi.org/10.3389/feart.2022.866534
The imaging of volcanic systems is a challenging topic that attracts the scientific community’s attention. The characterization of structures and rock properties by means of seismic active methods is becoming fundamental for providing ultra-high-resolution images of the structures of interest. The Solfatara Volcano is a quiescent volcano in the Campi Flegrei resurgent nested caldera that is continuously under investigation and monitoring for its shallow activity, such as fumaroles. The purpose of this work is to characterize the fluid accumulation zone in the first 150 m depth in the middle of the crater, using several post-stack seismic attributes and Amplitude Versus Offset (AVO) analysis to characterize the contact between the CO2 and condensed water in the shallower accumulation zone. The two 400 m-long profiles to which we refer in this work have been acquired during the active Repeated InduCed Earthquakes and Noise experiment. The profiles were deployed along with the NNE-SSW and WNW-ESE directions across the whole surface of the crater including the main surface anomalies of the fumaroles, in the eastern area, and the mud-pool of Fangaia, located in the western area. The seismic pre-processing, pre-stack processing, and post-stack analysis previously applied on the NNE-SSW profile are here performed for the first time on the WNW-ESE profile, while partial-stack AVO analysis is performed for both profiles. The post-stack attributes including time gain, envelope, energy, and root mean square have been computed and extracted for determining the maximum and minimum values of amplitude zones on the migrated post-stack seismic profiles. Such anomalies are provided by complex and geometrical attributes embedding information on faults and chaotic zones. The AVO technique has also been used as a direct gas indicator to enhance fluid discrimination and identification. Finally, the analysis of the profile, seismic attributes, and near-surface structural interpretation related to the Solfatara Volcano has been incorporated into the proposed analysis. The multi-2D image depicts fluids trapped in the Solfatara Volcano at depths ranging from 10 to 50 m below the crater’s surface, as well as their migration paths up to 150 m deep: this evidenced contact between the fluids has been probably due to the solfataric alteration of the minerals, caused by the arising plume and the abovecondensed water which decreases the permeability of the rocks and forms an argillic phase working as cap-rock and trapping the gases. The application of the AVO analysis, coupled with the seismic attribute’s investigation, provides a very detailed multi-2D image of the shallower Solfatara Volcano, which outperforms in terms of accuracy the ones obtained with different tools in previous works, and that evidences the presence and the position of the liquid and the gases in the north-east area of the Solfatara Volcano.
Volcanic systems are characterized by complexities that do not often allow for directly exploring the medium, which is of crucial importance for monitoring purposes. Typically, the classical strategies adopted to investigate rock properties in depth by means of direct measurements, as carried out in the context of oil exploration, are not feasible. Among the seismic methodologies for rock property evaluation, seismic methods based on indirect measurements of the subsoil have been widely performed. Active seismic signals can be described using attributes related to their amplitude, energy, phase, etc. In the last few decades, the Amplitude Versus Offset (AVO) and the Amplitude Versus Angle (AVA, Aleardi, et al., 2018) analysis have also been employed as indirect methods for characterizing rock properties (Aleardi et al., 2015). More specifically, the AVO and the AVA have been used together with the classical direct tools for monitoring the oil environment (Wang and Morozov, 2020); the AVO analysis has also been successfully applied for the detection of deep volcanic reservoir hydrocarbon potential in a complex volcanic environment (Jiang-yun et al., 2018). In general, seismic exploration techniques are extremely valuable when jointly performed or interpreted with other geophysical methodologies applied to the volcano environment (Attias et al., 2020).
Here, some of the indirect seismic methods so far are applied to recover detailed information on the shallower structures underlying one of the most important and monitored volcanoes in southern Italy, namely, the Solfatara Volcano (SV) belonging to the Campi Flegrei caldera (CFc).
The CFc is one of the 12 worldwide calderas that reached a magnitude 7 of the Volcanic Explosivity Index (Calò and Tramelli, 2018) during the Campanian Ignimbrite eruption 37 ka ago; it is a resurgent, nested structure resulting from two major large collapses originated by the Campanian Ignimbrite and the Neapolitan Yellow Tuff (15 ka) eruptions (Orsi et al., 1996). Furthermore, the actual and past bradyseisms of 1982–1984 (Barberi et al., 1984) still represent the shallow evidence of the magmatic activity in the area. The CFc is located nearby Naples, the third most populated city in Italy (Demographia World Urban Areas, 2019), whose metropolitan area counts more than 3 million inhabitants (Demographia World Urban Areas). This location makes the CFc one of the highest-risk calderas in Europe (Kilburn et al., 2017).
The SV is a maar diatreme crater (Isaia et al., 2015) characterized by the shallow degassing activity of the fumaroles (Caliro et al., 2007). The crater has a diameter of 600 m with an average elevation of 180 m above sea level. The tuff cone was formed 3,815 ± 55 yr b.p, during the CFc’s third epoch of volcanic activity, as evidenced by stratigraphic and geochronological data (Di Vito et al., 1999).
The shallow structure of the Solfatara Volcano (see Figures 1, 2) has been characterized by several seismic and geophysical investigations (Festa et al., 2015; Amoroso et al., 2018). Furthermore, analyses concerning the SV rely on seismic and geophysical data collected during the Repeated InduCed Earthquakes and Noise (RICEN) experiment, performed in 2014 and part of the MEDiterranean SUpersites Volcanoes (MEDSUV) European project (Festa et al., 2015; Serra et al., 2016; Gammaldi et al., 2018). The MEDSUV project was aimed at providing innovative models of ground deformation and motion in the volcanic subsoil and at exploring its physical properties, relatable to the induced fluids and/or their migration from depth. A huge section of the project was dedicated to the use of active seismic surveys whose dataset has been processed employing active seismic methodologies based on seismic reflection exploration all around the Mediterranean area (Firetto Carlino et al., 2019). During the RICEN experiment, seismic datasets have been largely employed for the characterization of the Solfatara Volcano from which two 2D seismic profiles shown in Figure 1 were produced. Profile A lies along the WNW-ESE direction, while profile B has been acquired along the NNE-SSW direction. The former has been acquired on 21 May 2014, while the latter has been acquired on 11 November 2014.
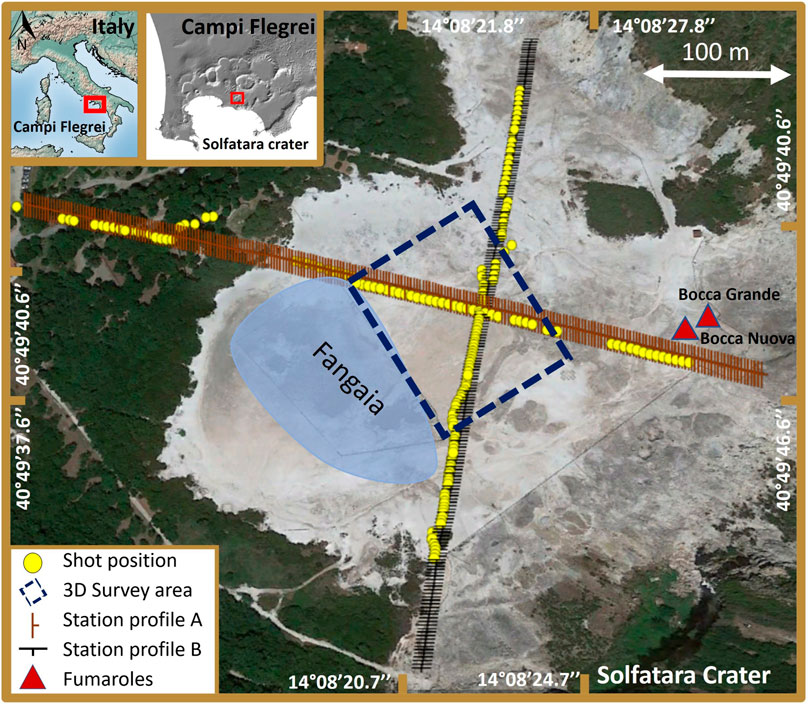
FIGURE 1. Solfatara Volcano location and RICEN experiment acquisition layout. In the embedded upper box we represent the position of the Campi Flegrei caldera (CFc) concerning Italy on the left side; the border of the two calderas and crater rims of the CFc is on the right side. In the main box, is the Solfatara Volcano with the arrays deployments, the Fangaia area, and the main fumaroles position. The symbol legend is in the lower box. The maps have been obtained with Google Earth.
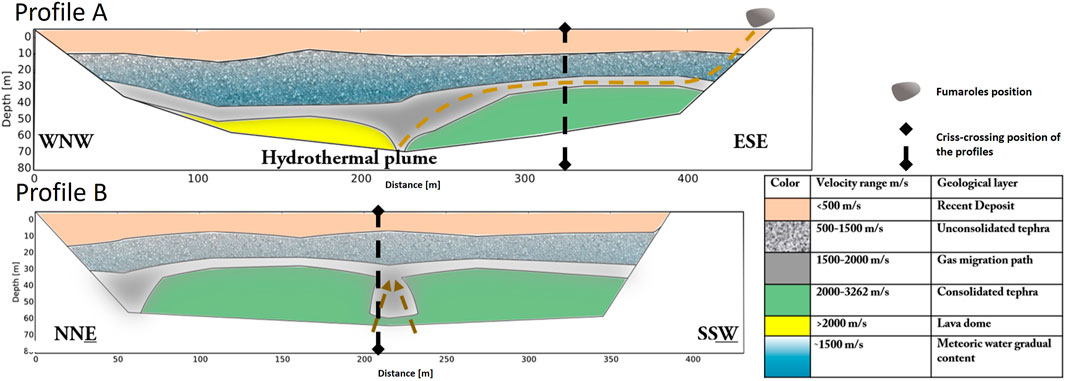
FIGURE 2. Cross-section Interpretation of the two Vp velocity models in Gammaldi et al. (2018): at the bottom WNW-ESE is the sketch relative to model (A), to the bottom the NNE-SSW sketch relative to the model (B). On the right side is the table of the geological interpretation of the velocity range. The distances are to concerning the first receivers shown in Figure 1.
The first multi-2D image provided by Gammaldi et al. (2018), performed on the two profiles, has been obtained by using refracted P-wave velocity tomographic images. From the cross-sections, it has been possible to detect for the first time the pathways of the gases between the hydrothermal plume and the fumaroles up to 80 m in depth.
In this work, we provide a multi-2D image starting from profiles A and B of the shallow accumulation fluids zone up to 150 m in depth; with respect to the one shown in Gammaldi et al. (2018), the novel multi-2D image is characterized by a higher resolution and it is obtained by means of a different processing methodology which is composed of the following steps:
- Application of seismic attributes, previously performed on profile B (Ismail et al., 2020a), on profile A
-Application of the AVO analysis on both profiles A and B
The results obtained via the two aforementioned analyses can be merged to provide a reasonable interpretation of the subsoil properties in terms of discrimination of the fluids’ status.
Before the RICEN experiment, different geophysical methods provided different datasets. The shallow images of the structure subsoil have been recovered by Bruno et al. (2017) by combining high-resolution geophysical and hydrogeological investigations, and performing 2D P-wave velocity and Electrical Resistivity Tomography (ERT) profiles. The Solfatara structure has been classified into two regions, namely an outcropping layer and an underlying fluid-saturated zone, where faults and fractures may act as preferential paths for upward hydrothermal fluid migration. Moreover, using ERT and mapping the resistivity changes, Byrdina et al. (2014) and Gresse et al. (2017) identified very shallow gas anomalies consisting of a double-plume structure, i.e., one liquid-dominated conductive plume below the Fangaia mud-pool (Figure 1), located in the western area of the SV, and the other gas-dominated plume below the Bocca Grande fumarole, located in the eastern area (Figure 1). The Bocca Grande and the Bocca Nuova (Figure 1), are persistent fumaroles at the intersection of the main NW-SE and NE-SW faults (Vitale and Isaia, 2014). These two fumaroles are approximately 25 m apart, and they have shown distinct temporal geochemical signatures over the past 15 years (Gresse et al., 2018). The most detailed geological section has been provided by Isaia et al. (2015), by combining the ERT investigations with the surface geological information. In their work, the authors characterized the subsurface structure of Solfatara as a formation composed of highly fractured rocks, breccias, and volcanic sediments, with the presence, at larger depths, of gas-saturated conduits linked to a deep magmatic source. Furthermore, the resistivity profiles reveal the anatomy of the fumarolic system of Bocca Grande and Bocca Nuova in the Solfatara Volcano (Gresse et al., 2018), both generated by the same hydrothermal plume. However, their exhalations are characterized by a different mix of gas and condensate flow, which explains the distinct geochemical composition measured at the fumaroles.
Based on the RICEN experiment, several seismic images were provided using different waves: Serra et al. (2016) analyzed the surface waves by exploring the very shallow (15 m) depth of the structures. Then, using the P-wave first arrival times, De Landro et al. (2017) provided the first evidence of a gas accumulation zone at approximately 30 m depth. Finally, Bruno et al. (2017) recovered the first seismic depth section down to 400 m depth with a focus on deeper fractures and faults of the crater. On the other hand, from the refraction tomography analysis, Gammaldi et al. (2018) provided a multi-2D image of the upper 80 m of the SV layers enhancing the pathway of the gases from the central part of the crater to the fumaroles. Recently, using seismic attributes methods applied to the Solfatara new evidence was provided by Ismail et al. (2020a): on the first 150 m depth, the seismic revealed the bright spot, the chaotic zone, and more fractures on the profile B with much more resolution on the shallower accumulation zone concerning the previously mentioned in Bruno et al. (2017), whose depth of investigation reached 500 m revealing the main deeper structures.
The seismic data processing workflow is divided into three major phases: the pre-processing phase outlined in Section 3.1, the pre-stack phase outlined in Section 3.2, and the post-stack processing phase detailed in Section 3.3. The latter phase includes the seismic attributes and the AVO analysis, described in Sections 3.3.1, 3.3.2, respectively. We recall that the three stages with the post-stack seismic attributes have been already performed on profile B in Ismail et al. (2020a), while here are applied on profile B (Figure 1) with the AVO analysis and profile A with both seismic attributes and AVO analysis.
The pre-processing phase (Ismail et al., 2020a, Figure 3) involves the preparation processes that are being used to sweep up both major and relatively minor issues in the raw data, such as the core processing flow (i.e., velocity analysis, frequency filtering, post-stack migration, etc). Even though the pre-processing processes appear to be common and even regular, each step is crucial to the final results (Zhou, 2014). The techniques that resulted in the final seismic image include a standard methodology, as shown in the workflow in Figure 3.
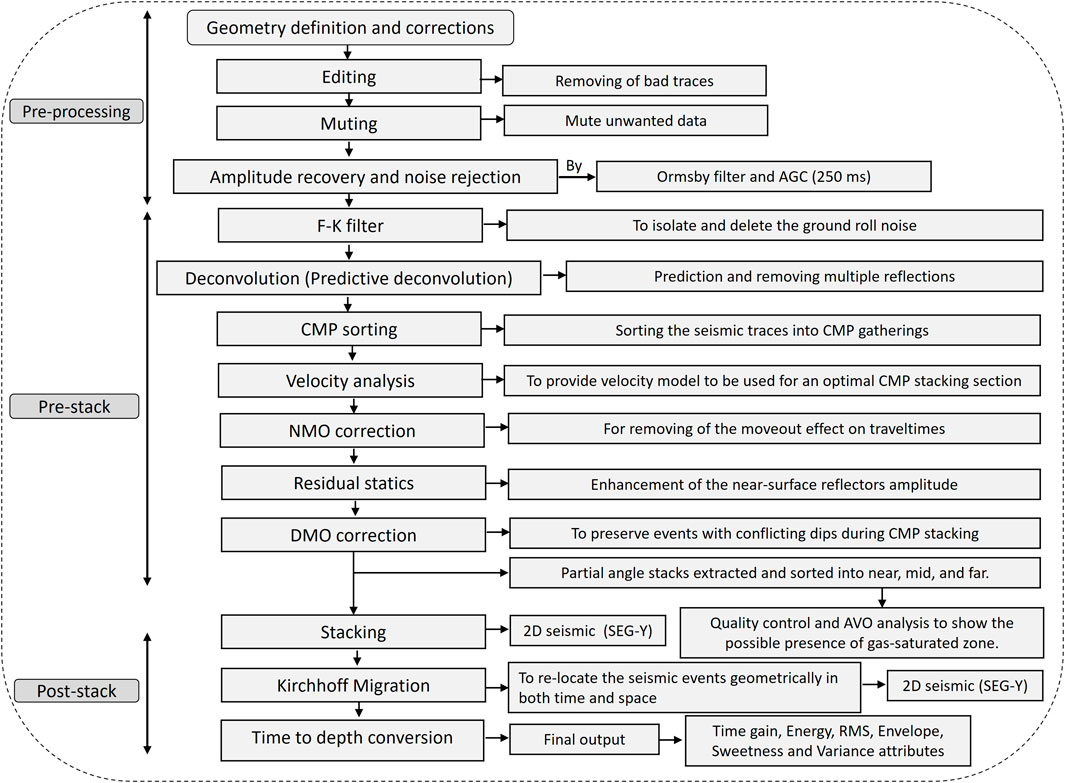
FIGURE 3. The data processing workflow used in this study shows the pre-processing, main processing, conventional, and unconventional seismic interpretation sequence (Ismail et al., 2020a).
Pre-processing steps include editing and muting, which were required to adapt the dataset to the main processing steps (Figure 3). During the pre-processing stage, the key challenge has been identifying the reflection phases, which are obscured by the very high amplitude of ground roll and very close in time to the refraction waves. By recovering the amplitude of the weaker reflection phases, Automatic Gain Control (AGC) scaling has solved the amplitude problem. In the L1 norm, a time gate of 250 ms was utilized for AGC scaling. The consistency and coherence of seismic reflectors have significantly improved the AGC output. Then, to reduce high- and low-frequency noise, the band-pass Ormsby filter was utilized.
The pre-stack stage is the core of the whole procedure (Figure 3); it starts converting the seismic data from the time to the frequency domain. Subsequently, the F-K filter is used to remove the ground roll noise that can be easily detected as it corresponds to the low frequencies in the filtered signal. According to Serra et al. (2016), the frequency-wavenumber spectrum has been analyzed to find a correlation between the frequency content and the velocity of ground roll phases. Then, the F-K filter was constructed to isolate and eliminate the ground roll phases. The reflected waves lost a high percentage of energy due to the diffraction, scattering, and absorption during the propagation. In particular, because of the complexity of the subsurface, the deeper reflectors from the two-way time (TWT) of 500 ms did not show any coherency in the semblance velocity analysis, therefore can not be picked through the Normal-Move-Out (NMO) correction. For all these reasons, just the first 500 ms of seismic data were used in the subsequent processing steps.
The arrival times to the receiver depend on the position of the source and their offset and on the velocity model, which is an unknown parameter. The evaluation of the velocity model is an inverse problem that can be solved using several methods. In this work, the NMO velocity method has been considered and the velocity spectrum has been computed to determine the stacking velocity of each reflector.
The main goal of the velocity analysis (Figure 4) is to provide a multi-1D (or pseudo-2D) velocity model (Figure 5) profile to be used for an optimal Common-Mid-Point (CMP) stacking section with the identification of all reflection events in the correct TWT positions which allows enhancing their amplitudes and signal-to-noise ratio in the stacking section. In Figure 5, the velocity model used for profile A obtained from the velocity analysis is shown. The velocity interval for the NMO analysis has been inferred from previous works (Gammaldi et al., 2018; Ismail et al., 2020a) and has been set to 200–2500 m/s (Supplementary Figure S1).
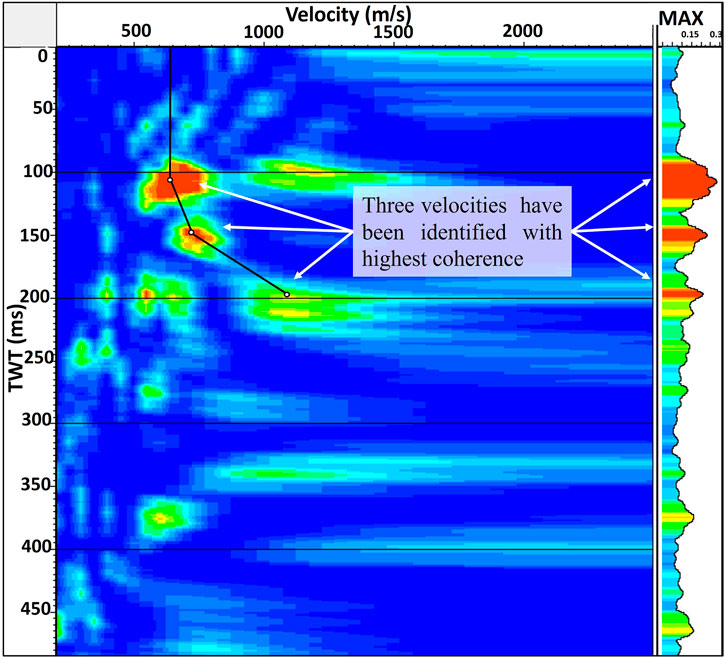
FIGURE 4. An example of three velocities picking for CMP gathers on a semblance plot with the maximum coherence values (red color).
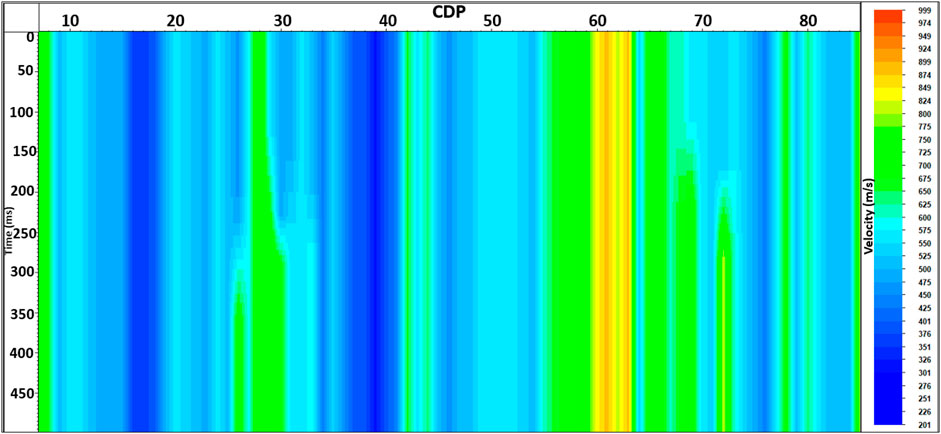
FIGURE 5. The final stacked velocity model of profile A after the picking of available CMP gathers on semblance plots.
The previous processing and comparison steps are needed to help us improve and test the semblance plot to provide a good estimation of the final stacking velocity model. This is the main reason behind the good quality of the obtained Common-Depth-Point (CDP) stacking that lets us identify clear horizons displaying the disrupted beds and faults related to collapsed sediments in the post-migration profiles.
The time shifts related to the source-receiver position at the surface are evaluated using a combination of cross-correlation technique and stack power optimization in residual static corrections. By measuring the time shifts between each trace within a CMP gather and a “pilot” trace, the selected times are then decomposed to solve for the source and receiver statics in a surface-consistent approach. The main objective of stack power enhancement is to highlight the effectiveness of a stacked trace along the traces in a CDP gather. For a given source and receiver location, a variety of time shifts are tested, and the one that generates the highest stack output is selected as a surface-consistent residual static value for that site.
Finally, to recover events with conflicting dips during CMP stacking, Dip-Moveout correction (DMO) is required to adjust the dip impact affecting stacking velocities (Yilmaz, 2001). After NMO correction, a dip-dependent partial migration is applied to nonzero offset seismic profiles to convert them from non-hyperbolic offsets to zero offsets. This shift from non-hyperbolic to hyperbolic (zero) offset results in enhanced velocity estimations and lateral resolution, as well as a few other useful side effects including coherence noise attenuation (Bruno et al., 2002). CMP stacking is composed of three stages: CMP binning, NMO correction, and NMO adjusted traces stacking (Zhou, 2014). The maximum offset covered in each CMP gather, which is the length of the active spread, is nearly equivalent to 100 m, which would be the determined maximum depth in the multi-2D image. An interface’s seismic identification refers to whether or not there is a reflection from the interface that can be detected in seismic data. This is a far more challenging task with seismic resolution since it involves many additional variables, some of which are poorly constrained and challenging to be analyzed (Magee et al., 2018).
Seismic migration is a technique for removing distortions from reflection records by relocating events to their proper spatial position and reducing the energy of scattering backward toward the dispersing spots (Schneider 1978; Bleistein 1987; Gray et al., 2001; Yilmaz, 2001). Post-stack Kirchhoff migration is used as the final processing step in the processing flowchart after relocating the seismic events geometrically in both time and space (Gray et al., 2001; Ismail et al., 2020a) and before interpreting all features in the seismic profile A.
The subsurface of the volcanic area is characterized by complex geology, such as faults and collapsed areas as already shown in the SV (Ismail et al., 2020a). The Kirchhoff migration approach was employed in both time and space. After resolving diffraction patterns, Kirchhoff migration shifts dipping reflectors correctly to their corrected and real subsurface position (Figure 6). Kirchhoff migration has many benefits over other approaches, including its flexibility and ability to manage lateral velocity fluctuations well.
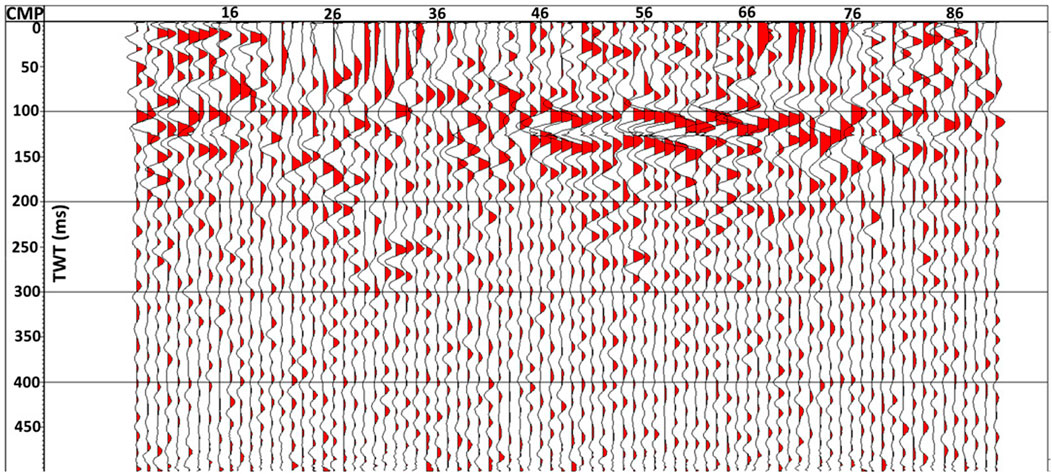
FIGURE 6. The post-stack seismic section after using Kirchhoff migration that was used for the spatial correction to relocate different geological features to their real position in time and space.
By converting the vertical axis of the stacked data from TWT to the depth domain via the use of the final stacking velocities image built during the CDP processing, the Time-Depth (T-D) conversion has indeed been crucial in obtaining the position of all features and faults beneath the surface in depth coordinate (Supplementary Figure S2).
The amplitude, frequency, geometry, and texture information in seismic data remains extraordinarily rich, and there is still plenty more that could be extracted (Eastwood, 2002). Therefore, several post-stack seismic attributes were recently extracted for the NNE-SSW 2D profile (Ismail et al., 2020a) that helped in the enhancement of the seismic profile imaging and interpretation as evidence of the existence of numerous characteristics such as bright anomalies, faults, chaotic zones, and uprising fluids pathways. These complex, geometrical, and physical attributes, which are derived via signal processing algorithms, can be utilized to evaluate the seismic profile quantitatively and qualitatively. In the present work the time gain, envelope, energy, and Root Mean Square (RMS) attributes (Figure 7) were extracted for both NNE-SSW and WNW-ESE profiles to display a detailed, enhanced, and full overview of the structural frame and fluids migration pathways.
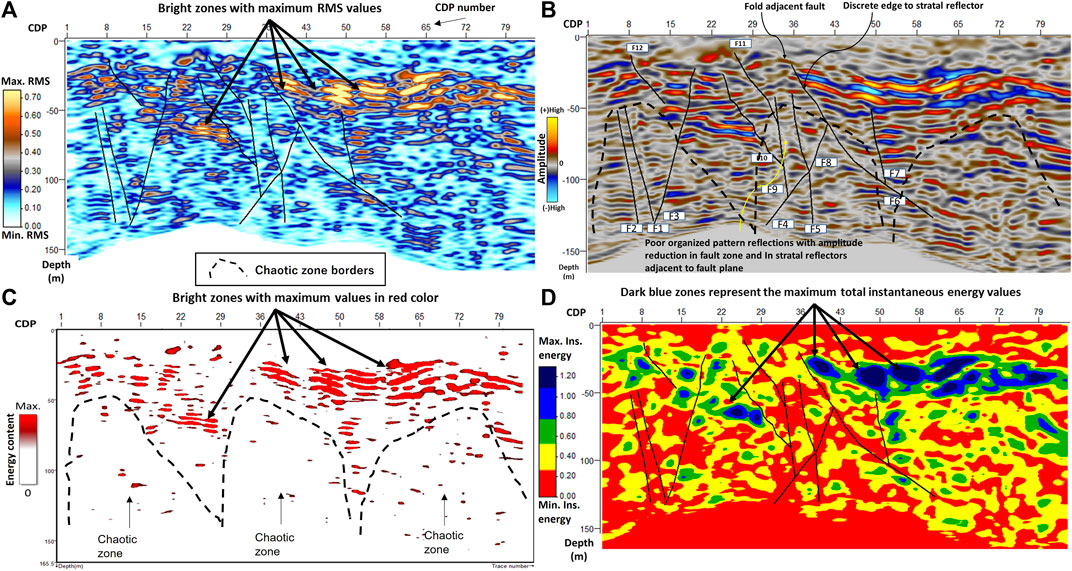
FIGURE 7. Seismic attributes performed at profile A: in section (A) the RMS values performed are shown and the bright zone is indicated by arrows while the black line follows fractures; in section (B) the time gain section is shown with the fracture named from F1 to F11; in the section, (C) the bright zones are evidenced using energy attributes; finally, in the (D) section the energy attributes show and confirm the fractures enhancing the total instantaneous energy values.
In particular, the RMS is one of the most well-known attributes; typically, it is calculated as the root mean square of the original seismic trace amplitude. RMS is an excellent fluid indicator that can distinguish between high and low amplitude (Ismail et al., 2020a; Ismail et al., 2020b), and chaotic zones on the seismic profile (Ismail et al., 2021). Mapping faults, major fault zones, and significant sequence boundaries are beneficial.
The envelope attribute generates the complex (real and imaginary) instantaneous energy of a complex trace, with the imaginary component estimated via the Hilbert transform (Taner et al., 1979). Since the envelope attribute is phase-independent, it is one of the ideal complex attributes for investigating amplitude anomalies (bright anomalies) and acoustic impedance contrast. High-envelope reflections are frequently linked to potential gas accumulation, and lithological and depositional environment alterations (Azeem et al., 2016; Ismail et al., 2021).
AVO analysis over partial stack is regarded as one of the most advanced approaches for properly identifying gas-saturated zones, helping to distinguish lithological contrast, gas-saturated zones, water-gas contacts, and bright events to provide a novel analysis of the results (Rutherford and Williams 1989; Russell et al., 2003; Ismail et al., 2020c). Furthermore, AVO analysis can assist the interpreter in confidently assuming the petrophysical interpretation of the target zone’s signal response. Angle-stack AVO inversion plays an essential role in the discovery of deep volcanic reservoirs, according to Jiang-yun et al. (2018). The elastic characteristics of volcanic may be comparable to those of certain carbonates (Klarner et al., 2006). AVO investigation, when combined with a sound geological background of current volcanism, provides whole additional information about the geological past (Stoppa, 2012). Near (0°–10°), mid (10°–20°), and far (20°–36°) partial angle stacks are extracted and classified. Two key phases are involved in partial-stack seismic data conditioning: time misalignment correction and amplitude balancing, as well as quality control of seismic trace parameters (phase, amplitude, and frequency) (Ross and Beale, 1994; Ismail et al., 2020b).
Furthermore, the intercept (A) and gradient (B) (Supplementary Figures S5, S6) are produced from the AVO angle gathering data by using Aki-Richard’s formula (Russell et al., 2003), which approximates the Zoeppritz equations (Zoeppritz, 1919). Smith and Gidlow (1987) used a reprojection of (A)/(B) to establish the fluid factor attribute to emphasize deviations from the fluid line that represent changes in fluid compressibility.
For an anisotropic porous medium, Poisson’s ratio can be described in terms of P-wave (Vp) and S-wave (Vs) velocities. As a nonlinear Vp/Vs function, Poisson’s ratio changes. Rocks with high Vp/Vs ratios also have high Poisson ratios. The Poisson ratio is one of the most reliable markers of gas-saturated zones’ occurrence. The AVO sum (A + B) exhibits a negative response at the reservoir’s top [reduction in Poisson ratio (σ)] and a positive response at the base, meanwhile the sum A + B is proportional to the change in Poisson ratio (Ross, 2002). To accomplish the sPr and change and create cross plots to categorize and identify gas zones, AVO evaluation is carried out by acquiring specified AVO attributes that include intercept (A) and gradient (B) (Castagna and Swan, 1997).
A more realistic solution is to cross plot the intercept and gradient for all time samples at all trace locations within a defined window. Deviation from this system can be an indication of gas and non-gas zones. Both intercept and gradient pairs move further away from the background trend with a significant reduction in fluid density, while the gas-saturated zone seems to be the most well-separated (Castagna and Swan, 1997).
In Section 4.1, we show the results of the post-stack obtained on profile A, while in Section 4.2, the results obtained by applying seismic attributes and AVO analysis are shown.
The processing steps and signal enhancement have been performed to generate the 2D velocity profile (Figure 5) used for NMO correction as the main processing step to produce the angle and full-stack profiles (Supplementary Figures S1, S2). Moreover, the generated velocity profile played a significant role in relocating the reflection events to their correct time and space by using the post-stack Kirchhoff migration and producing the final 2D TWT WNW-ESE seismic profile (profile A) (Figure 7) and profile B (Supplementary Figure S4). Then, time to depth conversion is performed to the final 2D profile by using the generated 2D velocity file to obtain a better geometrical representation for all seismic features including seismic horizons and faults (Figure 7B) where the profile extends around 400 m as a total distance and around 150 m as total depth. Several classes of post-stack seismic attributes (Figure 7) are extracted to delineate more information from the seismic profiles. The time gain attribute (Figure 7B) extracted for the 2D depth profile to improve the display, enhances the amplitude of deep horizons and gives a clear image of the structural frame in the profile which shows the near-surface layer from the surface to 50 m depth. Furthermore, the near-surface depth interval (0–50 m) shows horizons discontinuities in the profile, with most faults extending from the profile’s highest depth to the extensively deformed near-surface horizons, particularly between CMPs 22 and 42 (Figure 7).
The maximum values of amplitude are exhibited between 30 and 50 m in depth. Therefore, both profiles A and B show seismic reflections on the east side between 30-and 50 m. Hence, the WNW-ESE seismic profile (A) describes three main depth intervals: in the near-surface area at the depth range from 0 to 30 m bending reflectors with a damaged zone in the central part are shown; going deeper into the profiles, the depth ranges from 30 to 50 m where the area is characterized by the presence of bright anomalies (Figure 7B). Finally, at the depth range between 50 and 150 m, there are poorly organized reflections affected by discontinuities associated with more faults extending between CDP 20 and CDP 60 which play a significant role in the fluids uprising to the near-surface depths and are characterized by poorly organized pattern reflections with amplitude attenuation in the faulted zones.
The main target of using unconventional seismic techniques is to improve the imaging of different geo-bodies and features such as gas-bearing zones, bright spots, faults, and acoustic blanking in both WNW-ESE (Profile A) and NNE-SSW (Profile B) seismic profiles.
Seismic attributes analysis started by extracting different classes of post-stack seismic attributes such as time gain, envelope, RMS, and energy attributes to obtain the best results much more easily and quickly. Due to the abrupt change in reflectivity over the shallower part of the profiles, the detected bright anomalies in the original seismic profile are also characterized by RMS, high Energy, and envelope values (Figures 7A,C,D). Furthermore, in Figure 7C, the energy attribute displays and distinguishes the maximum amplitude values throughout a depth range of 20–50, with the maximum energy range depicted in red. Finally, we present poorly organized reflections impacted by discontinuities associated with more faults located between CDP 20 and CDP 60, as evaluated after extracting RMS, time gain, and envelope attributes at depths between 50 and 150 m (Figures 7A–C) which play a significant role in the fluids uprising to the near-surface depths.
AVO analysis provides more information from the pre-stack seismic dataset. It is used to produce a new vision for identifying gas zones, using pre-stack AVO attributes based on the sPr changes. AVO analysis is performed by obtaining specific AVO attributes, which include intercept (A) and gradient (B) (Supplementary Figure S3). This step lets us implement the sPr change (Figure 8) and generate cross plots to distinguish the gas-bearing zone. The performed cross plots of the intercept and gradient for all time samples throughout all trace positions within the same setting window provide a more precise solution (Supplementary Figures S4, S5). Cross plots discriminate between gas zones (white color) and background zone (red color). Therefore, the gas zone is separated and distinguished for profile B in Figure 8 at TWT range of 80–120 ms between CDPs 21 to 55 and in the central part of profile A between CDPs 45 to 75 and TWT range of 80–140 ms (Figure 8).
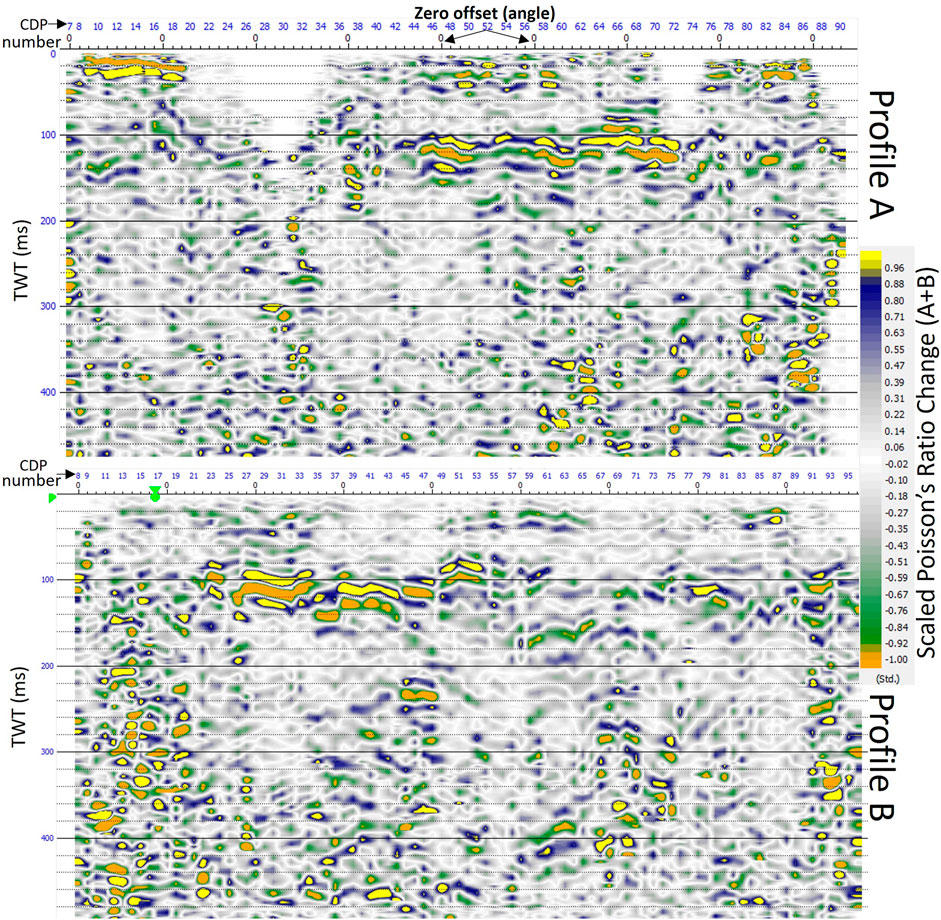
FIGURE 8. Scaled Poisson ratio changes for both profiles (A) and (B) as a direct gas indicator shows the gas-saturated zones in orange color.
The main goal of this article is to update and provide new results and joint unconventional interpretation of the SV by means of seismic attributes and, for the first time, the AVO attributes. The use of seismic reflection exploration and modern analysis for the study of volcanic structures has been growing progressively in recent years (Magee et al., 2013) not only for common hydrocarbon exploration but also in volcanic systems analysis (Tsuru and Fujie, 2006) and tectonic environment (Shillington et al., 2020).
Furthermore, several seismic reflection data processing and interpretations from local to regional scale were performed for the Solfatara Volcano (Bruno et al., 2002; Bruno et al., 2017), among which we mention recent machine learning algorithms designed to identify and evaluate the hydrothermal system (Bernardinetti and Bruno, 2019).
Compared to previous studies on the same dataset (Bruno et al., 2017), the seismic processing performed here is focused on highlighting the very shallow evidence (up to 150 m depth) of the contact between volcanic structures and uprising fluids using AVO analysis for the first time. In Figure 2 the interpretation obtained from a Vp tomography model using the same dataset of this work, but performed through refracted P-wave arrival times (Gammaldi et al., 2018), is provided. In particular, the two profiles show two relevant low-velocity anomalies, within a range of 1500–2000 m/s, interpreted as the possible gas pathway from the deeper part to the shallower area. The two anomalies appear to match with a fault that crosses profile B while it is parallel to profile A (Gammaldi et al., 2018). The interpretation focuses on the possible depth of the contact between the gas reservoir at 60 m depth and the condensate flow above, as highlighted in Gresse et al. (2018).
A focus on the very shallow structures of the SV was already performed using the seismic attributes on profile B by Ismail et al. (2020a) and here shown for profile A. The attributes, for both profiles A and B (Figure 7 and Supplementary Figures S4), highlight two important characteristics, namely the bright spots and the chaotic zones. In particular, the chaotic zones are dominant below the same bright spots and represent the possible pathways for the gas uprising. To characterize the shallower bright spots and eventually their link with the chaotic zone below, additional seismic tools are needed. By using for the first time the AVO analysis in the SV, this work can finally suggest a reasonable connection between the tomographic models (Gammaldi et al., 2018), the bright spots, and the chaotic zones. Looking at the two profiles in Figure 8; Supplementary Figure S7 it emerges that for profile A the most interesting contrast between the gas-dominated fluid (hereinafter GDF, orange Figure 8) and the liquid-dominated fluid (hereinafter LDF, yellow in Figure 8) is located between the 45th and 75th CDP, while on the profile B it arises between the 21st to the 55th CDP.
To achieve a final interpretation of the shallower structures and fluids interactions using all the images, several multi-2D views are performed.
Merging profiles A and B, the first multi-2D image obtained using 3DMove, in Figure 9A shows the seismic sections and the interpretation obtained by means of the seismic attributes (Supplementary Figure S4).
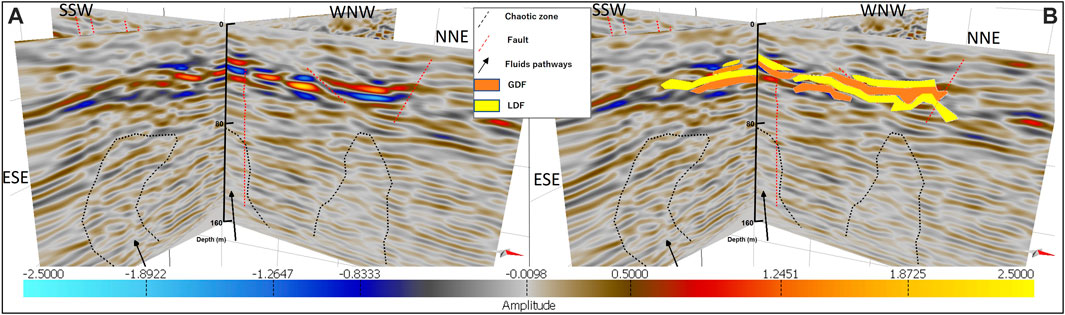
FIGURE 9. Seismic multi-2D interpretation in the depth domain for both profiles A and B shows the uprising fluid pathways (black arrows) and chaotic zones (dashed curves). (B) After adding both GDF and LDF zones to (A), view from the north-west sector.
To interpret the main bright spots and the structures, together with the AVO analysis, a prior multi-2D interpretation of the AVO section is needed (Supplementary Figure S7). According to the sPr shown in Figure 8, superimposed in Figure 9B, it is possible to note that the fluids accumulation zone is mostly located in the north-east area. Finally, the interpretation of the sPr, according to the electrical resistivity model beneath the fumarolic area in Gresse et al. (2018) and their interpretation of the gas reservoir (a mixture of CO2 and H2O) and condensate flow, shows the contact between the GDF and LDF in the first 50 m of the SV subsoil structure.
In the images, the structural evidence performed by seismic attributes in the depth domain is plotted as red dotted lines (interpreted as faults) and black dotted lines (interpreted as chaotic zones) (see Figures 9A,B). The time evidence of the fluids is now superimposed in Figure 9B in terms of continuities (GDF and LDF) with the black arrows pointing to the GDF and LDF continuities contact. The joint multi-2D image shows the results obtained from different analyses which merge at the precision of meters. Moreover, the low-velocity anomalies and the interpretation in Figure 2 of the water and gas-saturated layers are compatible with the faults and the GDF and LDF extracted in this work.
These anomalies, together with the previous research performed in the SV, strongly suggest that the faulted zone represents the pathway for the uprising gases coming from the hydrothermal plume in the Solfatara Volcano testified in the shallower images by the chaotic zones. Then, in the shallower area of about 40–50 m, the gases appear to be trapped. As shown in Figure 9B, the continuities are well enhanced by the AVO analysis because of the contrast between the liquids located in the area. In addition, in this zone, liquids have been already interpreted and are very well correlated with the Vp velocity by Gammaldi et al. (2018), shown in Figure 2, and the reflections displayed in Figure 9A for profile A and Ismail et al. (2020a).
The updated multi-2D image demonstrates that the fault structures here identified are probably working as a pathway for fluids from the deep hydrothermal plume to the surface. Meanwhile, for the first time, AVO analysis highlights and distinguishes the shallower interplay between gas and condensate flow in the north-east area of the crater. This contact probably causes a geochemical alteration in the shallow unconsolidated tephra (Figure 2). According to Mayer et al. (2016), the interaction shown in Figure 9 with a resolution of meters may be caused by the presence of the Alunite in the formation due to the hydrothermal alteration between GDF and the LDF. Therefore, the alunite represents the cap-rock where the fluids, from the deeper hydrothermal plume through the faults and the chaotic zones identified by the seismic, are trapped. It is reasonable to conclude that, over time, the continuous charging of the hydrothermal plume was able to form the cap-rock, which is constituted by the alunite, using the hydrothermal alteration of superficial rocks between the condensate flow and the uprising gases.
In this work, we aimed at achieving the higher resolution possible in the shallower crater of the Solfatara Volcano using seismic tools.
For the first time, the seismic attributes, previously provided in Ismail et al. (2020a) for profile B, are provided for profile A and in particular, AVO analysis is performed for the first time. These tools are fundamental to confirm the gas pathway, highlighted in Gammaldi et al. (2018) in the shallower area, and provide a new deeper image of the shallow structures up to 150 m, and fluids contact in the first 50 m depth. The updated multi-2D image is performed by means of different seismic tools providing from a high-resolution (Figure 2) to an ultra-high-resolution (Figure 9) image, merging different seismic analyses of the crater.
The multi-2D image was obtained starting from the tomographic models proposed by Gammaldi et al. (2018) in Figure 2, the seismic attributes were performed in depth (Figure 9), and then, the AVO analysis in time (Figure 8) finally merged in Figure 9B and visible in the video is provided in the supplementary material. In Figure 9, the updated multi-2D final interpretation highlights are provided. The faulted, chaotic, and fluid-dominated zones detected at depth are shown in Figure 9B by using three different seismic tools performed by Gammaldi et al. (2018) and Ismail et al. (2020a, 2020b).
In addition, we were able to use the time results of the AVO analysis for the interpretation in depth. Here these tools are performed for the first time to characterize the fluids in the shallower area of the crater. The results improve the details in the characterization through a joint interpretation and provide new insights into the shallower accumulation zone between the gas accumulation zone and the condensate flow in the SV. The final interpretation and results show a very detailed image of the structures and fluids interplay in the first 150 m of the crater, revealing contacts between gas and condensate flow interpreted in Figure 9B as GDF and LDF in the first 50 m, especially in the north-east area of the crater. The multi-2D image shows the great feasibility that such seismic methodology can perform with high resolution to extract accurate information. This work achieved a new challenge for the characterization of the Solfatara Volcano and similar systems or scales, using seismic attributes and in particular, AVO analysis which is difficult to perform in such complex systems. Finally, we remark that the workflow presented here is not restricted to the specific volcanic structure considered but it can be applied to similar scenarios for monitoring purposes.
The raw data supporting the conclusion of this article will be made available by the authors, without undue reservation.
SG and AI performed the processing and imaging and wrote the manuscript. AZ helped in the writing and editing the procedure of the processing.
AI was funded by a full scholarship (mission 2020/2021) from the Ministry of Higher Education of Egypt at the RISSC-Lab of the Department of Physics (University of Naples Federico II).
The authors declare that the research was conducted in the absence of any commercial or financial relationships that could be construed as a potential conflict of interest.
All claims expressed in this article are solely those of the authors and do not necessarily represent those of their affiliated organizations or those of the publisher, the editors, and the reviewers. Any product that may be evaluated in this article, or claim that may be made by its manufacturer, is not guaranteed or endorsed by the publisher.
The authors thank all the members of the RISSC-Lab of the Department of Physics (University of Naples Federico II) who have taken part in the RICEN experiment.
The Supplementary Material for this article can be found online at: https://www.frontiersin.org/articles/10.3389/feart.2022.866534/full#supplementary-material
Aleardi, M., Ciabarri, F., and Mazzotti, A. (2018). Estimation of Reservoir Properties from Seismic Data through a Markov Chain Monte Carlo-AVA Inversion Algorithm. Explor. Geophys. 49 (5), 688–703. doi:10.1071/EG17077
Aleardi, M., Mazzotti, A., Tognarelli, A., Ciuffi, S., and Casini, M. (2015). Seismic and Well Log Characterization of Fractures for Geothermal Exploration in Hard Rocks. Geophys. J. Int. 203 (1), 270–283. doi:10.1093/gji/ggv286
Amoroso, O., Festa, G., Bruno, P. P., D'Auria, L., De Landro, G., Di Fiore, V., et al. (2018). Integrated Tomographic Methods for Seismic Imaging and Monitoring of Volcanic Caldera Structures and Geothermal Areas. J. Appl. Geophys. 156, 16–30. doi:10.1016/j.jappgeo.2017.11.012
Attias, E., Thomas, D., Sherman, D., Ismail, K., and Constable, S. (2020). Marine Electrical Imaging Reveals Novel Freshwater Transport Mechanism in Hawai'i. Sci. Adv. 6, 48. doi:10.1126/sciadv.abd4866
Azeem, T., Yanchun, W., Khalid, P., Xueqing, L., Yuan, F., and Lifang, C. (2016). An Application of Seismic Attributes Analysis for Mapping of Gas Bearing Sand Zones in the Sawan Gas Field, Pakistan. Acta Geod. Geophys 51 (4), 723–744. doi:10.1007/s40328-015-0155-z
Barberi, F., Corrado, G., Innocenti, F., and Luongo, G. (1984). Phlegraean Fields 1982-1984: Brief Chronicle of a Volcano Emergency in a Densely Populated Area. Bull. Volcanol. 47, 175–185. doi:10.1007/bf01961547
Bernardinetti, S., and Bruno, P. P. G. (2019). The Hydrothermal System of Solfatara Crater (Campi Flegrei, Italy) Inferred from Machine Learning Algorithms. Front. Earth Sci. 7, 286. doi:10.3389/feart.2019.00286
Bruno, P. P. G., Di Fiore, V., and Rapolla, A. (2002). Seismic Reflection Data Processing in Active Volcanic Areas: an Application to Campi Flegrei and Somma Vesuvius Offshore (Southern Italy). Ann. Geophys. 45, 6
Bruno, P. P. G., Maraio, S., and Festa, G. (2017). The Shallow Structure of Solfatara Volcano, Italy, Revealed by Dense, Wide-Aperture Seismic Profiling. Sci. Rep. 7, 17386. doi:10.1038/s41598-017-17589-3
Byrdina, S., Vandemeulebrouck, J., Cardellini, C., Legaz, A., Camerlynck, C., Chiodini, G., et al. (2014). Relations between Electrical Resistivity, Carbon Dioxide Flux, and Self-Potential in the Shallow Hydrothermal System of Solfatara (Phlegrean Fields, Italy). J. Volcanol. Geotherm. Res. 283, 172–182. doi:10.1016/j.jvolgeores.2014.07.010
Caliro, S., Chiodini, G., Moretti, R., Avino, R., Granieri, D., Russo, M., et al. (2007). The Origin of the Fumaroles of La Solfatara (Campi Flegrei, South Italy). Geochimica Cosmochimica Acta 71, 3040–3055. doi:10.1016/j.gca.2007.04.007
Calò, M., and Tramelli, A. (2018). Anatomy of the Campi Flegrei Caldera Using Enhanced Seismic Tomography Models. Sci. Rep. 8, 16254. doi:10.1038/s41598-018-34456-x
Castagna, J. P., and Swan, H. W. (1997). Principles of AVO Crossplotting. Lead. edge 16 (4), 337–344. doi:10.1190/1.1437626
De Landro, G., Serlenga, V., Russo, G., Amoroso, O., Festa, G., Bruno, P. P., et al. (2017). 3D Ultra-High Resolution Seismic Imaging of Shallow Solfatara Crater in Campi Flegrei (Italy): New Insights on Deep Hydrothermal Fluid Circulation Processes. Sci. Rep. 7, 3412. doi:10.1038/s41598-017-03604-0
Demographia World Urban Areas. (2019). Available at: https://web.archive.org/web/20190509050843/http://www.demographia.com/db-worldua.pdf.15th Annual Edition.
Di Vito, M. A., Isaia, R., Orsi, G., Southon, J. D., De Vita, S., d'Antonio, M., et al. (1999). Volcanism and Deformation since 12,000 Years at the Campi Flegrei Caldera (Italy). J. Volcanol. Geotherm. Res. 91 (2-4), 221–246. doi:10.1016/s0377-0273(99)00037-2
Festa, G., Serra, M., Amoroso, O., Bruno, P. P., Pilz, M., Roux, P., et al. (2015). RICEN: Repeated InduCed Earthquakes and Noise @Solfatara, Campi Flegrei. San Francisco, CA: AGU Fall Meeting.
Firetto Carlino, M., Cavallaro, D., Coltelli, M., Cocchi, L., Zgur, F., and Patanè, D. (2019). Time and Space Scattered Volcanism of Mt. Etna Driven by Strike-Slip Tectonics. Sci. Rep. 9, 12125. doi:10.1038/s41598-019-48550-1
Gammaldi, S., Amoroso, O., D'Auria, L., and Zollo, A. (2018). High Resolution, multi-2D Seismic Imaging of Solfatara Crater (Campi Flegrei Caldera, Southern Italy) from Active Seismic Data. J. Volcanol. Geotherm. Res. 357, 177–185. doi:10.1016/j.jvolgeores.2018.03.025
Gray, S. H., Etgen, J., Dellinger, J., and Whitmore, D. (2001). Seismic Migration Problems and Solutions. Geophysics 66 (5), 1622–1640. doi:10.1190/1.1487107
Gresse, M., Vandemeulebrouck, J., Byrdina, S., Chiodini, G., Revil, A., Johnson, T. C., Ricci, T., Vilardo, G., Mangiacapra, A., Lebourg, T., Grangeon, J., Bascou, P., and Metral, L. (2017). Three-dimensional Electrical Resistivity Tomography of the Solfatara Crater (Italy): Implication for the Multiphase Flow Structure of the Shallow Hydrothermal System. J. Geophys. Res. Solid Earth 122, 8749–8768. doi:10.1002/2017jb014389
Gresse, M., Vandemeulebrouck, J., Byrdina, S., Chiodini, G., Roux, P., Rinaldi, A. P., et al. (2018). Anatomy of a Fumarolic System Inferred from a Multiphysics Approach. Sci. Rep. 8, 7580. doi:10.1038/s41598-018-25448-y
Isaia, R., Vitale, S., Di Giuseppe, M. G., Iannuzzi, E., D’Assisi Tramparulo, F., and Troiano, A. (2015). Stratigraphy, Structure, and Volcano-Tectonic Evolution of Solfatara Maar-Diatreme (Campi Flegrei, Italy). Geol. Soc. Am. Bull. 127, 1485–1504. doi:10.1130/b31183.1
Ismail, A., Ewida, H. F., Al-Ibiary, M. G., Gammaldi, S., and Zollo, A. (2020c). Identification of Gas Zones and Chimneys Using Seismic Attributes Analysis at the Scarab Field, Offshore, Nile Delta, Egypt. Pet. Res 5 1, 59–69. doi:10.1016/j.ptlrs.2019.09.002
Ismail, A., Ewida, H. F., Al-Ibiary, M. G., Nazeri, S., Salama, N. S., Gammaldi, S., et al. (2021). The Detection of Deep Seafloor Pockmarks, Gas Chimneys, and Associated Features with Seafloor Seeps Using Seismic Attributes in the West Offshore Nile Delta, Egypt. Explor. Geophys. 52 (4), 388–408. doi:10.1080/08123985.2020.1827229
Ismail, A., Ewida, H. F., Al-Ibiary, M. G., and Zollo, A. (2020b). Application of AVO Attributes for Gas Channels Identification, West Offshore Nile Delta, Egypt. Petroleum Res. 5 (2), 112–123. doi:10.1016/j.ptlrs.2020.01.003
Ismail, A., Gammaldi, S., Chiuso, T., and Zollo, A. (2020a). Seismic Imaging of the Solfatara Crater (Campi Flegrei Caldera, Southern Italy): New Evidence of the Fluids Migration Pathways in the Shallow Structures. J. Volcanol. Geotherm. Res. 404, 107005. doi:10.1016/j.jvolgeores.2020.107005
Jiang-yun, P., Jia-yi, W., and Yi, B. (2018). “December. Application of Prestack AVO Analysis Technique in Volcanic Reservoir Hydrocarbon Detection,” in International Geophysical Conference (Beijing, China: Society of Exploration Geophysicists and Chinese Petroleum Society), 241023.
Kilburn, C. R. J., De Natale, G., and Carlino, S. (2017). Progressive Approach to Eruption at Campi Flegrei Caldera in Southern Italy. Nat. Commun. 8, 15312. doi:10.1038/ncomms15312
Klarner, S., Culpan, R., Fontana, R., and Bankhead, B. (2006). “June. Identification of Upper Cretaceous Volcanics Using AVO Attributes; Santos Basin, Brazil,” in 68th EAGE Conference and Exhibition Incorporating SPE EUROPEC 2006 (European Association of Geoscientists & Engineers).
Magee, C., Hunt-Stewart, E., and Jackson, C. A.-L. (2013). Volcano Growth Mechanisms and the Role of Sub-volcanic Intrusions: Insights from 2D Seismic Reflection Data. Earth Planet. Sci. Lett. 373, 41–53. doi:10.1016/j.epsl.2013.04.041
Magee, C., Stevenson, C. T. E., Ebmeier, S. K., Keir, D., Hammond, J. O. S., Gottsmann, J. H., et al. (2018). Magma Plumbing Systems: a Geophysical Perspective. J. Petrology 59 (6), 1217–1251. doi:10.1093/petrology/egy064
Mayer, K., Scheu, B., Montanaro, C., Yilmaz, T. I., Isaia, R., Aßbichler, D., et al. (2016). Hydrothermal Alteration of Surficial Rocks at Solfatara (Campi Flegrei): Petrophysical Properties and Implications for Phreatic Eruption Processes. J. Volcanol. Geotherm. Res. 320, 128–143. doi:10.1016/j.jvolgeores.2016.04.020
Orsi, G., de Vita, S., and Di Vito, M. (1996). The Restless, Resurgent Campi Flegrei Nested Caldera (Italy): Constraints on its Evolution and Configuration. J. Volcanol. Geotherm. Res. 74, 179–214. doi:10.1016/s0377-0273(96)00063-7
Ross, C. P., and Beale, P. L. (1994). Seismic Offset Balancing. Geophysics 59 (1), 93–101. doi:10.1190/1.1443538
Russell, B. H., Hedlin, K., Hilterman, F. J., and Lines, L. R. (2003). Fluid‐property Discrimination with AVO: A Biot‐Gassmann Perspective. Geophysics 68 (1), 29–39. doi:10.1190/1.1543192
Rutherford, S. R., and Williams, R. H. (1989). Amplitude‐versus‐offset Variations in Gas Sands. Geophysics 54 (6), 680–688. doi:10.1190/1.1442696
Schneider, W. A. (1978). Integral Formulation for Migration in Two and Three Dimensions. Geophysics 43, 49–76. doi:10.1190/1.1440828
Serra, M., Festa, G., Roux, P., Gresse, M., Vandemeulebrouck, J., and Zollo, A. (2016). A Strongly Heterogeneous Hydrothermal Area Imaged by Surface Waves: the Case of Solfatara, Campi Flegrei, Italy. Geophys. J. Int. 205, 1813–1822. doi:10.1093/gji/ggw119
Shillington, D. J., Scholz, C. A., Chindandali, P. R. N., Gaherty, J. B., Accardo, N. J., Onyango, E., et al. (2020). Controls on Rift Faulting in the North Basin of the Malawi (Nyasa) Rift, East Africa. Tectonics 39, e2019TC005633. doi:10.1029/2019TC005633
Smith, G. C., and Gidlow, P. M. (1987). Weighted Stacking for Rock Property Estimation and Detection of Gas*. Geophys Prospect 35 (9), 993–1014. doi:10.1111/j.1365-2478.1987.tb00856.x
Stoppa, F. (2012). Updates in Volcanology-A Comprehensive Approach to Volcanological Problems [Internet] (London: IntechOpen). 258. Available at: https://www.intechopen.com/books/409
Taner, M. T., Koehler, F., and Sheriff, R. E. (1979). Complex Seismic Trace Analysis. Geophysics 44 (6), 1041.
Tsuru, T., and Fujie, G. (2006). Reflective Body Observed by Multi-Channel Reflection Survey off Niijima and Kozushima, Japan. JAMSTEC Rep. Res. Dev. 3, 53–60. doi:10.5918/jamstecr.3.53
Vitale, S., and Isaia, R. (2014). Fractures and Faults in Volcanic Rocks (Campi Flegrei, Southern Italy): Insight into Volcano-Tectonic Processes. Int J Earth Sci (Geol Rundsch) 103, 801–819. doi:10.1007/s00531-013-0979-0
Wang, Y., and Morozov, I. B. (2020). Time-lapse Acoustic Impedance Variations during CO2 Injection in Weyburn Oilfield, Canada. Geophysics 85 (1), M1–M13. doi:10.1190/geo2019-0221.1
Yilmaz, Ö. (2001). Seismic Data Analysis: Processing, Inversion, and Interpretation of Seismic Data. Society of exploration geophysicists.
Keywords: seismic imaging, gas identification, processing and interpretation method, volcano imaging, active seismic, multi-imaging study, AVO (amplitude variation with offset) attribute
Citation: Gammaldi S, Ismail A and Zollo A (2022) Fluid Accumulation Zone by Seismic Attributes and Amplitude Versus Offset Analysis at Solfatara Volcano, Campi Flegrei, Italy. Front. Earth Sci. 10:866534. doi: 10.3389/feart.2022.866534
Received: 31 January 2022; Accepted: 21 April 2022;
Published: 06 June 2022.
Edited by:
Fabrizio Magrini, Johannes Gutenberg University Mainz, GermanyReviewed by:
Matthew R. Agius, University of Malta, MaltaCopyright © 2022 Gammaldi, Ismail and Zollo. This is an open-access article distributed under the terms of the Creative Commons Attribution License (CC BY). The use, distribution or reproduction in other forums is permitted, provided the original author(s) and the copyright owner(s) are credited and that the original publication in this journal is cited, in accordance with accepted academic practice. No use, distribution or reproduction is permitted which does not comply with these terms.
*Correspondence: Sergio Gammaldi, c2VyZ2lvLmdhbW1hbGRpQGluZ3YuaXQ=
Disclaimer: All claims expressed in this article are solely those of the authors and do not necessarily represent those of their affiliated organizations, or those of the publisher, the editors and the reviewers. Any product that may be evaluated in this article or claim that may be made by its manufacturer is not guaranteed or endorsed by the publisher.
Research integrity at Frontiers
Learn more about the work of our research integrity team to safeguard the quality of each article we publish.