- 1School of Civil Engineering, Central South University, Changsha, China
- 2National Engineering Research Center of High-Speed Railway Construction Technology, Central South University, Changsha, China
Leakage is a common defect of embankment dam slopes, and is usually accompanied by internal erosion. This study establishes a mathematical two-phase seepage coupling model that explicitly considers the effects of internal erosion. With the help of finite element software COMSOL Multiphysics®, we use this model to study the characteristics of fluid seepage, the fraction of leakage volume that is made up of migrated fine particles (migrated fine particles volume fraction), porosity, permeability, and displacement in the leakage process of a three-dimensional embankment dam slope, as well as to study the influence of the water level and leakage outlet size on the aforementioned features. Our results show that water seepage velocity gradually increases with time, especially at the downstream leakage outlet. Therefore, the erosion and migration of fine particles occur primarily at the downstream leakage outlet, resulting in a significant increase in the migrated fine particles volume fraction, porosity, and permeability. In addition, the maximum migrated fine particles volume fraction, the maximum porosity, and the maximum permeability in the slope increase nonlinearly with time. Curves for maximum displacement with a strength reduction factor can be divided into three stages: the early stable stage, the midterm nonlinear growth stage (creeping state), and the later rapid growth stage (instability state). We also find that the rise of the water level promotes the erosion and migration of fine particles on the slope and that the maximum migrated fine particles volume fraction and the maximum porosity increase with the water level. The values of the strength reduction factor for the creeping state decrease as the water level rises. Furthermore, the larger the size of the downstream leakage outlet, the larger the maximum migrated fine particles volume fraction and maximum porosity. However, the relationship between maximum displacement and strength reduction factor is nearly unaffected by the size of the leakage outlet.
1 Introduction
The embankment dam slope is a key component of flood control and disaster mitigation systems, and their seepage characteristics are important research topics in geotechnical and hydraulic engineering (Foster et al., 2000a; Cesali and Federico, 2019; Yang et al., 2019; Jiang et al., 2020). More specifically, leakage is a common type of damage to embankment dam slopes (Foster et al., 2000b; Chaney et al., 2000; Razavi et al., 2020a) and is usually accompanied by internal erosion. The internal erosion occurs completely inside the slope or the foundation, and usually causes danger and potentially dangerous situations (Ni et al., 2018; Xie et al., 2019). During internal erosion, fluid drives fine particles to move along the pores of the soil skeleton, and this migration can result in a change in the mechanical properties of the soil such as porosity and permeability. Furthermore, changes in porosity and permeability can further change seepage characteristics. Internal erosion consists primarily of four different types: Concentrated leak erosion, backward erosion, soil contact erosion, and suffusion (Fell and Fry, 2007; Richards and Reddy, 2007). As shown in Figure 1, concentrated leak erosion occurs mostly at cracks in the slope, backward erosion occurs upward from and along the seepage path, contact erosion is more likely to occur through the slope on the contact surface of different fillers or on the contact surface between the slope and the structure, and suffusion usually occurs in gap-graded soil layers. This study focuses on suffusion, which corresponds to the detachment and migration of fine particles within the pores of the soil skeleton by means of seepage flow.
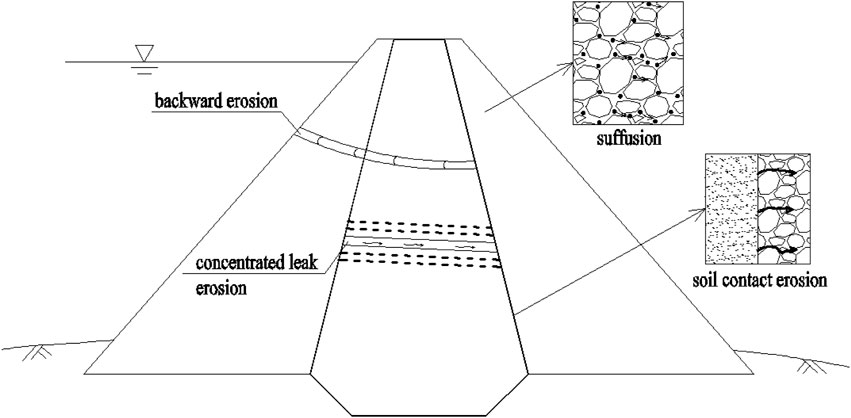
FIGURE 1. Diagram of internal erosion in a dam slope: concentrated leak erosion, backward erosion, soil contact erosion, and suffusion (Fell and Fry, 2007).
Sterpi (2003) tested the erosion characteristics of fine particles caused by seepage and established an erosion equation for fine particles on test results. By combining this with the mass conservation equation for fine particles, the erosion and migration process of fine particles during seepage can be simulated. Deng et al. (2020) conducted an experimental study on the characteristics of horizontal seepage-induced suffusion under controlled vertical stress, and their test results showed that after the initiation of suffusion, alternating decreases and increases in the coefficient of permeability occurred, possibly due to alternating clogging and dredging of soil pores by movable fine particles. Additionally, the authors observed an uneven distribution of local hydraulic gradients along the flow path and considered that this could be regarded as a sign of the initiation of suffusion. Ke and Takahashi (2012) and Ke and Takahashi (2014) studied the effect of internal erosion on soil strength and found that the internal erosion indicated by a loss of fine particles caused changes in the void ratio and a significant increase in hydraulic conductivity, resulting in a decrease in soil strength from its initial value. Another study, by Ma et al. (2021), studied the characteristics of non-Darcy hydraulic properties and deformation behaviors of granular gangues using laboratorial, theoretical, and in situ approaches, and their results showed that the porosity and permeability of granular gangues decreased gradually and that the crushing ratio of the sample increased gradually with an increase in original grain size grade and a decrease in stress rate, respectively. The authors then constructed an improved model to predict permeability evolution using the fractal dimension of granular gangues.
Other studies have focused on the numerical simulation of internal erosion characteristics. For example, Yang et al. (2019) and Yang et al. (2020) established a coupled mathematical model of the seepage field and stress field under the influence of internal erosion and used the model to simulate the seepage and deformation characteristics of a three-dimensional dam under the influence of internal erosion and studied the failure mode of the dam under different boundary conditions. Based on thermodynamic principles and porous media theory, Zhang et al. (2013) also created a mathematical model that considered the effects of internal erosion. The model was used to simulate the evolution of erosion inside the dam, the characteristics of the spatial and temporal distributions of porosity, and the concentration of moving fine particles was. Razavi et al. (2020b) investigated the settlement of the Esfarayen earth-filled dam and believed that the main reason for the excessive settlement was internal erosion. Here, the broken zone gradually formed a large hole that eventually caused the sudden settling of the surface of the dam. Subsequently, a testing program was developed that could determine the starting time of internal erosion. Based on the two-phase flow theory, and Ma et al. (2019), Ma et al. (2020), the authors also established a resistance model of water–sediment flow in fractures and quantitatively analyzed the characteristics of water–sediment flow in rock fractures using computational fluid dynamics (CFD). They then validated their calculations with a laboratory-scale test.
In this study, we construct a mathematical two-phase seepage coupling model to examine the effects of internal erosion on an embankment dam slope based on two-phase and porous media seepage, the constitutive model of fine particles migration, the Mohr–Coulomb criterion, and the principle of effective stress in porous media. We then implement a finite element model of the embankment dam slope with COMSOL Multiphysics® software in order to simulate the model’s behavior and study the influence of internal erosion on the hydraulic characteristics (porosity and permeability) and on the deformation characteristics of the embankment dam slope itself.
2 The Mathematical Model of Two-Phase Seepage
2.1 Assumptions
In this study, we consider the saturated soil to be a saturated porous medium composed of three phases: the solid phase (coarse particles and fine particles that constitute the skeleton), the fluid phase (water), and the migrated fine particles phase, where fine particles migrate with the fluid. To establish the mathematical model for two-phase seepage that considers the effects of internal erosion, we make the following three assumptions. First, we assume that the saturated soil is uniform and isotropic, second, that the seepage of water follows Darcy’s law, and third, that the migration velocity of fine particles is equal to the water seepage velocity.
2.2 Seepage Field Equations
2.2.1 Mass Conservation Equations
The mass conservation equations for water-migrated fine particles and solids can be expressed as (Wang, 2006):
where
2.2.2 Equations of Motion
The seepage of water conforms to Darcy’s law, as follows (Darcy, 1856):
where
We can substitute Eq. 4 into Eqs 1, 2 to obtain the governing equations of mass conservation as follows:
2.2.3 Constitutive Equation of Fine Particles Migration
With a gradual increase in fluid velocity, the rest of the fine particles in the porous medium gradually begin to roll, slide, suspend, and finally migrate with the fluid. This process of fine particles migration has an important influence on changes in pore structure and hydraulic characteristics. According to references (Sakthivadivel, 1966a; Sakthivadivel, 1966b; Vardoulakis et al., 1996; Stavropoulou et al., 1998), the mass fraction of fine particles migration is a comprehensive result of porosity, water seepage velocity, and other factors. Because the migrated fine particles cause changes in pore structure, and the limit of the range of the changes is the pore structure of the same material in the loose state. That is, the increase in porosity caused by fine particles migration cannot exceed the maximum porosity in principle. Then:
where
2.2.4 Permeability Evolution Equation
According to the Kozeny–Carman equation, the relationship between the permeability and porosity of porous media is (Singh and Wallender, 2008):
where
2.2.5 The Stress Field Equations for Saturated Soil
According to the principle of effective stress in saturated porous media:
where
The stress balance equation of porous media can thus be expressed as:
where
According to the Mohr–Coulomb criterion and the principle of effective stress in saturated porous media:
where
2.2.6 Boundary and Initial Conditions
We solve the mathematical model with the help of COMSOL Multiphysics®. The fundamental variables (
3 Model Validation
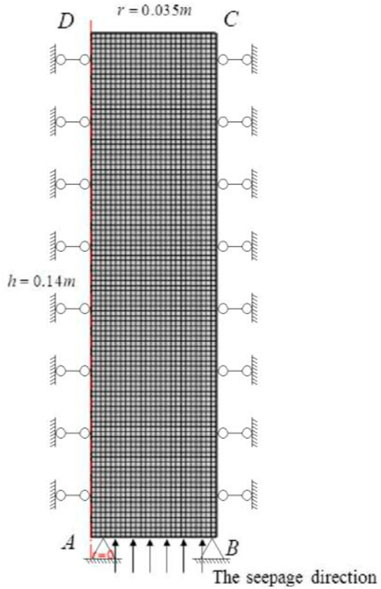
Sterpi (2003) has previously conducted a seepage test for the erosion characteristics of fine particles in the soil. In this study, we used the model proposed in the previous section to conduct numerical calculations for this test and to compare the calculation results with the test results to determine the accuracy of the model. A two-dimensional axisymmetric model with a radius of 0.035 m and a height of 0.14 m is established in Sterpi’s study, as shown in Figure 2. The soil tested was well-graded compacted sand and gravel with a size range of 0–2 mm, and a content of fine particles (with a particles size less than 0.075 mm) by mass was 23%. The physical parameters for the soil are shown in Table 1 of her study (Sterpi, 2003). Our numerical model adopted a mapping mesh with 2,500 meshes and an average unit mass of 0.98. The mesh of the numerical model is shown in Figure 2.
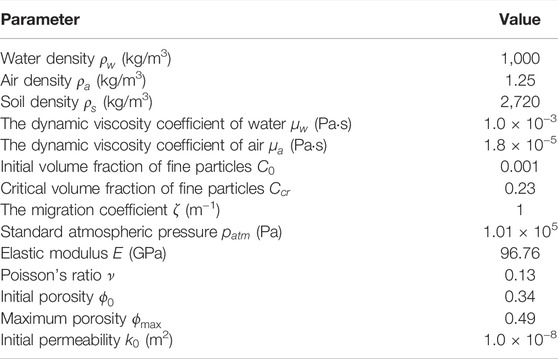
TABLE 1. Physical parameters of the soil (Sterpi, 2003).
The initial conditions for the calculation model were as follows:
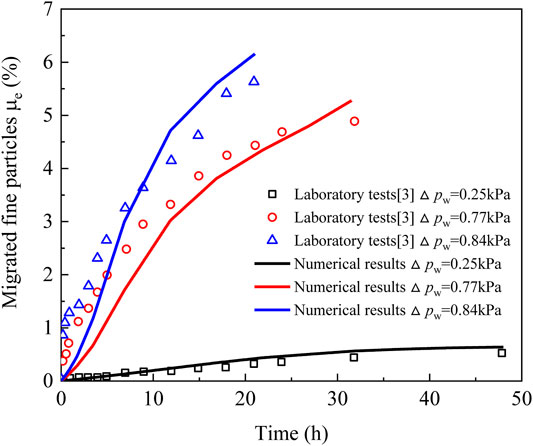
Figure 3 shows the evolution curves for the mass percentage for migrated fine particles. We can see that the mass percentage for migrated fine particles increases with time, and the numerical results are close to those from the experimental tests. Although there is some error between the calculated results and the experimental results in the groups of
4 The Numerical Study on the Seepage Characteristics of an Embankment Dam Slope
4.1 Description of the Problem
The embankment dam featured in this study is located in Xinjiang Province, China, and a diagram of it is shown in Figure 4 (Ding et al., 2020). The top width is 4.50 m, the bottom width is 64.50 m, and the height is 16.80 m. The gradient of the upstream and downstream dam slopes is 1:1.5, with a normal water level of 399.80 m. The dam slope is made of heavy silty loam, and the mechanical parameters of this soil are shown in Table 2 (Deng, 2006; Ding et al., 2020). After more than 20 years of operation, leakage occurred at the foot of the downstream dam slope, seriously threatening the safety of the dam slope.

FIGURE 4. Schematic diagram for leakage of the embankment dam slope (Ding et al., 2020).
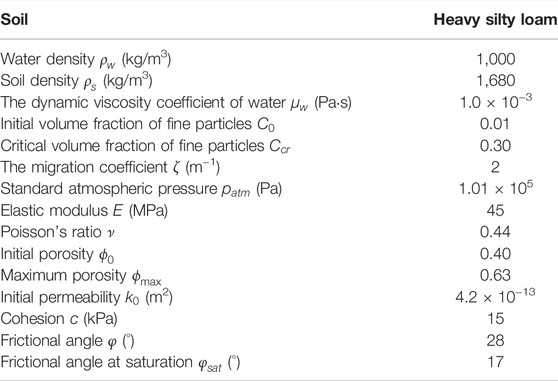
TABLE 2. Physical parameters for soils (Deng, 2006; Ding et al., 2020).
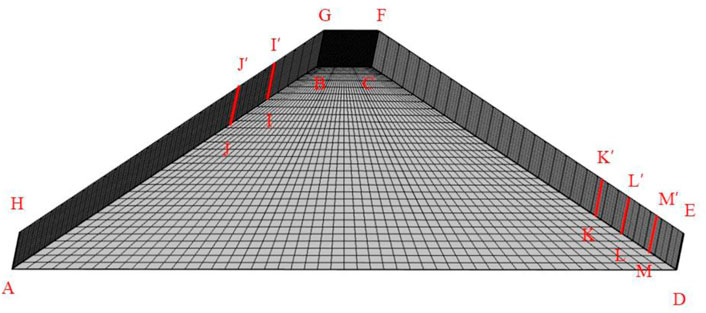
In the process of numerical calculation, we established a three-dimensional dam slope model as shown in Figure 5. In this model, we adopted a hexahedral mesh, and a total of 40,600 grid points were created, with an average grid mass of 0.82.
For the seepage field, AII'H is the hydrostatic pressure boundary, which is also the fine particles inlet boundary, and the hydrostatic pressure is given by
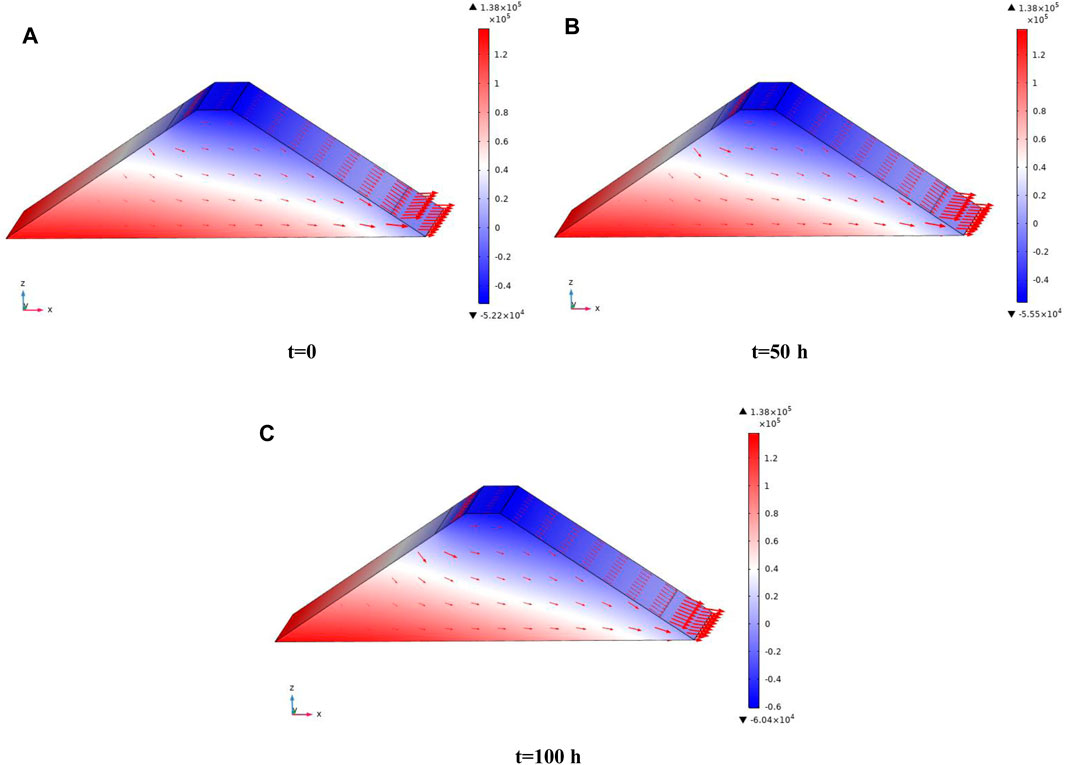
FIGURE 6. Spatial distribution of the pore water pressure (unit: Pa) and water seepage velocity in the embankment dam slope. (A) t = 0, (B) t = 50 h, and (C) t = 100 h.
4.2 Analysis of the Numerical Results
4.2.1 Variation in Pore Water Pressure and Water Seepage Velocity
Figure 6 shows the spatial distribution of the pore water pressure and the water seepage velocity inside the dam slope at different times. The surface where the pore water pressure equals 0 is called the free surface. We can see from Figure 6 that the water seepage velocity gradually increases with time and that the water seepage velocity at the downstream exports is greater than that at the interior of the dam slope. This is because the porosity and permeability gradually increase (Figure 9 and Figure 10 for details) as the fine particles gradually erode, and the increase in permeability is concentrated at the downstream outlet. Therefore, the water seepage velocity at the downstream exports increases at a relatively large rate.
4.2.2 Variation in Migrated Fine Particles Volume Fraction
The spatial distribution of the migrated fine particles volume fraction inside the embankment dam slope is shown in Figure 7. At t = 0, the migrated fine particles volume fraction inside the dam slope is relatively small and uniformly distributed. As time passes, however, the fluid gradually erodes the fine particles and the erosion of fine particles occurs primarily at the downstream exports of leakage. With an increase in distance from the exports of leakage, the migrated fine particles volume fraction decreases. The points with the highest increases in migrated fine particles volume fraction correlate to the points with the highest seepage velocity, as shown in Figure 6, and porosity, as shown in Figure 9. The reason for this may be inferred from the constitutive equation of fine particles migration (Eq. 8), which is a function of the seepage velocity and porosity of the soil.
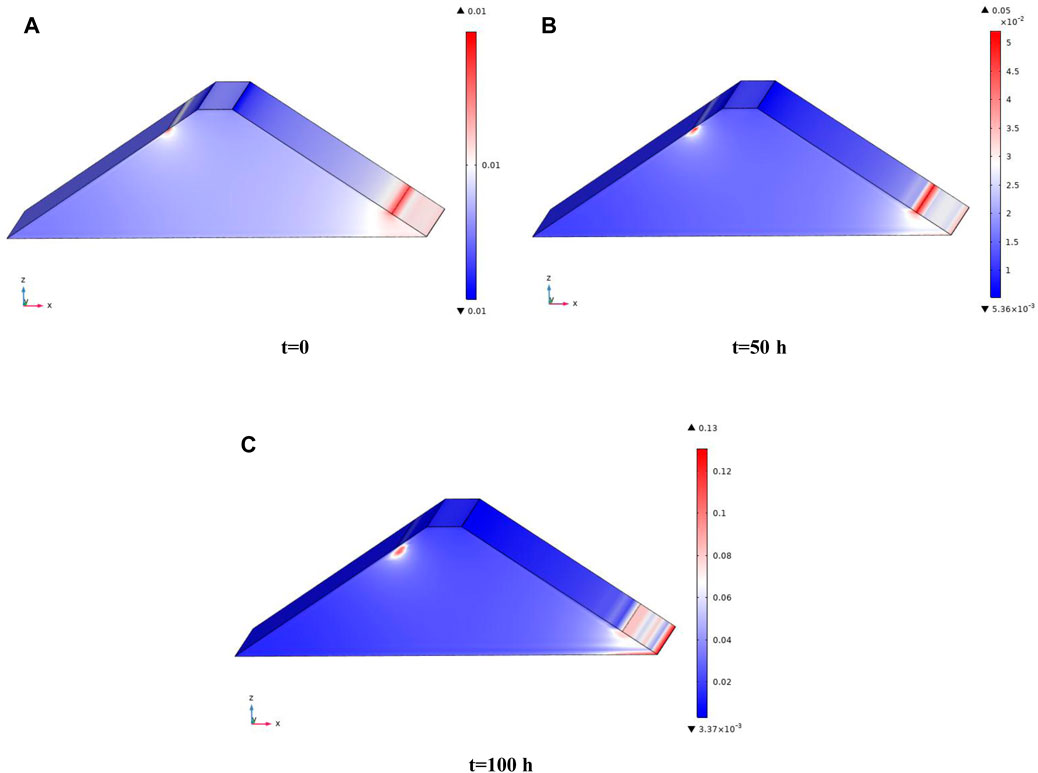
FIGURE 7. Spatial distribution of the migrated fine particles volume fraction in the embankment dam slope. (A) t = 0, (B) t = 50 h, and (C) t = 100 h.
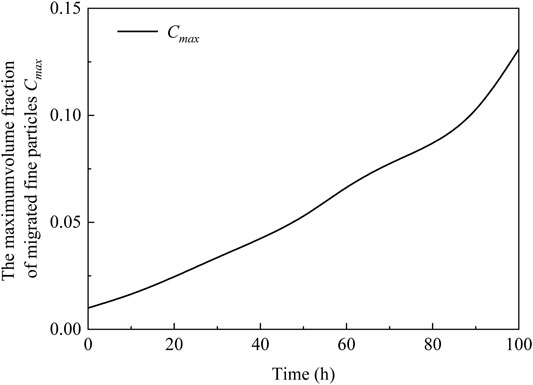
The evolution curve of the maximum migrated fine particles volume fraction simulated in the dam slope is shown in Figure 8. We can see that the maximum migrated fine particles volume fraction increased with time. Specifically, when the time is less than 50 h, the maximum migrated fine particles volume fraction increases approximately linearly. After 50 h, the maximum migrated fine particles volume fraction increases nonlinearly, until 100 h when the maximum migrated fine particles volume fraction of 0.13 is reached.
4.2.3 Variation in Porosity and Permeability
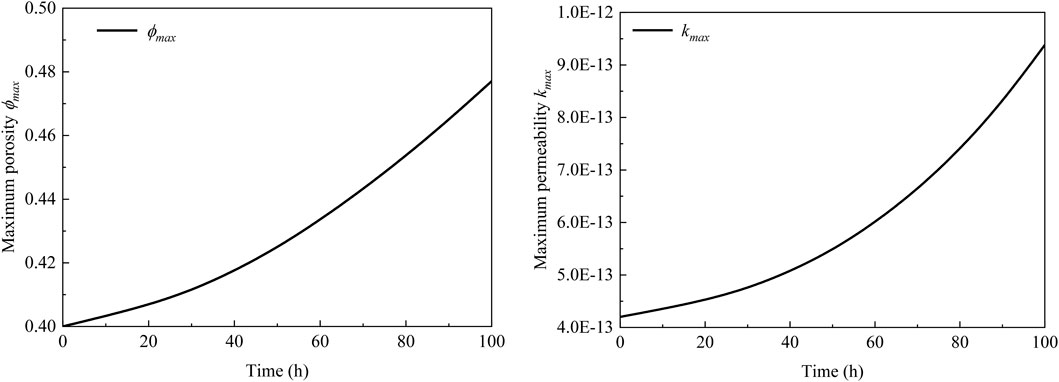
The spatial distributions of porosity and permeability are shown in Figure 9, and the evolution curves of maximum porosity and maximum permeability are shown in Figure 10. Combining Figure 9 and Figure 10, we can see that with the gradual erosion of fine particles, the porosity and permeability inside the dam slope gradually increase as well, and the porosity and permeability at the downstream exports of leakage increase particularly significantly. The maximum porosity and maximum permeability evolution curves show the same pattern as well. That is, the maximum porosity or maximum permeability increase with time. The porosity increases from the initial 0.40 to 0.48, an increase of 20%, and the permeability increases from the initial 4.2 × 10⁻¹³ m2 to 9.4 × 10⁻¹³ m2, an increase of 2.33 times.
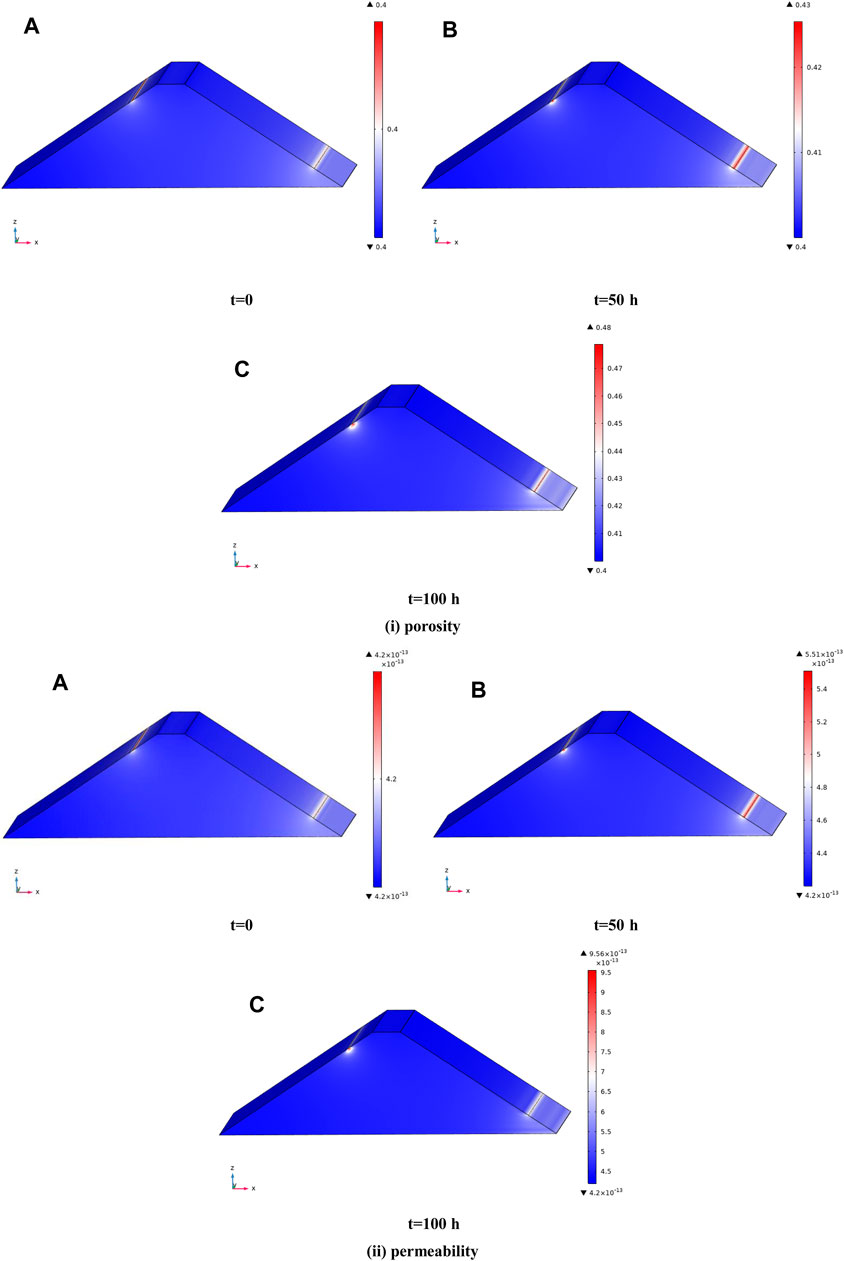
FIGURE 9. Spatial distribution of porosity and permeability in the embankment dam slope. (A) t = 0, (B) t = 50 h, (C) t = 100 h, (i) porosity, and (ii) permeability.
4.2.4 Variation in Displacement
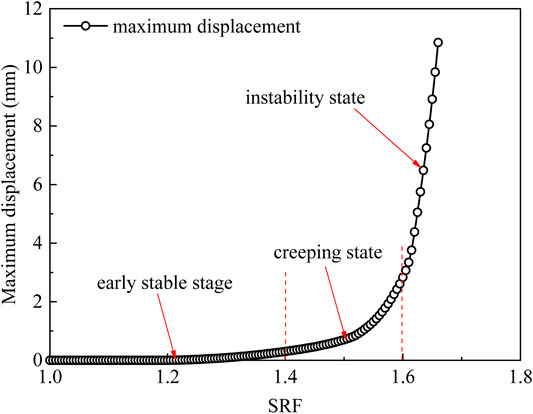
Figure 11 shows the variation diagram of the maximum deformation with the SRF. The maximum displacement can be divided into three stages with the change in the SRF, the early stable stage, the midterm nonlinear growth stage (creeping state), and the later rapid growth stage (instability state). When the SRF is less than 1.40, the maximum displacement of the dam slope hardly changes with the SRF, indicating that the dam slope is in a stable state. However, when the SRF is between 1.40 and 1.60, the maximum displacement increases nonlinearly with the SRF, indicating that the dam slope is in a creeping state. Finally, when the SRF is greater than 1.60, the maximum displacement increases approximately linearly and rapidly with the SRF, indicating that the dam slope is in a state of instability. Figure 12 shows the spatial distribution of displacement in the dam slope under different SRFs. When the SRF is 1.25, the displacement is first generated inside the dam slope near the downstream exports of leakage, which is approximately 0.03 mm. As the SRF continues to increase, the area with larger displacement gradually extends to the upstream and downstream exports. After this, when the SRF is at 1.55, a through-sliding surface has been formed inside the dam slope. Here, as the SRF continues to increase, the displacement generated inside the dam slope increases rapidly, and the maximum displacement is approximately 10.8 mm, which occurrs at the downstream exports of leakage. As mentioned earlier, the erosion of fine particles occurrs primarily at the downstream exports of leakage, and changes to the porosity and permeability at the downstream exports of leakage are the most significant, leading to a significant decrease in the strength parameters of the soil at the foot of the slope. Therefore, the displacement is also large.
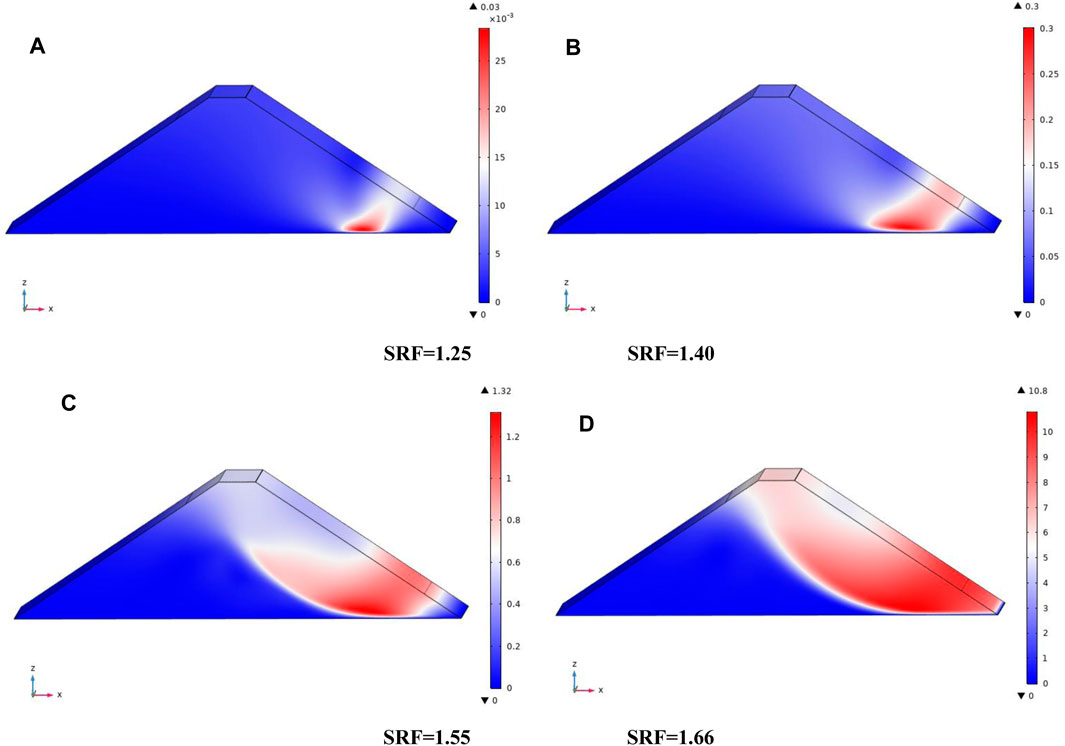
FIGURE 12. Spatial distribution of displacement (in mm) in the dam slope under different SRFs. (A) SRF = 1.25, (B) SRF = 1.40, (C) SRF = 1.55, and (D) SRF = 1.66.
4.3 The Influence of the Water Level
The water level of the dam often changes due to rainfall and other reasons, and it is therefore of practical engineering significance to study the influence of the water level on the seepage characteristics of the dam slope (Shen, 2016). To analyze the influence of water level conditions on seepage and deformation characteristics, two different water level conditions were selected for calculation: 402.50 and 397.10 m (Deng, 2006). Figure 13 shows the influence of these water levels on the maximum migrated fine particles volume fraction, maximum porosity, and maximum displacement with the SRF. We conclude that the maximum migrated fine particles volume fraction at different water levels behave similarly. That is, it increases nonlinearly with time in both cases. In addition, the higher the water level, the larger the maximum migrated fine particles volume fraction, and the higher the water level, the greater the maximum porosity as well. The relationship between the maximum displacement and the SRF shows that the higher the water level, the smaller the SRF when the creeping state begins and the dam slope fails. With water levels of 397.10, 399.80, and 402.50 m, the SRFs corresponding to the onset of the creeping state are approximately 1.50, 1.40, and 1.30, respectively, and the corresponding SRFs for dam slope damage are 1.85, 1.66, and 1.62, respectively. This also shows that the higher the water level (the larger the head difference between the upstream and downstream of the dam slope), the easier it is for fine particles to erode, and for migration and leakage damage to occur inside the dam slope.
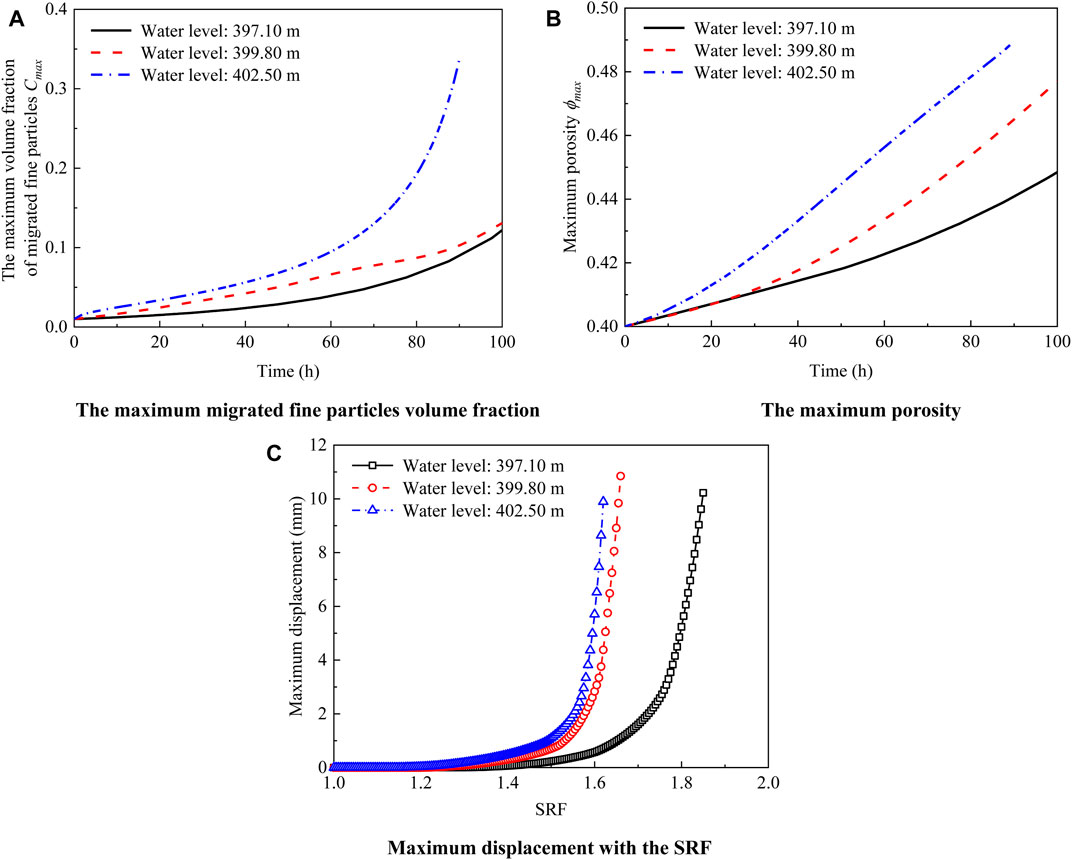
FIGURE 13. The influence of the water level on the maximum migrated fine particles volume fraction, maximum porosity, and maximum displacement. (A) The maximum migrated fine particles volume fraction. (B) The maximum porosity. (C) Maximum displacement with the SRF.
4.4 The Influence of Downstream Leakage Outlets
To analyze the influence of downstream leakage outlets on seepage and deformation characteristics, two different downstream leakage outlets were selected for calculation: MDEM’ (vertical height of 2.0 m) and KDEK’ (vertical height of 4.0 m). Figure 14 shows the influence of downstream leakage outlets on the maximum migrated fine particles volume fraction, maximum porosity, and maximum displacement with the SRF. Here we see that the maximum migrated fine particles volume fraction and maximum porosity corresponding to the same time increases with the increase in leakage outlet size. However, the trend of the maximum displacement with the strength reduction factor change is seldom basically unaffected by the size of the leakage outlet.
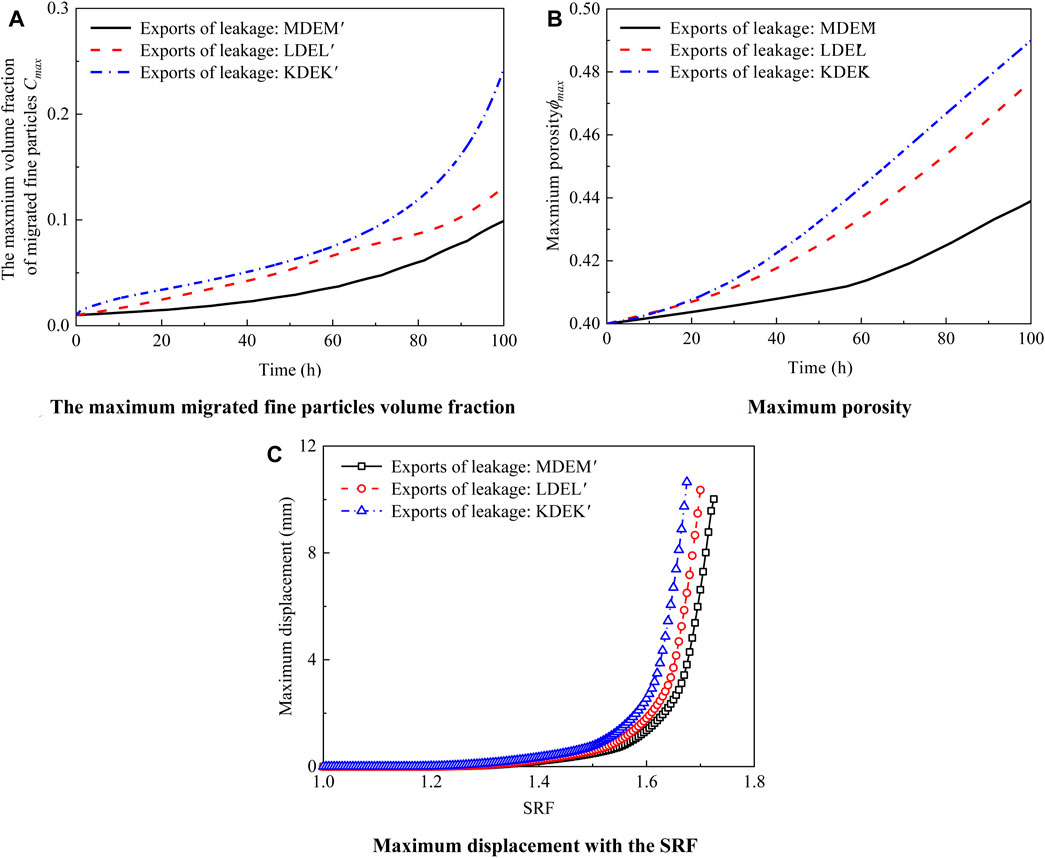
FIGURE 14. The influence of downstream leakage outlets on the maximum migrated fine particles volume fraction, maximum porosity, and maximum displacement. (A) The maximum migrated fine particles volume fraction. (B) Maximum porosity. (C) Maximum displacement with the SRF.
4.5 A Comparative Analysis Between This Research and Existing Research
The seepage of a dam slope is often accompanied by the erosion of fine particles, and this migration can cause changes in hydraulic parameters (such as porosity and permeability), which in turn affect the seepage and deformation characteristics of the dam slope. The numerical calculation model established in this study can calculate the fluid–solid coupling characteristics, the characteristics of fine particles migration, and the evolution characteristics of hydraulic parameters. Compared with the numerical calculation results in the study (Deng, 2006) that did not consider fine particles erosion, the strength reduction factor obtained in our study is small. From this point of view, considering the erosion of fine particles and changes in hydraulic parameters in the calculation process is more in line with actual engineering conditions.
5 Conclusion
In this study, we constructed a mathematical model for two-phase seepage in an embankment dam slope that considered the effects of internal erosion. By using COMSOL Multiphysics®, we were able to study the characteristics of seepage, hydraulic parameters, and deformation of a three-dimensional embankment dam slope leakage process and have reached the following conclusions.
First, the water seepage, velocity gradually increases with time, especially at the leakage outlet. Therefore, the erosion and migration of fine particles primarily occur at the downstream leakage outlet, resulting in a significant increase in migrated fine particles volume fraction, porosity, and permeability. The maximum migrated fine particles volume fraction increases from 0.01 to 0.13 during the duration of our study, the maximum porosity increases by 20%, and the maximum permeability grew to 2.33 times higher than that at the initial moment.
Second, the maximum displacement of the dam slope can be divided into three stages with changes in the SRF: the early stable stage, the midterm nonlinear growth stage (creeping state), and the later rapid growth stage (instability state). In actual engineering, when the maximum displacement is in the midterm nonlinear growth stage, some reinforcement measures should be taken, such as building a dam seepage wall, building a pressure relief well, and strengthening the downstream dam foot.
Third, a rise in the water level promotes the erosion and migration of fine particles in the dam slope, and the maximum volume fraction of fine particles and maximum porosity in the dam slope also increase with the water level. Additionally, the higher the water level, the smaller the SRF when the creeping state begins and the dam slope fails.
Finally, the maximum migrated fine particles volume fraction and maximum porosity for a given time increase with leakage outlet size. However, the behavior of the maximum displacement with the SRF change is nearly unaffected by the size of the leakage outlet.
Our mathematical model can calculate the fluid–solid coupling and the fine particles migration characteristics in an embankment dam slope, but the numerical calculations in this study were performed under the assumption of homogeneous dam material. However, in nature, the seepage path and the mechanism of fine particles migration may become more complex than modeled here within a heterogeneous medium. Modeling heterogeneous dam materials is the focus of future research.
Data Availability Statement
The raw data supporting the conclusion of this article will be made available by the authors, without undue reservation.
Author Contributions
YJ: writing—original draft, methodology, data curation, formal analysis, and visualization. YD: investigation, data curation, and writing—review and editing. XW: writing—review and editing and supervision. JZ: conceptualization and supervision. XC: resources and project administration.
Funding
The study was supported by the National Natural Science Foundation of China under grant number CNNSF 51978674 and the China Railway Corporation Science and the Technology Development Project (2017G008-A).
Conflict of Interest
The authors declare that the research was conducted in the absence of any commercial or financial relationships that could be construed as a potential conflict of interest.
Publisher’s Note
All claims expressed in this article are solely those of the authors and do not necessarily represent those of their affiliated organizations, or those of the publisher, the editors, and the reviewers. Any product that may be evaluated in this article, or claim that may be made by its manufacturer, is not guaranteed or endorsed by the publisher.
Acknowledgments
The authors are grateful for the constructive comments and suggestions from the reviewers. The authors thank AiMi Academic Services (www.aimieditor.com) for the English language editing and review services.
References
Cesali, C., and Federico, V. (2019). Detection of Permeability Defects within Dams and Levees through Coupled Seepage and Heat Transport Analyses. Cham, Switzerland: LNCE.
Chaney, R., Demars, K., Reddi, L., Lee, I.-M., and Bonala, M. (2000). Comparison of Internal and Surface Erosion Using Flow Pump Tests on a Sand-Kaolinite Mixture. Geotech. Test. J. 23 (1), 116–122. doi:10.1520/gtj11129j
Deng, G., Zhang, L.-L., Chen, R., Liu, L.-l., Shu, K.-X., and Zhou, Z.-L. (2020). Experimental Investigation on Suffusion Characteristics of Cohesionless Soils along Horizontal Seepage Flow under Controlled Vertical Stress. Front. Earth Sci. 8 (195), 195. doi:10.3389/feart.2020.00195
Deng, Y. Y. (2006). Analysis the Seepage Destory Mechanisms of Disease Earth Dam. Shihezi: Shihezi University.
Ding, Y., Zhang, J.-s., Jia, Y., Chen, X.-b., Wang, X., and Meng, F. (2020). Study on Two-phase Fluid-Solid Coupling Characteristics in Saturated Zone of Subgrade Considering the Effects of Fine Particles Migration. Appl. Sci. 10 (21), 7539. doi:10.3390/app10217539
Fell, R. F., and Fry, J. J. (2007). The State of the Art of Assessing the Likelihood of Internal Erosion of Embankment Dams, Water Retaining Structures and Their Foundations. London, United Kingdom: Taylor & Francis, 1–23.
Foster, M., Fell, R., and Spannagle, M. (2000). The Statistics of Embankment Dam Failures and Accidents. Can. Geotech. J. 37 (5), 1000–1024. doi:10.1139/t00-030
Foster, M., Fell, R., and Spannagle, M. (2000). The Statistics of Embankment Dam Failures and Accidents. Can. Geotech. J. 37 (5), 1000–1024. doi:10.1139/t00-030
Jiang, X., Zhanyuan, Z., Chen, H., Deng, M., Niu, Z., Deng, H., et al. (2020). Natural Dam Failure in Slope Failure Mode Triggered by Seepage. Geomatics, Nat. Hazards Risk 11 (1), 698–723. doi:10.1080/19475705.2020.1746697
Ke, L., and Takahashi, A. (2014). Experimental Investigations on Suffusion Characteristics and its Mechanical Consequences on Saturated Cohesionless Soil. Soils Found. 54 (4), 713–730. doi:10.1016/j.sandf.2014.06.024
Ke, L., and Takahashi, A. (2012). Strength Reduction of Cohesionless Soil Due to Internal Erosion Induced by One-Dimensional Upward Seepage Flow. Soils Found. 52 (4), 698–711. doi:10.1016/j.sandf.2012.07.010
Ma, D., Duan, H., Liu, W., Ma, X., and Tao, M. (2020). Water-Sediment Two-phase Flow Inrush Hazard in Rock Fractures of Overburden Strata during Coal Mining. Mine Water Environ. 39, 308–319. doi:10.1007/s10230-020-00687-6
Ma, D., Wang, J., Cai, X., Ma, X., Zhang, J., Zhou, Z., et al. (2019). Effects of Height/Diameter Ratio on Failure and Damage Properties of Granite under Coupled Bending and Splitting Deformation. Eng. Fract. Mech. 220, 106640. doi:10.1016/j.engfracmech.2019.106640
Ma, D., Zhang, J., Duan, H., Huang, Y., Li, M., Sun, Q., et al. (2021). Reutilization of Gangue Wastes in Underground Backfilling Mining: Overburden Aquifer Protection. Chemosphere 264, 128400. doi:10.1016/j.chemosphere.2020.128400
Ni, X. D., Zuo, X. Y., Sun, D. M., and Liu, Z. (2018). Study on the Piping Erosion in Levee Foundation by Sand Box Model Test. Adv. Eng. Sci. 50 (2), 24–31. doi:10.15961/j.jsuese.201700849
Razavi, S. K., Bonab, M. H., and Dabaghian, A. (2020). Investigation into the Internal Erosion and Local Settlement of Esfarayen Earth-Fill Dam. J. Geotech. Geoenviron. 146 (4), 4020006–4020013. doi:10.1061/(asce)gt.1943-5606.0002216
Razavi, S. K., Hajialilue Bonab, M., and Dabaghian, A. (2020). Investigation into the Internal Erosion and Local Settlement of Esfarayen Earth-Fill Dam. J. Geotech. Geoenviron. Eng. 146 (4), 04020006. doi:10.1061/(ASCE)GT.1943-5606.0002216
Richards, K. S., and Reddy, K. R. (2007). Critical Appraisal of Piping Phenomena in Earth Dams. Bull. Eng. Geol. Environ. 66 (4), 381–402. doi:10.1007/s10064-007-0095-0
Sakthivadivel, R. (1966). Theory and Mechanism of Filtration of Non-colloidal Fines through A Porous Medium. Berkekey: University of California.
Sakthivadivel, S. I. R. (1966). A Review of Filtration Theories. Berkekey: University of California.
Shen, H. (2016). Study on Fluid-Solid Coupling Theroy of Gravelly Soil Influenced by Internal Erosion and its Engineering Application. Shanghai: Shanghai Jiao Tong University.
Singh, P. N., and Wallender, W. W. (2008). Effects of Adsorbed Water Layer in Predicting Saturated Hydraulic Conductivity for Clays with Kozeny-Carman Equation. J. Geotech. Geoenviron. Eng. 134 (6), 829–836. doi:10.1061/(asce)1090-0241(2008)134:6(829)
Stavropoulou, M., Papanastasiou, P., and Vardoulakis, I. (1998). Coupled Wellbore Erosion and Stability Analysis. Int. J. Numer. Anal. Meth. Geomech. 22 (9), 749–769. doi:10.1002/(sici)1096-9853(199809)22:9<749::aid-nag944>3.0.co;2-k
Sterpi, D. (2003). Effects of the Erosion and Transport of Fine Particles Due to Seepage Flow. Int. J. Geomech. 3 (1), 111–122. doi:10.1061/(asce)1532-3641(2003)3:1(111)
Vardoulakis, I., Stavropoulou, M., and Papanastasiou, P. (1996). Hydro-Mechanical Aspects of the Sand Production Problem. Transp. Porous Med. 22 (2), 225–244. doi:10.1007/BF01143517
Xie, Q., Liu, J., Han, B., Li, H., Li, Y., and Jiang, Z. (2019). Experimental Investigation of Interfacial Erosion on Culvert-Soil Interface in Earth Dams. Soils Found. 59 (3), 671–686. doi:10.1016/j.sandf.2019.02.004
Yang, J., Yin, Z.-Y., Laouafa, F., and Hicher, P.-Y. (2019). Internal Erosion in Dike-on-Foundation Modeled by a Coupled Hydromechanical Approach. Int. J. Numer. Anal. Methods Geomech. 43 (3), 663–683. doi:10.1002/nag.2877
Yang, J., Yin, Z. Y., Laouafa, F., and Hicher, P. Y. (2020). Three‐dimensional Hydromechanical Modeling of Internal Erosion in Dike‐on‐foundation. Int. J. Numer. Anal. Methods Geomech. 44 (8), 1200–1218. doi:10.1002/nag.3057
Keywords: embankment dam slope, internal erosion, two-phase seepage characteristics, deformation characteristics, porosity, permeability, migrated fine particles
Citation: Jia Y, Ding Y, Wang X, Zhang J and Chen X (2022) A Numerical Analysis of the Leakage Characteristics of an Embankment Dam Slope With Internal Erosion. Front. Earth Sci. 10:866238. doi: 10.3389/feart.2022.866238
Received: 03 February 2022; Accepted: 16 May 2022;
Published: 27 June 2022.
Edited by:
Marcelo Cohen, Federal University of Pará, BrazilReviewed by:
Dan Ma, China University of Mining and Technology, ChinaZhangliangliang Liangliang, Harbin Institute of Technology, Shenzhen, China
Copyright © 2022 Jia, Ding, Wang, Zhang and Chen. This is an open-access article distributed under the terms of the Creative Commons Attribution License (CC BY). The use, distribution or reproduction in other forums is permitted, provided the original author(s) and the copyright owner(s) are credited and that the original publication in this journal is cited, in accordance with accepted academic practice. No use, distribution or reproduction is permitted which does not comply with these terms.
*Correspondence: Yu Ding, ZGluZ195dUBjc3UuZWR1LmNu
 Yu Jia
 Yu Ding1*