 Yingqin Wu
 Tong Wang
 Yan Liu1
 Zhangxin Chen
- 1Key Laboratory of Petroleum Resources, Gansu Province/Northwest Institute of Eco-Environment and Resources, Chinese Academy of Sciences, Lanzhou, China
- 2School of Environment, Beijing Jiaotong University, Beijing, China
- 3School of Engineering, Newcastle University, Newcastle, United Kingdom
- 4University of Chinese Academy of Sciences, Beijing, China
- 5Department of Chemical and Petroleum Engineering, Schulich School of Engineering, University of Calgary, Calgary, AB, Canada
Using gas chromatography-triple quadrupole tandem mass spectrometry (GC-MS/MS), the soluble organic matter was analyzed for the first time in twenty-two sediment samples from the eastern slopes of the Gongga Mountain, China, at high altitudes between 4,600 and 6,700 m. The C11-C33 n-alkanes and C9-C33 n-alkan-2-ones were identified in these samples. Both compounds were dominated by odd carbon numbers in the long-chain molecules and contained a maximum of n-C27 or n-C29, indicating that the sediments were predominantly of higher plant origin. However, the short-chain n-alkan-2-ones, with a maximum content of n-C17 or i-C18 (phytone, 6, 10, 14-trimethylpentadecan-2-one), did not show a predominance of odd and even numbers, suggesting that they were predominantly derived from bacteria and algae. Therefore, we suggest that the organic matter in Gongga Mountain comes from three sources, i.e. bacteria, algae, and higher plants. Stable carbon isotope (δ13C) values ranged from −24.6‰ to −27.3‰, indicating that C3 plants were the dominant organic input to the sediments and suggesting a relatively colder and drier depositional environment. However, C4 plants increase sharply at high altitudes of 6,300–6,600 m, suggesting that the paleoclimate of Gongga Mountain became drier and wetter with the increase of altitude.
Introduction
N-alkanes and n-alkan-2-ones are abundant in almost all plants and can account for more than 60% of the epidermal lipids. Both of these organic compounds are relatively resistant to degradation after plant decay (Poynter and Eglinton, 1991). These components can show signals of their presence in the sediments (Jansen et al., 2008). Thus, the n-alkanes and n-alkan-2-ones can be particularly useful as biomarkers for understanding the source of organic matter, and for tracking ecosystem changes and reconstructing palaeo-vegetation (Nichols and Huang., 2007; Andreou and Rapsomanikis 2009; Badewien et al., 2015; Li G. et al., 2018). For example, some indexes of long-chain n-alkanes reflect the relative proportion of lower organisms such as bacteria, algae, and higher plants (Crausbay et al., 2014; Wang et al., 2014; Bush and McInerney 2015; Howard et al., 2018). These indexes include the n-alkane average chain length (ACL), the ratios of trees to grasses (n-C29/n-C31), the ratios of ∑n-C21-/∑n-C21+ in n-alkanes and a carbon preference index (CPI). In addition, the organic carbon isotope values (δ13C) can be used to estimate the relative contributions of C3 and C4 plants, infer paleoclimate changes, and to examine past primary productivity (France-Lanord and Derry 1994). Consequently, we analyzed the biomarkers and the organic carbon isotope values (δ13C) of surface sedimens along an elevation transect on the eastern slope of Gongga Mountain, ranging in elevation from 4,600 m to 6,700 m.
Some soil biomarkers may be useful tools for palaeo-vegetation reconstruction (Didyk et al., 1978; Bai et al., 2020). And while some relevant biomarker studies have previously been done on low elevation soil samples from the Gongga Mountains (Jia et al., 2008; Bezabih et al., 2011; Bai et al., 2011; 2020), the studies on high elevation sediment samples are currently lacking. The reason for this may be due to the fact that sampling becomes much more difficult as the altitude increases. Our study aimed to identify and understand the geochemical characteristics of high-altitude ecosystems in the Gongga Mountain and to reconstruct the local palaeo-vegetatio and track ecosystem changes by measuring the carbon isotope composition and lipid biomarkers in the sediments. Furthermore, in this study, we used lipid biomarkers and δ13C analyses to determine how the lipid biomarkers and carbon isotopes can be used to delineate the source of organic matter and related processes.
Sampling Area, Samples and Methods
Sampling Area and Samples
Gongga Mountain, is the highest peak (7,556 m a.s.l) in the Hengduan Mountains. It is located approximately 30°N and 102°E in the middle and southern section of the Big Snow Mountain Range and on the southeastern edge of the Tibetan Plateau in Sichuan Province, southwest China. It is a unique mountain in western China because it contains both modern low-latitude glacial features and an integrated vertical vegetation distribution ranging from subtropical forests to tundra. Compared with other mountain ranges in China, before the Gongga Mountain, the Gongga Mountain range still has an extensive area of primary coniferous and deciduous forests to an elevation of 4,000 m. With a vertical range of more than 6,300 m along only 11 km of horizontal distance, the eastward slope drops towards the Sichuan Basin in southwestern China. The mean annual temperature is 4°C. The annual rainfall is approximately 1938 mm, and 85% of the rainfall falls during May to October, according to the meteorological station located 3,000 m above sea level (a.s.l) (Alpine Ecosystem Observation and Experiment Station of Gongga Mountain, Chinese Academic of Sciences). The regional climate is characterized by typical monsoon patterns of temperature, precipitation, and evaporation. This region is influenced by both the Pacific and the Indian Ocean meteorological systems, which bring southeasterly and southwesterly monsoons, respectively. There are many special characteristics of the mountain ecosystem and environment in the Gongga Mountain Region, including tropical and subtropical cold-loving plant species (Luo et al., 2015). The hottest months occur well within the rainy season, from May to September, while evaporation peaks during the sunny, pre-monsoon months (Thomas 1997, 1999). The eastern slope of Gongga Mountain, which is the transitional zone of the first and second step in China, has disparate plant ecosystems at different elevations (Thomas 1999; Zhong et al., 1999). Gongga Mountain is therefore an area with very high biodiversity: approximately 2,500 plant species belonging to 869 genera and 185 families have been identified in this region (Thomas 1999). However, the plant species at high elevations (above the snowline) have not been reported. As a result, selected study area is 4,600–6,700 m above sea level in a typical ecosystem of Gongga Mountain east of the Tibetan Plateau (Figure 1). In June 2012, 22 surface sediment samples (5–10 cm above ground level) were collected from the eastern slope of the Gongga Mountain by removing the layers of snow, ice and litter. The samples were collected over a period of 2 weeks. The altitude of each sampling site was determined by using a GPS unit with an error of ±10 m. Samples at each location were taken from three sub-samples that were evenly mixed and bagged. These three sampling locations were collected randomly within an approximate 10 m radius using an electric drill and metal shovel. All samples were wet, and each of them was tightly sealed on site in polyethylene zipper bags. The first bag was sealed in a second, “outer,” zipper bag to insure against possible damage and leakage. Bagged samples were frozen immediately after transit to the laboratory.
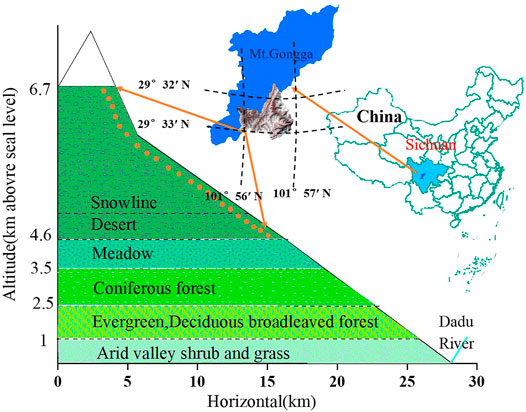
FIGURE 1. The vertical vegetation zonation and climatic conditions on the eastern slope of Gongga Mountain, according to Zhong et al. (1999), Thomas (1997) and Jia et al. (2008).
Analytical Methods
All sediment samples were dried at room temperature and crushed to 100 mesh. Powders were kept frozen at about −18°C until analysis. An aliquot (∼250 g) of each sample was Soxhlet-extracted with a mixture of dichloromethane-methanol (93:7, v/v) for 72 h, and then the extracts were separated into saturate, aromatic and polar fractions by a glass chromatographic column packed with activated silica gel and eluted by solvents of increasing polarity. The details of the extraction and separation have been published elsewhere (Wu et al., 2016). The fractions obtained were analyzed using the full scan and the selected ion monitoring (SIM) modes.
A GC-MS/MS analysis was performed using a Hewlett-Packard 7890 gas chromatograph (GC) coupled to a Hewlett-Packard 7000B mass selective detector (MSD). The GC was fitted with a HP-5 capillary column (30 m × 0.25 mm×0.25 μm, Agilent, United States), based on a previous study (Wu et al., 2016). The oven temperature was initially 80°C (1 min) and was then increased to 290°C at a rate of 4°C/min and finally held at this temperature for 30 min. Helium was used as the carrier gas at a linear velocity of 28 cm/s, with a GC inlet temperature of 300°C and the injector operating at a flow rate of 0.9 ml/min. The MSD was operated with an ionization energy of 70 eV and a source temperature of 230°C. Data were collected in full-scan mode and scanned from 10 to 550 amu.
Organic carbon isotope analyses are carried out at Oil and Gas Research Center, Northwest Institute of Eco-Environment and Resources (Chinese Academy of Sciences). Firstly, dilute hydrochloric acid was added to sediment sample to remove inorganic carbon, and then the decarbonated and dried sediment sample was analyzed using a Thermo Fisher MAT 253-Flash2000 mass spectrometer. Calibration measurements were performed using a standard reference IAEA-600 (δ13C = −27.77‰), with calculated standard deviations of less than 0.2‰ per 6 measurements resulting in δ13Corg (Coplen et al., 2006).
Results
Total Organic Carbon Content and Its Isotopes
The TOC contents of the samples range from 1.34 to 5.21% with an average value of 2.99% (Table 1). In addition, the TOC content showed a systematic variation with elevation, peaking in sediments from an elevation of 5,100 m (Table 1). The δ13C values range from −24.4‰ to −27.3‰ (Table 1), indicating that C3 plants were dominant along the eastern slope of Gongga Mountain (Wei et al., 2015).

TABLE 1. Results of TOC/δ13C(‰) analysis and calculated parameters of samples at Gongga Mountain.
Distribution of Aliphatic Hydrocarbons and Alkanones
The distributions of n-alkanes and n-alkan-2-ones were measured by mass chromatography of the fragment ions m/z 85 (Figure 2) and m/z 58 (Figure 3). These compounds were identified by comparison of measured mass spectral data and retention indices to published data (George and Jardine 1994; Wu et al., 2012). The aliphatic hydrocarbon fraction consists mainly of n-alkanes and isoprenoid alkanes (pristane (Pr) and phytane (Ph)). Straight-chain alkanes are the most abundant hydrocarbons in the extracts (Figure 2). The n-alkanes are in the C11 to C33 range, with peaks of n-C27 or n-C29, and the sediment samples studied show a uni-modal characteristic distribution. The odd over even carbon number predominance (OEP27) is significantly greater than 1.0 for all samples, ranging from 3.29 to 6.27. The carbon preference index (CPI25–31) ranges from 3.33 to 6.49, and the average chain length (ACL) ranges from 27.37 to 28.33. In samples from elevations of 4,700 m, 5,400 m, 5,800 m, 5,900 m, 6,600 m, and 6,700 m, the Pr content is higher than the Ph content, and the Pr/Ph ratios range from 1.09 to 1.51. However, in other samples, the Ph content is slightly higher than the Pr content, and the Pr/Ph ratios range from 0.66 to 0.94 (Table 2 and Figure 4).
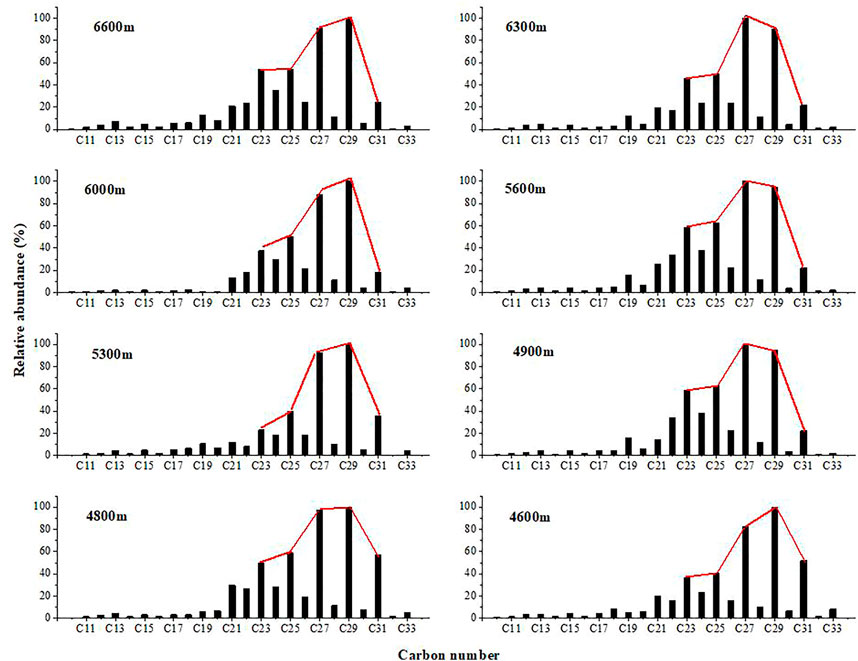
FIGURE 2. Distributions of n-alkane in the sediment samples from Gongga Mountain.
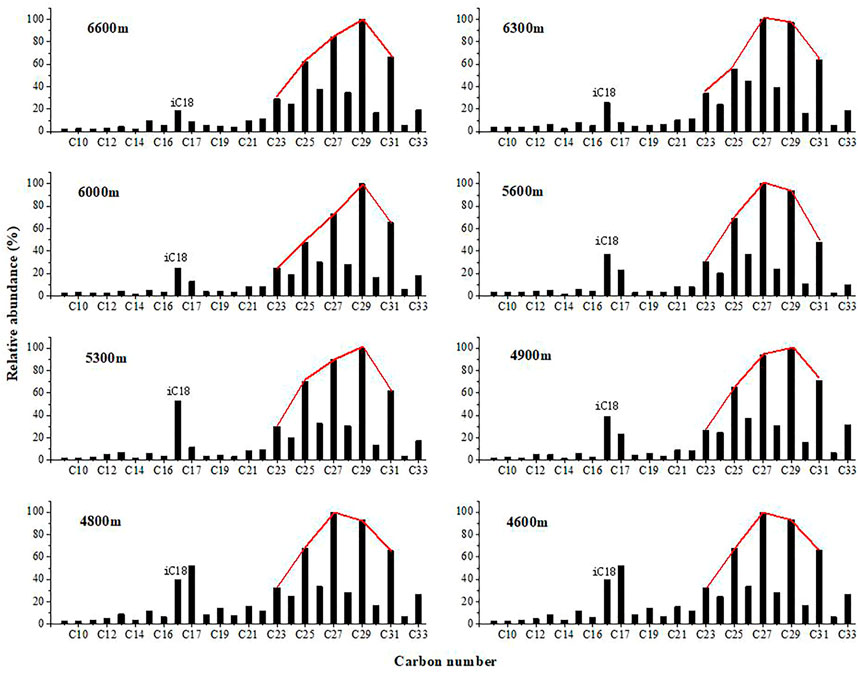
FIGURE 3. Distributions of n-alkane-2-ones in the sediment samples from Gongga Mountain.
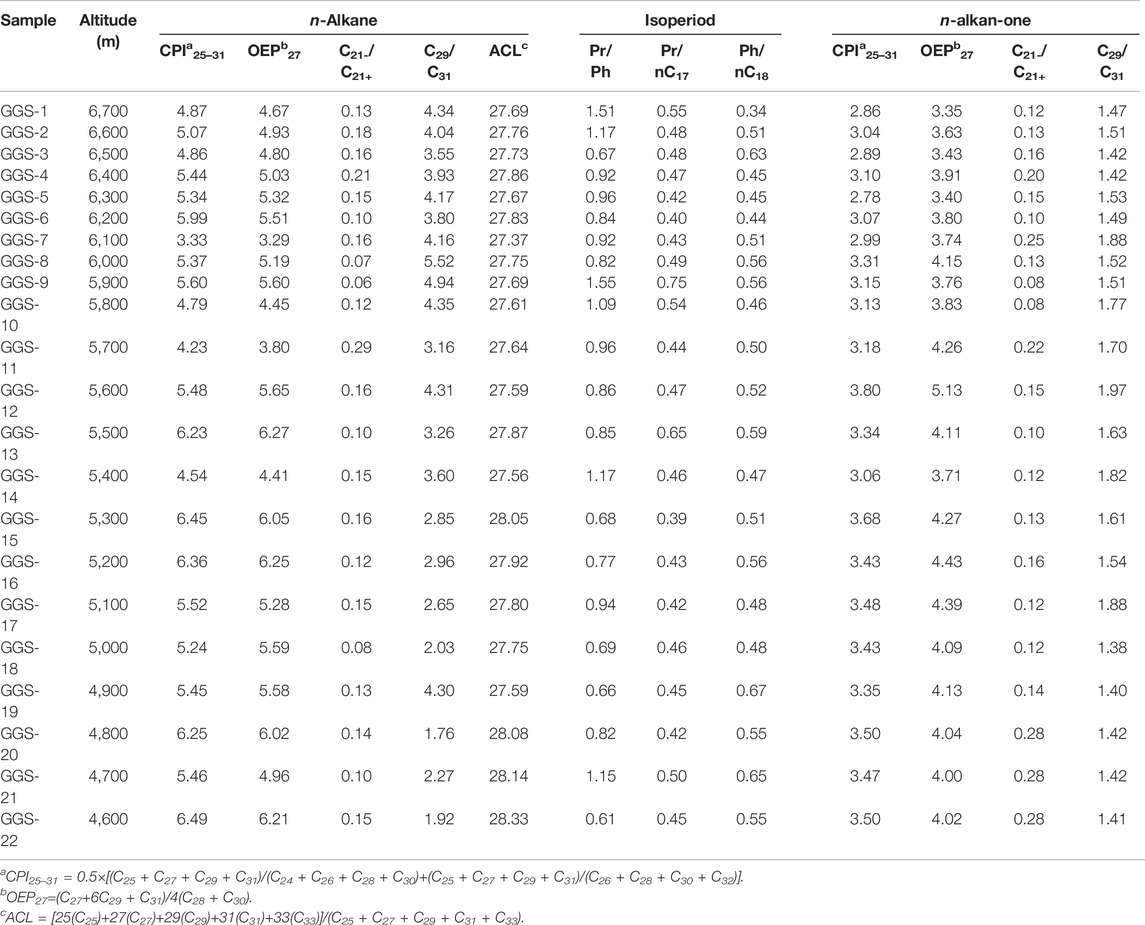
TABLE 2. Altitude and biomarker parameters of the sediment samples along eastern slope of Gongga Mountain.
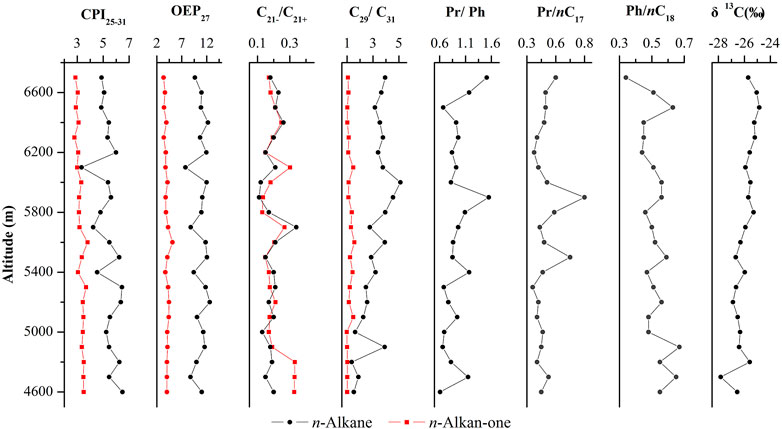
FIGURE 4. Variation of CPI25-31, OEP27, C21-/C21+, C29/C31, Pr/Ph, Pr/nC17, Ph/nC18, and δ13C of n-alkane and n-alkan-2-one in the studied samples.
The n-alkan-2-ones range from C9 to C33 and are characterized by bi-modal distributions with a higher relative abundance of the higher-molecular-weight (HMW) homologues, dominated by C27 or C29, and lower amount of short chain n-Alkan-2-ones, dominated by n-C17 or i-C18 (phytone, 6,10,14-trimethylpentadecan-2-one). The short chain components show no strong odd/even carbon number preference; however, the long chain components range from n-C23 to n-C33, with a strong odd/even preference.
Discussions
Vegetation Composition of the Study Area and Depositional Conditions
The δ13C values of TOC in soils and sediments reflect the changes of C4/C3 plant input ratios (France-Lanord and Derry 1994; Cayet and Lichtfouse, 2001; Badewien et al., 2015). Typically, C3 plants have δ13C values ranging from −20% to −32%, whereas C4 plants have δ13C values from −9% to −17% (Denies, 1980; Farquhar et al., 1989; Sukumar et al., 1993; Lim et al., 2010; Sun et al., 2012). Yang, (2012) suggested that lower temperature and reduced summer precipitation favoured C3 over C4 plant, i.e. C3 plants dominated in cooler and drier conditions, whereas C4 plants favoured warmer and wetter climates. To investigate the paleoclimates and paleoenvironments on the east side of the Tibetan Plateau, Southwest China, the δ13C values of the organic matter in sediments were determined for the sediments along the eastern slope of Gongga Mountain. As shown in Table 1 and Figure 4, these values range from −24.6‰ to −27.4‰; the lower-altitude sediments had lower δ13C values, while sediments from 6,300–6,600 m had higher δ13C values of −24.7‰, −24.7‰, −24.4‰ and −24.6‰, respectively. These results indicate that C3 plants were likely important contributors to organic compounds in the sediments. Therefore, in general, the climate was probably cold and dry along the eastern slope of Gongga Mountain. The results also showed that the lower-altitude sediments had lower δ13C values, suggesting that the more terrigenous C3 plants dominated at lower altitudes. In addition, the δ13C values of organic matter in sediments tended to be positive with increasing altitude. From this phenomenon, we speculated whether some amount of C4 plants could have been present. If C4 plants are present, then a temporary warming and wetting of the palaeoclimate at 6,300–6,600 m may have occurred. (Sukumar et al., 1993; Liu et al., 2005; Xue et al., 2014). However, its cause needs to be further investigated.
The n-alkanes were dominated by n-C27 or n-C29 with a single peak distribution (Figure 2). OEP27 was significantly greater than 1.0 for all samples (ranging between 3.29 and 6.27). Furthermore, at 4,600, 4,800, 5,200, and 5,500 m, the distribution of n-alkanes in the sediments showed a clear odd-numbered dominance, suggesting a dominant contribution from higher plants, but also a small input of algae (Lichtfous et al., 1994). In addition, no significant correlation was found between the Pr/Ph ratio and altitude. In samples from elevations of 4,700, 5,400, 5,800, 5,900, 6,600 and 6,700 m, the Pr/Ph ratios range from 1.09 to 1.51, indicating weakly oxic depositional conditions. However, in other samples, the Ph content is slightly higher than the Pr content, and the Pr/Ph ratios range from 0.66 to 0.94 (Table 2 and Figure 4). These results are indicative of a suboxic reductive environment (Hughes, Holba, and Dzou. 1995; Rontani et al., 2013).
Relationship Between δ13C Values and Altitude, Temperature and Humidity
The change in δ13C value of TOC varied between −24.6‰ and −27.3‰from 4,700 m to 6,700 m above sea level on the eastern slope of Gongga Mountain (Table 1). Linear regression analysis showed that δ13C values of sediments were positively correlated with altitude (Figure 5). The changes in δ13C value and altitude were characterized by an abrupt fall from 4,600 to 4,700 m, followed by an abrupt increase at 4,800 m. Then, the values were rather stable between 4,900 m and 6,200 m, followed by an moderate increase from 6,300 m to 6,600 m (Figure 4, 5).
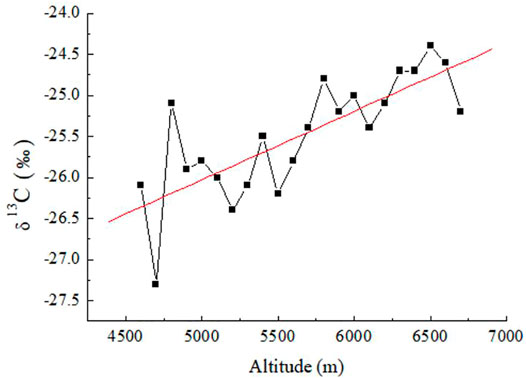
FIGURE 5. Plot of δ13C versus altitude for the analyzed sediment samples from Gongga Mountain in the Sichuan Basin.
The stable carbon isotope values (δ13C) of sediments in Gongga Mountain ranged from −24.6‰ to −27.3‰, indicating that C3 plants were the main organic inputs to the sediments (Vogts et al., 2009). The increase in C3 plants from low altitude to high altitude in Gongga Mountain was suggested to reflect the influence of decreasing temperature. Thus, the general trend showed a relatively drier and colder sedimentary environment with the increase of altitude. However, there was a sharp increase of C4 plants from 4,700 m to 4,800 m, and a mild increase of C4 plants from 6,300 m to 6,600 m. This phenomenon reflected that there may be a temporary warming trend in the altitude range of 4,700 m to 4,800 m and 6,300 m to 6,600 m. The cause of this phenomenon need to be considered in future studies.
Molecular Abundance, Distribution, Origin and Potential Significance of n-Alkanes
n-Alkanes are widely present in plants and other organisms. The source of organic matter can be traced through the distribution characteristics of n-alkanes because different biological sources of n-alkanes possess different distribution characteristics. Previous studies showed that n-alkanes from lower organisms range from n-C15 to n-C20, often with n-C17 or n-C19 as the dominant compounds and without an obvious odd-over-even preference (Eglinton and Hamilton 1967). In contrast, long-chain n-alkanes are mostly derived from epicuticular waxes of leaves from vascular higher plants (Meyers 1997; Fang et al., 2014; Cortina et al., 2016). In addition, woody plants display n-alkane distributions dominated by C27 or C29 n-alkanes, whereas grasses produce distributions dominated by the C31 n-alkane (Li et al., 2016). Hence, n-alkane distribution patterns can be used to estimate changes in vegetation types (Al-Aklabi et al., 2016). Modern organic geochemistry of molecules shows that the ratio ∑n-C21-/∑n-C21+ reflects the proportion of lower organisms, such as bacteria and algae relative to higher plants (Li G. et al., 2018). In this study, the n-alkane carbon numbers range from C11 to C33 with maxima at n-C23 to n-C31 (Figure 2) and exhibit a unimodal distribution. The main peaks of unimodal distribution are at n-C27 or n-C29, and the long-chain n-alkanes had odd-carbon-number predominance, indicating that they were mainly derived from terrestrial higher plants. As shown in Table 2, the ratio ∑n-C21-/∑n-C21+ ranged from 0.07 to 0.29 (average 0.64), also suggesting that higher plants were the main source of organic matter to sediments at elevations from 4,600 m to 6,400 m.
The n-alkane CPI in sediment is also an indicator of the sources of organic matter (Collister et al., 1994; Routh et al., 2014). Hydrocarbons composed of a mixture of compounds originating from land plant material show a predominance of odd-numbered carbon chains with CPI = 5–10 (Eglinton and Hamilton 1967; Collister et al., 1994; Bi et al., 2005; Duan and Xu 2012), whereas anthropogenic and reworked materials have low CPIs of approximately 1.0 (Bray and Evans 1961; Mille et al., 2007). CPI values close to 1.0 are also thought to indicate a greater input from marine microorganisms and/or recycled organic matter (Bi et al., 2005). High-molecular-weight n-alkanes in these sediment samples range from n-C23 to n-C33, with the most abundant being n-C27 and n-C29. A clear predominance of odd-carbon-number compounds is exhibited, as indicated by the carbon preference index (CPI25-31: 3.33–6.49, average: 5.32; OEP27: 3.80–6.25, average: 5.22) (Table 2), typical of a terrestrial leaf wax and higher plant source. This strong odd-over-even predominance indicates that the source of the n-alkanes in the sediments was terrestrial higher plants. On the other hand, the CPI values seem to be related to elevation. For instance, with the exception of sample GGS-7 (6,100 m), the CPI values from low elevation samples were higher than those samples from a high elevation. These results showed that the whole slope of Gongga Mountain was dominated by higher plants and with microbial footprints (Howard et al., 2018). Furthermore, as seen in Table 2, CPI values for samples from lower altitudes below 6,000 m ranged from 4.23 to 6.49 with an average of 5.56, indicating that n-alkanes are more often synthesized by higher plants, while CPI values for samples from higher altitudes above 6,000 m ranged from 3.33 to 5.99 with an average of 4.95, indicating that bacterial fingerprints increase with altitude.
Molecular organic geochemistry has also demonstrated that the n-C29/n-C31 ratio of n-alkanes is indicative of the relative proportion of woody plants to grassy plants (Meyers 1997; Ficken et al., 2000; Li G. et al., 2018). The C29 n-alkanes dominate the sediments and have little variability, indicating that trees dominated Gongga Mountain and that the climate was relatively stable. The ratio of the C29 n-alkane to C31 n-alkanes for all samples varied between 4.94 and 1.76, with a relatively wide range and smaller values at lower altitudes (Table 2), indicating a relatively warm and humid climate at lower altitudes. This is due to the fact that as the ratio of C29/C31 becomes smaller, C31, which represents grassy plants, gradually increases, indicating that grassy plants multiply vigorously as they prefer a relatively warm and humid climate to grow in. In addition, a high ratio of these alkanes indicates a change from a humid to an arid climate. As shown in Table 2, the average ratio of n-C29/n-C31 tends to be high (3.6 > 1) for all samples, indicating that the deposition of the top section between approximately 4,600 m to 6,700 m occurred under relatively continuous humid climate conditions.
Another useful parameter from the n-alkane distribution is the average chain length (ACL), which has been suggested to change with plant types. Woody plants display n-alkane distributions dominated by the C27 or C29 n-alkanes, whereas grasses have distributions dominated by the C31 n-alkane (Gamarra and Kahmen 2015; Li et al., 2016). The average ACL is 29.5 for grass, 28.4 for reeds and 27.9 for tree leaves (Duan and Xu 2012). Therefore, grasses usually have high ACL values relatively to those of trees. In our results, samples from elevations of 4,600, 4,700, 4,800, and 5,300 m had ACL values of 28.33, 28.14, 28.08 and 28.05, respectively, while samples from 4,900 m to 6,700 m had ACL values from 27.37 to 27.87 (Table 2 and Figure 6), which are in the range of tree leaves (Duan and Xu, 2012), indicating that woody plants were the main vegetation. In addition, a plot of ACL27-31 vs. altitude (Figure 6) showed that a quadratic relationship exists between these two variables, with lower ACL27-31 values occurring at mid altitudes and higher values occurring at low and high altitudes. The n-alkane ACL27-31 values reach a minimum in samples from 6,100 m, and the intermittent decrease in ACL in samples from 6,100 m may indicate a temporal increase in merged C4 plants. These results also suggest that the region underwent a relatively cold and wet climate because plants in colder/wetter areas have lower ACL27-31 values than those in warmer/drier areas (Zhou et al., 2005; Bush and Mclnerney 2013). Furthermore, the n-alkane mean chain length ACL27-31 ratio gradually decreased and the n-alkane (C29/C31) ratio gradually increased as altitude increased from 4,600 m to 6,100 m (ACL27-33: 27.37–28.33, average: 27.79 and C29/C31: 1.76–5.52, average: 3.54) (Table 2 and Figure 6), indicating an increase in woody plants, which produce a large proportion of the C27 and C29 n-alkanes. This pattern can be best explained in terms of vegetation; that is, woody plants dominate the paleosols, and grasses have less influences, especially near 6,000 m. The increase in the C29/C31 ratio from 4.94 to 5.52 with some oscillations in samples from 5,900 to 6,000 m is possibly caused by a decrease in grasses, which produce large proportions of the C29 n-alkane (Zhou et al., 2005). In contrast, the C29 n-alkanes dominate the sediments from 5,900 to 6,000 m and biomarkers vary with relatively greater amplitudes and at a higher frequency, indicating that woody plants were dominant and that relatively wetter conditions prevailed during these altitudes. This results in a slightly different conclusion than those drawn from other parameters: i.e., the climate became wetter and colder at 6,100 m. The explanation for this discrepancy needs to be further explored.
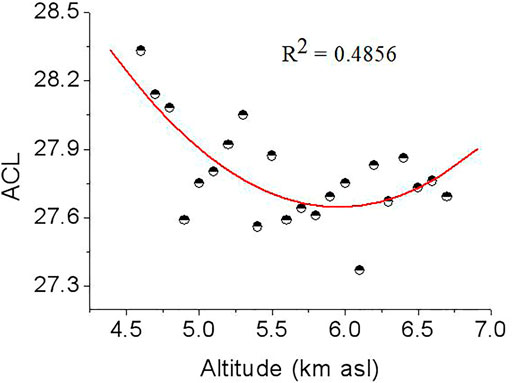
FIGURE 6. Altitudinal variations of ACL27–31. ACL27–31 is calculated from weighted-mean chain length of C25, C27, C29, C31 and C33 n-alkanes.
Distribution Characteristics and Possible Source of n-Alkan-2-ones
n-Alkan-2-ones are commonly observed lipid components of sediments from Gongga Mountain. In all samples, the n-alkan-2-ones range from C9 to C33 and have a bimodal distribution (Figure 3). Lower-molecular-weight (LMW) n-alkan-2-ones (C9-C21), which reach maximum values at n-C17 or i-C18, dominant samples from 4,600 m to 6,700 m, while higher-molecular-weight (HMW) n-alkan-2-ones (C23-C33), with a mode at C27 or C29, dominate in all samples. Their ∑n-C21-/∑n-C21+ ratios and the carbon preference indices of the HMW (C23-C33) n-alkan-2-ones (CPI) sensitively reflect the variations in the sediment ecosystem response, also indicating that the organic matter in this sediment was derived from terrestrial herbaceous plants, but was probably reworked by bacteria.
In some studies, n-alkan-2-ones that have a close resemblance to the terrigenous n-alkane distributions have led several authors to propose that microbial oxidation of n-alkanes is the source of n-alkan-2-ones, with β-oxidation of fatty acids followed by decarboxylation as an alternate pathway (Volkman et al., 1981; Albaiges, Algaba, and Grimalt 1984; Lehtonen and Ketola 1990; Nichls and Huang 2007). In Gongga Mountain sediment samples, the n-alkan-2-one distribution appears to result from the mixing of two populations of compounds: the long chain components (C23-C33), which have a strong OEP, and the short chain components (C9-C22), which have no OEP (Table 2 and Figure 3). The distribution of n-alkanes in all samples is analogous to that of the n-alkan-2-ones (Figure 2 and Figure 3), with a long-chain alkane OEP and a short-chain alkane with no OEP, indicating that n-alkan-2-ones originated from microbiological subterminal oxidation of n-alkanes (Cranwell, Eglinton, and Robinson 1987; Lehtonen and Ketola 1990). The dominance of the C29 homologue in both the HMW n-alkanes and the n-alkan-2-ones throughout the sediments suggests that the oxidation of n-alkanes is the favorable pathway (Chen et al., 2019).
Furthermore, the C29/C31 and C21-/C21+ ratio curves of n-alkanes and n-alkan-2-ones essentially parallel each other, with higher values present in samples from 5,700 m to 6,100 m, suggesting the n-alkan-2-ones may be formed from the microbial oxidation of the corresponding n-alkanes, as previously proposed (Albaiges, Algaba, and Grimalt 1984; Nichls and Huang. 2007; Wu et al., 2012).
In addition, Figure 7 shows a ternary diagram for the same three n-alkanes and n-alkan-2-ones (C27, C29 and C31) from the eastern slope of Gongga Mountain; there are two recognizable clusters in these samples. The n-alkanes cluster plots are close to the region that characterizes wood plants. However, the n-alkan-2-ones cluster plot near the position characterized by grasslands. This difference can best be explained in terms of vegetation; that is, trees dominate the components of the sediment samples, with some increase in the contribution of grasses during the warm stages.
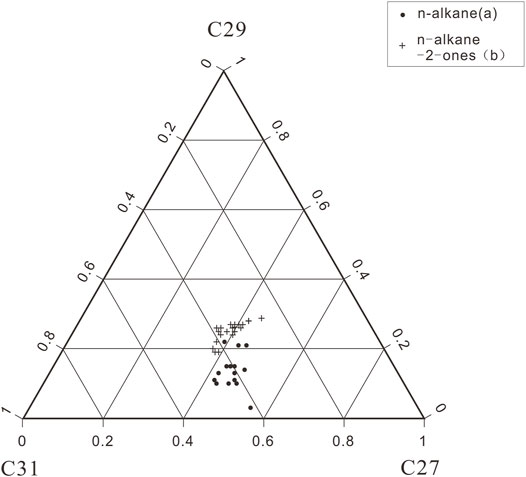
FIGURE 7. Ternary diagram for C27, C29 and C31 n-alkane and n-alkan-2-one in the studied samples.
Conclusion
The n-alkanes and n-alkan-2-ones were analyzed in sediment samples from Gongga Mountain, Sichuan Basin, on the southeastern edge of the Tibetan Plateau, southwest China. The n-alkanes and n-alkan-2-ones were from a mixed source of bacteria, algae and terrestrial higher plants, and were mainly derived from terrestrial higher plants.
The C9-C21/C23-C33 ratios and the carbon preference indices of the HMW (C23-C33) n-alkan-2-ones (CPI) of the samples sensitively reflect the variation in the sediment ecosystem’s response to climate. The CPI and ACL values of n-alkanes in sediments from low latitudes were higher than those from high latitudes. The CPI and ACL values for different climate zones can also indicate the variation in the sediment ecosystem’s response to climate.
The stable carbon (δ13C) analyses of the sediments showed that the biomes in the study area were dominated by C3 plants through paleosol cycles and cold and dry climatic conditions existed in the past.
Data Availability Statement
The original contributions presented in the study are included in the article/Supplementary material, further inquiries can be directed to the corresponding author.
Author Contributions
YW, ZC, and TW contributed ideas and design to the study and engaged in charting. YL and RM performed samples analysis and data processing. YW and TW wrote the first draft of the manuscript.
Funding
Financial support from the National Natural Science Foundation of China (Grant Nos. 42072180; 41772147; 41872146; 41272147) and the Chinese Academy of Sciences Instrument Equipment Function Development Technology Innovation Project (Grant No. E0280101).
Conflict of Interest
The authors declare that the research was conducted in the absence of any commercial or financial relationships that could be construed as a potential conflict of interest.
Publisher’s Note
All claims expressed in this article are solely those of the authors and do not necessarily represent those of their affiliated organizations, or those of the publisher, the editors and the reviewers. Any product that may be evaluated in this article, or claim that may be made by its manufacturer, is not guaranteed or endorsed by the publisher.
Acknowledgments
We are also particularly grateful to the reviewers for their constructive comments for the manuscript.
References
Al-Aklabi, A., Al-Khulaidi, A. W., Hussain, A., Al-Sagheer, N., and Al-Sagheer, N. (2016). Main Vegetation Types and Plant Species Diversity along an Altitudinal Gradient of Al Baha Region, Saudi Arabia. Saudi J. Biol. Sci. 23, 687–697. doi:10.1016/j.sjbs.2016.02.007
Albaigés, J., Algaba, J., and Grimalt, J. (1984). Extractable and Bound Neutral Lipids in Some Lacustrine Sediments. Org. Geochem. 6, 223–236. doi:10.1016/0146-6380(84)90044-5
Andreou, G., and Rapsomanikis, S. (2009). Origins of N-Alkanes, Carbonyl Compounds and Molecular Biomarkers in Atmospheric Fine and Coarse Particles of Athens, Greece. Sci. Total Environ. 407, 5750–5760. doi:10.1016/j.scitotenv.2009.07.019
Badewien, T., Vogts, A., and Rullkötter, J. (2015). n-Alkane Distribution and Carbon Stable Isotope Composition in Leaf Waxes of C3 and C4 Plants from Angola. Org. Geochem. 89-90, 71–79. doi:10.1016/j.orggeochem.2015.09.002
Bai, Y., Chen, Q., Zhou, Y., Fang, X., and Liu, X. (2020). Terpenoids in Surface Soils from Different Ecosystems on the Tibetan Plateau. Org. Geochem. 150, 104125. doi:10.1016/j.orggeochem.2020.104125
Bai, Y., Fang, X., Gleixner, G., and Mügler, I. (2011). Effect of Precipitation Regime on δD Values of Soil N-Alkanes from Elevation Gradients - Implications for the Study of Paleo-Elevation. Org. Geochem. 42, 838–845. doi:10.1016/j.orggeochem.2011.03.019
Banerjee, A., Sinha, A. K., Jain, A. K., Thomas, N. J., Misra, K. N., and Chandra, K. (1998). A Mathematical Representation of Rock-Eval Hydrogen Index vs Tmax Profiles. Org. Geochem. 28, 43–55. doi:10.1016/S0146-6380(97)00119-8
Behar, F., Beaumont, V., and De B. Penteado, H. L. (2001). Rock-Eval 6 Technology: Performances and Developments. Oil Gas Sci. Technol. - Rev. IFP 56, 111–134. doi:10.2516/ogst:2001013
Bezabih, M., Pellikaan, W. F., Tolera, A., and Hendriks, W. H. (2011). Evaluation of N-Alkanes and Their Carbon Isotope Enrichments (δ13C) as Diet Composition Markers. Animal 5 (1), 57–66. doi:10.1017/S1751731110001515
Bi, X., Sheng, G., Liu, X., Li, C., and Fu, J. (2005). Molecular and Carbon and Hydrogen Isotopic Composition of N-Alkanes in Plant Leaf Waxes. Org. Geochem. 36, 1405–1417. doi:10.1016/j.orggeochem.2005.06.001
Bray, E. E., and Evans, E. D. (1961). Distribution of N-Paraffins as a Clue to Recognition of Source Beds. Geochimica Cosmochimica Acta 22, 2–15. doi:10.1016/0016-7037(61)90069-2
Bush, R. T., and McInerney, F. A. (2015). Influence of Temperature and C 4 Abundance on N -alkane Chain Length Distributions across the Central USA. Org. Geochem. 79, 65–73. doi:10.1016/j.orggeochem.2014.12.003
Bush, R. T., and McInerney, F. A. (2013). Leaf Wax N-Alkane Distributions in and across Modern Plants: Implications for Paleoecology and Chemotaxonomy. Geochimica Cosmochimica Acta 117, 161–179. doi:10.1016/j.gca.2013.04.016
Carvajal-Ortiz, H., and Gentzis, T. (2015). Critical Considerations when Assessing Hydrocarbon Plays Using Rock-Eval Pyrolysis and Organic Petrology Data: Data Quality Revisited. Int. J. Coal Geol. 152, 113–122. doi:10.1016/j.coal.2015.06.001
Cayet, C., and Lichtfouse, E. (2001). δ13C of Plant-Derived N-Alkanes in Soil Particle-Size Fractions. Org. Geochem. 32, 253–258. doi:10.1016/s0146-6380(00)00172-8
Chen, L., Zhou, W., Zhang, Y., Zheng, Y., and Huang, X. (2020). Postglacial Floral and Climate Changes in Southeastern China Recorded by Distributions of N-Alkan-2-Ones in the Dahu Sediment-Peat Sequence. Palaeogeogr. Palaeoclimatol. Palaeoecol. 538, 109448. doi:10.1016/j.palaeo.2019.109448
Chen, Z., Liu, X., Guo, Q., Jiang, C., and Mort, A. (2017). Inversion of Source Rock Hydrocarbon Generation Kinetics from Rock-Eval Data. Fuel 194, 91–101. doi:10.1016/j.fuel.2016.12.052
Cheshire, S., Craddock, P. R., Xu, G., Sauerer, B., Pomerantz, A. E., McCormick, D., et al. (2017). Assessing Thermal Maturity beyond the Reaches of Vitrinite Reflectance and Rock-Eval Pyrolysis: A Case Study from the Silurian Qusaiba Formation. Int. J. Coal Geol. 180, 29–45. doi:10.1016/j.coal.2017.07.006
Collister, J. W., Rieley, G., Stern, B., Eglinton, G., and Fry, B. (1994). Compound-specific δ 13C Analyses of Leaf Lipids from Plants with Differing Carbon Dioxide Metabolisms. Org. Geochem. 21, 619–627. doi:10.1016/0146-6380(94)90008-6
Coplen, T. B., Brand, W. A., Gehre, M., Gröning, M., Meijer, H. A. J., Toman, B., et al. (2006). New Guidelines for δ13C Measurements. Anal. Chem. 78 (7), 2439–2441. doi:10.1021/ac052027c
Cortina, A., Grimalt, J. O., Rigual-Hernández, A., Ballegeer, A.-M., Martrat, B., Sierro, F. J., et al. (2016). The Impact of Ice-Sheet Dynamics in Western Mediterranean Environmental Conditions during Terminations. An Approach Based on Terrestrial Long Chain N-Alkanes Deposited in the Upper Slope of the Gulf of Lions. Chem. Geol. 430, 21–33. doi:10.1016/j.chemgeo.2016.03.015
Cranwell, P. A., Eglinton, G., and Robinson, N. (1987). Lipids of Aquatic Organisms as Potential Contributors to Lacustrine Sediments-II. Org. Geochem. 11, 513–527. doi:10.1016/0146-6380(87)90007-6
Crausbay, S., Genderjahn, S., Hotchkiss, S., Sachse, D., Kahmen, A., and Arndt, S. K. (2014). Vegetation Dynamics at the Upper Reaches of a Tropical Montane Forest Are Driven by Disturbance over the Past 7300 Years. Arct. Antarct. Alp. Res. 46, 787–799. doi:10.1657/1938-4246-46.4.787
Deines, P. (1980). “The Isotopic Composition of Reduced Organic Carbon,” in Handbook of Environmental Isotopic GeochemistryThe Terrestrial Environment. Editors P. Fritz, and J. C. Fontes (Amsterdam: Elsevier), Vol. 1, 329–406. doi:10.1016/B978-0-444-41780-0.50015-8
Demaison, G., and Huizinga, B. J. (1994). “Genetic Classification of Petroleum Systems Using Three Factors: Charge, Migration Entrapment,” in The Petroleum Systems: From Source to Trap. Editors L. B. Magoon, and W. G. Dow (Tulsa: AAPG Memoir), 60, 73–80. doi:10.1002/dev.21263
Didyk, B. M., Simoneit, B. R. T., Brassell, S. C., and Eglinton, G. (1978). Organic Geochemical Indicators of Palaeoenvironmental Conditions of Sedimentation. Nature 272, 216–222. doi:10.1038/272216a0
Duan, Y., and Xu, L. (2012). Distributions of N-Alkanes and Their Hydrogen Isotopic Composition in Plants from Lake Qinghai (China) and the Surrounding Area. Appl. Geochem. 27, 806–814. doi:10.1016/j.apgeochem.2011.12.008
Eglinton, G., and Hamilton, R. J. (1967). Leaf Epicuticular Waxes. Science 156, 1322–1335. doi:10.1126/science.156.3780.1322
Fang, J., Wu, F., Xiong, Y., Li, F., Du, X., An, D., et al. (2014). Source Characterization of Sedimentary Organic Matter Using Molecular and Stable Carbon Isotopic Composition of N-Alkanes and Fatty Acids in Sediment Core from Lake Dianchi, China. Sci. Total Environ. 473-474, 410–421. doi:10.1016/j.scitotenv.2013.10.066
Farquhar, G. D., Ehleringer, J. R., and Hubick, K. T. (1989). Carbon Isotope Discrimination and Photosynthesis. Annu. Rev. Plant. Physiol. Plant. Mol. Biol. 40, 503–537. doi:10.1146/annurev.pp.40.060189.002443
Ficken, K. J., Li, B., Swain, D. L., and Eglinton, G. (2000). An N-Alkane Proxy for the Sedimentary Input of Submerged/floating Freshwater Aquatic Macrophytes. Org. Geochem. 31, 745–749. doi:10.1016/s0146-6380(00)00081-4
France-Lanord, C., and Derry, L. A. (1994). δC of Organic Carbon in the Bengal Fan: Source Evolution and Transport of C3 and C4 Plant Carbon to Marine Sediments. Geochimica Cosmochimica Acta 58 (21), 4809–4814. doi:10.1016/0016-7037(94)90210-0
Gamarra, B., and Kahmen, A. (2015). Concentrations and δ2H Values of Cuticular N-Alkanes Vary Significantly Among Plant Organs, Species and Habitats in Grasses from an Alpine and a Temperate European Grassland. Oecologia 178, 981–998. doi:10.1007/s00442-015-3278-6
George, S. C., and Jardine, D. R. (1994). Ketones in a Proterozoic Dolerite Sill. Org. Geochem. 21, 829–839. doi:10.1016/0146-6380(94)90042-6
Howard, S., McInerney, F. A., Hall, P. A., and Andrae, P. A. (2018). Modelling Leaf Wax N -alkane Inputs to Soils along a Latitudinal Transect across Australia, Org. Geochem. 121. 126–137, doi:10.1016/j.orggeochem.2018.03.013
Hughes, W. B., Holba, A. G., and Dzou, L. I. P. (1995). The Ratios of Dibenzothiophene to Phenanthrene and Pristane to Phytane as Indicators of Depositional Environment and Lithology of Petroleum Source Rocks. Geochimica Cosmochimica Acta 59, 3581–3598. doi:10.1016/0016-7037(95)00225-o
Jackson, L. L., and Roof, S. R. (1992). Determination of the Forms of Carbon in Geologic Materials. Geostand. Newsl. 16, 317–323. doi:10.1111/j.1751-908X.1992.tb00495.x
Jansen, B., Haussmann, N. S., Tonneijck, F. H., Verstraten, J. M., and de Voogt, P. (2008). Characteristic Straight-Chain Lipid Ratios as a Quick Method to Assess Past Forest-Páramo Transitions in the Ecuadorian Andes. Palaeogeogr. Palaeoclimatol. Palaeoecol. 262, 129–139. doi:10.1016/j.palaeo.2008.02.007
Jia, G., Wei, K., Chen, F., and Peng, P. a. (2008). Soil N-Alkane δD vs. Altitude Gradients along Mount Gongga, China. Geochimica Cosmochimica Acta 72 (21), 5165–5174. doi:10.1016/j.gca.2008.08.004
Lehtonen, K., and Ketola, M. (1990). Occurrence of Long-Chain Acyclic Methyl Ketones in Sphagnum and Carex Peats of Various Degress of Humification. Org. Geochem. 15, 275–280. doi:10.1016/0146-6380(90)90005-K
Li, G., Li, L., Tarozo, R., Longo, W. M., Wang, K. J., Dong, H., et al. (2018a). Microbial Production of Long-Chain N-Alkanes: Implication for Interpreting Sedimentary Leaf Wax Signals. Org. Geochem. 115, 24–31. doi:10.1016/j.orggeochem.2017.10.005
Li, M., ChenCao, Z. T. T., Cao, T., Ma, X., Liu, X., Li, Z., et al. (2018). Expelled Oils and Their Impacts on Rock-Eval Data Interpretation, Eocene Qianjiang Formation in Jianghan Basin, China. Int. J. Coal Geol. 191, 37–48. doi:10.1016/j.coal.2018.03.001
Li, Y. Y., Yang, S. L., Wang, X., Hu, J. F., Cui, L. L., Huang, X. F., et al. (2016). Leaf Wax N-Alkane Distributions in Chinese Loess since the Last Glacial Maximum and Implications for Paleoclimate. Quat. Int. 399, 190–197. doi:10.1016/j.quaint.2015.04.029
Lichtfous, R., Derenne, S., Mariotti, A., and Largeau, C. (1994). Possible Algal Origin of Long Chain Odd N-Alkanes in Immature Sediments as Revealed by Distributions and Carbon Isotope Ratios. Org. Geochem. 22, 1023–1027. doi:10.1016/0146-6380(94)90035-3
Lim, J., Nahm, W. H., Kim, J. K., and Yang, D. Y. (2010). Regional Climate-Driven C3 and C4 Plant Variation in the Cheollipo Area, Korea, during the Late Pleistocene. Palaeogeogrphy Palaeoclimatol. Palaeoecol. 298, 370–377. doi:10.1016/j.palaeo.2010.10.021
Liu, W. G., Huang, Y. S., An, Z. S., Clemens, S. C., Li, L., Prell, W. L., et al. (2005). Summer Monsoon Intensity Controls C4/C3 Plant Abundance during the Last 35 Ka in the Chinese Loess Plateau: Carbon Isotope Evidence from Bulk Organic Matter and Individual Leaf Waxes. Palaeogeogrphy Palaeoclimatol. Palaeoecol. 220, 243–254. doi:10.1016/j.palaeo.2005.01.001
Luo, J., Tang, R. G., Sun, S. Q., Yang, D. D., She, J., and Yang, P. J. (2015). Lead Distribution and Possible Sources along Vertical Zonespectrum of Typical Ecosystems in the Gongga Mountain, Eastern Tibetan Plateau. Atmos. Environ. 115, 132–140. doi:10.1016/j.atmosenv.2015.05.022
Meyers, P. A. (1997). Organic Geochemical Proxies of Paleoceanographic, Paleolimnologic, and Paleoclimatic Processes. Org. Geochem. 27, 213–250. doi:10.1016/S0146-6380(97)00049-1
Mille, G., Asia, L., Guiliano, M., Malleret, L., and Doumenq, P. (2007). Hydrocarbons in Coastal Sediments from the Mediterranean Sea (Gulf of Fos Area, France). Mar. Pollut. Bull. 54, 566–575. doi:10.1016/j.marpolbul.2006.12.009
Nichols, J. E., and Huang, Y. S. (2007). C23-C31 N-Alkan-2-Ones Are Biomarkers for the Genus Sphagnum in Foreshwater Peatlands. Org. Geochem. 38, 1972–1976. doi:10.1016/j.orggeochem.2007.07.002
Peters, K. E. (1986). Guidelines for Evaluating Petroleum Source Rock Using Programmed Pyrolysis. AAPG Bull. 70, 318–329. doi:10.1306/94885688-1704-11d7-8645000102c1865d
Peters, K. E., and Moldowan, J. M. (1993). The Biomarker Guide, Interpreting Molecular Fossils in Petroleum and Ancient Sediments. Choice Rev. Online 30, 2690. doi:10.5860/choice.30-2690
Poynter, J., and Eglinton, G. (1991). The Biomarker Concept-Strengths and Weaknesses. Fresenius' J. Anal. Chem. 339, 725–731. doi:10.1007/BF00321733
Robison, C. R. (1997). Hydrocarbon Source Rock Variability within the Austin Chalk and Eagle Ford Shale (Upper Cretaceous), East Texas, U.S.A. Int. J. Coal Geol. 34, 287–305. doi:10.1016/s0166-5162(97)00027-x
Rontani, J., Bonin, P., Vaultier, F., Guasco, S., and Volkman, J. K. (2013). Anaerobic Bacterial Degradation of Pristenes and Phytenes Inmarine Sediments Does Not Lead to Pristane and Phytane during Early Diagenesis. Org. Geochem. 58, 43–55. doi:10.1016/j.orggeochem.2013.02.001
Routh, J., Hugelius, G., Kuhry, P., Filley, T., Tillman, P. K., Becher, M., et al. (2014). Multiproxy Study of Soil Organic Matter Dynamics in Permafrost Peat Deposits Reveal Vulnerability to Climate Change in the European Russian Arctic. Chem. Geol. 368, 104–117. doi:10.1016/j.chemgeo.2013.12.022
Sukumar, R., Ramesh, R., Pant, R. K., and Rajagopalan, G. (1993). A δ13C Record of Late Quaternary Climate Change from Tropical Peats in Southern India. Nature 364. 703–705. doi:10.1038/364703a0
Sun, J. M., Lv, T. Y., Zhang, Z. Q., Wang, X., and Liu, W. G. (2012). Stepwise Expansions of C4 Biomass and Enhanced Seasonal Precipitation and Regional Aridity during the Quaternary on the Southern Chinese Loess Plateau. Quat. Sci. Rev. 34, 57–65. doi:10.1016/j.quascirev.2011.12.007
Thomas, A. (1999). Overview of the Geoecology of the Gongga Shan Range, Sichuan Province, China. Mt. Res. Dev. 19, 17–30. doi:10.2307/3674110
Thomas, A. (1997). The Climate of the Gongga Shan Range, Sichuan Province, PR China. Arct. Alp. Res. 29, 226–232. doi:10.2307/1552051
Vogts, A., Moossen, H., Rommerskirchen, F., and Rullktter, J. (2009). Distribution Patterns and Stable Carbon Isotopic Composition of Alkanes and Alkan-1-Ols from Plant Waxes of African Rain Forest and Savanna C3 Species. Org. Geochem. 40, 1037–1054. doi:10.1016/j.orggeochem.2009.07.011
Volkman, J. K., Gillan, F. T., Johns, R. B., and Eglinton, G. (1981). Source of Neutral Lipids in a Temperate Intertidal Sediment. Geochimica Cosmochimica Acta 45, 1817–1828. doi:10.1016/0016-7037(81)90012-0
Wang, N., Zong, Y. Q., Brodie, C. R., and Zheng, Z. (2014). An Examination of the Fidelity of N-Alkanes as a Palaeoclimate Proxy from Sediments of Palaeolake Tianyang, South China. Quat. Int. 333, 100–109. doi:10.1016/j.quaint.2014.01.044
Wang, Y. L., Fang, X. M., Zhang, T. W., Li, Y. M., Wu, Y. Q., He, D. X., et al. (2010). Predominance of Even Carbon-Numbered N-Alkanes from Lacustrine Sediments in Linxia Basin, NE Tibetan Plateau: Implications for Climate Change. Appl. Geochem. 25, 1478–1486. doi:10.1016/j.apgeochem.2010.07.002
Wei, J., Liu, W. G., Cheng, J. M., and Li, W. J. (2015). δ13C Values of Plants as Indicators of Soil Water Content in Modern Ecosystems of the Chinese Loess Plateau. Ecol. Eng. 77, 51–59. doi:10.1016/j.ecoleng.2015.01.012
Wu, Y. q., Wang, Y. l., Lei, T. Z., Chang, J., and Xia, Y. Q. (2012). Possible Origin of High Molecular Weight N-Alkan-2-Ones in Jurassic Bitumens from the Sichuan Basin in Southwest China. Chem. Technol. Fuels Oils 48, 195–201. doi:10.1007/s10553-012-0358-8
Wu, Y. q., Xia, Y. Q., Wang, Y. l., Lei, T. Z., Liu, Y., Liu, Y. H., et al. (2016). The Geochemical Characteristics of Coals from the Junggar Basin in Northwest China and the Relation of the Configuration of Pristane with Maturity in Highly Mature and Over-mature Samples. Oil Gas Sci. Technol. 71, 1–11. doi:10.2516/ogst/2015026
Xue, J. B., Zhong, W., and Cao, J. Y. (2014). Changes in C3 and C4 Plant Abundances Reflect Climate Changes from 41,000 to 10,000 Yr Ago in Northern Leizhou Peninsula, South China. Palaeogeogrphy Palaeoclimatol. Palaeoecol. 396, 173–182. doi:10.1016/j.palaeo.2014.01.003
Yang, S. L. (2012). Warm-season Precipitation as the Dominant Control on C3/C4 Plant Variations in Northern china: Evidence from Carbon and Oxygen Isotope Composition of Pedogenic Carbonate. Quat. Int. 279-280, 546. doi:10.1016/j.quaint.2012.08.1919
Zhong, X. H., Zhang, W. J., and Luo, J. (1999). The Characteristics of the Mountain Ecosystem and Environment in the Gongga Mountain Region. Ambio 28, 648–654. CNKI:SUN:RLHJ.0.1999-08-003.
Keywords: n-alkanes, n-alkan-2-ones, geochemical features, carbon isotope composition, Gongga Mountain
Citation: Wu Y, Wang T, Liu Y, Ma R and Chen Z (2022) Carbon Isotope Composition and Geochemical Features of Sediments From Gongga Mountain, China, and Potential Environmental Implications. Front. Earth Sci. 10:865575. doi: 10.3389/feart.2022.865575
Received: 30 January 2022; Accepted: 19 May 2022;
Published: 09 June 2022.
Edited by:
Zhang Chengjun, Lanzhou University, ChinaReviewed by:
Yufeng Jiang, Lanzhou Jiaotong University, ChinaJianfa Chen, China University of Petroleum, China
Copyright © 2022 Wu, Wang, Liu, Ma and Chen. This is an open-access article distributed under the terms of the Creative Commons Attribution License (CC BY). The use, distribution or reproduction in other forums is permitted, provided the original author(s) and the copyright owner(s) are credited and that the original publication in this journal is cited, in accordance with accepted academic practice. No use, distribution or reproduction is permitted which does not comply with these terms.
*Correspondence: Yingqin Wu, eWluZ3Fpbnd1QGx6Yi5hYy5jbg==; Zhangxin Chen, emhhY2hlbkB1Y2FsZ2FyeS5jYQ==
†These authors have contributed equally to this work and share first authorship