 Chong Zhang
 Wen Zhou1*
 Hao Xu
95% of researchers rate our articles as excellent or good
Learn more about the work of our research integrity team to safeguard the quality of each article we publish.
Find out more
ORIGINAL RESEARCH article
Front. Earth Sci. , 08 April 2022
Sec. Structural Geology and Tectonics
Volume 10 - 2022 | https://doi.org/10.3389/feart.2022.865355
This article is part of the Research Topic Quantitative Characterization and Engineering Application of Pores and Fractures of Different Scales in Unconventional Reservoirs View all 24 articles
Buried hill oil reservoirs have become a key area for offshore oil and gas exploration. In this paper, a typical oil field in the western South China Sea is used as the research object, and a study on the characterization, cause of formation and prediction of the fracture–cavity reservoir distribution is carried out. The reservoir in the study area is a complex fracture–cavity reservoir that developed due to weathering and leaching, tectonic movement and dissolution reconstruction on the limestone skeleton. The reservoir spaces are composed of karst caves, fractures and pores. The main controlling factors include lithological changes, karst landforms, tectonic deformation and faulting. To address the controlling mechanisms of the lithological changes on the formation of fracture–cavity reservoirs, a new parameter, the lithology standard deviation, to evaluate lithological changes is proposed based on the characteristics of the lithological changes, and the distribution of these lithological changes is portrayed in combination with the seismic attributes. The tectonic deformation principal curvature inversion algorithm is used to simulate the distribution of the tectonic principal curvature at the top of the Carboniferous. The larger the tectonic principal curvature is, the stronger the deformation of the rock formation and the more favorable the conditions are for fracture formation. The karst geomorphology controls the overall reservoir distribution, and the karst highlands and karst slope areas are the zones with the most–developed secondary pore space (or fractures and karst caves). The faulting control area is the fracture and dissolution pore development area, major faults control the distribution of the karst cave reservoirs, and secondary faults influence the formation of fractures in the faulted area. The study predicts and evaluates the distribution of fracture–cavity reservoirs from the perspective of fracture–cavity genesis quantification, and by gridding and normalizing the four major genesis quantification evaluation parameters and fusing the geological factors that control the formation of fractures and karst caves by using Back–Propagation neural network deep learning algorithms, a method for predicting the distribution of fracture–cavity reservoirs constrained by geological genesis analysis is developed.
Buried hill reservoirs have become key areas for offshore oil and gas exploration in recent years and have very high resource potential (Lu and Cai., 2010; Du et al., 2011). As exploration progresses, the exploration potential for tectonic reservoirs, such as anticlines and fault blocks, decreases (Jiang et al., 2014; Yin et al., 2018a; Yin et al., 2018b; Guo et al., 2020; Kang, 2020; Santosh and Feng., 2020; Chen et al., 2021). The buried carbonate hills in the Beibuwan Basin and buried granite hills in the deep water area of the Qiongdongnan Basin are gradually highlighted by their high resource potential as the focus of future oil and gas research in the western South China Sea (Yang, 2016; Zhao et al., 2019; Li et al., 2020; Xue et al., 2021).
The Weixinan Depression is located in the most hydrocarbon–rich depression that is indicated in the Beibuwan Basin of the western South China Sea (Ma et al., 2014; Li et al., 2015). The buried carbonate hills are mainly located between two major faults within the depression, and the current level of exploration is relatively low. However, drilling has revealed active oil and gas displays in the area (Zhang et al., 2015), with high tested production amounts per well (up to thousands of cubic meters per day).
Several buried carbonate hill reservoirs or oil–bearing formations have been discovered in the area, which demonstrate that the area has broad exploration and development prospects in the buried–hill field (Zhao et al., 2018). At present, several buried carbonate hill reservoirs or oil–bearing structures have been found in this area, which indicate that this area has broad prospects for the exploration and development of buried hills.
The buried carbonate hills in the Weixinan Depression consist of a set of thick light gray microcrystalline–fine grained carbonate strata. The Weizhou 1–N oilfield is a representative buried–hill carbonate reservoir in the Weixinan Depression (Figure 1). During the drilling process, most wells experienced mud and sea water loss and drilling tool cavitation, which indicate that buried–hill fractures and karst caves are well developed in this area. The oilfield has a high production capacity, but the reservoir distribution is extremely complex. Only five out of 11 wells obtained industrial oil flows, and the results of the later adjustment wells did not reach expectations. This occurred mainly because the distributions of fractures and karst caves are complex, and the development of fracture–cavity reservoirs is highly random. The formation of fracture–cavity reservoirs is controlled by factors such as lithology, tectonic movement, weathering and denudation time, paleoclimate and paleolandscape location in the area where buried hills developed. Even in the same area, the fracture cavity development characteristics of the drilled wells are not consistent, which make it difficult to predict the quality of reservoirs. The development of seam holes is the key to the formation of high–quality reservoirs. Understanding the development characteristics and formation mechanisms of seam holes in this area is an important basis for understanding the development law of high–quality reservoirs in buried carbonate hills (Yan, 2002; Xiao J et al., 2003), which is of great significance to the development and adjustment of buried carbonate hills in the Weixinan Depression.
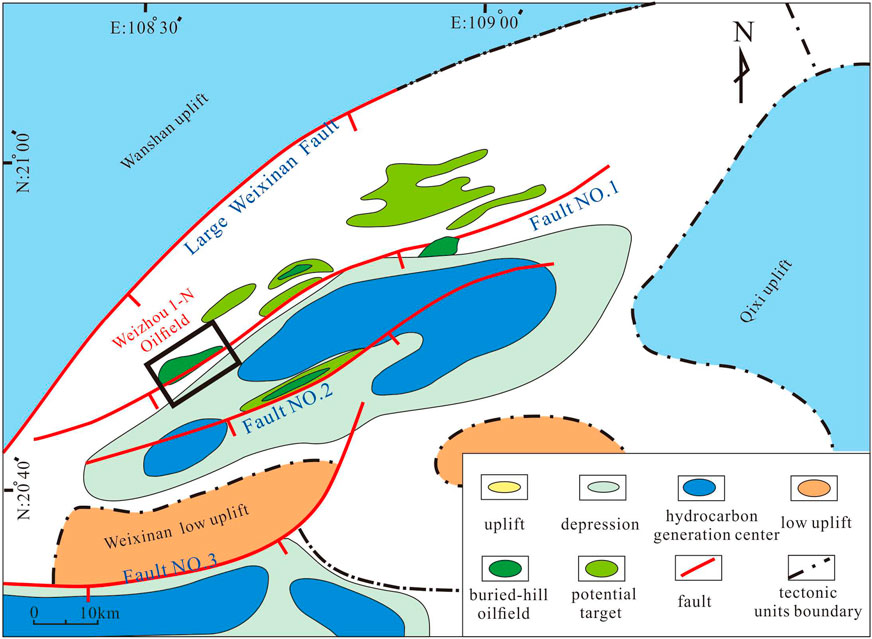
FIGURE 1. Buried–hill distribution and tectonic location of the Weizhou 1–N oilfield in the Weixinan Depression.
The buried hill in the Weixinan Depression is mainly composed of marine Carbon–iferous strata (Xiao J et al., 2003). After the Carboniferous deposition, the area mainly experienced three major tectonic cycles, including the Indosinian tectonic movement, Yanshan and Himalayan Movement (Zhao et al., 2018). In the late Hercynian Movement, the Carboniferous strata were uplifted and exposed at the surface and were altered by weathering and formed carbonate weathering crust reservoirs. During the Indosinian and Yanshan Movements, a series of large NE–trending faults were generated, and the Weixinan large fault succession resulted in a series of NE–trending extensional faults (Tong et al., 2018), of which fault No. One was one, which thus formed the rudimentary shape of the current buried hill. In the third stage of the Himalayan movement, the buried hill was formed, the Beibuwan Basin also entered a depression development stage from a fault depression stage, and the strata changed from a differential uplift movement to large–area subsidence movement stage (Li, 2012; Sun et al., 2014; Gan et al., 2017).
The buried hill of the Weizhou 1–N oilfield limestone is located on the upthrown side of the No. One fault in the northern Weixinan Depression, which consists of an uplifted basement and ancient buried–hill trap that were buried after denudation. The relatively high part of the structure developed in a zonal pattern from southwest to northwest, the buried–hill shape is complete, and the buried hill is distributed in a northeast direction along fault No. 1 (Figure 1). The target strata were reached by each well in the Carboniferous Huangliu Formation, and the lithologies mainly consist of light gray and gray granular biological limestone, micritic biological limestone, and calcareous silt–crystal dolomite (Figure 2). From the Permian to Cretaceous, the buried hill was exposed to the surface for a long period and experienced strong weathering and erosion, which created favorable conditions for the development of fractures and karst caves (Zhao et al., 2019, 2018).

FIGURE 2. Stratigraphic and lithology profiles of the Carboniferous strata in the Weixinan Depression.
The core observations are based on core wells that were drilled to encounter the Carboniferous Huanglong Formation, with a total observed core length of 40.06 m and core harvest rate of 72.5%. A total of 290 cast thin sections were taken from rock chips or from the cores of four wells. Core and cast body thin section observations can clarify the lithology, filling characteristics of the small–scale fractures and cavities, fracture opening degrees, and dissolution pore development, which can be used as constraints for seam hole analyses and reservoir predictions.
The standard deviation (STD DEV) is a statistical term used in mathematics to measure the degree to which a data distribution of is scattered and quantifies the degree to which the data values deviate from the arithmetic mean (Wang, 2009; Chen et al., 2013; Mahmud et al., 2020; Qie et al., 2021). The smaller the standard deviation, the less these values deviate from the mean, and vice versa (Zhang and Song., 1981; Gu., 2006; Dong et al., 2020; Yoshida and Santosh., 2020; Wang and Wang., 2021).
From the above definition, it can be seen that the standard deviation reflects the degree of dispersion of the numerical values relative to the mean value. Therefore, this paper proposed defining a standard deviation value that reflects the dispersion degree of the single–layer thicknesses and average thicknesses of the strata in the longitudinal direction of a reservoir as the lithology standard deviation. The specific expression is as follows:
where LSD–lithology standard deviation, dimensionless; hi–single layer thickness, m;
The lithologies in this area change rapidly, and these lithology changes will cause differences in the thickness of a single rock layer in the formation. Therefore, the new parameter, lithology standard deviation, can be used to describe the change characteristics of the longitudinal lithology of the buried hill reservoir in this area. The smaller the lithology standard deviation is, the more dramatic the thickness changes are.
Numerical simulations of the deformation process of rock formations by using mathematical physical methods have been used to obtain the distribution of the ancient strain field during rock deformation to evaluate the fracture development and are an important research direction in fracture research (Cao and Liu., 2008; Chen et al., 2020; Lan et al., 2021; Mirzaei-Paiaman and Ghanbarian., 2021). The simulation method using the tectonic principal curvature was first proposed by Murray, which applies the combination of trend surface analysis and the difference method to calculate the principal curvatures of tectonic surfaces by using discrete data at the tectonic level (Zhou., 1998; Yin et al., 2020a; Hong et al., 2020; Yin and Wu., 2020; Yang et al., 2021).
By mathematically describing an abstractly constructed surface as a mathematical surface, S, and by establishing a fixed reference system; then, the surface S can be uniquely determined by the Equation z = f (x, y). Then, tectonic trend surface fitting was carried out for the top tectonic surface of a certain stratum (Kong et al., 2011; Liu et al., 2012; Hu, 2018; Yin et al., 2020b; Zhang et al., 2020). When the fitting degree exceeds 85%, the trend surface equation is obtained as follows:
Based on the above tectonic surface trend equation, we can calculate the principal curvature values by using the following equation:
Where:
According to the calculation results, the maximum principal curvature of a point on the plane is plotted to obtain the curvature distribution, which can be used to evaluate the distribution characteristics of fractures that are caused by tectonic deformation.
Neural network deep learning algorithms have been widely used in various research fields (Kaba, 2018; Yin et al., 2019a; Yin et al., 2019b; Shen, 2019; Taesic et al., 2019; Zhang et al., 2019). The neural network training process generally uses a learning sample set, which is as known as the error back propagation (BP) algorithm for training, by calculating the errors between the output values and the expected values (E). If this process cannot achieve the desired outputs in the output layer, then back propagation occurs by adjusting the connection weights among the output layer, hidden layer and input layer and the values of the hidden layer and output layer until the error signal is minimized.
For the neurons that are in the input layer of the BP model, the output is the same as the input, while the calculation formula for the neurons in the hidden middle layer and for the output layer is as follows:
where p is the current input sample number, Wji is the connection weight from Neuron I to Neuron J, Opi is the current input of Neuron J, and OPJ is its output. When the BP network uses the steepest descent method, the transformation function uses the sigmoid function. The function is expressed as follows:
The network output error is set as follows:
Then, the error generated by all samples in the entire training set is calculated as follows:
If j is the output node, then:
If J is not an output node, then:
The unified weight adjustment formula for the BP network is as follows:
When the error signal is at a minimum, the connection power and threshold between the networks no longer change, which thus predicts the unknown information with similar input conditions as the training information.
The buried carbonate hills in the study area were exposed to the surface over long geological periods and experienced severe weathering, denudation and karstification and formed many secondary pore spaces. According to the analysis of the drilling and core testing data, three types of carbonate reservoir spaces are present in the buried hills: karst caves, fractures and pores (Figure 3).
(1) Karst cave.
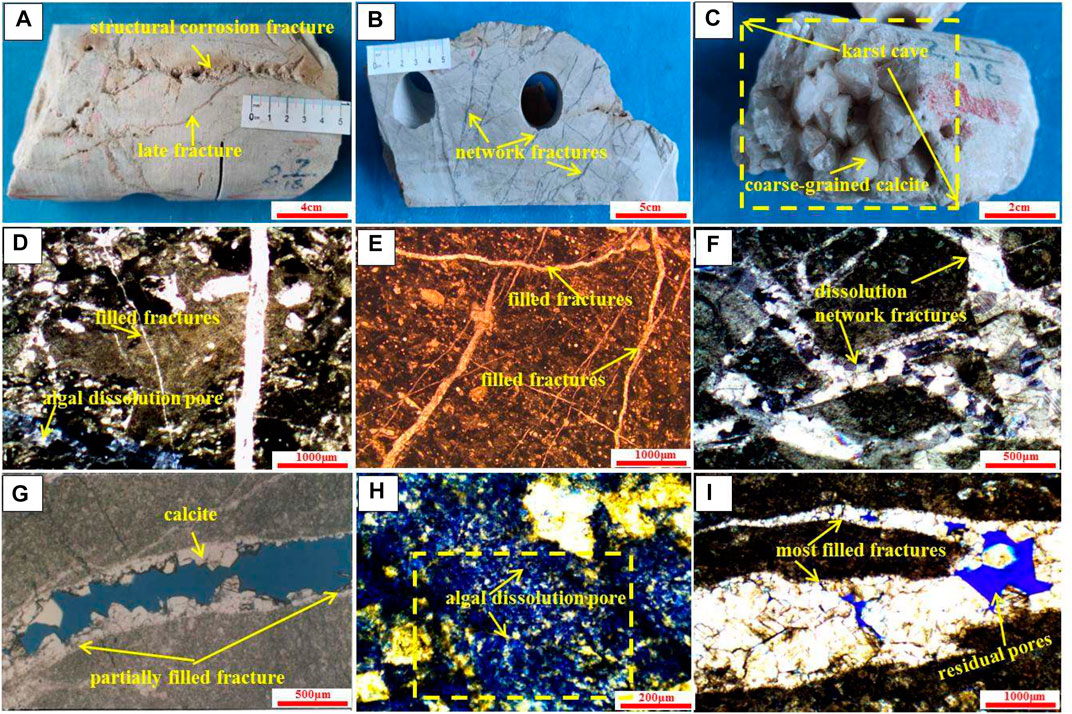
FIGURE 3. Carbonate reservoir space characteristics in the buried hills of the Weixinan Depression. (A) W1–N1, 1,553 m, grainy biological limestone, and the tectonic fractures cut and restrict each other. The early fractures are filled with medium–coarse calcite, the width of the fractures is 0.4 mm, there are a few dissolution pores along the fractures, and the growth of the late fractures is restricted by the early fractures. (B) W1–N1, 1,554 m, grain–white biological limestone with reticulated weathering fractures, which are generally filled with fine–grained calcite. (C) W1–N1, 1,556 m, karst caves filled with horse–tooth–shaped giant calcite crystals, the karst cave diameter is 6 cm, and light crude oil flows out of the core. (D) W1–N2, 1,587 m, algal limestone, with a tectonic fracture with a width of 160 μm and several tectonic and weathering fractures with widths of less than 10 μm are all filled with sparry calcite. (E) W1–N3, 1,612 m, bioclastic limestone, the weathering fractures and tectonic fractures cut each other, and the fractures are filled with sparry calcite. (F) W1–N3, 1,615 m, bioclastic limestone with obvious recrystallization and dissolved network fractures filled with medium–coarse grain calcite with only a few residual pores. (G) W1–N1, 1,555.65, residual pores in the semifilled fractures with good connectivity. (H) W1–N3, biological algal limestone, local red algae dissolved into pores and relatively developed pores. (I) Well W1–N1, 1,555.8 m, bioclastic limestone with residual pores in the fractures.
This term mainly refers to those karst caves that were formed by dissolution or col–lapse, which usually include unfilled, half–filled and fully filled caves. Karst caves are well developed in this area. There are 11 wells in total, nine of which exhibited cavitation phenomena and a total of 28 karst caves (18 of which are in the reservoir section), while the cave heights are 0.1–10 m. These caves are unfilled or half–filled karst caves, which are the most favorable reservoirs in this area. The core and logging data indicate that the karst caves are fully filled with chemical precipitation. The filling minerals are coarse–giant crystal calcite–coarse crystals and can be produced in the shape of horse teeth (Figure 3C). Light oil can be seen flowing from between the crystals, which indicates that small amounts of pore space can still be reserved in the chemically filled karst caves in this area.
(2) Fractures.
The fractures are generally developed and are mainly vertically oriented with high–angle fractures (Figure 3A), the fracture densities in a single well range from 10 to 20 fractures/m, and the fracture density at the core surface is 0.56 fractures/cm2. Fractures are also extremely developed in the microscopic rock thin sections, fractures are present in each of the 40 core thin sections, with an average of 11.4 fractures per thin section, and the effective fractures (e.g., semifilled and unfilled fractures) account for approximately 27% of the total number of fractures. The fractures in buried hill reservoirs are often formed by multiple geological factors. Observations of the rock thin sections and cores identify the presence of both weathering fractures and tectonic fractures in this area, which developed in roughly equal proportions. The tectonic fractures tend to extend over large scales, with dissolution occurring along the fracture faces, the fracture openings are generally large (Figure 3A), and the fracture faces are often partially filled or fully filled with medium–to coarse–crystalline calcite (Figures 3B–F). The relationship between the fracture filling rates and fracture cutting surfaces suggests that the tectonic fractures in the area can be divided into at least three periods of formation (Figure 3E), the early stage fractures are fully filled with calcite; the middle stage fractures are semifilled with calcite, while small crystal cavities are often developed in the fractures; and the late stage fractures are slightly filled or unfilled. The weathering fractures are curved, are mostly reticulate or dendritic, and are mostly filled with fine or powdered calcite (Figure 3B), with only a few residual intergranular pores, which are less effective than tectonic fractures.
(3) Pores.
The reservoir pores consist mainly of intercrystalline pores and microdissolved pores, which are mainly developed in algal limestone (Figure 3H), and residual pores in the fractures can also be seen (Figures 3G, I). According to the statistics of the 40 core thin sections, the face rate is generally in the range of 1.5–3%, and the maximum rate can be up to 8%.
In summary, the formation of karst caves, fractures and pores is closely related. The dissolution pores that develop in rocks can reduce the mechanical strength of these rocks, and it is easier to form fractures under the action of the same stress. Fracture formation is often accompanied by the additional occurrence of dissolution, and the formation of karst caves often results from the further dissolution of fractures and pores. The fractures cut each other, dissolution pores and fractures accompany each other, karst caves are formed in fractures, and the karst caves and fractures are connected to each other, which form complex storage spaces in this area.
Since rocks are the basis for the formation of carbonate reservoir space, the formation of seam holes is closely related to the lithology, and frequent lithological changes cause the non–homogeneity of seam hole development (Zhao W et al., 2011; Li et al., 2012; Tian et al., 2012; Zuo et al., 2019). The lithology of this area is based on bioclastic limestone, which was later modified by strong diagenesis. In the shallow burial period of the Upper Carboniferous, the bioclastic limestone and crystalline limestone permeated and reflow dolomitization occurred under the action of evaporative brine produced by local tidal flat and lagoon environment, which resulted in extremely complex lithologies in this area. To better characterize such complex lithology change characteristics, the lithologies in this area are classified based on to changes in the relative dolomite contents in the rocks through thin section and well logging calibration. According to the differences in dolomite contents, the lithologies can be divided into limestone, dolomite–bearing limestone, dolomitic limestone, lime–bearing dolostone, lime dolostone and dolostone (Table 1). The pure limestones are subdivided into granular limestone and micritic limestone according to its structure.

TABLE 1. Carbonate rock type classification standard (Zhou, 1998).
To characterize the lithology change characteristics between wells, the thickness of each single rock layer was calculated, and the degree of dispersion between the thickness of each single rock layer and the mean thickness of the single rock layers in the reservoir were calculated by using the mathematical representation method based on the lithology standard deviation; thus, the longitudinal lithology changes were described. The smaller the lithology standard deviation is, the more drastic are thickness changes between the different lithologies. Figure 4 shows the connected well comparison diagram of the Weizhou 1–N oilfield. From left to right are the N1, N2, N3, N4 and N5 wells of the Weizhou 1–N oilfield. The calculated lithology standard deviations for each well are 16.72, 22.01, 15.78, 13.04 and 11.21. The standard deviation of the lithology in well N5 is the smallest, and the lithology changes the fastest.
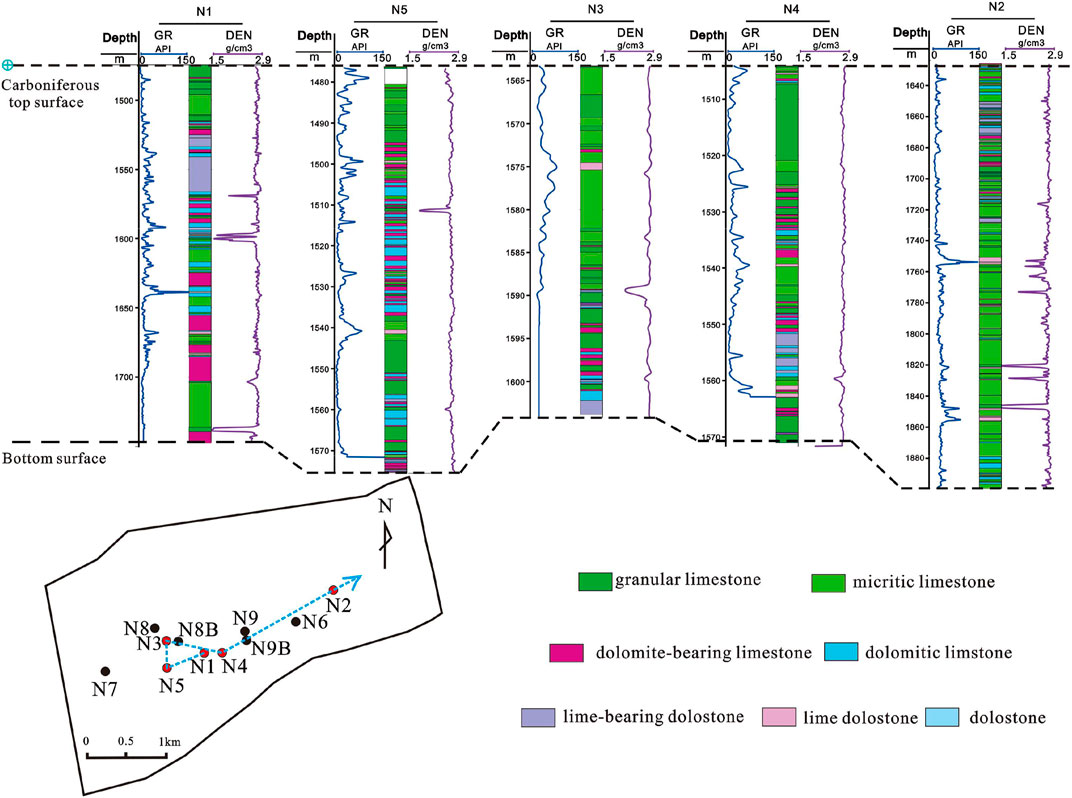
FIGURE 4. Lithology division and comparison diagram of Weizhou 1–N oilfield.
To describe the distribution of the lithology changes in plane and space, a variety of seismic attributes that are related to lithology changes were extracted by using the Schlumberger Petrel seismic interpretation platform, and the seismic attributes that can reflect lithology changes were chosen by analyzing the correlations among the seismic attributes and the lithology standard deviations. The seismic attributes that were chosen, which include the maximum amplitude, average instantaneous frequency and half energy, have obvious correlations with the lithology standard deviation, and the correlation coefficients are 0.9810, 0.7102, and 0.8679, respectively (Figure 5). The BP neural network deep learning algorithm is used to fit the lithology standard deviation values of the wells with the seismic attributes that can reflect lithology changes, and the calculation model for the lithology standard deviation is then established. Finally, the plane distribution characteristics of the lithology standard deviation are simulated. Figure 6 shows that the lithology standard deviations in the fault clamping area of the Weizhou 1–N oilfield are small, which reflect the rapid changes in lithology.
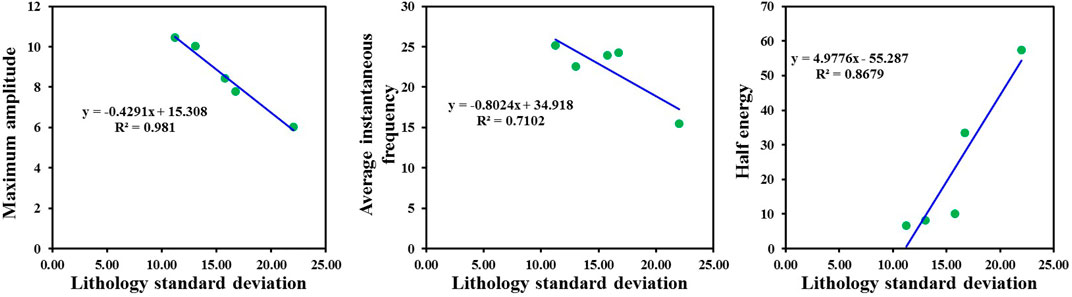
FIGURE 5. Correlation analysis between seismic attributes and lithology standard deviation.
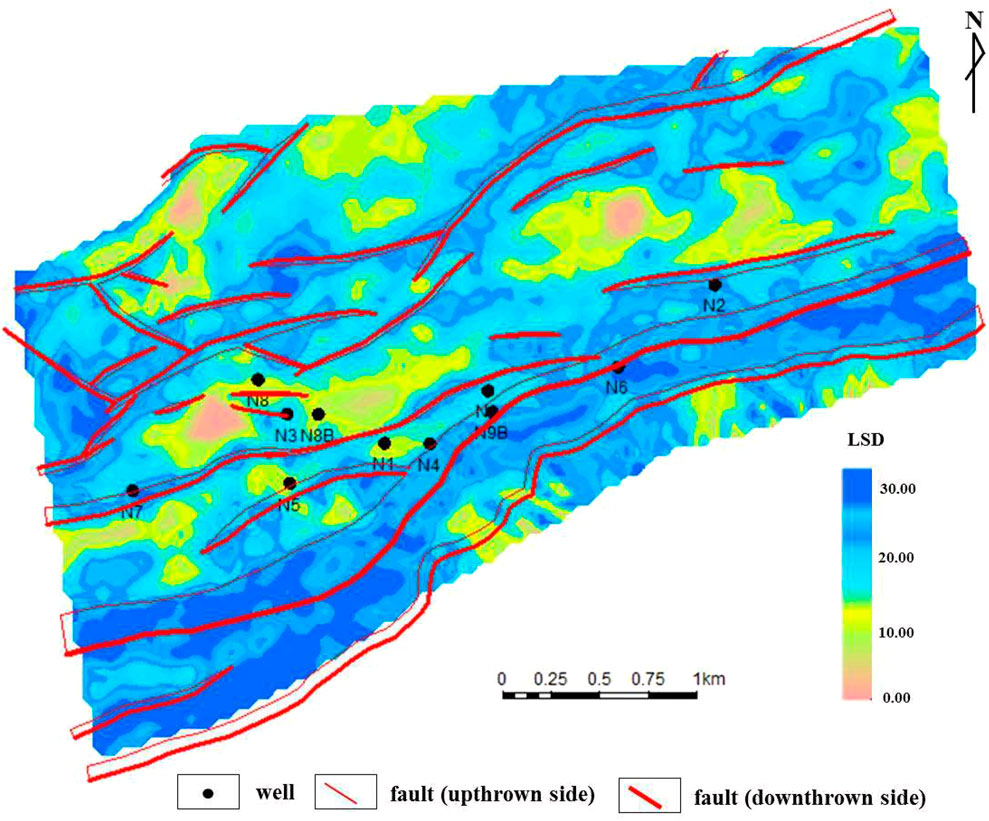
FIGURE 6. Lithology standard deviation (LSD) plane distribution of the Weizhou 1–N oilfield.
Due to the influences of multiple geological effects, such as leaching, dissolution, tectonics and filling, the buried hill reservoir in the study area developed numerous empty caves, mechanically filled these caves with clastic rocks, mineral precipitation–filled caves, fractures and dissolution pores on the basis of limestone being the main rock skeleton, and have formed an extremely complex system of fracture–cavity systems. The seismic imaging data in this area are poor, and it is difficult to characterize and identify the small and medium–sized fractures and caves. Analysis of the main geological factors that controlled the formation of fractures and caves is of great significance for predicting fracture–cavity reservoirs (Makeen et al., 2021; Radwan et al., 2020; Yin et al., 2019c). Combined with drilling in the exploration stage and production, it is considered that the formation of high–quality fracture–cavity reservoirs in this area was mainly affected by four factors: lithology changes, karst landforms, tectonic deformations and faulting.
(1) Lithology changes.
Rocks with similar lithologies and certain thicknesses often have similar rock mechanics properties (Saein and Riahi., 2017; Yin et al., 2019a; Zen et al., 2010). Rocks with different lithologies vary greatly in their rock strengths, have different mechanical properties, and therefore vary in their ease of fracturing (Hower and Groppo., 2021). The changes in rock properties show the changes in rock thicknesses in the longitudinal direction. Under the same stress, thin rock layers are more prone to fracture under similar burial depths, structural positions and lithologies. The density of fracture development is significantly negatively correlated with the rock thickness; that is, the fracture density decreases with increasing rock thickness, which was also confirmed by a number of studies (Fan et al., 2008; Li and Fan., 2011; Liu et al., 2020; Mohammed et al., 2021). The buried limestone hill reservoir in the Weixinan Depression has been subjected to different degrees of dolomitization. Due to the large differences in crystallization intensity, the mechanical strengths of the rocks also changed. Affected by the uneven crystallization intensities, there are weak surfaces between the crystals and original rock, and the rock is more prone to fracturing. In summary, lithology changes should be an important factor for influencing the differences in fracture cavity development. The correlation between the fracture–cavity relative density which is the ratio of fracture–cavity thickness to thickness of target stratum in well profile and lithology standard deviation of a single well in the study area is statistically analyzed (Figure 7). The results show that the smaller the lithology standard deviation is, the higher the fracture–cavity relative density is, and the more intense the lithology changes are, the more likely a fracture cavity is to be formed.
(2) The ancient karst landform.
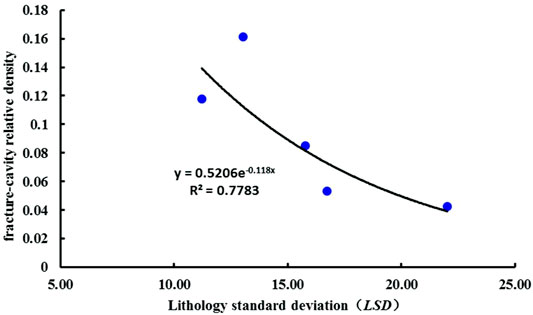
FIGURE 7. Relationship between lithology standard deviation (LSD) and fracture–cavity relative density.
The ancient karst landform in the study area formed under humid climate conditions. The scales of buried karst hills are small and are similar to the modern karst in Guilin. Due to the influence of a humid climate, atmospheric precipitation is frequent and surface runoff is high, which caused erosion and leaching in the upper and slope parts of the buried hill over a long period. The intensity of these factors is also high, which easily causes the development of dissolution holes (Fu et al., 2001; Kang and Wu., 2003; Xu et al., 2005; He et al., 2010; Zhang et al., 2021). The production wells in this area are located in karst highlands and karst slope areas (Figure 8). The drilling results have also revealed that these areas are those with the strongest leaching and most developed secondary pores (or fractures and karst caves). The time thicknesses of the described karst landform are normalized. The larger the relative elevation of the karst landform is, the higher the ancient landform position was, and the higher the fracture cavity relative density and cumulative oil production are (Figure 9), which indicate that the ancient karst landform had an important controlling effect on the development of fractures and karst caves and on the reservoir output capability.
(3) Tectonic deformation strength.
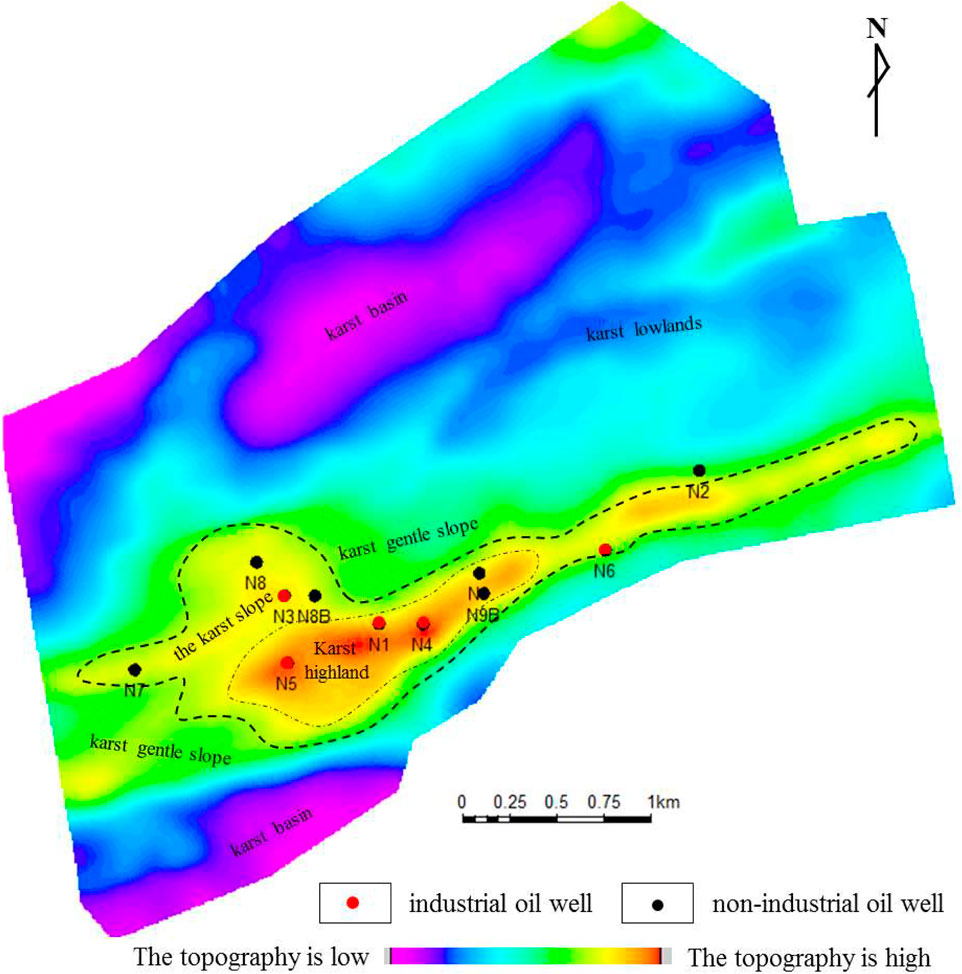
FIGURE 8. Distribution of the ancient karst landform in the Weizhou 1–N oilfield.
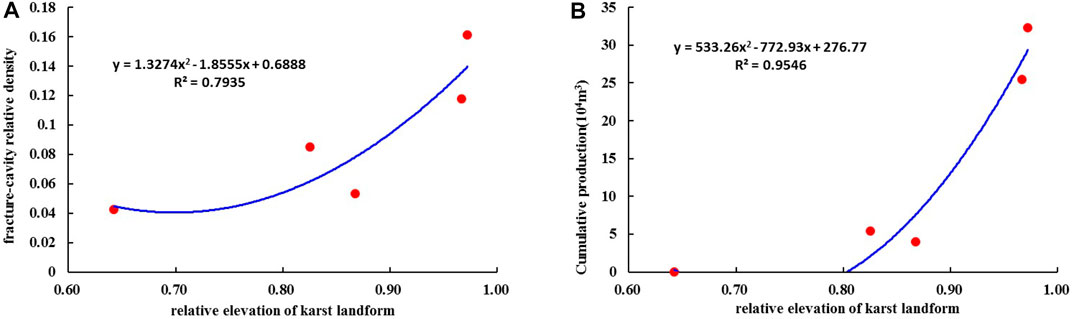
FIGURE 9. (A) Relationships between the relative elevations of the karst landform and the fracture–cavity relative densities. (B) Relationships between the relative elevations of the karst landform and the cumulative yields.
The tectonic principal curvature distribution usually determines the development law of tectonic fractures, and the formation of tectonic fractures is an important channel for the expansion and dissolution of secondary fractures and cavities (Atkinson and Meredith., 1987; Ma, 2005). The tectonic principal curvature distribution of the top surface of the Carboniferous in the Weizhou 1–N oilfield is simulated (Figure 10). Based on the results of single–well fracture and fracture–cavity identifications, the control of tectonic deformation on fracture–cavity formation is comprehensively analyzed (Figure 11). The study shows that there is a significant positive correlation between the tectonic principal curvature and relative density of fractures, and the larger the tectonic deformation intensity is, the more developed the fracturing is. However, the relationship between the tectonic principal curvature and relative development density of karst caves is obviously poor, which indicates that the formation of fracture–cavity reservoirs is a complex process, but most formed by further dissolution and expansion along the early fracture network system. Therefore, the relative development density of karst caves has no obvious corre–lation with the tectonic principal curvature distribution, but fracture cavities are often developed in areas with relatively high intensities of tectonic deformation.
(4) Faulting.
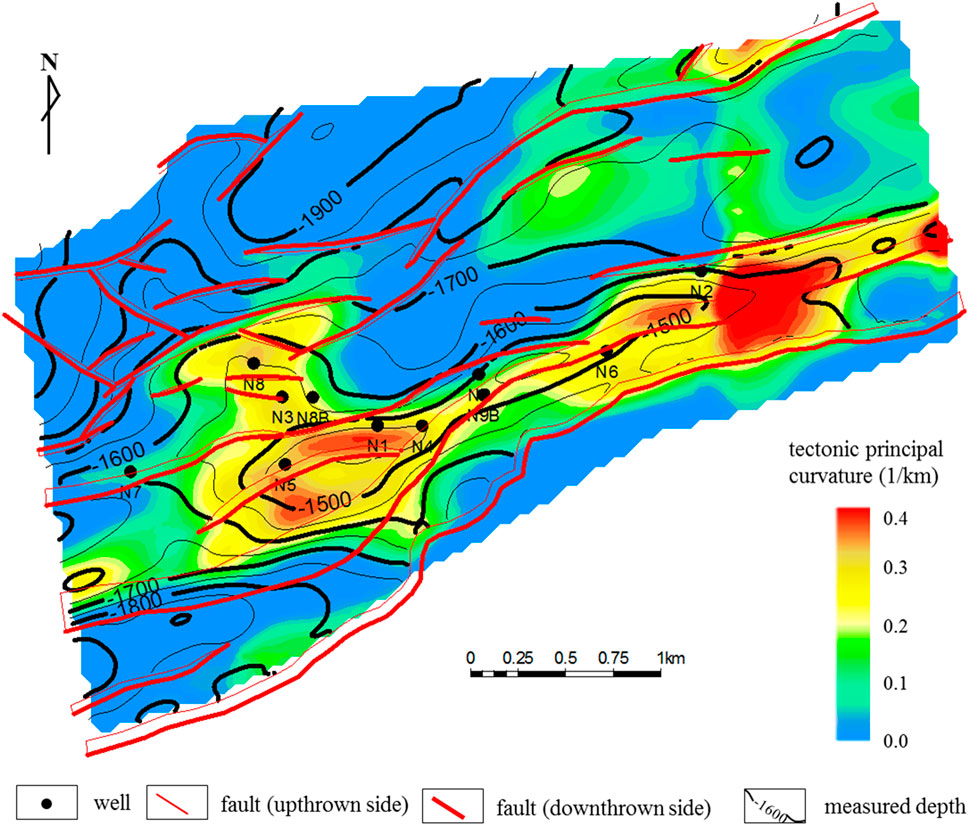
FIGURE 10. Distribution of the tectonic principal curvature at the top surface of the Carboniferous in the Weizhou 1–N oilfield.
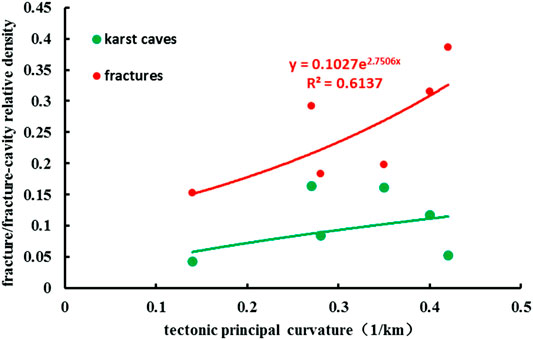
FIGURE 11. Relationship between the tectonic principal curvature and relative density of fractures or karst caves.
Faults are the macroscopic manifestations of formation fractures. Faults and fractures coexist and promote each other. Fracture formation promotes the formation of dissolved pores and holes in soluble rocks (Ren et al., 2018; Zhao et al., 2018; Ding et al., 2021). Based on the analysis of the fault system in the study area, the faults in this area can be divided into two types: major faults and secondary faults. The fault directions are mainly NNE, which represent normal faults. The faults in the study area have obvious controlling effects on the distributions of fractures and karst caves. It is evident from the thickness proportion distribution of the karst cave reservoir that faults control the formation of karst cave reservoirs (Figure 12). The controlling effect for large faults is strong and that for small faults is relatively weak. The fracture densities and relative densities of karst cave development in each well were calculated, and the faults were classified according to the fault sizes. The curves showing the relationships of the fracture density and karst cave density of each well with the distance of the major fault and F4 secondary fault were fitted. Figure 13A shows that there is no obvious relationship between the karst cave density and distance from the fault, which indicates that secondary faults such as F4 have a weak level of control on the formation of karst caves, but the fracture density has a good relationship with the distance from the fault. The closer the distance from the fault, the more developed a fracture is. Figure 13B shows that the major fault has a significant controlling effect on the formation of karst caves. The closer to the major fault, the greater the density of karst caves. However, the fracture density has no obvious relationship with the distance from the major fault. It is speculated that this is because the fractures that formed near the major fault are more likely to dissolve to form larger–scale karst caves, which result in the fracture information being obscured. Figures 13A, B also show that the range of control of the secondary fault on fracture formation is within 150 m from the fault. The range of control of the major fault on karst cave formation is within 200 m from the fault.
(5) Evolution pattern of fracture–cave reservoirs
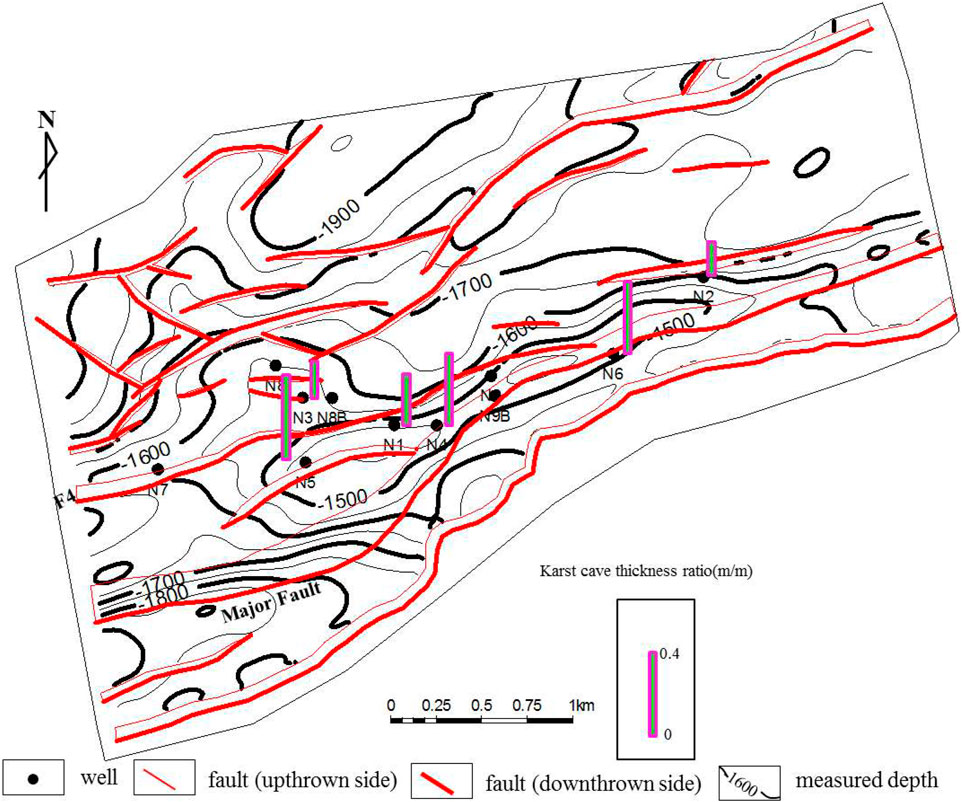
FIGURE 12. Faults distribution in the Weizhou 1–N oilfield.
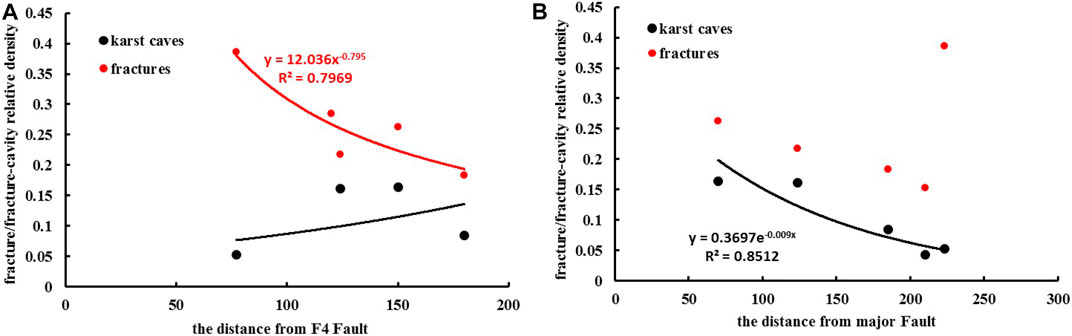
FIGURE 13. (A) Relationship between fracture–cavity density and distance from the F4 secondary fault. (B) Relationship between fracture–cavity density and distance from the major fault.
The dolomites in this area formed mainly by metasomatism in the late quasi–contemporaneous period. Mud crystal calcareous sediments were exposed at the surface, and freshwater and seawater mixed to dolomitize the sediments. Sea level changed many times, which resulted in the formation of rocks with different dolomitization intensities and complex lithology combinations (Figure 14A). In the Middle Triassic, regional uplift occurred in the early Indosinian movement, missing the Middle Triassic. Folding and faulting resulted in large numbers of structural fractures in the Huanglong Formation. The Late Jurassic and Yanshan movements uplifted the area again, which resulted in folds, faults and weathering erosion. Until the Early Tertiary, the area was subjected to weathering erosion and corrosion leaching, and large numbers of karst caves and dissolved pores developed. Due to the uplift of the region, folds and faults occurred in the strata. The folds caused bending deformation of the strata, and the derived local tensile stresses ruptured the strata and resulted in vertical structural fractures. The greater the deformation intensity of the strata is, the more developed the fractures are (Figure 14B). Faulting can form shear stress fields near fault zones and result in new fractures. A strong deformation zone is located near the fault, the fractures are highly developed, and the development level of the fractures far from the fault is lower (Figure 14C). The buried hill has been exposed to the surface for a long time. Before the deposition of the Early Tertiary Changliu Formation, many large, medium and small pores and dissolution joints developed due to weathering leaching and dissolution over a long geological period. The weathering zone exhibited undulations along the paleotopographic surface (Figure 14D). The strata with different dolomitization intensities in the Weizhou 1–N buried hill were affected by paleokarst weathering, fold deformation and faulting, which formed a complex fracture–cavity reservoir development pattern (Figure 14E). The zones with smaller rock thicknesses, stronger tectonic folding, faults and higher paleotopography are the most developed zones.
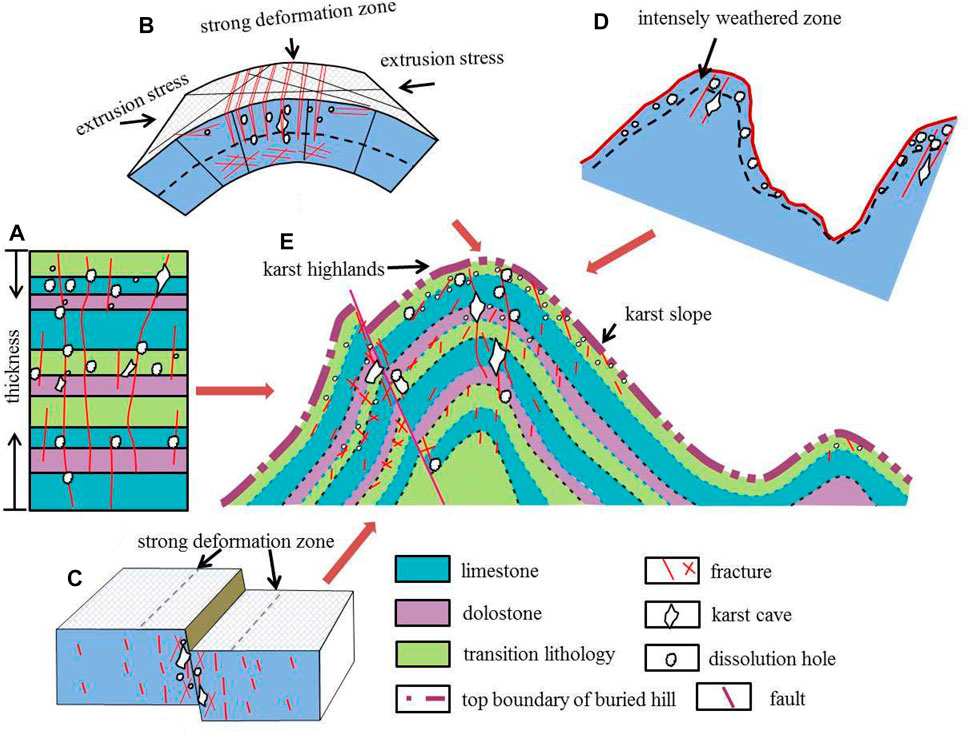
FIGURE 14. (A) The controlling patern of lithology on fracture formation. (B) The controlling patern of structural deformation on fracture formation. (C) The controlling patern of faulting on fracture–cave reservoirs formation. (D) The controlling patern of the ancient karst landform on fracture–cave reservoirs formation. (E) The fracture– cave development patern of Weizhou 1-N oilfield.
Evaluations of favorable fracture–cavity carbonate reservoirs often focus on fracture–cavity evaluations, and the key is to dig deeper into the fracture–cavity information and determine the main factors that control the formation of fracture–cavity reservoirs. In this study, the fracture–cavity distribution is predicted and evaluated from the perspective of quantitative fracture–cavity genesis. First, it is clear that the formation of fractures and karst caves is mainly controlled by four geological factors: lithology changes, tectonic deformations, karst landforms and faulting. We used the mathematical characterization method to establish a new parameter to evaluate the lithology changes and combined it with seismic attributes to predict the distribution of the lithology standard deviations to obtain a quantitative characterization of the lithology changes. To characterize the con–trolling mechanism of tectonic deformation, the principal curvature inversion method of tectonic deformation was used to simulate the principal curvature distribution of tectonic deformation for the target layer in the study area, and a quantitative characterization of the tectonic deformation factors was achieved. The relative elevations of the karst land–forms were normalized to achieve a quantitative characterization of the karst landforms as a geological factor. According to Figures 13A, B, the density distribution function of the karst caves or fractures near the fault can be fitted, and the plane distribution of the densities of the fractures and karst caves that are affected by the fault can be determined by calculating the function equation. In this way, a spatial quantitative characterization of four geological genetic factors that control the formation and distribution of fractures and karst caves in the study area was carried out. The concepts used in fracture–cavity distribution prediction technology consist of to gridding the four geological factors in the same gridding step and normalize the data, which is followed by integrating the geological factors that can quantitatively reflect the karst landforms, lithology changes, faulting and tectonic deformations. The BP neural network deep learning algorithm is used to fit and calculate the four genetic factors with the fracture–cavity relative density that was identified by the results of single–well logging data. When the required prediction accuracy is satisfied, the numerical simulation calculation is carried out over the whole plane to evaluate the plane fracture–cavity distribution.
Figure 15 shows the process for predicting the fracture–cavity distribution. Figure 16 is the fracture–cavity reservoir distribution map of the Carboniferous buried hill reservoir in the Weizhou 1–N oilfield, as predicted by the above evaluation method. To verify whether the evaluation results are reasonable, we compared these from two perspectives. First, we compared the relative densities of the fracture–cavities in the three wells that were not involved in the simulation calculations with the predicted result (Figure 17), and the error in the predicted fracture–cavity relative density was less than 5%. The second aspect was verified from a drilling and production perspective. The production performance of five industrial wells in the Weizhou 1–N oilfield reflects the characteristics of dual–pore medium flow. These five wells can be roughly divided into two types. One type is when the reservoir spaces are dominated by rock blocks, small fractures, karst caves and pores, and the wells that encountered only emptying in the drilling process are called pore and cave oil wells, such as wells N4 and N5. The reservoir spaces of the other well type are dominated by fractures. Wells with serious leakage during drilling are called fracture wells, such as wells N1, N3 and N6. The above five wells confirmed the development of fractures or karst caves from their production performances, and these five production wells were also located in the high–value area of the fracture–cavity density prediction in this evaluation. The drilling results of wells N2, N8B and N9 suggested that the fractures and karst caves were clearly not developed, and the evaluation results were also located in the low–density area of predicted fractures and karst caves. This shows that the quantitative prediction method of fractured–cavity reservoir development zones that is based on genesis is reliable and can guide the adjustment and exploitation of oilfields.
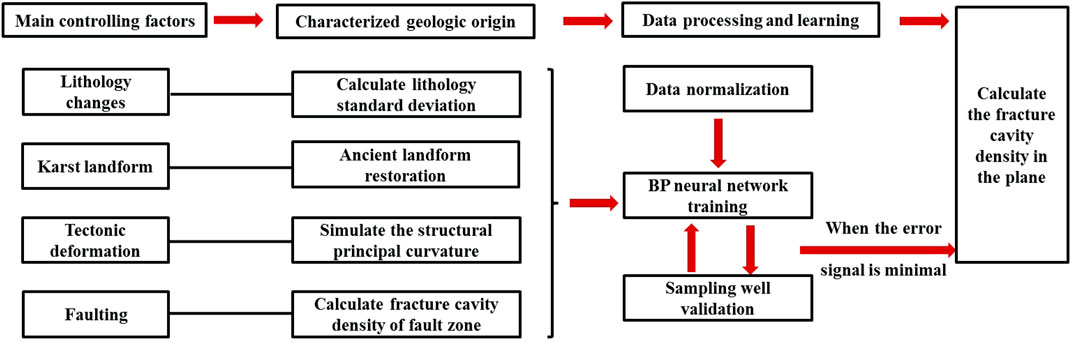
FIGURE 15. Flowchart of fracture–cavity reservoir prediction.
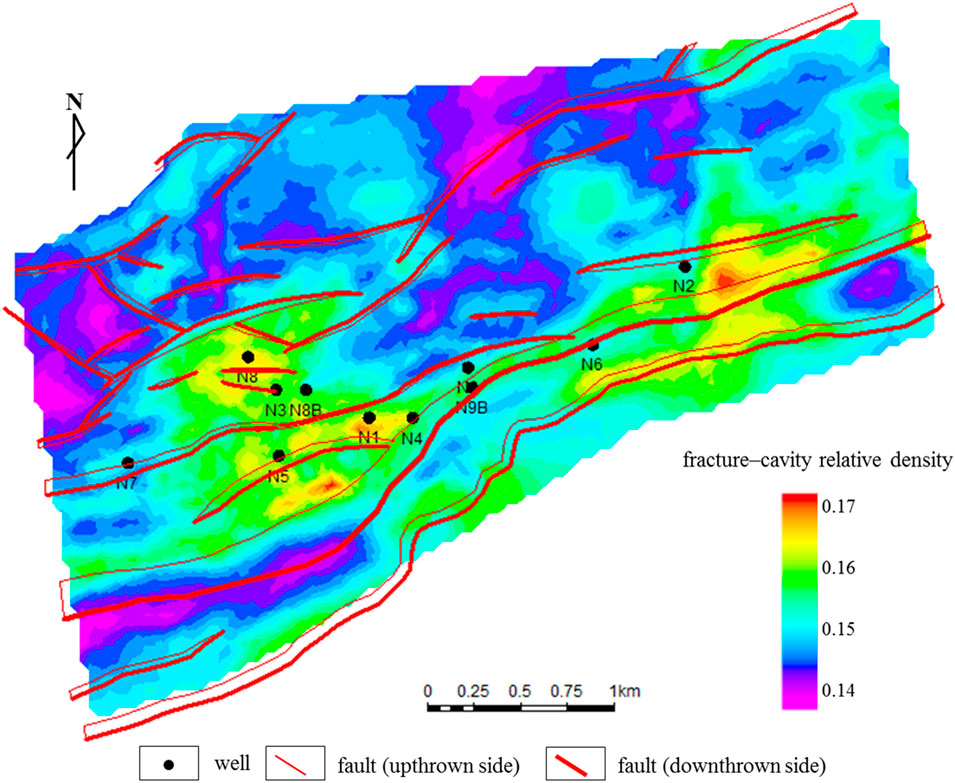
FIGURE 16. Distribution prediction diagram of the fracture–cavity relative density in the Weizhou 1–N oilfield.
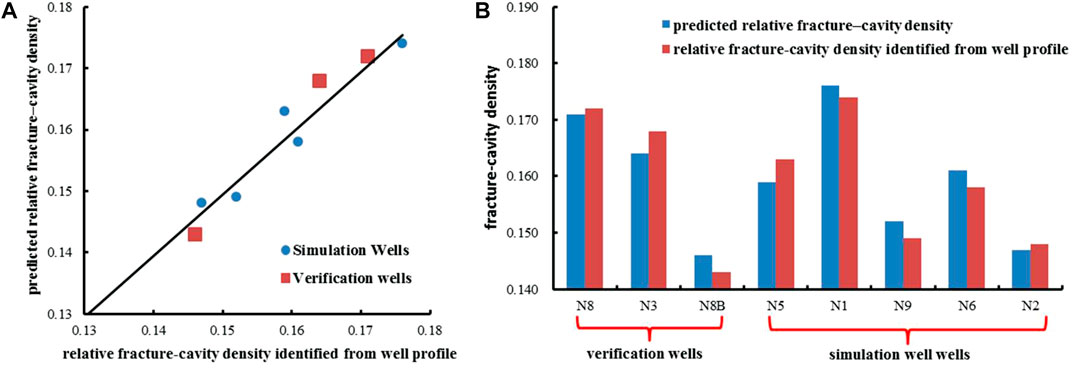
FIGURE 17. (A) Relationships between the relative fracture-cavity density identified from well profile and the predicted relative fracture–cavity density. (B) The error comparison of the relative fracture-cavity density identified from well profile and the predicted relative fracture-cavity density.
(1) Owing to the intense epigenetic transformations, the buried Carboniferous carbonate hill formed complex reservoir spaces in which the karst caves, fractures and pores were associated with and communicated with each other. The main controlling factors include lithology changes, karst landforms, tectonic deformation and faulting.
(2) The buried limestone hill has been seriously reformed and dolomitized to varying degrees. To characterize the distribution characteristics of the lithology changes, a new parameter, the lithology standard deviation, which can reflect the longitudinal lithology changes of the reservoir, is proposed. The smaller the lithology standard deviation is, the more dramatic are the longitudinal thickness changes. Lithological changes form the basis for the formation of fractures and karst caves. The relative density of a single well fracture cavity has a significant negative correlation with the lithology standard deviation. The smaller the lithology standard deviation is, the higher the relative density of the fracture cavity is, and the more intense the lithology change is, and the more likely a fracture cavity is to be formed.
(3) The degrees of fracture development in the buried hill are closely related to the local tectonic deformations. The larger the tectonic principal curvature is, the more developed the fractures are. Faulting is also a key geological factor for the formation of fractures and karst caves. The closer the area is to the secondary fault, the more developed the fractures, but there is no obvious relationship between the density of karst caves and the distance to the secondary fault. The major fault obviously controls the formation of karst caves. The closer the drilling is to the major fault, the higher the density of karst caves. The range of control of the secondary faults on fracture formation is within 150 m from the fault. The range of control of major faults on karst cave formation is within 200 m from the fault.
The original contributions presented in the study are included in the article/Supplementary Material, further inquiries can be directed to the corresponding author.
CZ contributed the writing and paper preparation, WZ and HX contributed to the conception of the study and supported the experiments of the study; CL contributed to the sampling and the data analyses; XW helped perform the analysis with constructive discussions.
This work is granted by the National Science and Technology Major Projects of China (Grant No. 2016ZX05024–006).
Authors CZ and XW were employed by CNOOC China Limited, Hainan Branch, CL was employed by CNOOC Research Institute Limited.
The remaining authors declare that the research was conducted in the absence of any commercial or financial relationships that could be construed as a potential conflict of interest.
The reviewers (KL and XR) declared a shared affiliation with the authors (WZ and HX) to the handling editor at the time of review.
All claims expressed in this article are solely those of the authors and do not necessarily represent those of their affiliated organizations, or those of the publisher, the editors and the reviewers. Any product that may be evaluated in this article, or claim that may be made by its manufacturer, is not guaranteed or endorsed by the publisher.
Atkinson, B., and Meredith, P. (1987). “Experimental Fracture Mechanics Data for Rocks and Minerals,” in Fracture Mechanics of Rock. Editor B. K. Atkinson (London, England: Academic Press), 76–80. doi:10.1016/b978-0-12-066266-1.50016-8
Bukar, M., Worden, R. H., Bukar, S., and Shell, P. (2021). Diagenesis and its Controls on Reservoir Quality of the Tambar Oil Field, Norwegian North Sea. Energ. Geosci. 2 (1), 10–31. doi:10.1016/j.engeos.2020.07.002
Cao, R. R., and Liu, Z. Y. (2008). Application of Curvature of Face–Trend Surface Fit–Ting Method in Fracture Prediction. Comput. Appl. Pet. 16 (3), 12–14.
Chen, G. B., Li, T., Yang, L., Zhang, G. H., Li, J. W., and Dong, H. J. (2021). Mechanical Properties and Failure Mechanism of Combined Bodies with Different Coal-Rock Ratios and Combinations. J. Mining Strata Control. Eng. 3 (2), 023522. doi:10.13532/j.jmsce.cn10-1638/td.20210108.001
Chen, Q., Liu, D. Y., Chen, Y. J., Shen, X. H., Jiang, J. J., Li, X., et al. (2013). Comparative Analysis of Grade–Standard Deviation Method and Factors Analysis Method for Environmental Sensitive Factor Analysis. Earth Environ. 41 (3), 319–325.
Chen, Z. G., Ma, W. J., Zhao, H. Z., Xu, F., Cui, Q. Z., Ma, H., et al. (2020). A Technical Workflow of Fracture Prediction with Curvature–Related Attributes and its Applications. Geophys. Geochemical Exploration 44 (5), 1201–1207.
Ding, F., Xie, C., Zhou, X., Jiang, C., Li, K., Wan, L., et al. (2021). Defining Stratigraphic Oil and Gas Plays by Modifying Structural Plays: A Case Study from the Xihu Sag, east China Sea Shelf Basin. Energ. Geosci. 2 (1), 41–51. doi:10.1016/j.engeos.2020.08.002
Dong, S., Zeng, L., Lyu, W., Xia, D., Liu, G., Wu, Y., et al. (2020). Fracture Identification and Evaluation Using Conventional Logs in Tight Sandstones: A Case Study in the Ordos Basin, China. Energ. Geosci. 1 (3–4), 115–123. doi:10.1016/j.engeos.2020.06.003
Du, J. H., He, H. Q., Pi, X. J., Guo, X. J., Hu, S. Y., Zhang, Y. J., et al. (2011). Petroleum Exploration Progress and Future Exploring Succeeding Areas of PetroChina. Lithologic Reservoirs 23 (1), 1–16.
Fan, Z. J., Liu, J. H., and Zhang, W. F. (2008). Log Interpretation and Evaluation of the Ordovician Carbonate Rock Reservoirs in Tahe Oilfield. Oil Gas Geology. 29 (1), 61–65.
Fu, L. X., Hu, R. B., Liu, S. Z., Hu, J. Y., and Liang, D. G. (2001). Paleokarst in the Ordovician Carbonate Rocks in Huanghua Depression: the Evolution and Dominant Roles of it in Hydrocarbon Accumulation in Buried–hills. Mar. Origin Pet. Geology. 6 (2), 21–27.
Gan, J., Zhao, S. L., Luo, W., and Hu, C. H. (2017). Hydrocarbon Accumulation Conditions and Models of Stratigraphic Oil and Gas Reservoirs in Weixinan Sag. Spec. Oil Gas Reservoirs 24 (2), 40–44.
Gu, X. E. (2006). The Dicussion of the Standard Error and Standard Deviation. Phys. Exp. Coll. 19 (3), 66–67.
Guo, X. S., Hu, D. F., and Duan, J. B. (2020). Problems and Suggestions on marine Petroleum Exploration in South China. Pet. Geology. Exp. 42 (5), 675–686.
He, Z. L., Peng, S. T., and Zhang, T. (2010). Controlling Factors and Genetic Pattern of the Ordovician Reservoirs in the Tahe Area. Oil Gas Geology. 31 (6), 743–752.
Hong, D., Cao, J., Wu, T., Dang, S., Hu, W., and Yao, S. (2020). Authigenic clay Minerals and Calcite Dissolution Influence Reservoir Quality in Tight Sandstones: Insights from the central Junggar Basin, NW China. Energ. Geosci. 1 (1–2), 8–19. doi:10.1016/j.engeos.2020.03.001
Hower, J. C., and Groppo, J. G. (2021). Rare Earth-Bearing Particles in Fly Ash Carbons: Examples from the Combustion of Eastern Kentucky Coals. Energ. Geosci. 2 (2), 90–98. doi:10.1016/j.engeos.2020.09.003
Hu, B. (2018). Application of Curvature–Based fine Interpretation Technique in Complex Fault Area. Offshore Oil 38 (1), 22–27.
Jian, E. O. M. A., and Fan, D. (2021). Sedimentology, Petrography, and Reservoir Quality of the Zarga and Ghazal Formations in the Keyi Oilfield, Muglad Basin, Sudan. scientific Rep. 11 (1), 743.
Jiang, Z. R., Lu, Z. Y., Lv, Z. G., and Yang, J. (2014). Distribution of Carbonate Fractured and Vuggy Reservoirs of Maokou Formation in Luzhou Paleo–Uplift during Dongwu Movement, Sichuan Basin. Pet. Geology. Exp. 36 (4), 411–415.
Kaba, K., Sarıgül, M., Avcı, M., and Kandırmaz, H. M. (2018). Estimation of Daily Global Solar Radiation Using Deep Learning Model. Energy 162, 126–135. doi:10.1016/j.energy.2018.07.202
Kang, Y. Z. (2020). Potential and Exploration Direction of Oil and Gas Resources in the Uplift Regions of Southern China. Fault–Block Oil and Gas Field 27 (04), 409–411.
Kang, Z. H., and Wu, M. D. (2003). Technology of Recovering Ancient Geomorphy Though Sequence Stratigraphy: A Case Study in Tahe 6th Reservoir, Tarim basin. Xinjiang Geology. 21 (3), 290–292.
Kong, X. L., Tang, J. M., and Xu, T. J. (2011). Application of Seismic Curvature Attribute to Fracture Prediction in Xinchang Area, Western Sichuan Depression. Geophys. Prospecting Pet. 50 (5), 517–520.
Lan, S. R., Song, D. Z., Li, Z. L., and Liu, Y. (2021). Experimental Study on Acoustic Emission Characteristics of Fault Slip Process Based on Damage Factor. J. Mining Strata Control. Eng. 3 (3), 033024. doi:10.13532/j.jmsce.cn10-1638/td.20210510.002
Li, C. R., Zhang, G. C., Liang, J. S., Zhao, Z. G., and Xu, J. Y. (2012). Characteristics of Fault Structure and its Control on Hydrocarbons in the Beibuwan Basin. Acta Petrolei Sinica 33 (2), 195–203.
Li, S. J. (2020). Some Developments of Estimation Procedures of Mechanical Model Parameter Based on Deep Learning Neural Network. Artif. Intelligence Robotics Res. 9 (2), 100–109.
Li, X. S., Gan, J., Zhang, Y. Z., Zhang, J. X., Yang, X. B., Deng, Y., et al. (2015). Hydrocarbon Accumulation Regularity and Exploration Prospects of Fault Lacustrine Basins in Western South China Sea. China Offshore Oil and Gas 27 (4), 22–29.
Li, Y. (2012). Ordovician Carbonate Fracture–Cavity Reservoirs Identification and Quantitative Characterization in Tahe Oilfield. J. China Univ. Pet. 36 (1), 1–7.
Li, Y. T., and Fan, Z. H. (2011). Developmental Pattern and Distribution Rule of the Fracture–Cavity System of Ordovician Carbonate Reservoirs in the Tahe Oilfield. Acta Petrolei Sinica 32 (1), 101–106.
Li, Y., Zhou, D.-H., Wang, W.-H., Jiang, T.-X., and Xue, Z.-J. (2020). Development of Unconventional Gas and Technologies Adopted in China. Energ. Geosci. 1 (1–2), 55–68. doi:10.1016/j.engeos.2020.04.004
Liu, Y., Gao, M., and Zhao, H. (2020). Detection of Overlying Rock Structure and Identification of Key Stratum by Drilling and Logging Technology. J. Mining Strata Control. Eng. 2 (2), 023038. doi:10.13532/j.jmsce.cn10-1638/td.2020.02.004
Liu, Z. F., Qu, S. L., and Sun, J. G. (2012). Progress of Seismic Fracture Characterization Technology. Geophys. Prospecting Pet. 51 (2), 191–198.
Lu, X. B., and Cai, Z. X. (2010). A Study of the Paleokarst System in the Fractured–Vuggy Carbonate Reservoirs and Oil/Gas Development–Taking the Reservoirs in Tahe Oilfield as an Example. Oil Gas Geology. 31 (1), 22–27.
Ma, R. H. (2005). Fracture Prediction of Tight sandstone Reservoir. Nat. Gas Industry 25 (10), 36–37.
Ma, Y., Li, S. Z., Liu, X., Zhao, S. J., Yu, S., Wang, X. F., et al. (2014). Formation Machanism of the Beibuwan Basin, South China. J. Jilin Univ. Earth Sci. Edition 44 (6), 1727–1736.
Mahmud, H. B., Bin Muhammad Hisham, M. H., Mahmud, W. M., Leong, V. H., and Shafiq, M. U. (2020). Petrophysical Interpretations of Subsurface Stratigraphic Correlations, Baram Delta, Sarawak, Malaysia. Energ. Geosci. 1 (3–4), 100–114. doi:10.1016/j.engeos.2020.04.005
Makeen, Y. M., Shan, X., Ayinla, H. A., Adepehin, E. J., Ayuk, N. E., Yelwa, N. A., et al. (2021). Sedimentology, Petrography, and Reservoir Quality of the Zarga and Ghazal Formations in the Keyi Oilfield, Muglad Basin, Sudan. Sci. Rep. 11 (1), 743. doi:10.1038/s41598-020-80831-y
Mirzaei-Paiaman, A., and Ghanbarian, B. (2021). A New Methodology for Grouping and Averaging Capillary Pressure Curves for Reservoir Models. Energ. Geosci. 2 (1), 52–62. doi:10.1016/j.engeos.2020.09.001
Qie, L., Shi, Y. N., and Liu, J. S. (2021). Experimental Study on Grouting Diffusion of Gangue Solid Filling Bulk Materials. J. Mining Strata Control. Eng. 3 (2), 023011. doi:10.13532/j.jmsce.cn10-1638/td.20201111.001
Radwan, A. E., Trippetta, F., Kassem, A. A., and Kania, M. (2020). Multi–scale Characterization of Unconventional Tight Carbonate Reservoir: Insights from October Oil Filed, Gulf of Suez Rift basin, Egypt. J. Pet. Sci. Eng., 107968.
Ren, C., Gao, X., Jiang, H., Li, J., and He, F. (2018). Characteristics and Favorable Area Prediction of Ordovician Buried-hill Carbonate Reservoirs in the Bozhong 21-2 Tectonic belt, Bohai Bay Basin, China. Pet. Sci. Technol. 36, 1374–1381. doi:10.1080/10916466.2018.1474222
Saein, A., and Riahi, Z. (2017). Controls on Fracture Distribution in Cretaceous Sedimentary Rocks from the Isfahan Region, Iran. Geol. Mag. 154, 1–13. doi:10.1017/s0016756817000346
Santosh, M., and Feng, Z. Q. (2020). New Horizons in Energy Geoscience. Energ. Geosci. 1 (1–2), A1–A2. doi:10.1016/j.engeos.2020.05.005
Shen, S. (2019). A Deep Learning Method for Online Capacity Estimation of Lithium–Ion Batteries. J. Energ. Storage 25, 1–13. doi:10.1016/j.est.2019.100817
Sun, X., Zhang, X., Zhang, G., Lu, B., Yue, J., and Zhang, B. (2014). Texture and Tectonic Attribute of Cenozoic basin Basement in the Northern South China Sea. Sci. China Earth Sci. 57, 1199–1211. doi:10.1007/s11430-014-4835-2
Taesic, L., Juwon, K., Young, U., and Hyunju, L. (2019). Deep Neural Network for Estimating Low Density Lipoprotein Cholesterol. Clinica Chim. Acta 489, 35–40.
Tian, F., Jing, Q., Li, Y., Zhang, H. F., and Zhang, W. B. (2012). Identification of Small Fracture–Vugs and Their Fillings through Log Interpretation in Fractured–Vuggy Ordovician Reservoirs in Tahe Oilfield. Oil Gas Geology. 33 (6), 900–908.
Tong, H. M., Fan, C. W., Meng, L. J., Zhao, B. Y., and Fan, J. Y. (2018). Manifestation and Origin Mechanism of the Fault System Complexity in Rift Basins in Eastern–Southern China:Case Study of the Nanbu and Weixinan Sags. Acta geologica sinica 92 (9), 1753–1765.
Wang, J., and Wang, X. L. (2021). Seepage Characteristic and Fracture Development of Protected Seam Caused by Mining Protecting Strata. J. Mining Strata Control. Eng. 3 (3), 033511. doi:10.13532/j.jmsce.cn10-1638/td.20201215.001
Wang, Z. J. (2009). A Polarization SAR Image Fusion Algorithm Based on the Product of Local Energy and Regional Standard Deviation in Contourlet Domain. J. Image Graphics 14 (3), 514–519.
Xiao, J., Wang, H., Ma, L. J., Gan, H. J., Liu, J. R., and Chen, L. (2003). Characteristics of Buried hill Oil Pool of W61 Area in Weixi'nan Depression, Beibu Gulf basin. J. Xinjiang Pet. Inst. 15 (4), 30–37.
Xiao Y. R, Y. R., He, F. Y., and Sun, Y. M. (2003). Reservoir Characteristics of Paleocave Carbonates a Case Study of Ordovician Paleocave in Tahe Oilfield, Tarim Basin. Oil Gas Geology. 24 (1), 75–80.
Xu, G. S., Liu, S. G., Wu, H. Z., Li, Z. W., and Sun, W. (2005). The Relationship between Sea Level Change and Cave Formation Sequence. Acta Sedimentologica Sinica 23 (2), 316–322.
Xue, F., Liu, X. X., and Wang, T. Z. (2021). Research on Anchoring Effect of Jointed Rock Mass Based on 3D Printing and Digital Speckle Technology. J. Mining Strata Control. Eng. 3 (2), 023013. doi:10.13532/j.jmsce.cn10-1638/td.20201020.001
Yan, X. B. (2002). Characteristics of Ordovician Carbonate Rock Reservoirs inTahe Oilfield. Oil Gas Geology. 23 (3), 262–265.
Yang, J. X., Luo, M. K., Zhang, X. W., Huang, N., and Hou, S. J. (2021). Mechanical Properties and Fatigue Damage Evolution of Granite under Cyclic Loading and Unloading Conditions. J. Mining Strata Control. Eng. 3 (3), 033016. doi:10.13532/j.jmsce.cn10-1638/td.20210510.001
Yang, X. B. (2016). Hydrocarbon Accumulation Conditions in Beibu Gulf Basin, Northern South China Sea. China Pet. Exploration 21 (4), 85–92.
Yin, S., Dong, Li., Yang, Xia., and Wang, Ruyue. (2020a). Experimental Investigation of the Petrophysical Properties, Minerals, Elements and Pore Structures in Tight Sandstones. J. Nat. Gas Sci. Eng. 76 (1), 1–14. doi:10.1016/j.jngse.2020.103189
Yin, S., Han, C., Wu, Z., and Li, Q. (2019c). Developmental Characteristics, Influencing Factors and Prediction of Fractures for a Tight Gas sandstone in a Gentle Structural Area of the Ordos Basin, China. J. Nat. Gas Sci. Eng. 72 (12), 1–14. doi:10.1016/j.jngse.2019.103032
Yin, S., Lv, D., and Ding, W. (2018a). New Method for Assessing Microfracture Stress Sensitivity in Tight sandstone Reservoirs Based on Acoustic Experiments. Int. J. Geomechanics 18 (4), 1–10. doi:10.1061/(asce)gm.1943-5622.0001100
Yin, S., Tian, T., and Wu, Z. (2019a). Developmental Characteristics and Distribution Law of Fractures in a Tight sandstone Reservoir in a Low–Ampli–Tude Tectonic Zone, Eastern Ordos Basin, China. Geol. J. 54, 1–16.
Yin, S., Tian, T., Wu, Z., and Li, Q. (2020b). Developmental Characteristics and Distribution Law of Fractures in a Tight sandstone Reservoir in a Low‐amplitude Tectonic Zone, Eastern Ordos Basin, China. Geol. J. 55, 1546–1562. doi:10.1002/gj.3521
Yin, S., and Wu, Z. (2020). Geomechanical Simulation of Low-Order Fracture of Tight sandstone. Mar. Pet. Geology. 100, 1–10. doi:10.1016/j.marpetgeo.2020.104359
Yin, S., Xie, R., Wu, Z., Liu, J., and Ding, W. (2019b). In Situ stress Heterogeneity in a Highly Developed Strike-Slip Fault Zone and its Effect on the Distribution of Tight Gases: A 3D Finite Element Simulation Study. Mar. Pet. Geology. 99 (1), 75–91. doi:10.1016/j.marpetgeo.2018.10.007
Yin, S., Zhao, J., Wu, Z., and Ding, W. (2018b). Strain Energy Density Distribution of a Tight Gas sandstone Reservoir in a Low-Amplitude Tectonic Zone and its Effect on Gas Well Productivity: A 3D FEM Study. J. Pet. Sci. Eng. 170, 89–104. doi:10.1016/j.petrol.2018.06.057
Yoshida, M., and Santosh, M. (2020). Energetics of the Solid Earth: An Integrated Perspective. Energ. Geosci. 1 (1–2), 28–35. doi:10.1016/j.engeos.2020.04.001
Zeng, L., Jiang, J., and Yang, Y. (2010). Fractures in the Low Porosity and Ultra-low Permeability Glutenite Reservoirs: A Case Study of the Late Eocene Hetaoyuan Formation in the Anpeng Oilfield, Nanxiang Basin, China. Mar. Pet. Geology. 27, 1642–1650. doi:10.1016/j.marpetgeo.2010.03.009
Zhang, B., Shen, B., and Zhang, J. (2020). Experimental Study of Edge-Opened Cracks Propagation in Rock-like Materials. J. Mining Strata Control. Eng. 2 (3), 033035. doi:10.13532/j.jmsce.cn10-1638/td.20200313.001
Zhang, H., Xu, G., Liu, M., and Wang, M. (2021). Formation Environments and Mechanisms of Multistage Paleokarst of Ordovician Carbonates in Southern North China Basin. Sci. Rep. 11 (1), 819. doi:10.1038/s41598-020-80878-x
Zhang, J., Ju, Y., and Zhang, Q. (2019). Low Ecological Environment Damage Technology and Method in Coal Mines. J. Mining Strata Control. Eng. 1 (1), 013515. doi:10.13532/j.jmsce.cn10-1638/td.2019.02.005
Zhang, J. Z., and Song, L. Y. (1981). On the Method of Estimating B–Value and its Standard Error–The Monte Carlo Method of Estimating the Accuracy of B–Valve. Acta Seismologica Sinica 3 (3), 292–301.
Zhang, P., Zheng, J., Xi, M. H., Wang, W. J., Huang, J. J., and Wang, X. P. (2015). Hydrocarbon Accumulation Conditions and Patterns in the Southwestern Margin of Weixinan Sag, Beibuwan Basin. Pet. Geology. Exp. 37 (2), 157–163.
Zhao, S. L., Yang, X. B., Chen, L., Zhou, G., Jiao, L. B., and Zhao, Y. Z. (2019). Hydrocarbon Accumulation Conditions and Exploration Potential of Carbonate Buried hills in Weixinan Sag in Western South China Sea. China Offshore Oil and Gas 31 (2), 51–61.
Zhao, S. L., Zhao, Y. Z., Yang, X. B., Jiao, L. B., and Chen, C. F. (2018). An Analysis on the Characteristics and Main Controlling Factors of Reservoir in Carbonate Buried hill in the Weixi'nan Sag,Beibuwan Basin. Acta Oceanologica Sinica 40 (9), 43–53.
Zhao Z, Z., Deng, H., and Liu, H. (2011). The Characteristics, Classification and Appraisal of the Reservoirs at Carboniferous Isolated Carbonate Platform Margin in Kenjiyak Oil Field. Mar. Geology. Quat. Geology. 31 (2), 111–120. doi:10.3724/sp.j.1140.2011.02111
Zhou W, W., Li, X. H., J, W. H., Zhao, Z. C., and Zhou, Q. M. (2011). The Control Action of Fault to Paleokarst in View of Ordovician Reservoir in Tahe Area. Acta Petrologica Sinica 27 (8), 2339–2348.
Zhou, W. (1998). Evaluation Methods of Fracture Reservoir in Oil and Gas Pool. Chengdu: Publishing House of Sichuan Science and Technology. (in Chinese).
Keywords: fracture-cavity reservoirs, carbonate, buried hill, main controlling factors, distribution prediction, weixinan depression
Citation: Zhang C, Zhou W, Liu C, Wang X and Xu H (2022) Characteristics, Main Controlling Factors and Prediction of Complex Fracture–Cavity Reservoirs of Buried Carbonate Hills in the Weixinan Depression, Western South China Sea. Front. Earth Sci. 10:865355. doi: 10.3389/feart.2022.865355
Received: 29 January 2022; Accepted: 25 February 2022;
Published: 08 April 2022.
Edited by:
Shuai Yin, Xi’an Shiyou University, ChinaReviewed by:
Xie Runcheng, Chengdu University of Technology, ChinaCopyright © 2022 Zhang, Zhou, Liu, Wang and Xu. This is an open-access article distributed under the terms of the Creative Commons Attribution License (CC BY). The use, distribution or reproduction in other forums is permitted, provided the original author(s) and the copyright owner(s) are credited and that the original publication in this journal is cited, in accordance with accepted academic practice. No use, distribution or reproduction is permitted which does not comply with these terms.
*Correspondence: Chong Zhang, emNobHNxd0AxNjMuY29t; Wen Zhou, emhvdXc2MkBjZHV0LmVkdS5jbg==; Hao Xu, aGFveHU3NzdAcXEuY29t
Disclaimer: All claims expressed in this article are solely those of the authors and do not necessarily represent those of their affiliated organizations, or those of the publisher, the editors and the reviewers. Any product that may be evaluated in this article or claim that may be made by its manufacturer is not guaranteed or endorsed by the publisher.
Research integrity at Frontiers
Learn more about the work of our research integrity team to safeguard the quality of each article we publish.