- Research Institute of Exploration and Development, Tarim Oilfield Company, PetroChina, Korla, China
In order to clarify the fracture distribution characteristics of the Bozi gas field in the Kuqa Depression, based on the statistics of fracture parameters from core data and imaging logging, the three-dimensional (3D) structural model of the complex thrust structure is established by using the voxel-based morphometry (VBM) structural framework modeling technology; the 3D heterogeneous rock mechanics field in the study area is constructed by well-to-seismic integration. The relationship between in situ stress field and fracture parameters is established under the consideration of rock fracture criterion, and fracture prediction of the Cretaceous reservoir in the Bozi gas field is carried out with the finite element numerical simulation method. Considering the influence of in situ stress field on fracture parameters, fracture activity is analyzed. The results show that the Cretaceous reservoirs in the Bozi gas field generally develop fractures, most of which are high-angle shear fractures of tectonic origin and are semi-filled or unfilled. The fracture distribution of the Bozi gas field is obviously controlled by local structures such as folds and faults. From north to south, the fracture development gradually weakens, and the fracture density of Bozi 104 and Bozi 102 fault blocks in the north is the highest. The fracture in the northern fault block of the Bozi gas field shows high activity, while that in the southern fault block shows low activity. The fractures in the higher structural parts of most fault blocks show high activity.
Introduction
China boasts of rich deep oil and gas resources with great potential, and its deep—ultra-deep oil and gas resources exceed 670 × 108 t oil equivalent, accounting for 34% of the total oil and gas resources (Jia et al., 2014). In recent years, China has made a series of important discoveries in the field of deep—ultra-deep oil and gas exploration (Wang et al., 2013; Tian et al., 2020; Yang et al., 2020; Yang et al., 2021), especially the Kuqa Depression in Tarim Basin, which is one important block for deep—ultra-deep natural gas exploration and development in China. The buried depth of Keshen No. 9 gas reservoir and Bozi No. 8 gas reservoir is close to 8,000 m. Under such deep—ultra-deep burial conditions, the reservoir becomes extremely dense after strong diagenetic compaction and cementation, resulting in a matrix porosity of about 4–7% and a permeability of less than 1 mD (Wang et al., 2019). However, natural fractures widely develop in this kind of ultra-deep reservoir. Natural fractures are the effective reservoir space and main seepage channel of this kind of reservoir, which affect oil and gas enrichment, single well productivity, and development effect (Nelson, 2001; Laubach et al., 2009; Lu H et al., 2015; Zeng et al., 2021). Therefore, study on the development and distribution of natural fractures is of great significance for ultra-deep oil and gas exploration and development.
However, the formation, development and distribution of fractures is a nonlinear, complex and heterogeneous system (Dong et al., 2020), which is controlled by many factors such as tectonic stress field, lithology, fault, and structural morphology (Ju et al., 2013; Ju et al., 2020; Gu et al., 2020). It has the characteristics of multi-scale and multi-stage superposition, and strong heterogeneity (Liu et al., 2019; Ren et al., 2020). In recent years, study on fracture has moved from qualitative, to semi-quantitative, and to quantitative research. The fracture identification method is mainly based on field outcrop, drilling core, microscopic thin section, and imaging logging interpretation (Olson et al., 2009; Zeng and Li, 2009; Casini et al., 2011; Ellis et al., 2012; Wang K, 2014). Based on the field outcrop, we can fully understand the distribution characteristics of natural fractures laterally, and the relationship among fractures in different formations (Deng et al., 2009). Fractures from drilling core are the most direct method to identify underground reservoir fractures. Through the observation and statistics of core fractures, we can obtain parameters such as mechanical type, occurrence, opening, length, density, formation characteristics, filling degree, etc. It is the original database for research regarding reservoir fracture in oil and gas exploration and development and is also one of the criteria to test whether the results obtained by other reservoir fracture prediction methods are reasonable (Luo, 2010). The object of thin section fracture analysis is reservoir microfracture, which includes intragranular fracture, marginal fracture, and trans-granular fractures. According to the self-similarity principle, studying the distribution of reservoir microfractures also provides important reference for understanding the distribution law of macro-fractures (Zeng et al., 2007). Imaging logging fracture interpretation is the fastest and most common method to identify fractures in the oilfield, which may provide a vertical continuous reservoir fracture development profile of a single well. Through the core fracture scale, we may interpret the fracture development of the whole well section and quantitatively calculate parameters such as linear density, length, opening, and porosity of fractures in different layers (Huang et al., 2006). The prediction methods of fractures in three-dimensional (3D) space mainly include rock curvature method (Li et al., 2008; Li et al., 2009), fractal dimension method (Feng et al., 2011), energy method, rock fracture method (Ju et al., 2013; Yu et al., 2016), geophysical method, and so on (Wang et al., 2014; Liu et al., 2021). At present, various prediction methods of reservoir fractures have their own advantages, but they inevitably have some defects or limitations.
Currently, there are still many key scientific issues in the research on reservoir fractures, especially in the Tarim Basin in western China, which has experienced multi-stage tectonic movement (He et al., 2005; Neng et al., 2012), resulting in multi-stage superposition of reservoir fractures. In addition, due to complex structure and great reservoir buried depth, further research is required in terms of high-precision 3D geological modeling, quantitative prediction of fractures, the effectiveness evaluation of fracture network system, etc.
Therefore, with the Bozi gas field in Kelasu structural belt of the Kuqa Depression in Tarim Basin as an example, based on the description, observation, and interpretation of fractures from cores, thin section, and imaging logging in multiple single wells, this paper establishes the 3D structural model of complex thrust structure by using the voxel-based morphometry (VBM) structural framework modeling technology and constructs the 3D heterogeneous rock mechanics field in the study area by using the well-to-seismic integration. The in situ stress field is simulated by the finite element numerical simulation method. The relationship between in situ stress and fracture parameters is established through the rock fracture criterion to clarify the development and distribution characteristics of fractures. The influence of in situ stress field on fracture parameters is elaborated to clarify the distribution of fracture activity.
Geological Setting
The Kuqa Depression, located in the northern margin of Tarim Basin, is a multi-stage superimposed depression developed in the front of South Tianshan Mountain and dominated by the Meso-Cenozoic sedimentation (Qi et al., 2013; Wang Z, 2014; Neng et al., 2019). Laterally, it has four belts and three depressions, namely, the northern monoclinal belt, Kelasu structural belt, Qiulitage structural belt, southern slope belt, Wushi Sag, Baicheng Sag, and Yangxia Sag (Figure 1). Affected by the long-range effect of Cenozoic Eurasian plate collision, the difference of compression rate, stress direction, and magnitude during the uplift of South Tianshan Mountain, and distribution of salt lakes, the Kuqa Depression widely develops thrust structures and shows strong zonal deformation characteristics (Wang et al., 2010). The Kelasu structural belt develops a series of thrust faults and ∼E-W-trending fault-related folds from north to south.
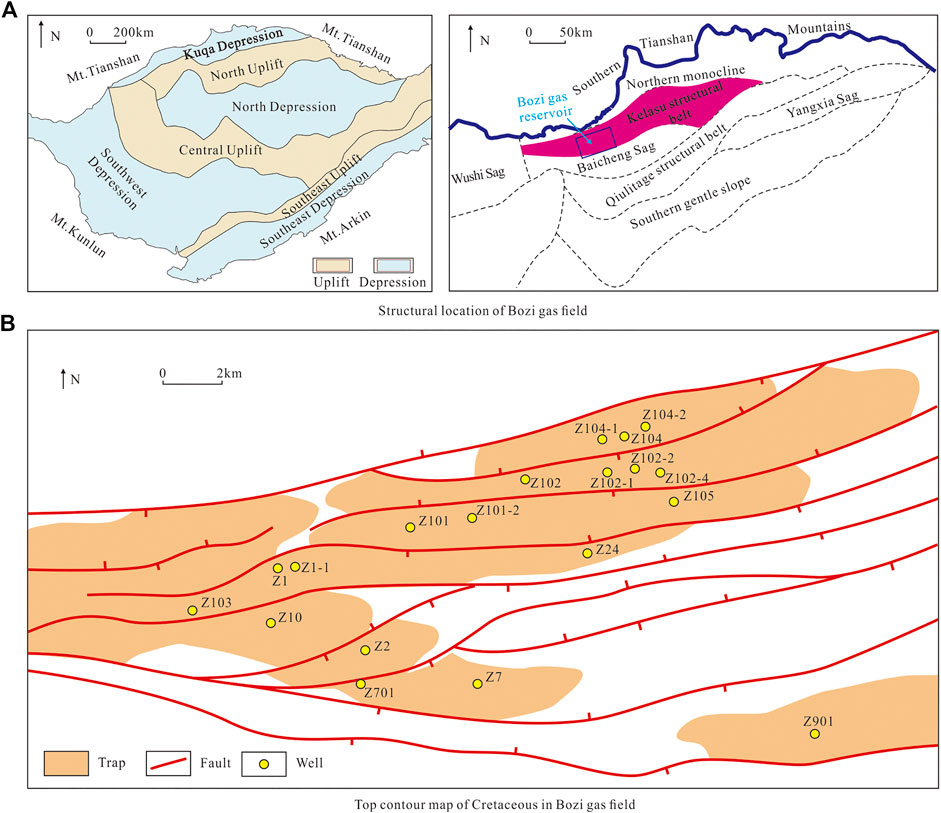
FIGURE 1. (A) The Tarim Basin, located in the northwestern China, contains seven first-order tectonic units: Kuqa Depression, Northern Tarim Uplift, Northern Depression, Central Uplift, Southwestern Depression, Southeastern Uplift, and Southeastern Depression. The Kuqa depression contains seven second-order tectonic units. The Bozi gas field is located in the Kelasu structural belt, the second structural belt in Kuqa Depression. (B) The Cretaceous top contour map of the Bozi gas field. The Bozi gas field is a thrust structure complicated by faults, with many fault blocks and different sizes, and pop-up structures are developed in the middle. From north to south, the reservoir depth increases gradually.
The Bozi gas field, located in the middle-west of Kelasu structural belt, contains multiple fault blocks from north to south. The main exploration target layers of Bozi gas field are the Cretaceous Bashijiqike Formation and Baxigai Formation (Figure 2), which are generally buried in depth of more than 6,000 m, and are deposited at the front edges of fan delta and braided river delta. The Bashijiqike Formation in the study area only has the second and third lithologic sections from top to bottom, without the first one. The second lithologic section is characterized by medium- to thick-layered brown, grayish brown fine sandstone, pebbly fine sandstone, thin- to medium-layered brown mudstone, and silty mudstone. The third lithologic section is characterized by the interbedding of medium- to thick-layered brown fine sandstone, thin- to medium-layered brown mudstone, and silty mudstone. The lithology of the upper part of the Baxigai Formation is mainly composed of thin to medium brown mudstone, grayish brown fine sandstone, and siltstone of unequal thickness, intercalated with thin grayish brown argillaceous siltstone; the lower part is mainly composed of thin to medium brown mudstone and silty mudstone, intercalated with grayish brown fine sandstone.
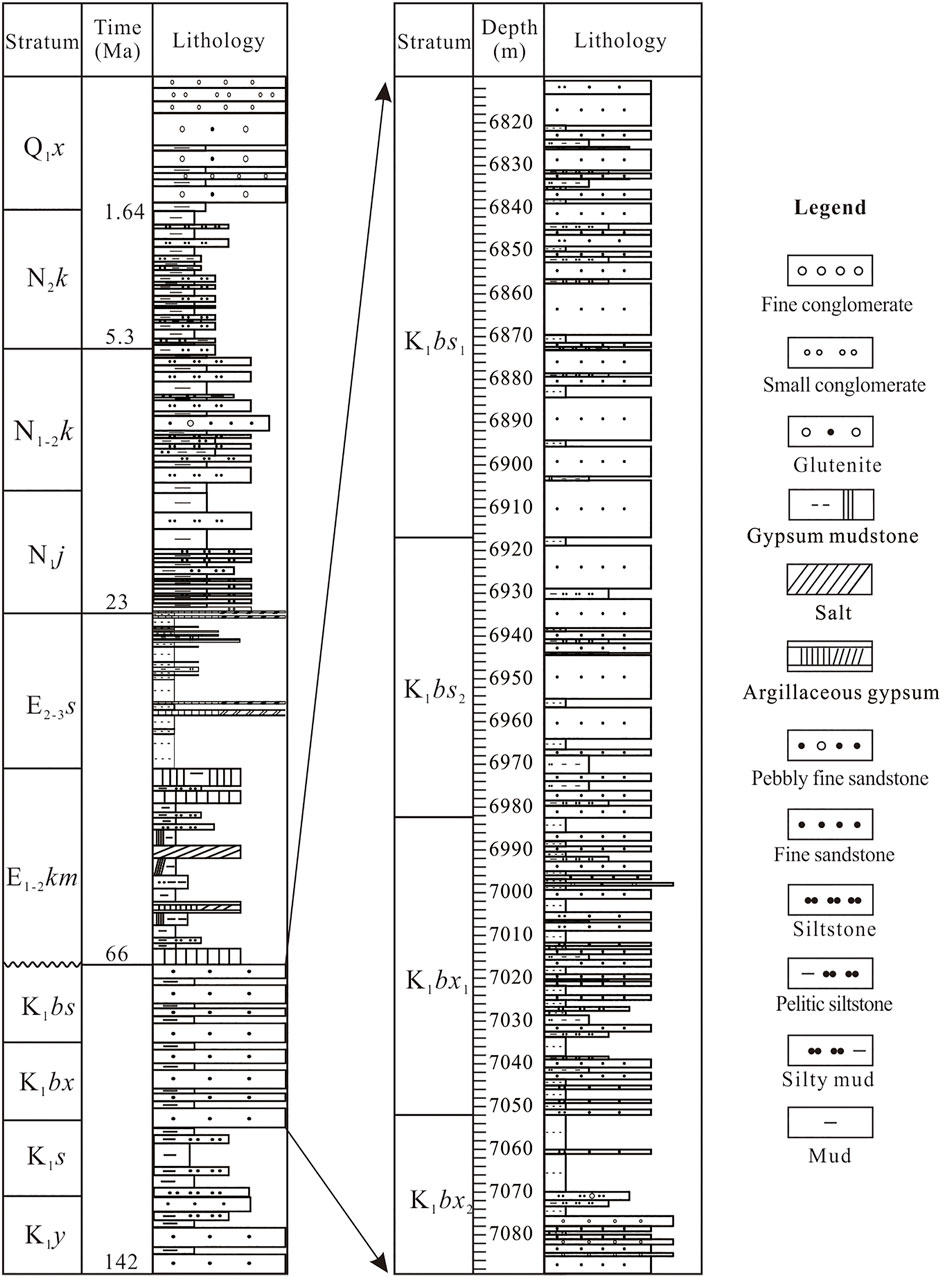
FIGURE 2. From top to bottom, the strata encountered in the Bozi gas field are: Quaternary Xiyu Formation (Q1x), Neogene Kuqa Formation (N2k), Kangcun Formation (N1-2k), Jidike Formation (N1j), Paleogene Suweiyi Formation (E2-3s), Kumugelimu Group (E1-2km), Cretaceous Bashijiqike Formation (K1bs), and Baxigai Formation (K1bx). The Bashijiqike Formation is divided into the second lithologic section (K1bs2) and the third lithologic section (K1bs3) from top to bottom, without the first lithologic section. The Baxigai formation is divided into the first lithologic section (K1bx1) and the second lithologic section (K1bx2) from top to bottom.
The average porosity of the Cretaceous reservoir in the Bozi gas field is about 7%, and the overall average permeability is about 0.3 mD. The analysis of exploration well test samples shows that the content of methane is high with an average volume fraction of 85.21%, and the content of non-hydrocarbon gas, nitrogen, and carbon dioxide is low with an average volume fraction of about 3%. It does not contain H2S. It is a typical condensate gas.
Characteristics of Fracture
The fracture development characteristics of a single well are comprehensively described based on core fracture identification, microscopic thin section fracture observation, and fracture interpretation from imaging logging. From cores, it can be found that fractures of Cretaceous reservoir in the Bozi gas field are relatively developed. Shear fractures are dominant, which are characterized by flat fracture surface, small opening (0.1–0.2 mm), long extension distance, and partially being filled with calcite and gypsum. Tensile fractures account for a small portion, commonly with rough fracture surface, large opening (>2 mm), short extension distance, and mostly being filled (Figure 3).
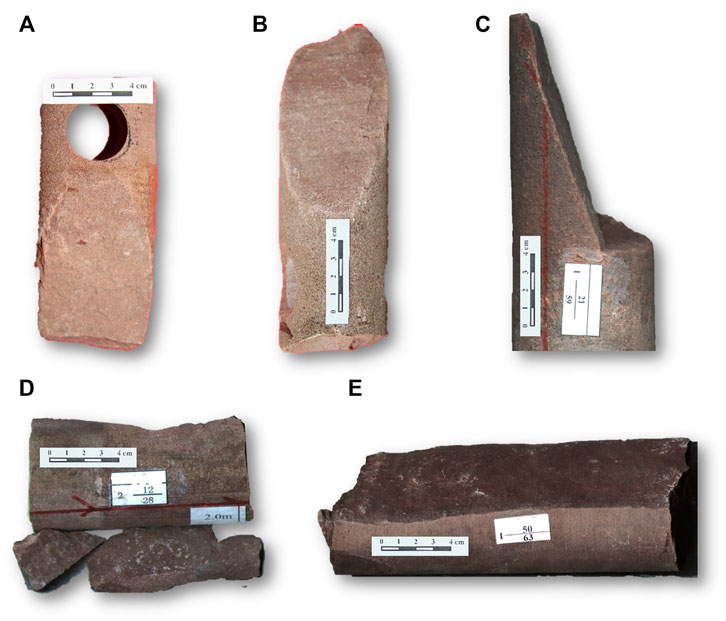
FIGURE 3. (A) Well Z102, 6,779.20 m, unfilled oblique shear fracture; (B) Well Z7, 7,742.96 m, unfilled high angle oblique fracture; (C) Well Z901, 7,678.53 m, medium-high angle shear fracture, flat fracture surface; (D) Well Z104, 6,846.75 m, a group of unfilled oblique shear fracture, with broken core; (E) Well Z10, 7,318.64 m, a nearly vertical shear fracture with flat fracture surface.
The characteristics of microfractures can be seen on thin sections (Figure 4). Intragranular fractures, grain edge fractures, and grain penetrating fractures can be seen with the opening of generally at micron level. Most of these microfractures are connected with matrix pores, which also play an important role in improving the physical properties of low-permeability sandstone reservoir.
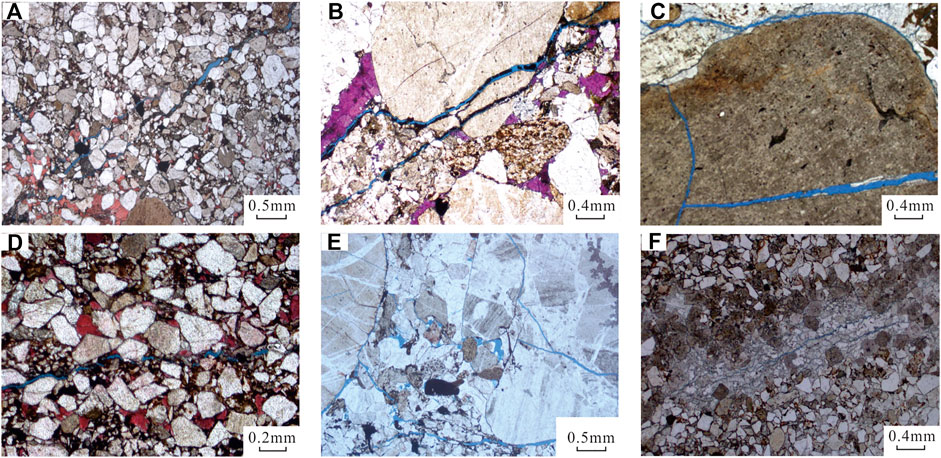
FIGURE 4. (A) Well Z102-1, 6,906.12 m, microfracture extending along grain edge with an opening of about 0.1 mm; (B) Well Z101-2, 7,078.83 m, microfracture extending through the particles, with argillaceous semi-filled in the fracture, and has an opening of about 0.1 mm; (C) Well Z103, 7,399.16 m, microfracture filled with anhydrite in the gravel, and microfractures seen at the edge of the gravel; (D) Well Z104, 6,799.9 m, microfractures distributed along the grain edge; (E) Well Z104-2, 7,005.50 m, microfracture found in the gravel and at the edge of the gravel; (F) Well Z7, 7,550.6 m, several microfractures developed in local dolomite strips.
The combination relationship of large-scale fractures can be more intuitively observed from imaging logs, including parallel fracture, oblique fracture, and reticular fracture. As shown in Figure 5, a group of nearly parallel fractures are developed in 7,028–7,031 m of Well Z1-1, while a series of reticular type fractures are developed in 7,150–7,152 m. In addition, in 7,005–7,008 m of Well Z13, the well wall is fragmented, and a series of fractures with different dip angles can be seen. In 6,941–6,943 m of Well Z104, reticular fractures composed of high-angle fractures and medium- and high-angle fractures can be observed.
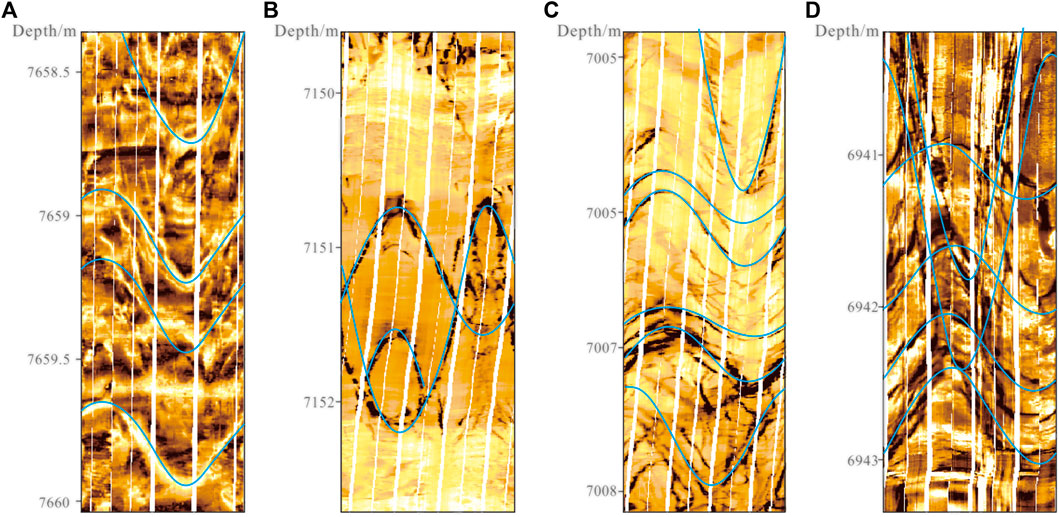
FIGURE 5. (A) Well Z2, 7,658–7,660 m, a group of nearly parallel fractures; (B) Well Z1-1, 7,150–7,152 m, reticular fracture; (C) Well Z13, 7,005–7,008 m, the well wall is fragmented, with a series of fractures with different dip angles; (D) Well Z104, 6,941–6,943 m, reticular fractures composed of high angle fractures and medium and high angle fractures.
The vertical development and distribution characteristics of fractures also significantly vary. As shown in Figure 6A, during the drilling of Well Z101-2, the Cretaceous Bashijiqike Formation and Baxigai Formation were both encountered, with a total of 67 fractures identified. The most fractures are developed in the lower part of K1bs2 and the upper part of K1bs3 formation, i.e. within 6,870–6,970 m, and most of them are high-angle or near-vertical fractures. It can be seen from Figure 6B that a total of 102 fractures were identified in the Cretaceous Bashijiqike Formation of Well Z24. Due to a small-scale reverse fault encountered during the drilling, the formation duplication was shown. It can be found that no matter in the hanging wall or footwall, fractures are denser in the K1bs2, with only few fractures in the K1bs3 formation. Moreover, it can be seen from Figure 6C that the identified 32 fractures in Well Z901 are only developed in the upper part of the K1bs2 formation, without any fracture identified in other layers, and the fractures are mainly of medium-high dip angle.
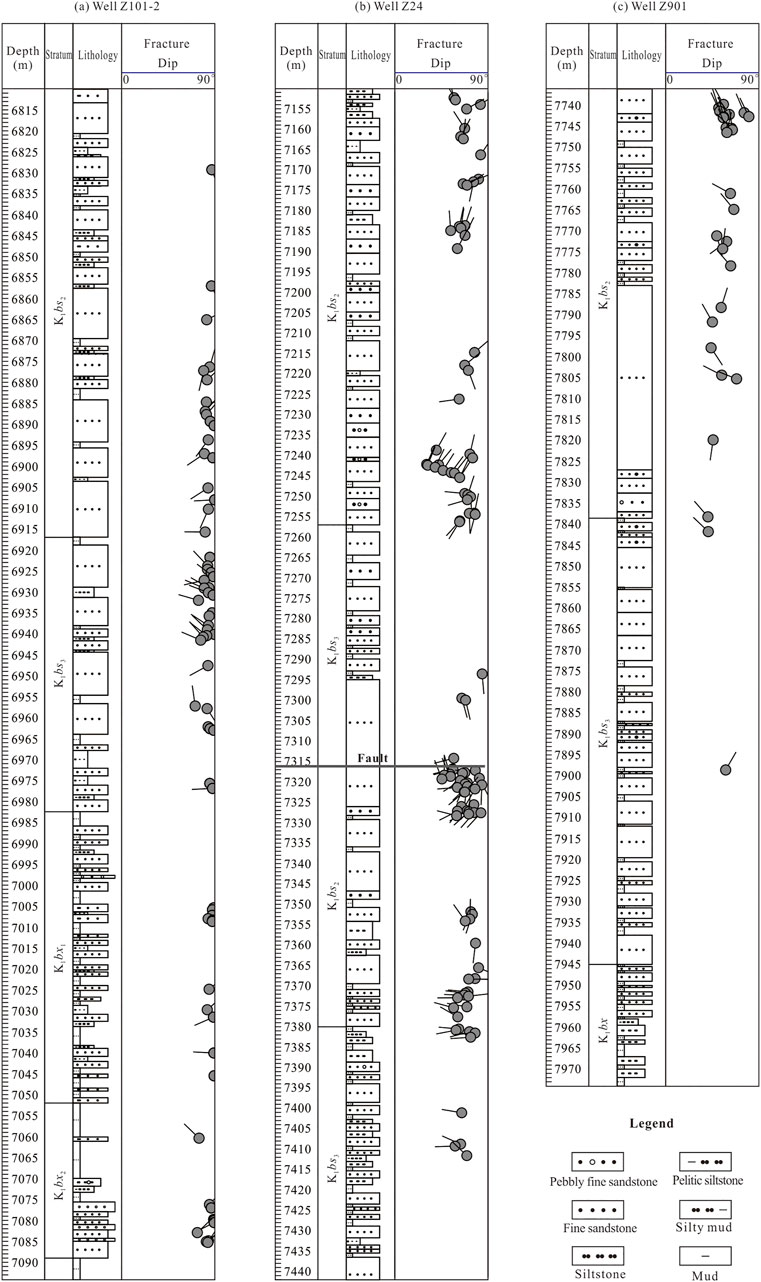
FIGURE 6. (A) Fracture identification of imaging logs in Well Z24, with a total of 102 fractures identified; (B) fracture identification of imaging logs in Well Z101-2, with a total of 67 fractures identified; (C) fracture identification of imaging logs in Well Z901, with a total of 32 fractures identified.
The statistical analysis of fracture parameters shows that natural fractures in the Bozi gas field are highly heterogeneous, and the distribution of fractures among wells greatly varies.
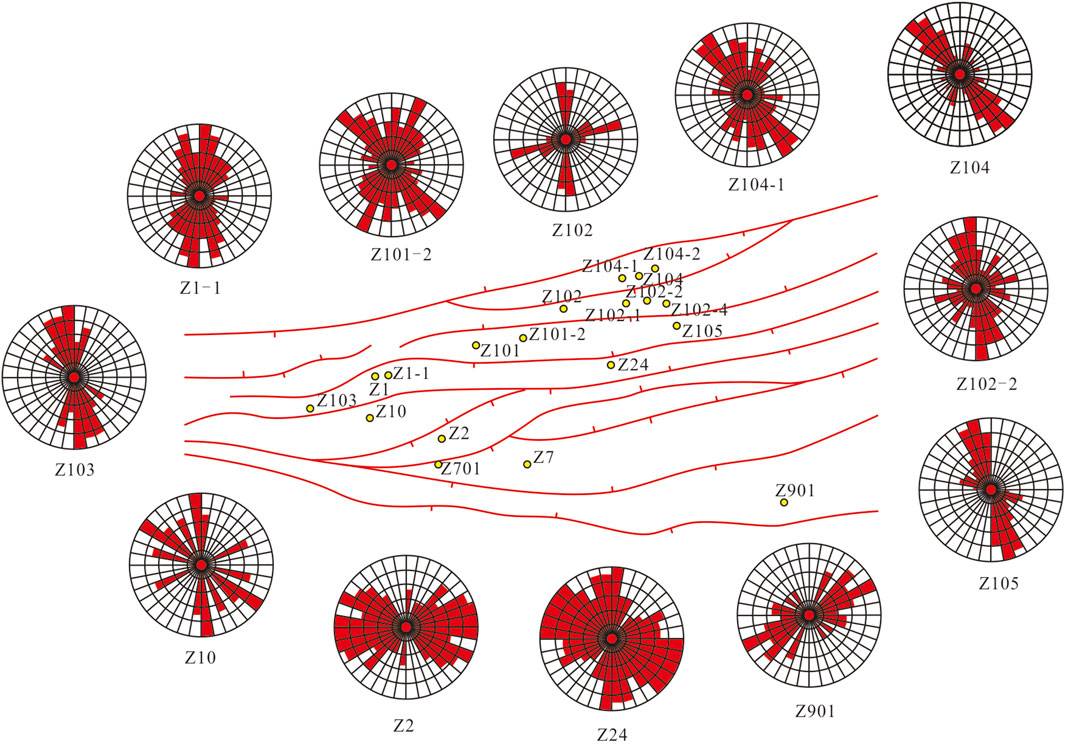
It can be seen from Figure 7 that the fracture strike is generally ∼N-S-trending; very few wells develop nearly ∼E-W-trending fractures such as well Z2. Most fractures are of tectonic origin, the dip angle of fractures is mostly larger than 70°, and the aperture is mostly between 0.1 and 2 mm. Among them, semi-filled and unfilled fractures are dominant. The filling material of those filled fractures is mainly calcite.
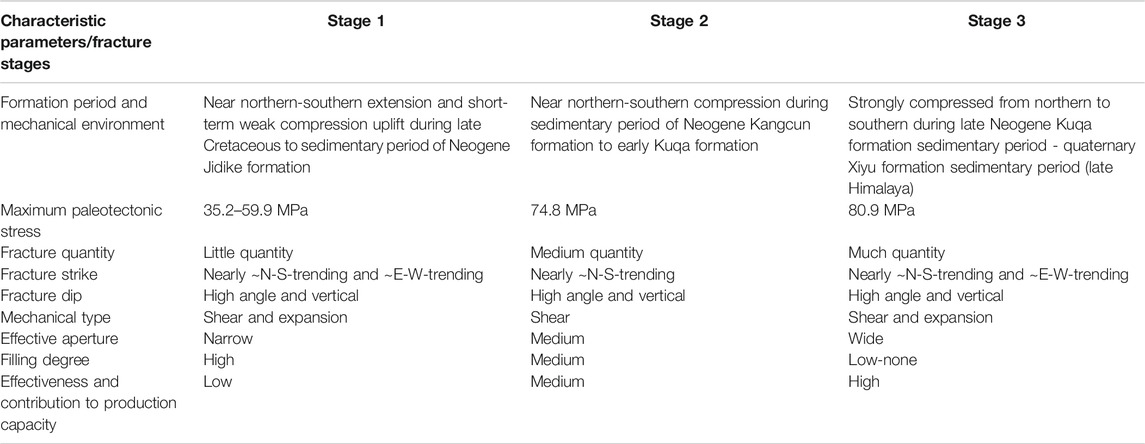
Based on the relationship among fractures and previous studies, it is considered that fractures in the Bozi gas field were formed in three stages (Table 1) (Zeng et al., 2004; Yuan et al., 2015; Wang et al., 2020): Fractures in the first stage were formed in the sedimentary period of Jidike Formation from the end Cretaceous to Neogene, and a small number of ∼E-W-trending tensile fractures and ∼N-S-trending shear fractures were formed under the action of ∼N-S extension and short-term weak compression and uplift. However, fractures in this stage were fully filled by calcite and other minerals, basically resulting in ineffective fractures, and they make extremely less contribution to the productivity of gas wells. Fractures in the second stage were formed in the early sedimentary stage of Kangcun Formation—Kuqa Formation of Neogene. Under the action of ∼N-S compression, a certain number of ∼N-S shear fractures were formed, mainly semi-filled fractures, which maintained some effectiveness. Fractures in the third stage were formed in the late sedimentary stage of the Neogene Kuqa Formation. Under the action of strong compression and nappe in the ∼N-S direction, the strata underwent strong bending and thrust structure, and the Kelasu structural belt including the Bozi gas field was finally finalized. Fractures formed in this stage mainly include shear fractures under the action of ∼N-S compressive stress and ∼E-W-trending tensile fractures under the action of anticline bending deformation. They are featured by large number, large opening, low filling degree, high effectiveness, and high contribution to the productivity of gas wells (Wang et al., 2016).
Method of Fracture Prediction
Establishment of 3D Geological Model
The Bozi gas field has many fault blocks and high degree of structural superposition. If only the target layer model of a single structure is established, it is difficult to accurately simulate the distribution of in situ stress and fractures. The main technology adopted in this paper is voxel-based (VBM) structural framework modeling technology. In the traditional corner grid modeling process, horizon modeling focuses on the structural modeling of key layers, which may lead to drastic changes in the thickness of the same small layer and even unreasonable interleaving between layers. In the VBM modeling technology system, firstly, a tetrahedral grid model with volume of interest (VOI) range is created based on the input data. Then, the isochronous attributes representing the same sequence of all input data are calculated in the tetrahedral mesh model, which is a key step in the VBM algorithm. The calculation of such isochronous attribute is based on the seamless grid attribute (i.e. watertight model) established completely based on the input data (fault, layer and well layering). The grid attribute is continuously distributed in the whole structural framework with discontinuous fault, which may minimize the influence of dip angle and thickness changes. Because the attribute model is based on the isochronous principle of sequence stratigraphy and includes all horizons specified by the input data, once the isochronous grid attribute model is established, the attributes at the corresponding positions may be extracted according to the input data to obtain the horizons within the structural framework and further establish the stratigraphic model. The complex structure model formed by VBM technology is more real and has higher accuracy, and the spatial relationship among different structures is more in line with the actual underground situation.
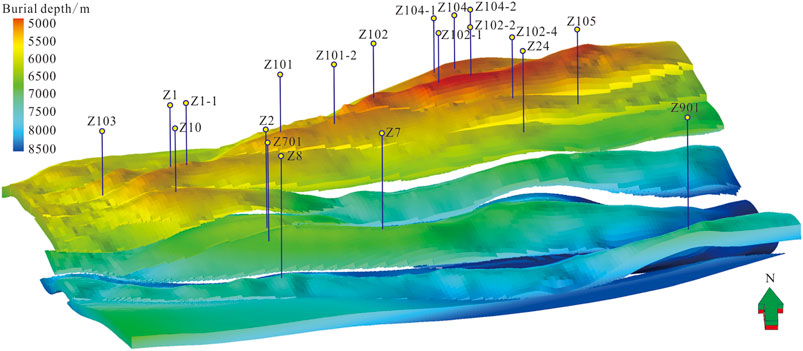
As shown in Figure 8, based on drilling data, logging data, seismic data, and regional geological data, the fault and layer are interpreted, and the 3D geological model of the Bozi gas field is constructed. The model consists of four lithologic members and 18 faults. The Bozi gas field is a thrust structure complicated by faults with varying scale of internal faults, and a series of pop-up structures are developed in the middle section. From north to south, the reservoir depth increases gradually.
Calculation of Rock Mechanical Parameters
Rock mechanical parameters mainly include the Young’s modulus, Poisson’s ratio, and rock density, which are the basic parameters for fracture prediction. The continuous rock mechanical parameters on a single-well profile are interpreted by logging data calculated according to the following equations (Lu S et al., 2015):
where, Ed is the Young’s modulus, MPa; μd is the Poisson’s ratio, dimensionless; ρb is rock density, kg/m3; Δtp and Δts are P-wave slowness-time and S-wave slowness-time, μs/ft.
Due to the strong heterogeneity of rock mechanical properties, this paper adopts the combination method of logging and seismic data to establish the distribution of 3D heterogeneous rock mechanical parameters (Xu et al., 2018). That is, the rock mechanical parameters are determined by seismic interval velocity, and constrained and corrected by logging data. It should be noted that logging and seismic data have different resolutions, and the vertical accuracy of logging data is much higher than that of seismic data. Therefore, during the correction of logging and seismic velocity, the arithmetic average coarsening method is adopted for the logging data to make them consistent with the seismic data sampling points for fitting.
From the 3D distribution of rock mechanical parameters in the Bozi gas field (Figure 9), the elastic modulus is mainly between 26 and 28 GPa, locally as high as 30 GPa; the Poisson’s ratio mainly ranges between 0.24 and 0.27, and the 3D numerical value of rock density mainly ranges between 2.5 and 2.6 g/cm3. Rock mechanical parameters show obvious heterogeneity within and among fault blocks.
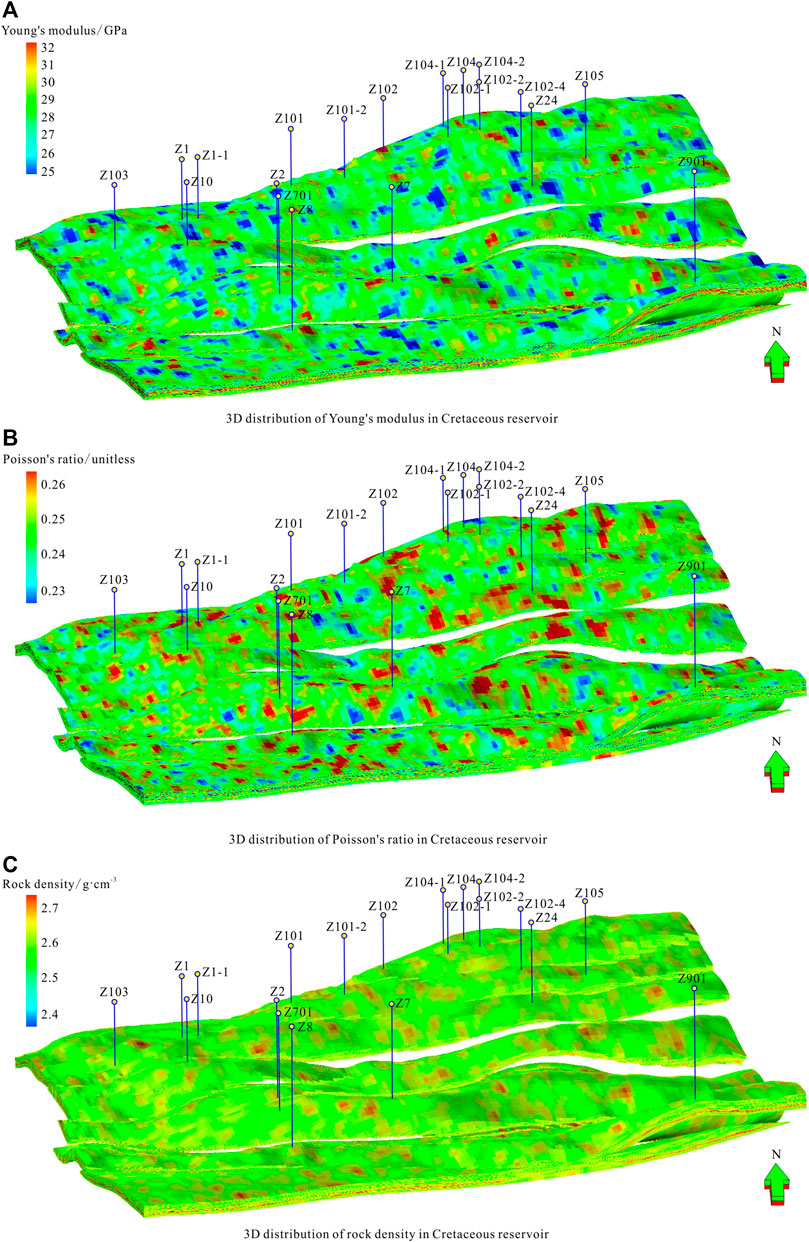
FIGURE 9. 3D heterogeneous rock mechanical parameters of Bozi gas field, (A) 3D distribution of Young’s modulus in Cretaceous reservoir; (B) 3D distribution of Poisson’s ratio in Cretaceous reservoir; (C) 3D distribution of rock density in Cretaceous reservoir.
Prediction of Fracture Distribution
In this study, the fracture prediction is based on 3D finite element method (FEM). The basic idea of FE numerical simulation method is (Ding et al., 2011), firstly, the geological body is discretized into several finite elements. The elements are connected by nodes, and the corresponding rock mechanical parameters are assigned to the corresponding elements. The basic variables of the field function in the study area include displacement, stress, and strain. According to the boundary stress conditions and node equilibrium conditions, the solution of the equations with the node displacement as the unknown quantity and the overall stiffness matrix as the coefficient matrix are obtained, followed by the displacement on each node, and then the stress and strain values in each element can be calculated.
The linear algebraic equation of finite element is (Song, 2012):
where, U is the displacement vector of system nodes, and K is the system stiffness matrix:
p is the equivalent nodal force vector of load, and Q is the equivalent nodal force vector of load q on the edge interface:
The stress and strain tensors under 3D conditions are expressed as vectors (Zoback, 2007):
where, T is the transpose of the matrix.
The constitutive equation is (Fossen, 2010):
where, D is the elastic matrix.
Based on the understanding of rock mechanical parameters and in situ stress distribution, we may calculate whether the rock has fracture and the degree of fracture using the rock fracture criterion, so as to clarify the distribution of fracture parameters.
Fractures in the Bozi gas field are mainly shear fractures based on the observations from core and rock thin sections; hence, the development degree and distribution state of shear fractures are mainly analyzed and judged according to the Coulomb-Navier criterion, in which the relationship between fracture and stress is as follows (Fossen, 2010):
where: τ is the shear stress, MPa; σn is normal stress, Mpa; C is the cohesion of rock, Mpa; and φ is the internal friction angle of rock, °.
However, the Coulomb–Navier criterion only considers the influence of the maximum principal stress and the minimum principal stress on the rock strength. It does not consider the contribution of intermediate principal stress to the rock strength. As an equivalent maximum shear stress model, it can only judge whether the rock has shear fracture rather than the degree of shear fracture development. Therefore, in order to explain the relationship between tectonic stress state and fracture development state, the concept of fracture value is introduced (Yu et al., 2016), which is defined as:
where, τ is the shear stress, Mpa; and τn is the shear strength, Mpa.
Therefore, if I << 1, it means that it is far from shear fracture of rock; if I < 1, it means that there is no shear fracture in the rock; if I > 1, it means that the rock has shear fracture; if I >> 1, it means that shear fracture has already occurred. The fracture value may be linked with the development degree of shear fracture, and it is considered that tectonic fractures are developed in areas with high fracture values than those in areas with low ones. Furthermore, by fitting the calculated shear fracture value with the fracture density of a single well, we may establish the quantitative relationship between rock fracture value and fracture development degree, thereby realizing the quantitative prediction of fractures.
Evaluation of Fracture Activity
The practice of oilfield production shows that under the action of both shear stress and normal stress, the fracture in critical state has better seepage capacity. Therefore, the shear deformation activity capacity of fracture may be regarded as one of the symbols to judge whether it is a high-quality fracture. When the in situ 3D principal stress acts on natural fracture surface, it may be decomposed into an effective normal stress perpendicular to the fracture surface σne and a shear stress parallel to the fracture surface τ; these two stresses are the main factors controlling geomechanical response of natural fractures.
The ratio of shear stress to normal stress, τ/σne, affects the sliding of fracture surface. It is not only a parameter reflecting the sliding of fracture surface but also an important index reflecting fracture permeability and fluidity (Zoback et al., 2012; Jiang et al., 2021).
The normal stress and shear stress can be defined by the relationship between fracture and principal stress field (Maerten and Maerten, 2006):
where, nij is the cosine direction (Zoback, 2007):
where: σ1, σ2, and σ3 are the maximum, intermediate, and minimum principal stress, respectively, (Mpa); γ is the included angle between the normal of the fracture surface and the minimum principal stress σ3, (°); λ is the included angle between the projection of fracture strike in plane σ1-σ2 and σ1, (°). According to the above method, based on the quantitative prediction of 3D distribution of natural fractures, the relationship between in situ stress tensor and fracture occurrence may be used to clarify the development location and occurrence information of the fracture with good activity (with high ratio of shear stress to normal stress τ/σne).
Result
Fracture Prediction Results
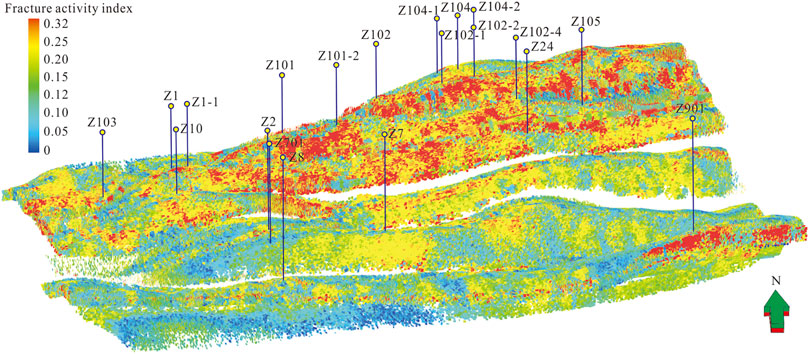
The prediction results of fracture density and fracture activity in the Bozi gas field are shown in Figure 10, in which the density of discrete fracture slices represents fracture density, the color represents fracture activity, with red for high and blue for low activity. It can be seen that fracture distribution in the Bozi gas field shows a certain pattern, and the fracture development gradually weakens from north to south. The fracture density of the Bozi 104 and Bozi 102 fault blocks in the north show the highest value, the fracture development degree of Bozi 1 fault block in the middle is reduced, and Bozi 9 fault block in the south has the lowest fracture development. From the fracture distribution in a single fault block, fractures are mostly developed in the higher part of anticline structure, and the farther away from the higher part of anticline structure, the lower the degree of fracture development. The fracture density near the fault is high, especially in the hanging wall of the thrust fault.
The distribution of fracture activity in the Bozi gas field shows strong heterogeneity. Overall, the fault block in the north is highly active, especially the Bozi 104 and Bozi 102 fault blocks. The Bozi 9 fault block in the south has poor fracture activity. For a single fault block, fractures in the higher structural part of most fault blocks have higher activity.
Error Analysis
In this study, fracture prediction results of 10 wells in the Bozi gas field are selected and compared with actual measured statistical results (Table 2), in which the calculation method of coincidence I is defined as follows:
where, Dm is the actual measured statistical result of fracture density, unit: number·m−1; DC is the fracture density predicted by numerical simulation, unit: number·m−1. It may be seen that the predicted coincidence of most wells is more than 85%, indicating that the fracture development predicted through numerical simulation is consistent with the results from core and thin section observation. Overall, the predicted results can reflect the fracture development and distribution in the study area.
The possible reasons for errors in the prediction results are as follows:
1) Accuracy of the geological model. Because the burial depth of the Cretaceous reservoir in the Bozi gas field is more than 6,000 m, or even close to 8,000 m, the overlying strata consist of a set of extremely thick gypsum-salt layer, which has a strong shielding effect on the seismic signal, resulting in poor quality of seismic data below the gypsum-salt layer and increasing the difficulty of structural interpretation. As a result, it is difficult to accurately reflect the shape of underground structure based on the structural map. The accuracy of the geological model will inevitably be reduced. In addition, the simplification of the model in the modeling process will also affect the accuracy of the final results.
2) Error caused by reservoir rock heterogeneity. Due to reservoir rock heterogeneity, rock mechanical parameters are constantly changing both laterally and vertically, that is, they exist in a continuous field function. Even if heterogeneous mechanical parameters are used, it is difficult to fully reflect the real underground situation, which will inevitably affect the prediction results.
3) Simplification of the fracture parameter calculation model. The micro process of rock fracture under stress is complex; it is difficult to describe the whole process with an accurate mathematical model. Therefore, the micro process of rock fracture is reasonably simplified in the calculation process, which will not have a significant impact on the prediction results but will obviously reduce the prediction accuracy.
4) The fracture distribution obtained from fracture prediction is a probability distribution, which represents the mathematical expected value of fracture parameters, that is, the “theoretical value” of fracture development. However, due to the complexity of fracture development, the actual fracture development may not be consistent with it. In addition, fracture distribution is not only controlled by stress, structural location, fault, etc., considered in numerical simulation, but also controlled by pore fluid and other factors, which are difficult to couple into numerical simulation at present.
Therefore, it is difficult to achieve complete numerical correspondence for the prediction results.
Conclusion
1) The fractures of Cretaceous reservoir in the Bozi gas field are relatively developed, most of which are tectonic in origin, and are high-angle shear fractures. The majority of fractures in the study area are semi filled and unfilled, which are formed under the rapid and strong compression in the Late Himalayan period, making great contribution to oil and gas migration and accumulation and gas well productivity.
2) The heterogeneity of fracture development and distribution in the Bozi gas field is extremely strong. Local structures such as folds and faults obviously control the fracture development characteristics and distribution. The degree of fracture development gradually weakens from north to south. The fracture density of Bozi 104 and Bozi 102 fault blocks in the north indicates the highest.
3) The fault block in the northern Bozi gas field has high fracture activity while that in the south is low. For a single fault block, the fractures in the higher part of the structure of most fault blocks have high activity.
Data Availability Statement
The original contributions presented in the study are included in the article/Supplementary Material, further inquiries can be directed to the corresponding author.
Author Contributions
KX, Conceptualization, Investigation, Writing—Original Draft; HZ, Supervision, Methodology, Validation; HW, Software, Visualization; ZW, Formal Analysis; GY, Data Curation; XW, Data Curation; TK, Formal Analysis; LH, Formal Analysis; ZW, Software; WZ, Software.
Funding
This study is funded by the Major National Science and Technology Project (2016ZX05051), Major Science and Technology Project of PetroChina Company Limited (2018E-1803), and China Postdoctoral Science Foundation (2019M660269).
Conflict of Interest
Authors KX, HZ, HW, ZW, GY, XW, TK, LH, ZW, and WZ are employed by PetroChina Tarim Oilfield Company.
Publisher’s Note
All claims expressed in this article are solely those of the authors and do not necessarily represent those of their affiliated organizations, or those of the publisher, the editors, and the reviewers. Any product that may be evaluated in this article, or claim that may be made by its manufacturer, is not guaranteed or endorsed by the publisher.
References
Casini, G., Gillespie, P. A., Vergés, J., Romaire, I., Fernández, N., Casciello, E., et al. (2011). Sub-seismic Fractures in Foreland Fold and Thrust Belts: Insight from the Lurestan Province, Zagros Mountains, Iran. Pet. Geosci. 17 (3), 263–282. doi:10.1144/1354-079310-043
Deng, H. C., Zhou, W., Jiang, W. L., Liu, Y., and Liang, F. (2009). Genetic Mechanism and Development Periods of Fracture in Yanchang and Yan’an Formation of Western Mahuangshan Block in Ordos Basin [J]. J. Jilin University(Earth Sci. Edition) 39 (5), 811–817.
Ding, W. L., Fan, T. L., Huang, X. B., and Li, C. Y. (20112011). Upper Ordovician Paleo Tectonic Stress Field Simulating and Fracture Distribution Forecasting in Tazhong Area of Tarim Basin, Xinjiang, China. [J]. Geol. Bull. China 30 (4), 588–594.
Dong, S. Q., Lyu, W. Y., Xia, D. L., Wang, S. J., Du, X. Y., Wang, T., et al. (2020). An Approach to 3D Geological Modeling of Multi-Scaled Fractures in Tight sandstone Reservoirs. Oil Gas Geology. 41 (3), 627–637. (in Chinese with English abstract). doi:10.11743/ogg20200318
Ellis, M. A., Laubach, S. E., Eichhubl, P., Olson, J. E., and Hargrove, P. (2012). Fracture Development and Diagenesis of Torridon Group Applecross Formation, Near an Teallach, NW Scotland: Millennia of Brittle Deformation Resilience? J. Geol. Soc. 169 (3), 297–310. doi:10.1144/0016-76492011-086
Feng, C. D., Dai, J. S., Deng, H., Xiao, X. J., Zhao, L. B., Zheng, G. Q., et al. (2011). Quantitative Evaluation of Fractures with Fractal Geometry in Kela-2 Gas Field[J]. Oil Gas Geology. 32 (54), 928–933.
Gu, Y., Ding, W., Tian, Q., Xu, S., Zhang, W., Zhang, B., et al. (2020). Developmental Characteristics and Dominant Factors of Natural Fractures in Lower Silurian marine Organic-Rich Shale Reservoirs: A Case Study of the Longmaxi Formation in the Fenggang Block, Southern China. J. Pet. Sci. Eng. 192, 107277. doi:10.1016/j.petrol.2020.107277
He, D. F., Jia, C. Z., Deng, S., Zhang, C. J., Meng, Q. R., and Shi, X. (2005). Formation and Evolution of Polycyclic Superimposed Tarim Basin [J]. Oil Gas Geology. 26 (01), 64–77. doi:10.11743/ogg20050109
Huang, J. X., Peng, S. B., Wang, X. J., and Xiao, K. (2006). Applications of Imaging Logging Data in the Research of Fracture and Ground Stress [J]. Acta Petrolei Sinica 27 (6), 65–69.
Jia, C., Zhang, Y., and Zhao, X. (2014). Prospects of and Challenges to Natural Gas Industry Development in China [J]. Nat. Gas Industry 34 (2), 1–11.
Jiang, T. W., Zhang, H., Xu, K., Yin, G. Q., Wang, H. Y., Wang, Z. M., et al. (2021). Technology and Practice for Quantitative Optimization of Borehole Trajectory in Ultra-deep Fractured Reservoir: a Case Study of Bozi A Gas Reservoir in Kelasu Structural belt, Tarim Basin. China Pet. Exploration 26 (4), 149–161. (in Chinese with English abstract). doi:10.3969/j.issn.1672-7703.2021.04.001
Ju, W., Hou, G. T., Huang, S. Y., and Ren, K. X. (2013). Structural Fracture Distribution and Prediction of the Lower Jurassic Ahe Formation Sandstone in the Yinan-Tuzi Area, Kuqa Depression. Geotectonica et Metallogenia 37 (4), 592–602. (in Chinese with English abstract).
Ju, W., You, Y., Feng, S. B., Xu, H. R., Zhang, X. L., and Wang, S. Y. (2020). Characteristics and Genesis of Bedding-Parallel Fractures in Tight sandstone Reservoirs of Chang 7 Oil Layer, Ordos Basin. Oil Gas Geology. 41 (3), 596–605. (in Chinese with English abstract). doi:10.11743/ogg20200315
Laubach, S. E., Olson, J. E., and Gross, M. R. (20092009). Mechanical and Fracture Stratigraphy. Bulletin 93 (11), 1413–1426. doi:10.1306/07270909094
Li, H., Cai, Z. Q., Tan, X. C., He, X. Q., Lyu, B., Du, W. F., et al. (2008). Forecasting of Fracture Reservoirs in Thin Carbonate Rocks of Precipitous Structure belt, East Sichuan[J]. Pet. Exploration Development 35 (4), 431–436. doi:10.1016/s1876-3804(09)60092-6
Li, J. H., Yang, S. C., Chen, N. N., and Zhao, X. D. (2009). Forecasting Method of Tectoclase in the Igneous Reservoirs Using a Curvature of the Microtectonics [J]. J. China Univ. Mining Technology 38 (6), 815–819.
Liu, J. S., Ding, W. L., Xiao, Z. H., and Dai, J. S. (2019). Advances in Comprehensive Characterization and Prediction of Reservoir Fractures. Prog. Geophys. 34 (6), 2283–2300. (in Chinese with English abstract). doi:10.6038/pg2019CC0290
Liu, J. Z., Han, L., Shi, L., Chen, S. Q., and Lyu, W. Y. (2021). Seismic Prediction of Tight sandstone Reservoir Fractures in XC Area Western Sichuan Basin [J]. Oil Gas Geology. 42 (03), 747–754.
Lu, H., Lu, X. S., Fan, J. S., Wang, X. H., Fu, X. F., Wei, H. X., et al. (2015). The Controlling Effects of Fractures on Gas Accumulation and Production in Tight Sandstone:A Case of Jurassic Dibei Gas Reservoir in the East Kuqa Foreland Basin[J]. Nat. Gas Geosci. 26 (6), 1047–1056.
Lu, S. K., Wang, D., Li, Y. K., Meng, X. J., Hu, X. Y., and Chen, S. W. (2015). Research on Three-Dimensional Mechanical Parameters’ Distribution of the Tight sandstone Reservoirs in Daniudi Gasfield[J]. Nat. Gas Geosci. 26 (10), 1844–1850.
Luo, Q. (2010). Core Observation and Description of Tight Sandstone Fractured Reservoir: An Example from Wenmingzhai Tight Sandstone[J]. Xinjiang Pet. Geology. 31 (3), 229–231.
Maerten, L., and Maerten, F. (2006). Chronologic Modeling of Faulted and Fractured Reservoirs Using Geomechanically Based Restoration: Technique and Industry Applications. Bulletin 90 (8), 1201–1226. doi:10.1306/02240605116
Nelson, R. A. (2001). Geologic Analysis of Naturally Fractured Reservoirs [M]. second edition. Houston: Gulf Professional Publishing.
Neng, Y., Li, Y., Xie, H., Shi, K., and Ren, C. (2019). Tectonic Transformation Characteristics of Subsalt Thrut Belts in Kuqa Foreland Basin[J]. Xinjiang Pet. Geology. 40 (1), 54–60. doi:10.7657/XJPG20190108
Neng, Y., Qi, J. F., Xie, H. W., Li, Y., Lei, G. L., and Wu, C. (2012). Structural Characteristics of Northern Margin of Kuqa Depression, Tarim basin. Geol. Bull. China 31 (09), 1510–1519.
Olson, J. E., Laubach, S. E., and Lander, R. H. (2009). Natural Fracture Characterization in Tight Gas Sandstones: Integrating Mechanics and Diagenesis. Bulletin 93 (11), 1535–1549. doi:10.1306/08110909100
Qi, J. F., Li, Y., Wu, C., and Yang, S.-J. (2013). The Interpretation Models and Discussion on the Contractive Structure Deformation of Kuqa Depression. Tarim Basin[j]. Geology. China 40 (01), 106–120.
Ren, Q., Jin, Q., Feng, J., Li, Z., and Du, H. (2020). Geomechanical Models for the Quantitatively Prediction of Multi-Scale Fracture Distribution in Carbonate Reservoirs. J. Struct. Geology. 135, 104033. doi:10.1016/j.jsg.2020.104033
Song, H. Z. (2012). Tectonic Stress Field and Finite Element Method [M]. Dongying: University of Petroleum Press.
Tian, J., Yang, H. J., Wu, C., Mo, T., Zhu, W. H., and Shi, L. L. (2020). Discovery of Well Bozi 9 and Ultra-deep Natural Gas Exploration Potential in the Kelasu Tectonic Zone of the Tarim Basin [J]. Nat. Gas Industry 40 (1), 11–19.
Wang, K. (2014). Quantitative Description of Reservoir Fracture in Clastic Rocks of Keshen Gasfield.
Wang, K., Yang, H. J., Li, Y., Zhang, R. H., Yang, X. J., and Wang, J. P. (2020). Formation Sequence and Distribution Regularity of Structural Fracture in Tight Sandstone Reservoir of Keshen Gas Field in Kuqa DepressionTarim Basin. Geotectonica et Metallogenia 44 (1), 30–46. (in Chinese with English abstract). doi:10.16539/j.ddgzyckx.2020.01.003
Wang, X., Wu, Z., Bo, Z., and Yin, H. W. (2010). Cenozoic Salt Tectonics and Physical Models in the Kuqa Depression of Tarim Basin, China. SciSin Terrae 40 (12), 1655–1668.
Wang, Y., Chen, X. G., Wang, Y. L., and Gui, Z. X. (2014). Application of Multiple post Stack Seismic Attributes in the Prediction of Carboniferous Fracture in West Hashan[J]. Prog. Geophys. 29 (04), 1772–1779.
Wang, Z. (2014). Formation Mechanism and Enrichment Regularities of Kelasu Subsalt Deep Large Gas Field in Kuqa Depression, Tarim Basin[J]. Nat. Gas Geosci. 25 (2), 153–166.
Wang, Z. M., Li, Y., Xie, H. W., and Neng, Y. (2016). Geological Understanding on the Formation of Large-Scale Ultra-deep Oil-Gas Feld in Kuqa Foreland basin. China Pet. Exploration 21 (1), 37–43. (in Chinese with English abstract). doi:10.3969/j.issn.1672-7703.2016.01.004
Wang, Z. M., Xie, H. W., Li, Y., Lei, G. L., Wu, C., Yang, X. Z., et al. (2013). Exploration and Discovery of Large and Deep Subsalt Gas Fields in Kuqa Foreland Thrust Belt [J]. China Pet. Exploration 18 (03), 1–11.
Xu, K., Dai, J. S., Feng, J. W., Shang, L., and Ren, Q. Q. (2018). Prediction of 3D Heterogeneous In-Situ Stress Field of Northern Area in Gaoshen, Nanpu Sag, Bohai Bay Basin, China[J]. J. China Univ. Miniming Technology 1 (6), 1276–1286. doi:10.1007/s12182-019-00360-w
Yang, H. J., Chen, Y. Q., Tian, J., Du, J. H., Zhu, Y. F., Li, H. H., et al. (2020). Great Discovery and its Signifi Cance of Ultra-deep Oil and Gas Exploration in Well Luntan-1 of the Tarim Basin [J]. China Pet. Exploration 25 (2), 62–72.
Yang, X. W., Tian, J., Wang, Q. H., Li, Y. L., Yang, H. J., Li, Y., et al. (2021). Geological Understanding and Favorable Exploration fields of Ultra-deep Formations in Tarim Basin [J]. China Pet. Exploration 26 (04), 17–28.
Yu, X., Hou, G. T., Li, Y., Lei, G. L., Neng, Y., Wei, H. X., et al. (2016). Quantitative Prediction of Tectonic Fractures of Lower Jurassic Ahe Formation Sand-Dibei Gasfield. Earth Sci. Front. 23 (01), 240–252. doi:10.13745/j.esf.2016.01.022
Yuan, J., Yang, X. J., Yuan, L. R., Chen, R. H., Zhu, Z. Q., Li, C. T., et al. (2015). Cementation and its Relationship with Tectonic Fractures of Cretaceous Sandstones in DB Gas Field of Kuqa Sub-basin. Acta Sedimentologica Sinica 33 (4), 754–763. (in Chinese with English abstract). doi:10.14027/j.cnki.cjxb.2015.04.014
Zeng, L. B., Li, Y. G., Wang, Z. G., Chen, G. M., and Li, M. (2007). Distribution of Microfractures in Ultralow Permeability sandstone Reservoirs of the Second Member of Xujiahe formation(T3x2) in Qiongxi Structure [J]. Nat. Gas Industry 27 (6), 1–3.
Zeng, L. B., Lyu, W. Y., Zhang, Y. Z., Liu, G. P., and Dong, S. Q. (2021). The Effect of Multi-Scale Faults and Fractures on Oil Enrichment and Production in Tight sandstone Reservoirs: A Case Study in the Southwestern Ordos Basin, China. Front. Earth Sci. 1 (9), 1–12. doi:10.3389/feart.2021.664629
Zeng, L. X., and Li, X. Y. (2009). Fractures in sandstone Reservoirs with Ultra-low Permeability: A Case Study of the Upper Triassic Yanchang Formation in the Ordos Basin, China [J]. AAPG Bull. 93 (4), 461–477.
Zoback, M. D., Kohli, A., Das, I., and Mcclure, M. (2012). The Importance of Slow Slip on Faults during Hydraulic Fracturing Stimulation of Shale Gas reservoirs[C]//Society of Petroleum Engineers SPE Americas Unconventional Resources Conference. Pennsylvania, USA: Pittsburg. doi:10.2118/155476-MS
Keywords: ultra-deep tight sandstone reservoir, in situ stress, fracture activity, Bozi gas field, Kuqa depression, fracture prediction, geomechanics
Citation: Xu K, Zhang H, Wang H, Wang Z, Yin G, Wang X, Kang T, Huang L, Wang Z and Zhao W (2022) 3D Geomechanical Modeling and Prediction of Fractures in the Bozi Ultra-Deep Gas Field in the Kuqa Depression of Tarim Basin. Front. Earth Sci. 10:863033. doi: 10.3389/feart.2022.863033
Received: 26 January 2022; Accepted: 09 February 2022;
Published: 21 March 2022.
Edited by:
Wei Ju, China University of Mining and Technology, ChinaReviewed by:
Jingshou Liu, China University of Geosciences Wuhan, ChinaShuai Yin, Xi’an Shiyou University, China
Copyright © 2022 Xu, Zhang, Wang, Wang, Yin, Wang, Kang, Huang, Wang and Zhao. This is an open-access article distributed under the terms of the Creative Commons Attribution License (CC BY). The use, distribution or reproduction in other forums is permitted, provided the original author(s) and the copyright owner(s) are credited and that the original publication in this journal is cited, in accordance with accepted academic practice. No use, distribution or reproduction is permitted which does not comply with these terms.
*Correspondence: Ke Xu, eHVrZWUwNTA1QDE2My5jb20=
 Ke Xu
Ke Xu Hui Zhang