 Xinli Cao
 Huamei Mo
 Guolong Zhang
 Qingwen Zhang
 Feng Fan
- 1Key Lab of Structures Dynamic Behavior and Control of the Ministry of Education, Harbin Institute of Technology, Harbin, China
- 2Key Lab of Smart Prevention and Mitigation of Civil Engineering Disasters of the Ministry of Industry and Information Technology, Harbin Institute of Technology, Harbin, China
Snow sliding of roofs is a threat to the structural safety of roof structures by causing a surcharge of local snow load on the lower roof and may pose a serious threat to pedestrians and vehicles on the ground. Therefore, it is of great significance to study the mechanism of snow sliding on roofs. Under the action of ambient temperature, solar radiation, internal heating of the building, etc., the bottom layer of roof snow is often presented in the form of porous ice after a complicated phase transition of the snow particles. Under this circumstance, the interface between roof snow and the roof can be seen as the contact between porous ice and the roofing material. In order to investigate the initialization of roof snow sliding from the material point of view, the shear performance of the interface between different roofing materials and ice with different porosities was carried out in this study. The effects of different ambient temperatures (−4, −6, and −8°C), different normal stress (0, 50, and 100 kPa), and different ice porosities (represented by the contact area ratio of 1.0, 0.8, and 0.6) on this shear performance were analyzed by direct shear tests. The test results showed that the shear failure between the ice and the roofing material was brittle, and the interface shear strength was affected by the ambient temperature, normal stress, contact area ratio, as well as the material type: the strength increases with the decrease of ambient temperature, the increase of normal stress, the increase of contact area ratio, and the increase of surface roughness of the material. Based on the test results, a quantitative relationship between the interface shear strength and the related factors was given in the article, which provides a useful reference for future experimental or simulation studies on roof snow sliding.
Introduction
Under the action of ambient temperature, solar radiation, and internal heating of the building, snow particles in the bottom layer of roof snow may become ice grains bonding to the roof after the complicated phase transition. In this case, the contact interface between roof snow and the roof can be seen as the contact between ice and the roofing material, where the ice is presented with certain porosity. For sloped roofs, as the temperature rises and/or the roof snow continues to accumulate, the shear strength between the ice and the roof may be gradually overcome by the gravity component that is parallel to the roof. Eventually, the snow slides from the roof and forms a local concentrated snow load on the lower roof, which will increase the risk of collapse of the lower roof (MacKinlay et al., 2000); the slide of roof snow may also be a serious threat to pedestrians and vehicles on the ground. Therefore, it is significant to investigate the mechanism of roof snow sliding so as to predict and control the sliding of roof snow to reduce relevant risks. Sliding of roof snow has been considered in specifying roof snow load coefficients in some design codes such as the Japanese and European codes (AIJ, 2004; BSI, 2003), but has not been considered in the Chinese design code (MOHURD, 2012) due to a lack of understanding of the roof snow sliding.
The process of roof snow sliding is a very complex mechanical process, which is influenced by various factors such as roofing materials, snow depth, atmospheric temperature, internal heating of the building, phase transition of snow particles, etc. Sack et al. (1986) pointed out that the main forces for unshielded roofs to resist snow sliding are bonding force and friction force, and a probability model for the occurrence of roof snow sliding was proposed based on observed snow sliding events on sloped metal roofs with different slopes, where snowpack properties and atmospheric temperature were considered. Two methods to measure the friction coefficient between snow and roof were proposed by SINTEF (2008). Jelle (2013) studied the snow sliding on solar panels and found that snow and ice could be attached to the vertical surface of glass under certain climatic conditions, indicating that the adhesion between the snow and roof has an important impact on the snow sliding on building roofs. The risk of snow and ice sliding on building roofs was studied by Williams et al. (2004), it is indicated that factors such as roofing materials and roof temperature have a great influence on snow/ice sliding on building roofs, the increase of atmospheric temperature results in the melting of roof snow/ice, and the bonding force and friction force between snow/ice and roofing material decreases, leading to snow/ice sliding from roofs. It is also pointed out by Takakura et al. (2000) that snow sliding is not only influenced by the slope of the roofs but also by the atmospheric temperature of the region, and there is a positive correlation between atmospheric temperature and the probability of roof snow sliding. The temperature is then the main factor to be considered in studies of roof snow sliding. For instance, in a study that is focused on the frequency of snow sliding on sloped roofs, Isyumov and Mikitiuk (2008) assumed that the criterion of roof snow sliding is that the atmospheric temperature reaches 0°C. Zhou et al. (2013) also used 0°C as one of the criteria for the snow to slide on roofs.
As can be seen from the aforementioned review, although some previous studies focusing on roof snow sliding have been carried out by various researchers, none of them could fully consider the influence of ambient temperature, the roofing materials, the normal stress, and the porosity of the snow/ice, which will all affect the sliding of the roof snow. As mentioned earlier, the contact between the roof snow and the roofing material may be seen as the contact between porous ice and the roofing material. In this case, the roof snow sliding is actually an interaction between the ice and the roofing material, the forces that need to be overcome for snow sliding are then the bonding force and friction force between the ice and the roofing material. Although some literature has studied the shear strength of sea ice (Frederking and Timco, 1984; Timco and Weeks, 2009)between ice and solid surfaces (Aoyama et al., 2006; Zou et al., 2011; Bharathidasan et al., 2014), it seems that no study has been carried out to investigate the shear strength of the interface between ice and commonly-used roofing materials by fully considering the influences of ambient temperature, normal stress, the porosity of ice, and surface roughness. In order to investigate the mechanism of roof snow sliding in the presence of ice from a material point of view, this article conducts an experimental study on the shear strength between ice and commonly-used roofing materials such as concrete, steel, membrane, and glass. The tests are carried out between ice with different porosities (0, 20, and 40%) and different roof materials under different ambient temperatures (−4, −6, and −8°C) and different normal stresses (0, 50, and 100 kPa), such that the influence of ice porosity, material roughness, temperatures, and normal stresses could all be considered. It should be noted that the roof snow load is typically less than 2 kPa (e.g., in China), the consideration of normal stresses of 50 and 100 kPa is for the purpose of effectively revealing the impact of normal stress on the shear strength. In addition, ice porosity is represented by contact area ratio, A, which is defined as the ratio of the contact area to the gross intersectional area of the interface, so that the porosities of 0, 20, and 40% are represented by contact area ratios of 1.0, 0.8, and 0.6, respectively. In the following sections, the test setup is first described in the Experimental Design Section and then the test results are presented in the Experimental Results Section. Finally, the conclusions and prospects for possible future research are given in the Conclusion Section.
Experimental Design
Test Facility
The interface shear tests between ice and roofing materials were conducted by a low-temperature direct shear apparatus, which consists of a low-temperature water bath system (part 1 in Figure 1A), a motor (part 2 in Figure 1A), a sliding shear box (part 3 in Figure 1A), a proving ring (part 4 in Figure 1A), and a data acquisition system (part 5 in Figure 1A). The low-temperature water bath system uses industrial alcohol to maintain a temperature that is lower than 0°C, and is connected with the shear box through inlet and outlet hoses to keep the shear box at a low temperature. The shear box is composed of the upper and lower halves, both of which are 61.8 mm in diameter and 20 mm in height, the shear force is applied by pushing the lower part of the shear box by the motor, and the normal stress is loaded on the top of the shear box. The stress ring provides rigid support for the upper part of the shear box, and the corresponding shear stress is derived by detecting the deformation of the ring. The data acquisition system records the shear stress and horizontal displacement of the stress ring. The selection of the size for the stress ring should be appropriate such that it could detect the possible lowest stress and could cover the possible highest stress. Considering that the shear strength of freshwater ice is 410 ± 190 kPa as reported in Timco and Frederking (1982), and that the intersection area of the shear box is 3,000 mm2, a stress ring with a maximum load capacity of 3 kN is selected to meet the test requirement.
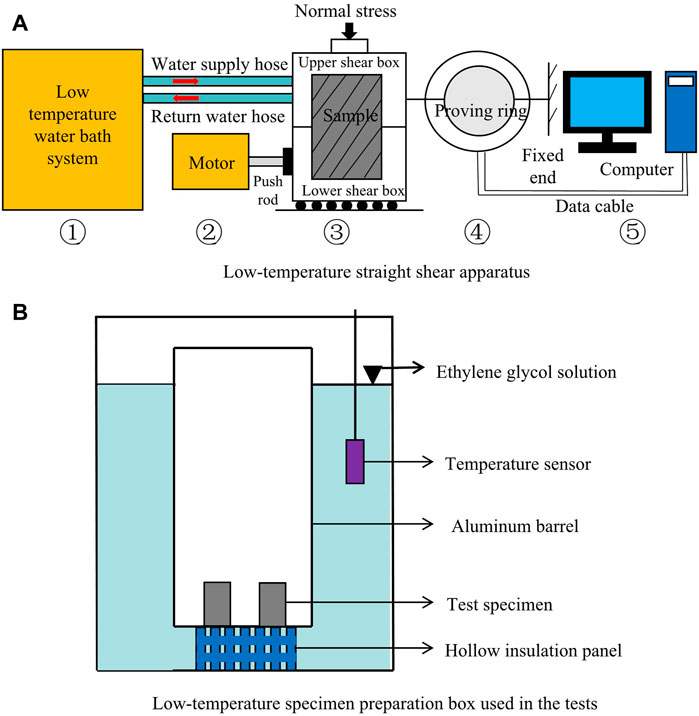
FIGURE 1. Schematic diagram of (A) the low-temperature straight shear apparatus and (B) the low-temperature specimen preparation box used in the tests.
Besides the direct shear test system, a low-temperature specimen preparation box (Figure 1B) is designed and fabricated in this study, which is used in the tests to keep the specimen at a pre-selected low temperature. The low-temperature specimen preparation box is a horizontal refrigerator that uses ethylene glycol solution of a 30% concentration to maintain the required low temperature (the freezing point temperature of the solution is −10°C). A temperature controller is placed inside the ethylene glycol solution to control the temperature of the box with the help of a temperature sensor that is ±0.1°C in resolution. In this way, the temperature control of the specimen preparation box is much more precise than traditional refrigerators whose temperature may fluctuate between 3–5°C. Test specimens are placed in an aluminum alloy barrel that is surrounded by the ethylene glycol solution. To avoid corrosion of the aluminum surface by the ethylene glycol solution, a 5–8‰ volume of corrosion inhibitor is put in the ethylene glycol solution.
Another instrument used in the test is the roughness measuring system TR200 as shown in Figure 2. This is used to measure the surface roughness of the roofing materials so that the influence of the materials could be quantitatively measured by considering the roughness height of the material. The TR200 system has a measuring range of 0.005–16.00 μm and can be widely used for the roughness measurement of metal and non-metal surfaces. In the measurement, the probe is gently placed on the surface and driven to run a distance of 2.5 mm, the sensor obtains the surface roughness by converting the fluctuation of the probe into an electrical signal.
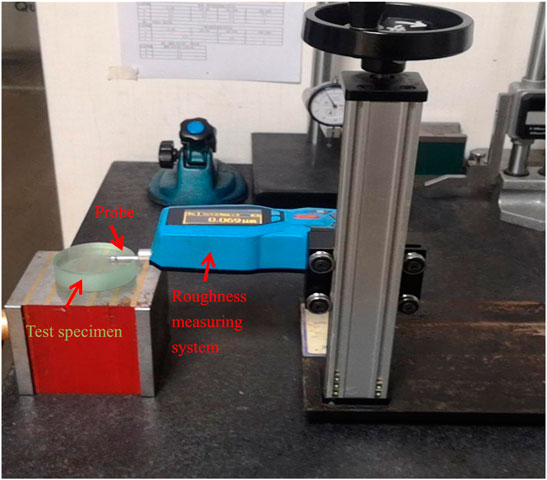
FIGURE 2. The surface roughness-measuring instrument used in the tests.
Specimen Preparation
Roofing Materials
The roofing materials considered in the tests are glass, steel, membrane, and concrete. In order to ensure that the interface is exactly on the shear surface, the overall height of the roofing material specimen is set to 20 mm according to the size of the shear box in the straight shear apparatus. For this purpose, the glass, steel, and membrane materials are pasted on an aluminum circular column that is 61.8 mm in diameter. The height of the aluminum column differs for different materials such that the total height after pasting the material is exactly 20 mm. The concrete roofing material is prepared by pouring well-mixed fine aggregate concrete into a ring knife that is 61.8 mm in diameter and 20 mm in height. The internal wall of the ring knife is coated with petroleum jelly for lubrication. The specimen is then maintained according to the corresponding provisions of concrete maintenance for 21 days before it is taken out for use. Figure 3 shows examples of specimens for the four kinds of roofing materials prepared in the test.
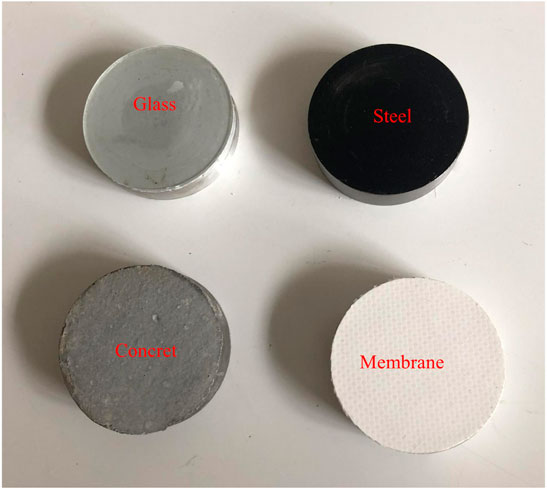
FIGURE 3. Specimen of the roofing materials.
Surface Roughness of Roofing Materials
Before the shear test, the surface roughness of the roofing materials was measured by the surface roughness measuring system (Figure 2). In order to minimize the possible measurement error, the measurement is repeated three times (at different locations) for each material specimen, and the roughness of the measured material is taken as the average value of the three measurements. The results of the measurement are listed in Table 1.
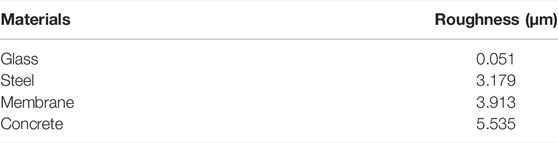
TABLE 1. Roughness of the considered roofing materials.
It can be seen from Table 1 that the surface roughness for different materials varies significantly: the roughness of glass is close to 0, which is the lowest among the four materials, while that of concrete is the highest with a reading of about 5.5 μm. The roughness of steel and the membrane material is close and is both between 3 and 4 μm. The roughness measurement results are consistent with public perceptions, that is, among the four considered materials, the glass is the smoothest one, and the steel and membrane material take the second position, while the concrete is the roughest. The upcoming shear test results indicate that the surface roughness of the materials will directly affect the shear strength of the ice–material interface.
Combined Ice-Roofing Material Specimens
The mold used for specimen preparation was a steel ring of 61.8 mm in diameter and 40 mm in height. To prepare the specimen, petroleum jelly is first evenly coated on the internal wall of the mold (Figures 4A,B), then roofing material specimens prepared in the Roofing Materials Subsection are placed into the mold, after that, pure water is poured into the mold (Figure 4C), and the whole specimen is placed in the low-temperature specimen preparation box for freezing for 24 h. After 24 h (Figure 4D), the mold is removed and the ice chips on the surface of the specimen are quickly trimmed off (Figure 4E) to make the top smooth, the frozen specimen (Figure 4F) is then placed into the low-temperature specimen preparation box again for storage. The specimen is stored in the preparation box for at least 24 h to allow the internal temperature of the specimen to be evenly distributed and is the same as the designed test temperature. Pure water is used in the specimen preparation to avoid internal air bubbles that could affect the test result.
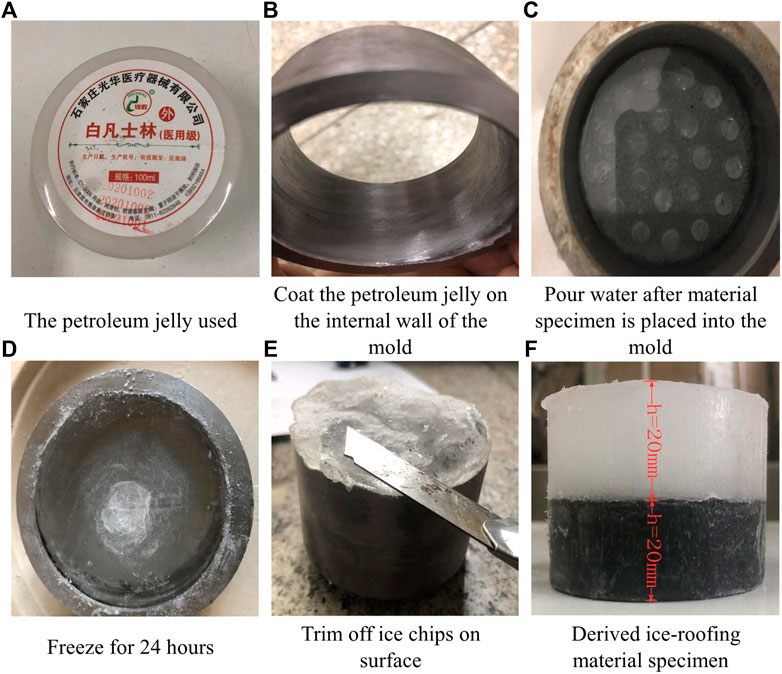
FIGURE 4. Illustration of specimen preparation: (A–F) show the sequential steps for making the combined ice-roofing material specimens.
It is noted that the direction of the ice crystal growth would affect the results of the shear tests. Consequently, the crystal growth in the ice samples is not controlled to make them consistent with those naturally grown on roofs. In fact, the ice crystal grows along the direction of the temperature gradient (Dennis and Scott, 1973; Colbeck, 1983), and the temperature gradient of the water body in both the experiment and in nature is vertical, resulting in the vertical growth of ice crystals in both the two cases. Nevertheless, the temperature in nature is time-varying while that in the laboratory is controlled to be constant, which will bring differences in the microstructure of the ice, the effects of this difference in the shear strength deserve further investigation in the future.
Control of Different Contact Areas at the Interface
In the test, the porosity of the ice was simulated by controlling the contact area between the ice and the roofing material. The control method is as follows: prepare an acrylic plate with a diameter of 61.8 mm and a thickness of 1 mm; uniformly open a number of holes with diameters of 6 mm on the plate, the number of openings varies according to the target contact area; then, place the acrylic plate with holes on the roofing material that is prepared in the Roofing Materials Subsection, and then fill the holes with petroleum jelly. After removing the acrylic plate, uniform petroleum jelly dots are left on the roofing material plate. Since petroleum jelly is non-Newtonian and hydrophobic, it can isolate the roof materials from the water where it is presented. After these steps, the roofing material is used to prepare the combined ice–roof material specimen by the method of 2.2.2. Examples of the specimens with different area ratios are given in Figure 5, where the specimen in Figure 5A has a contact area ratio A of 1.0 (porosity of 0%), the one in Figures 5B,C is associated with A of 0.8 and 0.6 (porosity of 20 and 40%), respectively.
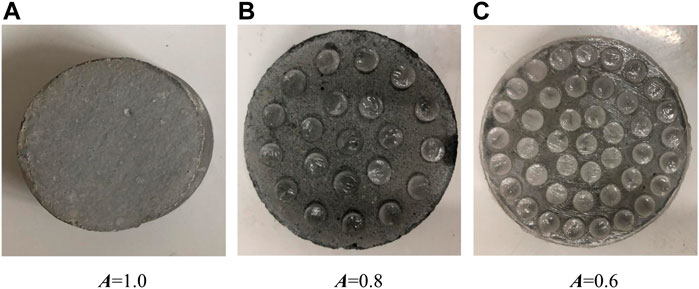
FIGURE 5. Examples of the specimen with different contact area ratios: (A) A = 1.0; (B) A = 0.8; (C) A = 0.6.
Test Design
As has been mentioned previously, the tests consider the influence of temperature, normal stress, contact area ratio, and surface roughness on the shear strength of the ice–material interface, the ranges of the variables considered in the tests are listed in Table 2. It should be noted that the temperature was originally set to be 0, −2, −4, −6, and −8°C by considering that roof snow sliding could hardly occur at lower temperatures; unfortunately, for the two cases of 0°C and −2°C, the combined specimen could be easily cracked in the process of preparing the specimen or when putting the specimen into the shear box, making it difficult to set up the test. Consequently, only three cases for temperature (−4, −6, and −8°C) were considered at the end. The normal stresses considered in the tests are selected by following the suggestions of the Chinese Standard for Geotechnical Testing Method (MWR-PRC, 2019) since no relevant references could be found. In addition, for comparison, a pure ice column is also considered in the test except for the four commonly-used roofing materials of glass, steel, membrane, and concrete. According to the different combinations of parameters, a total number of 135 tests were carried out in the study.
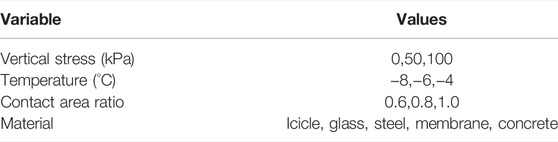
TABLE 2. Parameters considered in the tests.
Test Procedure
The shear tests of the ice–material interface are conducted at the low-temperature straight shear apparatus shown in Figure 1. The test procedure is as follows: 1) start the water bath system to acquire a preset temperature before the test; 2) put the specimen into the shear box; 3) apply a designed normal stress to the specimen; 4) start the low-temperature straight shear instrument and push the lower half of the shear box until shear failure is observed (see Figure 6 for examples of interface failure). At the first stage of the test, due to the presence of bonding force and static friction at the ice–material interface, the shear box moves horizontally as a whole in the direction of the motor push, but the upper and lower halves of the shear box do not have relative displacement. As the overall displacement of the shear box increases, the lateral support provided by the stress ring increases. When the lateral force provided by the stress ring reaches the shear capacity of the specimen (i.e., the shear force reaches the sum of the interface bonding force and maximum static friction), shear failure of the interface occurs and the stress ring restores its original state. The shear stress–displacement curve is recorded automatically by the data acquisition system. Note that the system converts shear force to shear stress by assuming that the two sides of the interface are 100% contacted by default. Consequently, the shear strength of the interface is not necessarily the recorded peak shear stress, but should take the contact area ratio into account.
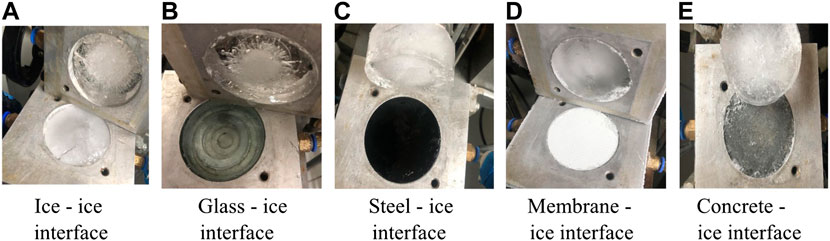
FIGURE. 6. Specimen after shear failure: (A) ice–ice interface, (B) glass–ice interface, (C) steel–ice interface, (D) membrane–ice interface, and (E) concrete–ice interface.
Experiment Results
Shear Characteristics of the Ice-Material Interfaces
Using the method described in the previous section, a total number of 135 tests were carried out for the study, and brittle failures were observed for all of the tests during the experiments. As an example, Figure 7 shows the shear stress–shear displacement curve for the case where normal stress σ=0 kPa, temperature T=−4°C, and area ratio A=1.0. It can be seen from Figure 7 that at the first stage of shearing, shear stress increases gradually with the increase of shear displacement, and the relationship between stress and displacement is basically linear until the curve reaches its peak. After the peak point, the displacement increases sharply while the shear stress drops to 0 rapidly, indicating a brittle shear failure of the interface. This observation on the shear stress–shear displacement curve is similar to that made by Zou et al. (2011), where ice adhesion strengths on aluminum surfaces were investigated. The peak point of the shear stress–shear displacement curve is to be taken as the shear strength of the ice–material interface. As mentioned earlier, the test system assumes that the contact area ratio is 1.0 by default. Therefore, when the contact area ratio is less than 1.0, the shear stress obtained in the test should be divided by the contact area ratio to get the actual shear strength of the interface.
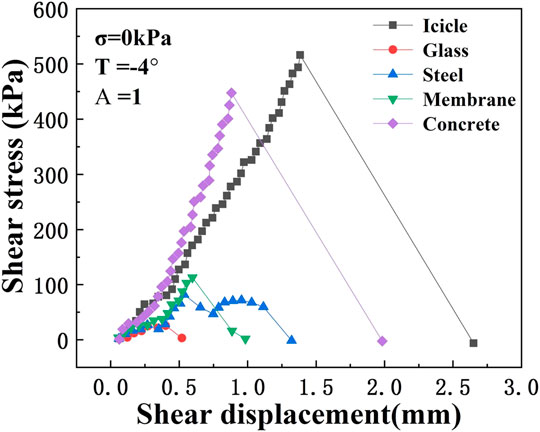
FIGURE 7. An example of the shear stress–shear displacement curve when normal stress σ=0 kPa, temperature T=−4°C, and contact area ratio A=1.0.
It can also be observed from Figure 7 that among the five materials that are considered, the ice–ice interface has the highest shear strength, followed by the ice–concrete interface, and both of them are significantly higher than the other three materials, indicating that roofing materials have an important impact on snow/ice sliding on roofs. Since the ice–ice interface is associated with the highest shear strength, snow/ice sliding on roofs is unlikely to take place between the snow/ice layers but could only occur in the contact interface between snow/ice and the roof. This implies that once the snow/ice sliding occurs, all the snow on the roof will slide off as a whole, which will bring an extraordinary impact on the lower roof or the ground.
In addition, it is noted in Figure 7 that there is no residual stress after the failure of the interface, this indicates that the friction of the two sides in the interface is negligible. This is understandable since the applied normal stress is 0 and the self-weight of the specimen is quite small. By considering the fact that roof snow loads are typically less than 2 kPa in China, friction between the snow layer and the roof could be ignored in the analysis of roof snow sliding, and the sliding of roof snow is dominated by the adhesion force of the snow layer to the roof.
Shear Strength of the Ice-Material Interfaces
Figure 8—Figure 10 respectively show the changes of the interface shear strength with normal stress, temperature, and contact area ratio. It can be seen from Figure 8 that under the same temperature and contact area ratio, the shear strength of the same roofing material increases with the increase of normal stress. This is because the presence of normal stress increases the friction between the ice and the roofing material, and therefore increases the shear strength of the interface. A simple statistic shows that as the normal stress increases from 0 to 100 kPa, the shear strength of the ice–ice interface, ice–concrete interface, ice–membrane interface, ice–steel interface, and ice–glass interface increases by 119 kPa (or 40%), 152 kPa (or 74%), 97 kPa (or 187%), 132 kPa (or 252%), and 64 kPa (or 183%), respectively. This indicates that with the decrease of roughness, the weight of friction in the shear strength increases.
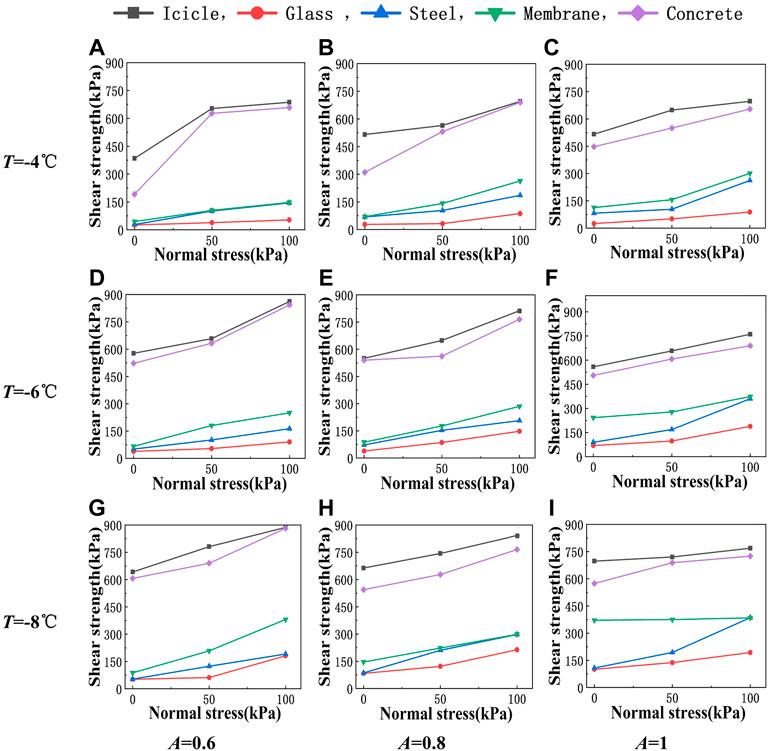
FIGURE 8. Variation of the shear strength with normal stress: row 1 (A–C) T = −4°C, row 2 (D–F) T = −6°C, row 3 (G–I) T = −8°C, column 1 (A,D,G) A = 0.6, column 2 (B,E,H) A = 0.8, and column 3 (C,F,I) A = 1.
Figure 9 shows the variation of the interface shear strength with temperature. It can be seen from Figure 9 that under the same normal stress and contact area ratio, the interface shear strength decreases with the increase of temperature. This is understandable by considering that as the temperature rises, the molecular activity increases, which is equivalent to the “softening” of the ice at the interface, making it easier for the interface to fail. When the temperature rises to 0°C, the ice starts to melt, the melted water forms a water film at the interface, and the shear strength decreases to 0. This variation trend of the interface shear strength with temperature is consistent with that found in Frederking and Timco (1984) and Timco and Weeks (2009) for sea ice and that in Shi et al. (2020) for frozen soil.
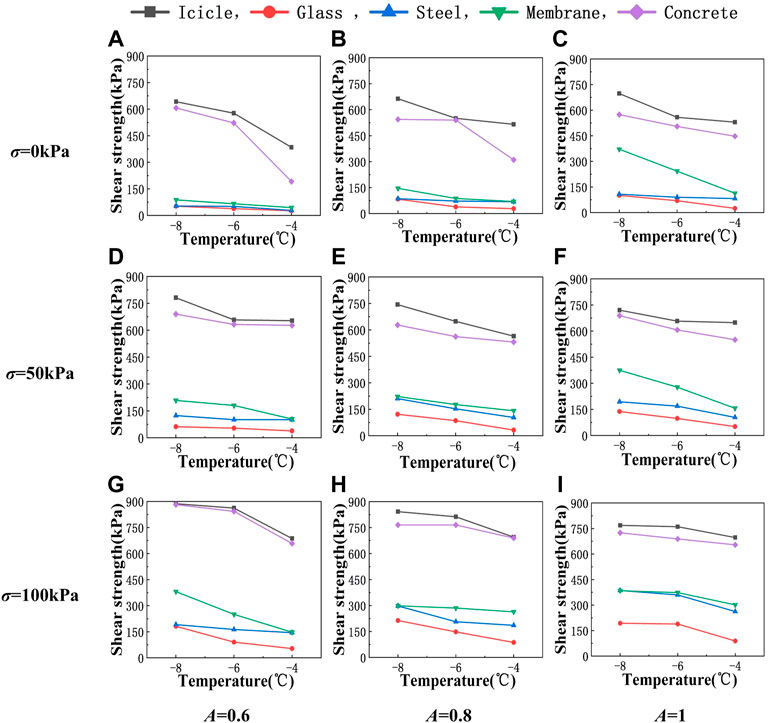
FIGURE 9. Variation of the shear strength with temperature: row 1 (A–C) σ = 0 kPa, row 2 (D–F) σ = 50 kPa, row 3 (G–I) σ = 100 kPa, column 1 (A,D,G) A = 0.6, column 2 (B,E,H) A = 0.8, and column 3 (C,F,I) A = 1.
Figure 10 indicates that, in general, under the same normal stress and temperature, the interface shear strength increases with the increase of the contact area ratio. As has been mentioned earlier, the contact area ratio has been considered in the determination of shear strength, that is, only the effective contact area is considered in determining the shear strength. In this context, one may believe that the shear strength should be consistent for different contact area ratios. However, Figure 10 tells us that this is not the case. This can be explained by treating the holes at the interface as initial cracks. An increase in the contact area ratio means a decrease in the number of holes at the interface, which means a decrease in initial cracks. This will inevitably lead to an increase in failure stress. Therefore, although the effective contact area is considered in the determination of shear strength, the interface shear strength derived in the test still presents an increase with the increase of the contact area ratio.
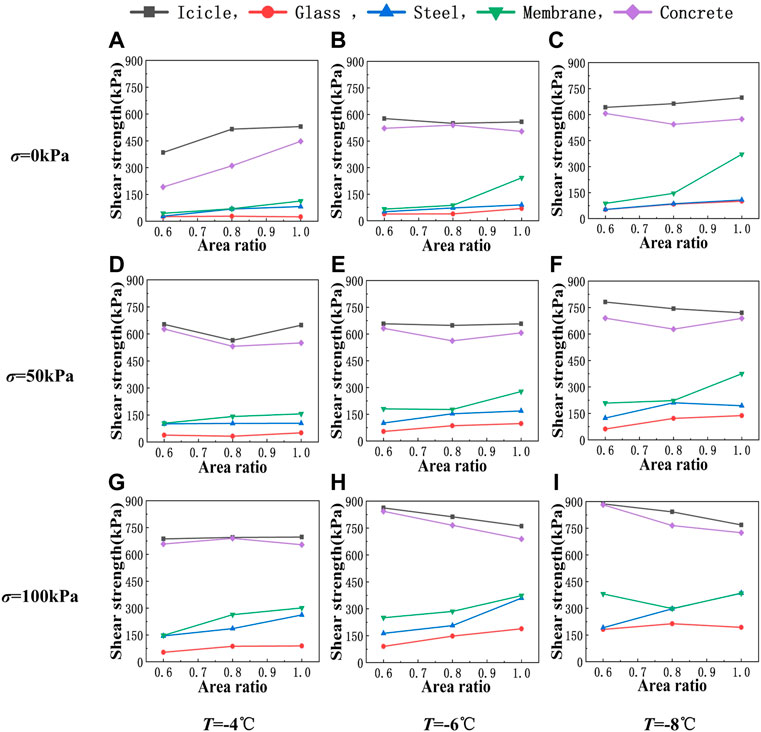
FIGURE 10. Variation of the shear strength with contact area ratio: row 1 (A–C) σ = 0 kPa, row 2 (D–F) σ = 50 kPa, row 3 (G–I) σ = 100 kPa, column 1 (A,D,G) T = −4°C, column 2 (B,E,H) T = −6°C, and column 3 (C,F,I) T = −8°C.
Meanwhile, as has been indicated by Figure 7, Figure 8—Figure 10 again show that the interface shear strength increases with the increase of surface roughness of the roofing materials, although the increase of shear strength is not proportional to the increase of roughness. As can be seen from Table 1, among the four materials considered in this study, glass is the smoothest with its roughness close to 0 μm, steel and the membrane material are similar and have a roughness of between 3 and 4 μm, and the roughness of concrete is 5.5 μm, which is the highest. That is, the roughness of steel and the membrane material is closer to that of concrete than that of glass. However, in terms of shear strength, the shear strength of the ice–concrete interface is obviously higher than that of the other three materials, while the other three materials are quite close in shear strength. This indicates that the shear strength increases rapidly when the roughness reaches a critical value. The value of the critical roughness and the underlying reasons for this phenomenon deserves further studies in the future.
Special attention is paid to the interface shear strengths when normal stress σ is taken as 0 kPa since this situation is closest to the roof snow load in reality among all the three cases of normal stress considered. A simple comparison shows that the shear strength for glass is the lowest among all the materials considered, and the lowest strength is read to be 24.6 kPa, i.e., the shear resistance is 24.6 kN per unit area (1 m2). If we denote the load caused by the roof snow within a unit area as w, then for a roof with a slope of α, the force component parallel to the roof surface, Fp, is estimated to be wsinα, this force should be greater than the shear resistance for the sliding of the roof snow. However, as has been mentioned earlier, roof snow loads are typically less than 2 kPa in China; this implies that Fp is way less than the shear resistance. This emphasizes that the roof snow sliding could hardly occur when the snow on the interface is presented in the form of ice and that the formation of a water film on the interface seems to be the only reason for the occurrence of roof snow sliding. The relatively high shear strength of the ice–roofing material interfaces also explains why snow could be observed on very smooth roofs (such as glass roofs) even when the roof slope is very steep (although snow depth is very low due to the relatively small angle of repose of snow).
In summary, the experiment results indicate that the failure of the ice–roofing material interface is brittle and that the shear strength of the interface increases with the increase of surface roughness, the increase of normal stress, the decrease of ambient temperature, and the increase of contact area ratio. However, due to the limitation of time, cost, and availability of the facilities, very limited cases for each of the variables are considered in the experiment. Consequently, a quantitative relation between the shear strength and the relevant variables could not be guaranteed at present. As a supplement, numerical simulations could be considered to investigate the shear performance of the ice–roofing material interface for more cases, where the numerical model should be validated using the data derived in the tests. The numerical simulation of the shear performance of the interfaces is out of the scope of this study and therefore is not presented in the current study.
Prediction of Shear Strength for the Ice–Roofing Material Interface
As mentioned earlier, parameters that can be considered in the tests are very limited due to time, cost, and other limitations. Therefore, a regression model is desired to predict the shear strength of the ice–material interface under other conditions. In this section, an attempt is made to carry out a multi-dimensional regression model fitting exercise using the experimental results given in the previous section, where the effects of temperature, normal stress, contact area ratio, and roughness should all be considered. Since the values of the parameters considered in the experiment are relatively limited (for example, only −8, −6, and −4°C are considered for the temperature), conventional fitting methods are associated with great uncertainty in the fitting. On the other hand, it is noted that the Back Propagation (BP) neural network method has been successfully applied in many similar studies in the literature (Tang et al., 2012; Chen et al., 2020; Xing et al., 2021, to name a few). It is indicated that the BP neural network is particularly suitable for solving problems with complex internal mechanisms, and is associated with a great nonlinear mapping capability (Zhou and Kang, 2004). Therefore, the BP neural network method is considered in this study for the fitting.
The BP network was proposed by a scientist group headed by Rumelhart and McClelland in 1986. It is a multi-layer feed forward network trained by the error back-propagation algorithm, which is one of the most widely used neural network models (Wen et al., 2000). The BP network can learn and store a large number of input–output mappings without specifying the mathematical equations describing the mappings in advance. The steepest descent method is employed as the learning rule, through back propagation to constantly adjust the weight and threshold of the network, so as to minimize the sum of the squared errors of the network. The topology structure of the BP neural network model includes an input layer, hidden layer, and an output layer (Wen et al., 2000; Gao, 2003; see Figure 11 for a schematic diagram of the model). In essence, the BP neural network obtains a mapping function from the input to the output. The mathematical theory proves that a three-layer neural network is enough to approach any nonlinear continuous function with very high precision.

FIGURE 11. Schematic diagram of the BP neural network model.
In the current study, the number of nodes in the input layer, hidden layer, and output layer is set to be 4, 3, and 1, respectively. In the training of the BP neural network, all the considered values for temperature, normal stress, contact area ratio, and material surface roughness (as shown in Table 2) are put in the input layer, and the corresponding test results are put in the output layer. Units of normal stress and shear strength are converted from kPa to MPa to make their order of magnitude close to other parameters. Meanwhile, according to the findings made in the experiment, the following constraint condition is applied: the shear strength should be 0 when the temperature is 0°C. The convergence of training is achieved after 337 iterations using a critical value for convergence of 1×10⁻⁵.
Leave-one-out cross-validation is carried out to assess the capability of the BP network in predicting the shear strength of the ice–roof material interfaces, i.e., the network is trained iteratively with one of the samples left out as a test, the shear strength of the test sample is predicted using the trained network and further compared with the measured one. The validation result is shown in Figure 12 (the unit of pressure/strength is converted back to kPa in order to be consistent with the previous figures). It is indicated by Figure 12 that the data points follow the diagonal fairly well with a few exceptions. Statistics show that the correlation coefficient between the predicted and tested shear strengths equals 0.96, and the mean and standard deviation of the prediction error equals −2 and 65.5 kPa, respectively; in terms of relative error, the mean and standard deviation is estimated to be 6% and 47%, respectively. This indicates that the prediction made by the BP network is associated with large dispersion under the current condition. However, it must be emphasized that the predictions presented herein are preliminary results since the number of levels for each variable is limited, more reliable predictions could be expected when more samples of the interface shear strength are made available in the future.
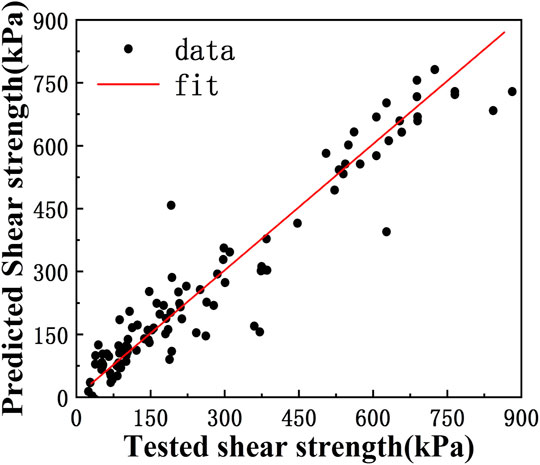
FIGURE 12. Results of the leave-one-out cross validation of the BP neural network.
For the convenience of usage, parameters (weights and thresholds) of the trained neural network are extracted and the following prediction formula is obtained according to the excitation function of the hidden layer and the output layer:
where τ is shear strength (in MPa),
Using the formula, the shear strength of the ice–material interface could be easily predicted by substituting the parameters with the desired values. As an example, Figures 13A–C show variation of the predicted interface shear strength with the contact area ratio when T=−2°C and
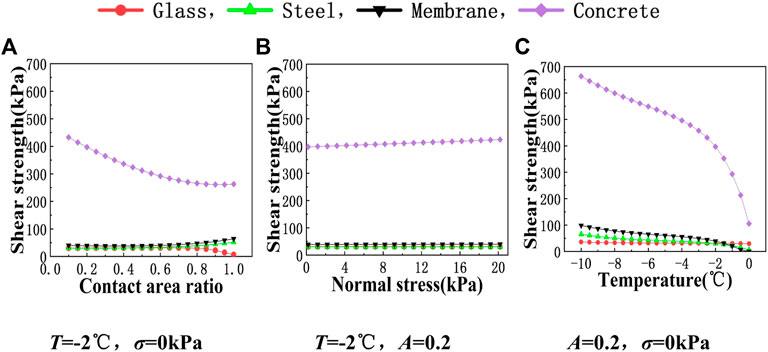
FIGURE 13. Examples of the predicted shear strength: (A) variation of the predicted shear strength with contact area ratio when T = −2°C, σ = 0 kPa, (B) variation of the predicted shear strength with normal stress when T = −2°C, A = 0.2, and (C) variation of the predicted shear strength with temperature when A = 0.2, σ = 0 kPa.
Conclusion
To reveal the initialization mechanism of roof snow sliding from the material point of view, this study investigates the shear strengths of ice-roofing material interfaces through direct shear tests at low temperatures by considering four commonly-used roofing materials (concrete, steel, membrane, and glass) and different porosities of ice. The effects of the different ambient temperatures (−4, −6, and −8°C) and normal stress (0, 50, and 100 kPa) on the interface shear strength are analyzed, and a prediction formula of the interface shear strength is established based on the test results. The main conclusions of the study are as follows:
1) The shear failure of the interface between ice and roofing materials is brittle. Since there is no ductility development in failure, the risk of roof snow sliding is significantly high.
2) The shear strength of the ice–ice interface is much higher than that of the ice–material interface, this implies that once the roof snow sliding occurs, the sliding is very likely to take place in the interface between snow and the roof, all the snow on the roof will slide off as a whole, which will bring an extraordinary impact on the lower roof or the ground.
3) The interface shear strength increases with the increase of the contact area ratio (or decrease of ice porosity), decreases with the increase of temperature, and increases with the increase of normal stress, but the influence of normal stress is minor since roof snow load (acting as normal stress) is typically quite small.
4) The shear strength of the ice–material interface increases with the increase of roughness, especially after the roughness reaches a critical value, but the magnitude of the critical value and the reason for this phenomenon is not clear at present.
5) The friction force could be ignored when compared to the adhesion between the ice/snow and the roof. Also, since the shear strength between ice and the roofing material is typically at least one magnitude higher than the roof snow load, the roof snow sliding seems to occur only when a water film is formed on the interface due to snowmelt or rainfall, etc.
6) The prediction formula for the interface shear strength obtained by the BP neural network model could predict the shear strength of the ice–material interface appropriately, which provides a theoretical basis for further studies on roof snow sliding in the future.
Data Availability Statement
The raw data supporting the conclusion of this article will be made available by the authors, without undue reservation.
Author Contributions
Conceptualization, FF; Methodology, XC and GZ; Validation, GZ; formal analysis, QZ; Writing—original draft preparation, XC; Writing—review and editing, HM; Visualization, XC; Supervision, HM and FF; Project administration, QZ; funding acquisition, HM, QZ, and FF. All authors have read and agreed to the submitted version of the manuscript.
Funding
National Natural Science Foundation of China (Grant Numbers 51921006, 51808169, 51927813, and 51978207); Fundamental Research Funds for the Central Universities (Grant Number HIT. NSRIF. 2020083); Heilongjiang Natural Science Foundation (Grant Number YQ 2021E030).
Conflict of Interest
The authors declare that the research was conducted in the absence of any commercial or financial relationships that could be construed as a potential conflict of interest.
Publisher’s Note
All claims expressed in this article are solely those of the authors and do not necessarily represent those of their affiliated organizations, or those of the publisher, the editors, and the reviewers. Any product that may be evaluated in this article, or claim that may be made by its manufacturer, is not guaranteed or endorsed by the publisher.
Acknowledgments
The authors are grateful to the reviewers for their constructive comments and suggestions on earlier drafts of this paper. Suggestions received from Prof. Feng Zhang and Dr. Sheng Shi of School of Transportation Science and Engineering, Harbin Institute of Technology during the tests are also gratefully acknowledged.
References
AIJ (2004). Recommendations on Loads for Buildings. Tokyo, Japan: Architectural Institute of Japan. (English version: 1996).
Aoyama, Takeshi., Ishikawa, Masaaki., Hira, Tetsuo., and Ukigai, Kiyotake. (2006). Effect of Surface Roughness on Adhesive Shear Strength between Pure Ice and a Solid Surface. Trans. Jpn. Soc. Refrig. Air Cond. Eng. 23 (3), 273–281. (In Japanese, English summary). doi:10.11322/tjsrae.23.273
Bharathidasan, T., Kumar, S. V., Bobji, M. S., Chakradhar, R. P. S., and Basu, B. J. (2014). Effect of Wettability and Surface Roughness on Ice-Adhesion Strength of Hydrophilic, Hydrophobic and Superhydrophobic Surfaces. Appl. Surf. Sci. 314, 241–250. doi:10.1016/j.apsusc.2014.06.101
BSI (2003). Eurocode 1: Actions on Structures: Part 1-3: General Actions: Snow Loads (EN 1991-1-3). London, UK: British Standards Institute.
Chen, L., Zhang, W., Gao, X., Wang, L., Li, Z., Böhlke, T., et al. (2020). Design Charts for Reliability Assessment of Rock Bedding Slopes Stability against Bi-planar Sliding: SRLEM and BPNN Approaches. Georisk Assess. Manag. Risk Eng. Syst. Geohazards 16, 360–375. doi:10.1080/17499518.2020.1815215
Colbeck, S. C. (1983). Ice Crystal Morphology and Growth Rates at Low Supersaturations and High Temperatures. J. Appl. Phys. 54 (5), 2677–2682. doi:10.1063/1.332290
Dennis, Lamb., and Scott, William. D. (1973). The Mechanism of Ice Crystal Growth and Habit Formation. J. Atmos. Sci. 31, 570–580. doi:10.1175/1520-0469(1974)031<0570:TMOICG>2.0.CO;2
Frederking, R. M. W., and Timco, G. W. (1984). Measurement of Shear Strength of Granular/discontinuous-Columnar Sea Ice. Cold Regions Sci. Technol. 9 (3), 215–220. doi:10.1016/0165-232x(84)90068-5
Gao, J. (2003). Artificial Neural Network Theory and Emulation Instances. Beijing: China Machine Press. (in Chinese).
Isyumov, N., and Mikitiuk, M. (2008). Sliding Snow and Ice from Sloped Building Surfaces: its Prediction, Potential Hazards and Mitigation. In: The 6th Snow Engineering Conference, Whistler, BC, June 1–5, 2008.
Jelle, B. P. (2013). The Challenge of Removing Snow Downfall on Photovoltaic Solar Cell Roofs in Order to Maximize Solar Energy Efficiency-Research Opportunities for the Future. Energy Build. 67, 334–351. doi:10.1016/j.enbuild.2013.08.010
MacKinlay, I., Flood, R., and Heidrich, A. (2000). Roof Design in Regions of Snow and Cold. Balkema. Netherlands,213–224.Fourth International Conference on Snow Engineering. 19-21 June 2000. Rotterdam
MOHURD (2012). “Load Code for the Design of Building Structures (GB 50009-2012),” in Ministry of Housing and Urban-Rural Development of the People’s Republic of China (Beijing, China: China Architecture &Building Press). (in Chinese).
MWR-PRC (2019). “Standard for Geotechnical Testing Method (GB/T 50123-2019),” in Ministry of Water Resources of the People's Republic of China (Beijing, China: China Planning Press). (in Chinese).
Sack, R. L., Arnholtz, D. A., and Haldeman, J. S. (1986). Sloped Roof Snow Loads Using Simulation. J. Struct. Eng. ASCE 113 (8), 1820–1833. doi:10.1061/(ASCE)0733-9445(1987)113:8(1820)
Shi, S., Zhang, F., Feng, D., and Xu, X. (2020). Experimental Investigation on Shear Characteristics of Ice-Frozen Clay Interface. Cold Regions Sci. Technol. 176, 103090. doi:10.1016/j.coldregions.2020.103090
SINTEF (2008). SINTEF Method 169—Measurement of Friction between Snow and Roofing. Method A—Fricton Coefficient Determination between Snow and Roofing by Horizontal Plane Applied Pulling Force Method. Method B—Fricton Coefficient Determination between Snow and Roofing by Inclined Plane Slip Method. CRIStin 319695. Trondheim, Norway: SINTEF Building and Infrastructure.
Takakura, M., Chiba, T., Ito, T., and Tomabechi, T. (2000). On the Term Controlled by Snow Load : Practical Use of Snow Sliding on Pitched Roof. Nihon Kenchiku Gakkai Kozokei Ronbunshu 65, 53–57. doi:10.3130/aijs.65.53_2
Tang, Luosheng., Yin, Kunlong., and Liu, Yiliang. (2012). Parameter Value Selection on Anti-shearing Strength Parameters of Landslides Based on Factor Analysis and BP Neural Network. J. Catastrophology 27 (4), 17–20. (in Chinese). doi:10.3969/j.issn.1000-811X.2012.04.004
Timco, G. W., and Weeks, W. F. (2009). A Review of the Engineering Properties of Sea Ice. Cold Regions Sci. Technol. 60 (2), 107–129. doi:10.1016/j.coldregions.2009.10.003
Timco, G. W., and Frederking, R. M. W. (1982). Comparative Strengths of Fresh Water Ice. Cold Regions Sci. Technol. 6, 21–27. doi:10.1016/0165-232x(82)90041-6
Wen, J., Zhao, J., Luo, S., and Han, Z. (2000). The Improvement of BP Neural Network Learning Algorithm. 5th International Conference on Signal Processing Proceedings. 21-25 Aug. 2000, Beijing, China.
Williams, C. J., Carter, M., Hochstenbach, F., and Lovlin, T. (2004). Sliding Snow and Ice on Buildings: A Balance of Risk, Cost and Aesthetics. Proceedings of the Fifth International Conference on Snow Engineering, 5-8 July 2004, Davos, Switzerland, 59–64.
Xing, H., Zhang, H., Liu, L., and Yao, D. (2021). Comprehensive Monitoring of Talus Slope Deformation and Displacement Back Analysis of Mechanical Parameters Based on Back-Propagation Neural Network. Landslides 18, 1889–1907. doi:10.1007/s10346-020-01613-1
Zhou, K. L., and Kang, Y. H. (2004). Neural Network Models and MATLAB Simulation Program Design. Beijing: Tsinghua University Press. (in Chinese).
Zhou, X., Zhang, Y., Gu, M., and Li, J. (2013). Simulation Method of Sliding Snow Load on Roofs and its Application in Some Representative Regions of China. Nat. Hazards 67 (2), 295–320. doi:10.1007/s11069-013-0563-8
Keywords: roof snow sliding, interface shear strength, direct shear tests, roofing materials, quantitative relationship
Citation: Cao X, Mo H, Zhang G, Zhang Q and Fan F (2022) Experimental Study on Shear Strengths of Ice-Roof Interface Aiming the Study of Roof Snow Sliding. Front. Earth Sci. 10:862134. doi: 10.3389/feart.2022.862134
Received: 25 January 2022; Accepted: 30 May 2022;
Published: 11 July 2022.
Edited by:
Chong Xu, Ministry of Emergency Management, ChinaReviewed by:
Zikang Xiao, Ministry of Emergency Management of China, ChinaMartin Truffer, University of Alaska Fairbanks, United States
Copyright © 2022 Cao, Mo, Zhang, Zhang and Fan. This is an open-access article distributed under the terms of the Creative Commons Attribution License (CC BY). The use, distribution or reproduction in other forums is permitted, provided the original author(s) and the copyright owner(s) are credited and that the original publication in this journal is cited, in accordance with accepted academic practice. No use, distribution or reproduction is permitted which does not comply with these terms.
*Correspondence: Huamei Mo, bW9odWFtZWlAaGl0LmVkdS5jbg==; Guolong Zhang, emhhbmdnbDMxNUBoaXQuZWR1LmNu