- 1Key Laboratory of Mining Engineering of Jiangxi Province, Jiangxi University of Science and Technology, Ganzhou, China
- 2School of Resource and Environmental Engineering, Jiangxi University of Science and Technology, Ganzhou, China
- 3State Key Laboratory of Geomechanics and Geotechnical Engineering, Institute of Rock and Soil Mechanics, Chinese Academy of Sciences, Wuhan, China
- 4Faculty of Materials Metallurgy and Chemistry, Jiangxi University of Science and Technology, Ganzhou, China
- 5School of Civil and Surveying & Mapping Engineering, Jiangxi University of Science and Technology, Ganzhou, China
To explore the effect of leaching erosion on the deterioration mechanism of ionic rare earth slope bedrock. The E-TOPSIS method and fuzzy grey correlation method were used to fuse and analyze the multi-source heterogeneous information such as porosity, pH, mass, volume, density, P-wave and characteristic strength of bedrock specimens. The dominant response parameters of bedrock deterioration of slopes under leaching erosion were obtained, and the multi-source information fusion correlation analysis model was established. The results show that compared with the basic physical parameters of bedrock, the influence of leaching erosion on the pore structure of bedrock is more significant; the pore space and leaching solution pH show obvious dominant responsiveness in the E-TOPSIS analysis with soaking duration. Basically, from the results of fuzzy grey correlation analysis, the micropore of bedrock specimens continued to increase after the decrease in the early stage of soaking, and the porosity varied significantly; the micropore and porosity of bedrock specimens had the highest correlation with the characteristic strength of bedrock, followed by the pH of leaching solution.
1 Introduction
Ion-adsorption rare earth ores are the weathering products of granites and other igneous rocks containing rare earth hydroxyl water ions. These rare earth ions are adsorbed into the surface of clay minerals such as kaolinite and illite during the permeation of aqueous solutions, forming ion-adsorbed rare earth deposits (Huang et al., 2015; Guo et al., 2020). The Gannan region of China is rich in medium and heavy rare earth elements, which are in short supply in the world. Rare earth materials are a strategic resource of global concern and are known as the mother of new materials and industrial gold (Chen, 2011; Dutta et al., 2016; Zhong et al., 2021). At present, rare earth mining mainly adopts in-situ leaching mining method (Liang et al., 2018), in which the leaching solution is used to replace the rare earth elements enriched in rare earth slopes. The leaching solution is a complex solution containing multiple ions, where the main chemical components of the leaching solution are sulfuric acid, ammonium sulfate and ionic rare earth elements (Silva et al., 2019). Influenced by the mining method of ionic rare earth mines, their slope bedrock has been subjected to long-term erosion by the leaching solution, resulting in different degrees of deterioration of bedrock mechanical properties, which in turn affects the stability of ion-adsorbed rare earth mine slopes (Fan et al., 2017; Zhao et al., 2018; Luo F. Y. et al., 2021). Therefore, the study of the deterioration mechanism about the mechanical properties of ionic rare earth slope bedrock under the erosion of leaching solution provides theoretical basis for the work in disaster warning of ionic rare earth mine slopes.
In recent decades, researchers have conducted numerous studies on the deterioration mechanisms of rocks under the corrosive action of acid solutions, and fruitful results have been obtained. Acid solution erosion affects the macroscopic physical and mechanical properties of rocks to different degrees (Miao et al., 2016; Ni et al., 2017; Luo T et al., 2021). This is due to the water-chemical interactions between the acidic solution and its crystalline mineral particles inside the rock specimen, including ion exchange, dissolution, hydrolysis, and erosion, which change the mineral particle connectivity as well as the mineral composition and structure of the rock (Huang et al., 2021). When erosion of acidic solutions occurs, the roughness of the rock surface increases, while the mass and longitudinal velocity gradually decrease with increasing erosion time (Geng et al., 2019) and the porosity tends to increase (Miao et al., 2018).
The mechanical properties of rock are affected by liquid immersion (Zhang et al., 2020), especially under the condition of acid solution immersion, and their mechanical properties vary with soaking duration. The construction of mathematical models for characterize the degree of rock deterioration under different soaking duration conditions is a scientific problem that needs to be solved urgently, and scholars have studied the characterization of the degree of deterioration through the perspective of mathematical analysis. In this paper, E-TOPSIS method and fuzzy grey correlation analysis are chosen to characterize the degree of bedrock deterioration of ionic rare earth mine slopes under the effect of leaching erosion. The TOPSIS method was founded by Hwang and Yoon in 1981, which ranks evaluation targets by calculating the distance of evaluation targets from the optimal solution and the worst solution, and selects the evaluation targets that are closest to the optimal solution and farthest from the worst solution (Behzadian et al., 2012); one particularly important step is the determination of evaluation parameter weights, and this paper chooses The entropy method (EM), which does not need to consider subjective preferences and only needs objective data to calculate weights, is chosen as the method for weight determination in this paper (Chen, 2019). In previous studies, this approach is called entropy-based TOPSIS (abbreviated as E-TOPSIS). Grey system theory, founded by Deng Julong in 1982, focuses on the study of problems involving small samples and low information content, and deals with uncertain systems with partially known information by generating, mining and extracting useful information from the available information so that the operational behavior of the system and its evolutionary laws can be correctly described and effectively monitored (Deng, 1983). The TOPSIS preference method can reflect the overall similarity between the alternative target and the ideal target by means of function curves, but cannot well reflect the difference between the change trend of factors within the target and the ideal target; the grey correlation method can well illustrate the difference between the change trend of factors within the alternative target and the ideal target, and is applicable to the poor information evaluation where some information is known and some information is unknown environment, but has shortcomings in the overall judgment of system goals (Si et al., 2018).
The existing analyses mainly focus on the analyses of a single local characteristic parameter of the slope bedrock, and few studies have been reported on the overall information of multiple sources of slope bedrock deterioration under leaching erosion. In order to study the effects of leaching erosion on the physical and mechanical properties of slope bedrock, this paper integrates E-TOPSIS and fuzzy grey correlation analysis to analyze the porosity, pH, mass, volume, density, wave velocity, and characteristic strength of slope bedrock under leaching erosion and other multi-source heterogeneous information, and tries to establish a model of slope bedrock deterioration under leaching erosion and extract the physical parameters that can characterize the degree of bedrock deterioration under different soaking durations.
2 Materials and Methods
2.1 Materials
The specimens in this paper were taken from the bedrock of the slope of an ionic rare earth mine in Gannan, China, and the sampling depth was about 5–10 m below the bedrock. The leaching solution used in this experiment were taken from a rare earth mine in Ganan, which has a pH value of 3.392 and its main chemical components are NH4+, SO42− and ionic rare earth elements. The leaching solution is an acidic solution, which has an erosive effect on the bedrock of the slope. The corresponding ionic rare earth leaching equation is: Clay-RE3++3NH4+→Clay-3NH4++RE3+(RE3+ is rare earth ion). According to the International Society for Rock Mechanics (ISRM) test protocol, a standard cylindrical specimen with a height of 100 mm and a height-to-diameter ratio of 2:1 was made (Figure 1). Quartz, feldspar, black mica, hornblende, and other minerals determined by X-ray diffraction using an Empyrean type apparatus are the principal rock-forming mineral compositions of the granite specimens. To ensure the homogeneity of the specimens, all bedrock specimens were taken from the same rock block, and the bedrock specimen with less variability of P-wave was selected as the material for this test (Zhong et al., 2021). In order to avoid the end effect of the bedrock specimen during the test, the end parallelism of the bedrock specimen is controlled within ±0.02 mm, the end face and the bedrock specimen axis are guaranteed to be mutually perpendicular, and the maximum deviation of the end face and axial perpendicular angle is controlled within ±0.25.
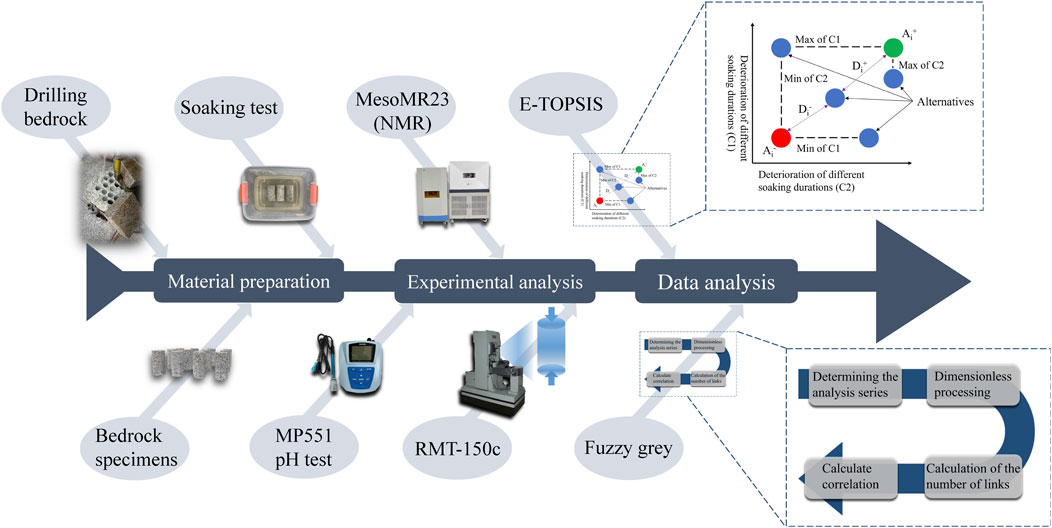
FIGURE 1. Scheme of the experimental procedure; TOPSIS modified from (Abdel-Basset et al., 2019).
2.2 Methods
2.2.1 Experimental Methods
In this paper, the erosion of bedrock by leaching solution during in-situ leaching is investigated by means of laboratory simulation tests. In order to eliminate the influence of chance errors on the test results during the test, the selected bedrock specimens were divided into six groups of six bedrock specimens each and numbered, in order, as the first group (GS1-1 to GS1-6), the second group (GS2-1 to GS2-6), …, and the sixth group (GS6-1 to GS6-6). Each group of bedrock specimens was placed in an infiltration cell made of inert corrosion-resistant material, and the leaching solution was poured into the cell and all bedrock specimens were buried. The first group of bedrock specimens was used as the control group without immersion treatment, and the remaining five groups of bedrock specimens were subjected to immersion treatment for 30, 60, 90, 120 and 150 days, respectively. After immersion, the bedrock specimens were dried, and characteristics such as mass and P-wave of the dry bedrock specimens were measured (Table 1).
In order to investigate the effect of soaking duration on the microstructure of granite and the pH of the leaching solution, the pore distribution condition of the bedrock specimens with different soaking durations was measured using a MesoMR23-060H-I model NMR analyzer, and the pH of the leaching solution under different duration conditions was measured using an MP551 pH/ion concentration measuring instrument.
The uniaxial compression test of bedrock specimens under different immersion time conditions was performed using a digitally controlled electro-hydraulic servo tester - RMC-150C, developed and produced by the Chinese Academy of Sciences.
2.2.2 E-TOPSIS Methods
The E-TOPSIS method is an improvement of the traditional TOPSIS method, in which the weights of the parameters are first determined by the entropy weight method, and then the ranking of the evaluation objects is determined by the TOPSIS method using the technique of approximating the ideal solution. The main calculation steps of the E-TOPSIS method are as follows (Behzadian et al., 2012; Chen, 2021):
① Assuming that there are m evaluation targets (different soaking durations, the same below) and n evaluation indicators (parameters, the same below) for each evaluation target, construct a judgment matrix.
② Normalization of the judgment matrix:
where
③ Calculate the information entropy:
where
④ Define the weights of the indicators.
where
⑤ Calculate the weighting matrix:
⑥ Determine the optimal and inferior solutions:
⑦ Calculate the Euclidean distance of each solution from the optimal and inferior solutions:
⑧ Calculate the composite evaluation index:
where the larger the value, the lower the degree of deterioration.
2.2.3 Fuzzy Grey Correlation Methods
Fuzzy grey correlation is the degree of similarity or dissimilarity of dynamic trends between objects and factors, and it is a method to study and analyze the correlation between things based on the degree of similarity of time series curves between factors. The main calculation steps of the fuzzy grey correlation analysis method are as follows (Liu et al., 2016).
① Determining the analysis series:
Let
② Dimensionless processing:
where t corresponds to the time period and i corresponds to a row (i.e., a feature) in the comparison series.
③ Calculation of the number of links:
where
④ Calculate the correlation
where
3 Experimental Results
3.1 Uniaxial Compression Experimental Results
According to the test results, the combination of axial strain method and axial stiffness method (Zhao et al., 2021b; Zhao et al., 2021c) was used to classify the compression-density stage, linear elastic deformation stage, plastic deformation stage and post-peak deformation damage stage of each bedrock specimen. And because of the limited pages, only the characteristic stresses and damage modes of GS1-1, GS2-1, GS3-1, GS4-1, GS5-1 and GS6-1 specimens are shown in this paper (Figure 2).
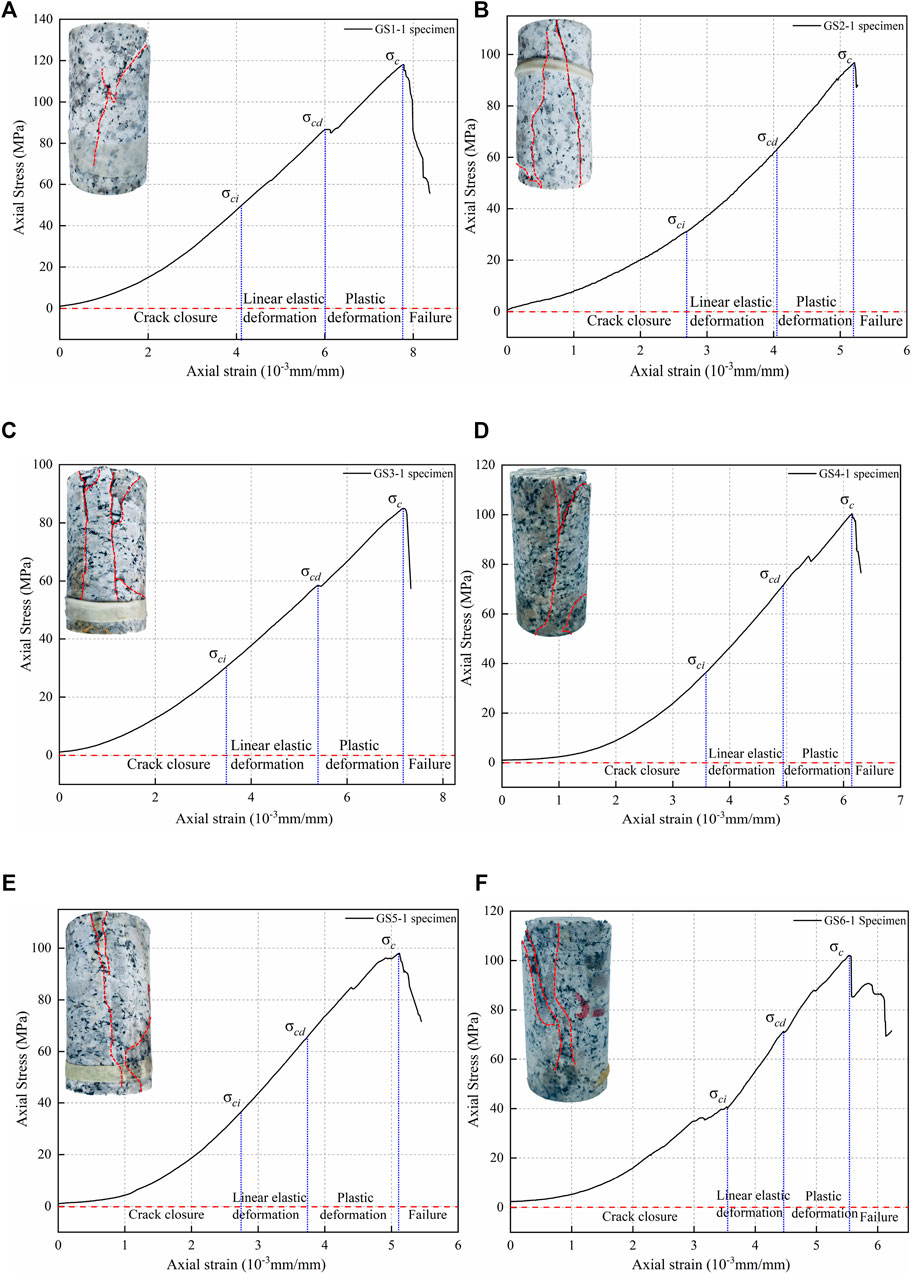
FIGURE 2. Typical uniaxial compressive stress-strain curves for bedrock specimens under leaching erosion. (A) GS1-1; (B) GS2-1; (C) GS3-1; (D) GS4-1; (E) GS5-1; (F) GS6-1.
From Figure 2, it can be seen that there are more significant differences in stress-strain curves and characteristic stress stages of ionic rare earth slope bedrock specimens under different soaking durations conditions.
In the compression stage, the pores inside the bedrock specimen gradually become smaller under the action of axial pressure, and the stress-strain curve of the bedrock specimen is concave, and the length of the concave section and the degree of concavity both reflect the pore development of the bedrock specimen. From Figure 2, it can be found that the concave section of the stress-strain curve of the bedrock specimen gradually grows and the degree of concavity gradually deepens after soaking, which is a significant change compared with that of the unleached specimen. This is due to the fact that the dissolution of mineral particles inside the bedrock gradually deepens with the increase of soaking duration, and the pore development becomes more and more significant.
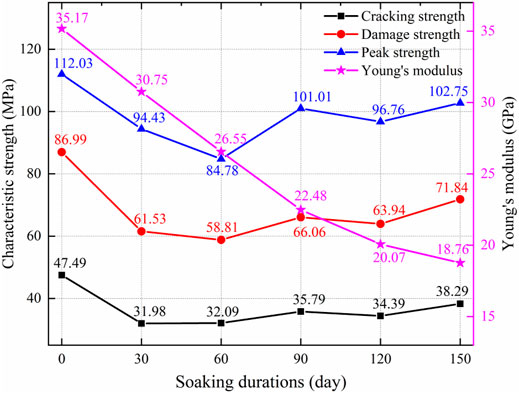
In the linear elastic deformation stage, the stress-strain curve is linear, and the pores inside the bedrock specimen gradually compact with the increase of axial pressure and then enter the deformation stage. Young’s modulus E is an important index to describe the resistance to deformation of solid materials, and the more severely the rock is eroded, the smaller the E value (Zhao et al., 2020). The specimens of unleached bedrock showed the typical damage characteristics of granite, and the elastic phase was more obvious, with the increase of soaking duration, Young’s modulus and elastic phase strain both showed different degrees of decrease. From Figure 2, it can be seen that the elastic stage strain decreased by 8–9% at 30 days of soaking, and the elastic stage strain was stable after 30 days, as can be seen from Figure 3, the Young’s modulus of the bedrock specimens gradually decreases, and the depreciation rate reaches 46.66% in the late stage of soaking compared with that in the unleached ore. The above analysis shows that the effect of the leaching solution is relatively more significant mainly in the first 30 days of soaking, and remains relatively stable thereafter. Decrease in Young’s modulus and elastic stage strain indicates that the mechanical properties of bedrock are more significantly affected by the erosion of leaching.
In the plastic deformation stage, with the continuous increase of axial pressure, the internal microfractures of the bedrock specimen are generated, connected and penetrated, and the bedrock specimen appears plastic deformation until destruction. From Figure 2, it can be seen that the percentage of plastic stage and the relative deformation gradually increase with the increase of soaking duration, which indicates that the bedrock specimens are gradually affected by erosion.
In the post-peak damage stage, unlike the brittle performance of the bedrock specimen when it was not leached, with the increase of soaking time, the bedrock specimen showed different degrees of flow damage, ductility increased, and the peak softening stage appeared. From Figure 2, it can be seen that the damage form of bedrock specimens changed from penetration damage in the natural state to penetration damage and flake flaking damage at 150 days of soaking, and the softening effect of leaching erosion was significant, and a certain strength could be maintained after the damage. The bedrock specimens showed brittle damage before 90 days of soaking, and with the increase of soaking duration, the number of internal microcracks also increased, and the pores inside the specimens were connected and penetrated to form a certain degree of lamellar defect structure, which led to the peak softening stage and lamellar spalling damage of the bedrock specimens, and at this time the specimens had a tendency to change from brittle to ductile in the form of breakage.
The above analysis shows that with the increase of soaking duration, the bedrock specimen is gradually deepened by erosion, the pore development is more and more significant, the compressive stage of rock stress-strain curve is gradually obvious, the elastic stage is gradually shortened, the plastic stage is gradually reduced and the peak softening stage appears, and the bedrock damage form shows the trend of brittle to ductile development with the increase of soaking duration.
In order to investigate the effect of erosion on the characteristic strength of bedrock specimens, statistical analysis of the test results was conducted (Figure 3). The trend of the three characteristic strengths under the leaching erosion was basically the same, and the characteristic strengths decreased significantly in the period of 0–30 days; the peak strength of the three characteristic strengths maintained a faster rate of decrease in the period of 30–60 days, and the cracking strength and damage strength decreased slowly. The three characteristic strengths were the lowest in the period of 60 days of soaking, indicating that the deterioration of the bedrock specimens was the highest in the period of 60 days of soaking. In the remaining soaking duration except for a small decrease in the three characteristic intensities at 90–120 days, the overall trend is increasing, indicating that the deterioration of the bedrock specimens is gradually reduced.
3.2 Pore Evolutionary Characteristics
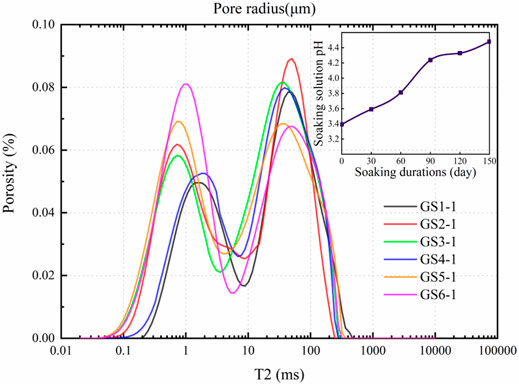
In order to investigate the effect of soaking duration on the microstructure of granite and the pH of the leaching solution, the pore distribution of the bedrock specimens with different soaking durations was measured by NMR analyzer, and the pH of the leaching solution under different duration conditions was measured by pH/ion concentration measurement instrument. Because of the limited pages, only the NMR test results of GS1-1, GS2-1, GS3-1, GS4-1, GS5-1 and GS6-1 specimens under different soaking duration conditions and the pH measurement of the leaching solution are shown in this paper (Figure 4).
Figure 4 shows the trends of porosity and pH of leaching solution with soaking duration. It can be seen from the figure that the porosity of the specimens increased with the soaking duration and then fluctuated within a certain range, in which the macropore of the specimens increased first with the increase of the soaking duration and continued to increase after a certain retreat at 90 days; the micropore of the specimens was the highest at 60 days and then tended to decrease. The variation of pores inside the specimens caused the variation of characteristic strength, and the transformation of macropore and micropore inside the bedrock specimens was visible at 90 days, and the characteristic strength of bedrock specimens decreased faster at this time, when combined with the trend of characteristic strength variation of bedrock specimens. This phenomenon was also mirrored in the pH of the leaching solution, which steadily increased with the length of leaching duration, with the maximum rate of variation between 60 and 90 days.
3.3 Multi-Source Information Fusion Analysis Parameter Selection
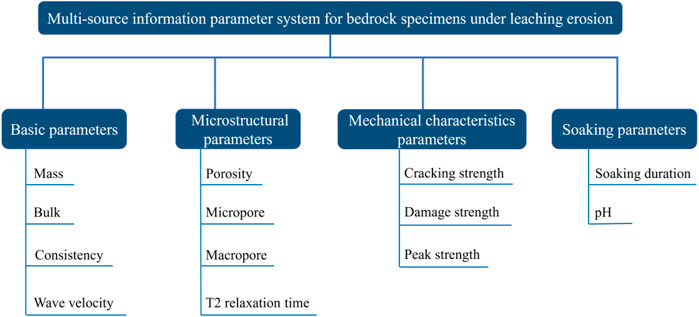
Combined with the mechanical mechanism of bedrock specimen deterioration under chemical solution erosion (Zhao et al., 2021a), the effect of leaching erosion on the internal microstructure of granite specimens, including mineral deconstruction, microfractures, intergranular voids, lattice defects and microdefects, was considered comprehensively. Following the principles of independence, comprehensiveness and quantifiability in the selection of parameters, four parameters of physical properties, fine structure, mechanical characteristics parameters and soaking conditions of the bedrock specimens were selected in this paper to establish a more comprehensive analysis system of granite deterioration under leaching erosion. The specific parameters are shown in Figure 5.
3.3.1 Basic Physical Parameters
Four parameters, such as mass, volume, density and wave velocity, were analyzed. For granite in natural state, the basic physical parameters are not the same, which leads to the difference of deterioration degree of different bedrock specimens in the same area. The basic physical parameters are important indicators for the evaluation and analysis of bedrock specimen outside the laboratory. In the field, limited by equipment and time constraints, it is not possible to conduct exhaustive laboratory tests including composition analysis and other tests, so the analysis of the basic physical parameters such as mass, volume, density and P-wave is necessary.
3.3.2 Microstructural Parameters
Four parameters of porosity, macropore, micropore, and NMR T2 relaxation time (T2) were analyzed. In the preliminary laboratory test analysis of bedrock mechanics, in addition to the analysis of the basic physical parameters of bedrock specimen, we often start from the microstructure parameters of bedrock specimens (Li et al., 2019), following the principle of quantifiability, this paper selects the pore parameters of bedrock specimens as the parameters of microstructure analysis.
3.3.3 Mechanical Characteristics Parameters
The Cracking strength, Damage strength and Peak strength are also called the characteristic strength of the bedrock specimen deterioration process. The characteristic strength of the rock is based on the development of the crack activity state stage before the peak of the rock damage process, the stress corresponding to the end point of the linear elastic stage is the starting crack strength, the stress corresponding to the end point of the stable development stage of the crack is the damage strength, and the stress corresponding to the end point of the unstable development section of the crack is the peak strength. These parameters are the visual representation of the development of the deterioration mechanism of the bedrock specimen. Adding these strengths to the parameter system as a comparison sequence can make the analytical model results more accurate.
3.3.4 Soaking Parameters
The parameters were analyzed in terms of both leaching duration and pH of the leaching solution. Ionic rare earth mining is often carried out by pool leaching and heap leaching, and with the replacement of rare earth ions during the leaching period, a large amount of leach solution will be stored in the collection lane for a long time, and the bedrock of ionic rare earth slopes will be at risk of deterioration under the action of leaching solution (Fang et al., 2018). In this paper, the leaching duration is used as the time parameter for model analysis, and an attempt is made to analyze the difference in the degree of deterioration of bedrock specimens under different leaching durations and to find out the characteristic parameters of dominant response accompanying the deterioration. It has been shown that the granite will show obvious deterioration under acidic solution soaking, and the pH variation of the solution after soaking is an important indicator for the analysis of the degree of granite deterioration under acidic conditions (Han et al., 2016; Huang et al., 2020).
3.4 Deterioration Analysis of Bedrock Mechanical Properties Based on E-TOPSIS Method
In order to obtain the dominant response of parameters for bedrock specimen deterioration under different soaking durations, the judgment matrix under different soaking durations was established by the parameter system in Figure 5, and the entropy values and weights of different soaking durations were calculated according to Eqs 1–4, respectively (Table 2); the Euclidean distances of the parameter values from the optimal solution (
As can be seen from Table 2, the larger difference between the positive ideal solution
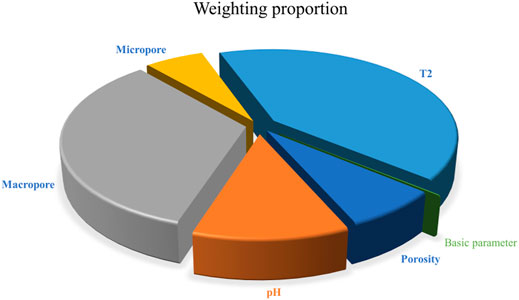
The weighting results are shown in Figure 6. From the size of the weights, it can be seen that the NMR T2 relaxation time occupies the largest weight, while the macropore and the pH of the leaching solution are second, and the porosity and micropore are smaller, indicating that along with the variation of the soaking duration, the parameter with the most dominant response to it is the NMR t2 relaxation time, and from the microscopic level. At the microscopic level, the response of macropore to soaking is more prominent compared to porosity and macropore.
Table 3 shows the comprehensive scores ρ of the response parameters of bedrock specimens under different soaking durations according to TOPSIS method based on the entropy results, where the smaller the Euclidean distance ρ between the comprehensive scores of the parameter system and the positive ideal solution, and the larger the Euclidean distance ρ from the negative ideal solution, the better. The results were c1>c6>c4>c5>c2>c3, indicating the response of the parameter system to the degree of deterioration at different soaking durations, where the degree of deterioration was lowest at 0 days of soaking, followed by 150 days of soaking, and the highest degree of deterioration was observed at 60 days of soaking. By comparing with the peak strength of bedrock specimens at different soaking durations, it was found that the model results were consistent with the degradation degree of bedrock specimens. It indicates that the E-TOPSIS method has some analytical ability to explain the deterioration degree of bedrock specimens under different soaking durations. In order to reveal the response of each parameter in this parameter system to the characteristic intensity of bedrock specimens, further fuzzy grey correlation analysis is required.
3.5 Study on Mechanical Property Deterioration of Bedrock Based on Fuzzy Grey Correlation Analysis Algorithm
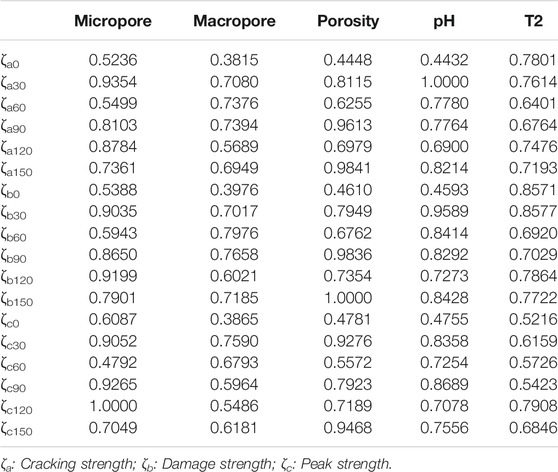
Combined with the E-TOPSIS method analysis, the differences in the basic physical parameters of the bedrock specimens under the leaching erosion conditions have a small effect on the parameter system as a whole, so the soaking parameters and microstructural parameters are analyzed as the focus in the fuzzy grey correlation analysis. The fuzzy grey correlation coefficients of the parameter system on the characteristic strength of the bedrock specimens were calculated according to Eqs 9, 10, respectively, Table 4, and then their correlations were calculated according to Eq. 11, Table 5.
Table 4 and Table 5 show the correlation coefficients and correlations of each parameter with the average cracking strength, average damage strength and average peak strength of the bedrock specimens under different soaking time conditions, respectively. The correlation between micropore, porosity and pH of the leaching solution is larger, followed by macropore and NMR T2 relaxation time.
4 Discussion
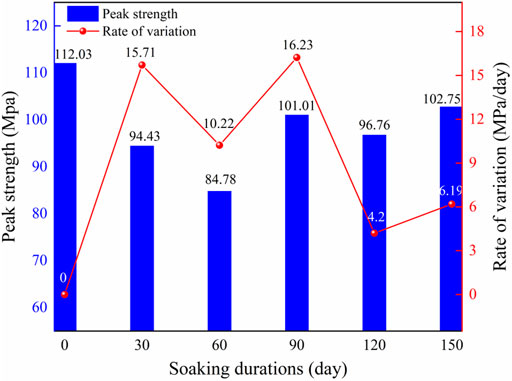
Uniaxial compressive strength is an important parameter for evaluating the stability of bedrock of ionic rare earth ore slopes, and some rock-forming mineral components under the erosion of leaching solution undergo different degrees of chemical decomposition and precipitation-adsorption reactions, causing different degrees of variations in their uniaxial compressive strength (Zhang and Zhao, 2013; Wang et al., 2020). In order to study the effect of leaching solution on the uniaxial compressive strength of bedrock specimens of ionic rare earth ore slopes, the average uniaxial compressive strength of bedrock specimens and its variation rate under different soaking duration conditions were statistically analyzed (Figure 7).
As can be seen from Figure 7, the mechanical properties of the bedrock of the slope are different with different soaking duration conditions. The peak strength of the bedrock specimens decreased from 112.03 MPa in the natural state to 102.75 MPa at 150 days of soaking, with a decrease of about 8.28%, which is obvious. The mechanical properties of the bedrock fluctuate greatly due to the influence of leaching erosion, and the peak strength of the bedrock specimens decreases the most at the early stage of soaking, and then rebound at 90 days, after which it fluctuates in a small range. The analysis is due to the fact that at the early stage of soaking, the micropore of the bedrock specimen gradually increased by the erosion of the leaching solution, and the internal structure of the bedrock specimen was damaged, resulting in the decrease of mechanical strength.
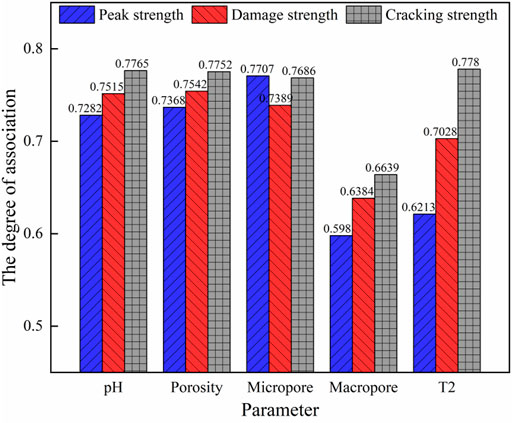
The fusion analysis of the mechanical parameters of the slope bedrock with its physical parameters under different soaking duration conditions shows that the micropore, macropore and porosity of the bedrock specimens, the NMR T2 relaxation time and the pH of the leaching solution are correlated with the characteristic stress parameters of the bedrock specimens to some extent. In order to explore the dominant response factors of mechanical parameters of bedrock specimens under different soaking duration conditions. In this paper, the correlations of characteristic stress parameters of bedrock specimens under the conditions of different response factors were compared and analyzed (Figure 8).
As can be seen from Figure 8, in the fuzzy grey correlation analysis, the correlation between all parameters and the characteristic strength is high, and the parameter with the most significant difference from other parameters is the micropore, which has a higher correlation with the peak strength than the damage strength and cracking strength. Combined with the analysis in Figure 4, it can be seen that the micropore has the highest percentage at 60 days of soaking, and then starts to decrease. This is related to the pattern of damage of bedrock specimens under uniaxial compression. Combined with Figure 3, it can be seen that the trends of the three characteristic strengths are roughly the same, with the characteristic strength of bedrock specimens continuously decreasing at the beginning of the soaking period, reaching the highest degree of deterioration at 60 days, rebounding sharply at 90–120 days of soaking, and fluctuating in a small range thereafter. The above results of test indicate that there is a more significant correlation between micropore and the characteristic strength of bedrock specimens.
The results of the previous test showed that the pH value of the leaching solution continued to increase with the increase of soaking durations, presumably due to the chemical reaction between the leaching solution and the bedrock specimen to generate new minerals, resulting in a decrease in concentration. The porosity ratio of the bedrock specimens when not leached was mostly micropore and less macropore; the porosity continued to increase from soaking to 90 days, and the micropore ratio reached the maximum at 60 days; the macropore continued to decrease after reaching a high point at 30 days of soaking, and gradually increased during 90–120 days of soaking.
In the fuzzy ash correlation analysis, the correlation coefficient of parameters is an important quantitative index to judge the correlation between the reference and comparison sequences, and the more obvious variations of the correlation coefficient of parameters indicates the higher correlation between the reference and comparison sequences (Liang et al., 2018). The analysis of the fuzzy grey results shows that the correlation coefficient of pH of the leaching solution varies significantly at the beginning of soaking, and the fluctuation becomes slower with the increase of soaking duration, Figure 9C; the correlation coefficient of micropore fluctuates sharply from 0 to 90 days of soaking and slows down at the end of soaking, Figure 9A; the correlation coefficient of macropore shows an increasing trend at the beginning of soaking until the fluctuation at the end of soaking, Figure 9E. And the porosity correlation coefficient shows strong fluctuations throughout the soaking process, indicating that the microscopic pore variations of bedrock specimens under leaching erosion is highly correlated with the deterioration activity of bedrock specimens, Figure 9B; combined with Figure 9D, the correlation coefficient curve of NMR T2 relaxation time decreases at the beginning of soaking and fluctuates significantly at the end of soaking. NMR T2 relaxation time is an important parameter reflecting the variations of bedrock pore structure, and the fluctuation variation of the correlation coefficient of NMR T2 relaxation time is roughly related to the variation trend of the characteristic intensity of bedrock specimens. From the above analysis, it can be seen that there is a more significant correlation between the trends of micropore and porosity of bedrock specimens and the internal deterioration activities of bedrock specimens, followed by the pH value of leaching solution.
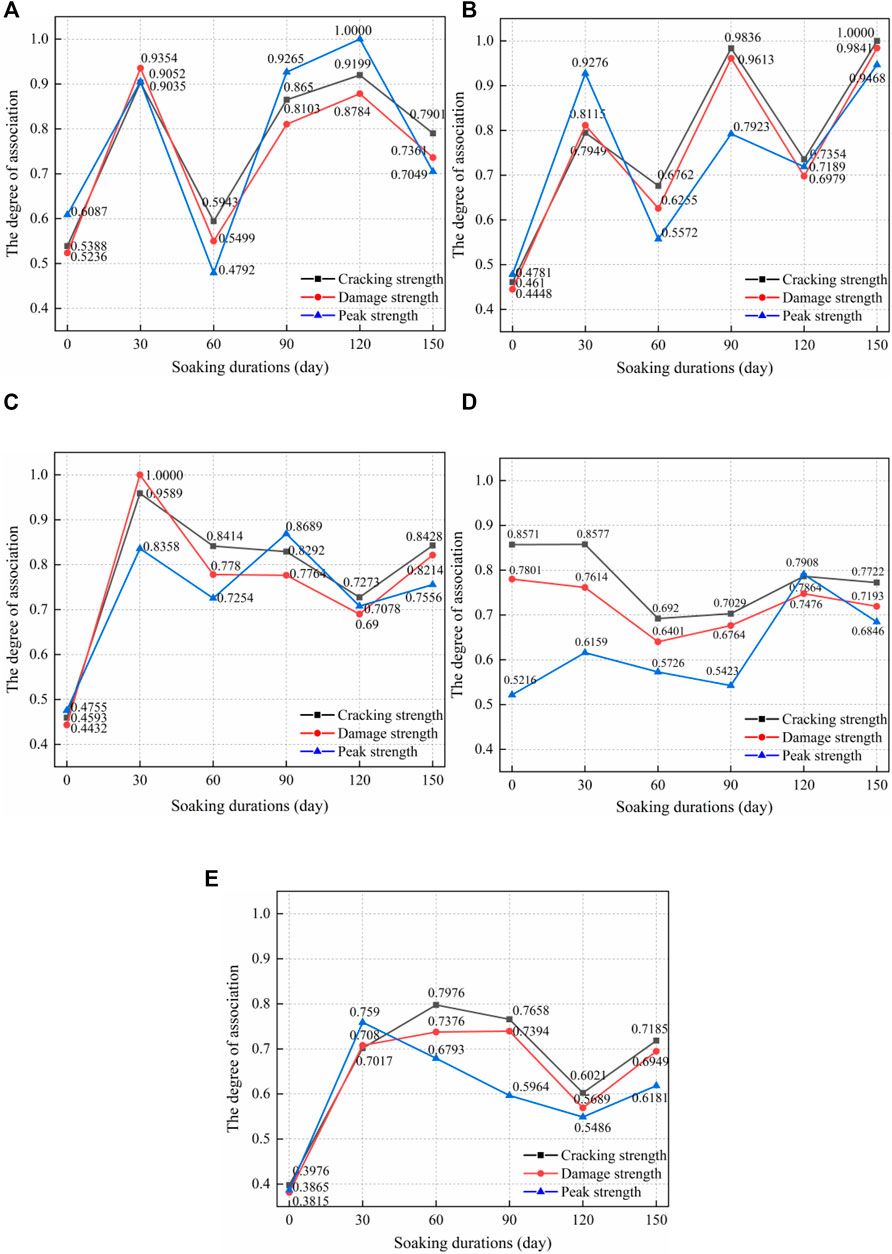
FIGURE 9. Comparison of the correlation coefficient under different parameters. (A) Micropore; (B) Porosity; (C) pH; (D) T2; (E) Macropore.
5 Conclusion
In this paper, the E-TOPSIS method and fuzzy ash correlation analysis were combined to fuse the multi-source heterogeneous information of porosity, pH, mass, volume, density, p-wave and characteristic strength of ionic rare earth slope bedrock under leaching erosion. This research can serve as a theoretical foundation for predicting slope hazards in ionic rare earth mines. From the research, the following results were drawn:
1) The bedrock parameters of ionic rare earth slopes have the characteristic of changing with the variation of soaking duration. The E-TOPSIS method with the advantage of analysis under different time conditions and the fuzzy grey correlation method are selected to fuse the characteristic parameters of slope bedrock under leaching erosion. The entropy weight method shows that the influence of leaching erosion on the pore parameters is more significant.
2) Under the leaching erosion, the mechanical properties of the bedrock specimens showed a significant decrease and then a significant recovery, followed by fluctuations in a small range. Along with the deterioration phenomenon, the pore parameters of the bedrock specimens show a dominant response to the pH of the leaching solution. The results of the E-TOPSIS composite analysis are consistent with the ranking of the degradation of the bedrock specimens at different soaking durations.
3) The micropore of bedrock specimen accounted for the highest percentage at 60 days of soaking, and the porosity varied significantly during the soaking period. The results of the fuzzy ash correlation analysis showed that the correlation between the micropore, the porosity and the characteristic strength of bedrock was the most significant, followed by the pH of the leaching solution.
Data Availability Statement
The original contributions presented in the study are included in the article/Supplementary Material, further inquiries can be directed to the corresponding author.
Author Contributions
Drafting of article: WZ and ZF; planning and supervision of the research: BL; analysis and interpretation of data: ZZ and PZ; acquisition of data: ZG, KH, and XW.
Funding
This work was supported by the National Natural Science Foundation of China (51764014, 51874148, 51904119, 52004106, and 52104086), the Natural Science Foundation of Jiangxi Province (20192BAB206018 and 20192BCBL23010), the Postdoctoral Research Foundation of China (2017M622099), the Open Research Fund of State Key Laboratory of Geomechanics and Geotechnical Engineering (Z017024), the Education Commission Program of Jiangxi Province (GJJ160674), the Postdoctoral Research Foundation of Jiangxi Province (2018KY03), the Youth Jinggang Scholars Program in Jiangxi Province (QNJG2019054), the Jiangxi thousand talents program (jxsq2018102092), the Innovative Leading Talents Program in Ganzhou ((2020)60).
Conflict of Interest
The authors declare that the research was conducted in the absence of any commercial or financial relationships that could be construed as a potential conflict of interest.
Publisher’s Note
All claims expressed in this article are solely those of the authors and do not necessarily represent those of their affiliated organizations, or those of the publisher, the editors and the reviewers. Any product that may be evaluated in this article, or claim that may be made by its manufacturer, is not guaranteed or endorsed by the publisher.
References
Abdel-Basset, M., Manogaran, G., Gamal, A., and Smarandache, F. (2019). A Group Decision Making Framework Based on Neutrosophic TOPSIS Approach for Smart Medical Device Selection. J. Med. Syst. 43 (2), 38. doi:10.1007/s10916-019-1156-1
Behzadian, M., Khanmohammadi Otaghsara, S., Yazdani, M., and Ignatius, J. (2012). A State-Of The-Art Survey of TOPSIS Applications. Expert Syst. Appl. 39 (17), 13051–13069. doi:10.1016/j.eswa.2012.05.056
Chen, P. (2019). Effects of Normalization on the Entropy-Based TOPSIS Method. Expert Syst. Appl. 136, 33–41. doi:10.1016/j.eswa.2019.06.035
Chen, P. (2021). Effects of the Entropy Weight on TOPSIS. Expert Syst. Appl. 168, 114186. doi:10.1016/j.eswa.2020.114186
Chen, Z. (2011). Global Rare Earth Resources and Scenarios of Future Rare Earth Industry. J. Rare Earths 29 (1), 1–6. doi:10.1016/s1002-0721(10)60401-2
Dutta, T., Kim, K.-H., Uchimiya, M., Kwon, E. E., Jeon, B.-H., Deep, A., et al. (2016). Global Demand for Rare Earth Resources and Strategies for green Mining. Environ. Res. 150, 182–190. doi:10.1016/j.envres.2016.05.052
Fan, X., Xu, Q., Scaringi, G., Dai, L., Li, W., Dong, X., et al. (2017). Failure Mechanism and Kinematics of the Deadly June 24th 2017 Xinmo Landslide, Maoxian, Sichuan, China. Landslides 14 (6), 2129–2146. doi:10.1007/s10346-017-0907-7
Fang, X., Xu, J., and Wang, P. (2018). Compressive Failure Characteristics of Yellow sandstone Subjected to the Coupling Effects of Chemical Corrosion and Repeated Freezing and Thawing. Eng. Geology. 233, 160–171. doi:10.1016/j.enggeo.2017.12.014
Geng, H., Zhang, S., Zhi, J., Zhang, R., Ren, J., and Ro, C.-U. (2019). Acid Solution Decreases the Compressional Wave Velocity of sandstone from the Yungang Grottoes, Datong, China. Herit Sci. 7, 11. doi:10.1186/s40494-019-0245-2
Guo, Z.-q., Lai, Y.-m., Jin, J.-f., Zhou, J.-r., Sun, Z., and Zhao, K. (2020). Effect of Particle Size and Solution Leaching on Water Retention Behavior of Ion-Absorbed Rare Earth. Geofluids 2020, 1–14. doi:10.1155/2020/4921807
Han, T., Shi, J., Chen, Y., and Li, Z. (2016). Effect of Chemical Corrosion on the Mechanical Characteristics of Parent Rocks for Nuclear Waste Storage. Sci. Tech. Nucl. Installations 2016, 1–11. doi:10.1155/2016/7853787
Huang, X.-W., Long, Z.-Q., Wang, L.-S., and Feng, Z.-Y. (2015). Technology Development for Rare Earth Cleaner Hydrometallurgy in China. Rare Met. 34 (4), 215–222. doi:10.1007/s12598-015-0473-x
Huang, X., Pang, J., Liu, G., and Chen, Y. (2020). Experimental Study on Physicomechanical Properties of Deep Sandstone by Coupling of Dry-Wet Cycles and Acidic Environment. Adv. Civil Eng. 2020, 1–17. doi:10.1155/2020/2760952
Huang, Z., Zeng, W., Gu, Q., Wu, Y., Zhong, W., and Zhao, K. (2021). Investigations of Variations in Physical and Mechanical Properties of Granite, sandstone, and marble after Temperature and Acid Solution Treatments. Construction Building Mater. 307, 124943. doi:10.1016/j.conbuildmat.2021.124943
Li, J., Kaunda, R. B., Zhu, L., Zhou, K., and Gao, F. (2019). Experimental Study of the Pore Structure Deterioration of Sandstones under Freeze-Thaw Cycles and Chemical Erosion. Adv. Civil Eng. 2019, 1–12. doi:10.1155/2019/9687843
Liang, X., Ye, M., Yang, L., Fu, W., and Li, Z. (2018). Evaluation and Policy Research on the Sustainable Development of China's Rare Earth Resources. Sustainability 10 (10), 3792. doi:10.3390/su10103792
Liu, S. F., Tao, L. Y., Xie, N. M., and Yang, Y. J. (2016). On the New Model System and Framework of Grey System Theory. J. Grey Syst. 28 (1), 1–15. Available at: http://ieeexplore.ieee.org/stamp/stamp.jsp?tp=&arnumber=7301810
Luo, F. Y., Zhang, G., and Ma, C. H. (2021). On the Soil Slope Failure Mechanism Considering the Mutual Effect of Bedrock and Drawdown. Int. J. Geomechanics 21 (2), 12. doi:10.1061/(asce)gm.1943-5622.0001903
Luo, T., Fan, G., Guo, B., and Zhang, S. (2021). Experimental Study on the Influence of Hydro-Chemical Erosion on Morphology Parameters and Shear Properties of limestone Fractures. Acta Geotech. 16 (12), 3867–3880. doi:10.1007/s11440-021-01365-9
Miao, S., Cai, M., Guo, Q., Wang, P., and Liang, M. (2016). Damage Effects and Mechanisms in Granite Treated with Acidic Chemical Solutions. Int. J. Rock Mech. Mining Sci. 88, 77–86. doi:10.1016/j.ijrmms.2016.07.002
Miao, S., Wang, H., Cai, M., Song, Y., and Ma, J. (2018). Damage Constitutive Model and Variables of Cracked Rock in a Hydro-Chemical Environment. Arab J. Geosci. 11 (2), 14. doi:10.1007/s12517-017-3373-6
Ni, J., Chen, Y.-L., Wang, P., Wang, S.-R., Peng, B., and Azzam, R. (2017). Effect of Chemical Erosion and Freeze-Thaw Cycling on the Physical and Mechanical Characteristics of Granites. Bull. Eng. Geol. Environ. 76 (1), 169–179. doi:10.1007/s10064-016-0891-5
Si, S.-L., You, X.-Y., Liu, H.-C., and Zhang, P. (2018). DEMATEL Technique: A Systematic Review of the State-Of-The-Art Literature on Methodologies and Applications. Math. Probl. Eng. 2018, 1–33. doi:10.1155/2018/3696457
Silva, R. G., Morais, C. A., Teixeira, L. V., and Oliveira, É. D. (2019). Selective Precipitation of High-Quality Rare Earth Oxalates or Carbonates from a Purified Sulfuric Liquor Containing Soluble Impurities. Mining, Metall. Exploration 36 (5), 967–977. doi:10.1007/s42461-019-0090-6
Wang, Y., Zhang, H., Lin, H., Zhao, Y., and Liu, Y. (2020). Fracture Behaviour of central-flawed Rock Plate under Uniaxial Compression. Theor. Appl. Fracture Mech. 106, 102503. doi:10.1016/j.tafmec.2020.102503
Zhang, C., Wang, Y., and Jiang, T. (2020). The Propagation Mechanism of an Oblique Straight Crack in a Rock Sample and the Effect of Osmotic Pressure under In-Plane Biaxial Compression. Arab J. Geosci. 13 (15), 736. doi:10.1007/s12517-020-05682-3
Zhang, Q. B., and Zhao, J. (2013). A Review of Dynamic Experimental Techniques and Mechanical Behaviour of Rock Materials. Rock Mech. Rock Eng. 47 (4), 1411–1478. doi:10.1007/s00603-013-0463-y
Zhao, K., Wu, W., Zeng, P., Yang, D., Liu, Y., Wang, L., et al. (2021a). Numerical and Experimental Assessment of the Sandstone Fracture Mechanism by Non-uniform Bonded Particle Modeling. Rock Mech. Rock Eng. 54 (12), 6023–6037. doi:10.1007/s00603-021-02620-x
Zhao, K., Yang, D., Gong, C., Zhuo, Y., Wang, X., and Zhong, W. (2020). Evaluation of Internal Microcrack Evolution in Red sandstone Based on Time-Frequency Domain Characteristics of Acoustic Emission Signals. Construction Building Mater. 260, 120435. doi:10.1016/j.conbuildmat.2020.120435
Zhao, K., Yang, D., Zeng, P., Gong, C., Wang, X., and Zhong, W. (2021b). Accelerating Creep Stage of Red Sandstone Expressed and Quantitatively Identified Based on Acoustic Emission Information. Rock Mech. Rock Eng. 54 (9), 4867–4888. doi:10.1007/s00603-021-02529-5
Zhao, K., Yang, D., Zeng, P., Huang, Z., Wu, W., Li, B., et al. (2021c). Effect of Water Content on the Failure Pattern and Acoustic Emission Characteristics of Red sandstone. Int. J. Rock Mech. Mining Sci. 142, 104709. doi:10.1016/j.ijrmms.2021.104709
Zhao, Y. Y., Zhang, G., Hu, D. S., and Han, Y. Z. (2018). Centrifuge Model Test Study on Failure Behavior of Soil Slopes Overlying the Bedrock. Int. J. Geomechanics 18 (11), 11. doi:10.1061/(asce)gm.1943-5622.0001292
Keywords: ion-absorbed rare earth mine slopes, bedrock, leaching erosion, deterioration, multi-source information fusion
Citation: Zhong W, Feng Z, Li B, Zhang Z, Zeng P, Guo Z, Hu K and Wang X (2022) Multi-Source Information Fusion Correlation Analysis of Bedrock Deterioration on Slopes Under Leaching Erosion. Front. Earth Sci. 10:862110. doi: 10.3389/feart.2022.862110
Received: 25 January 2022; Accepted: 01 March 2022;
Published: 24 March 2022.
Edited by:
Wen Nie, Jiangxi University of Science and Technology, ChinaReviewed by:
Jun Peng, The University of Hong Kong, Hong Kong SAR, ChinaChunyang Zhang, Wuhan University of Technology, China
Ming Tao, Central South University, China
Copyright © 2022 Zhong, Feng, Li, Zhang, Zeng, Guo, Hu and Wang. This is an open-access article distributed under the terms of the Creative Commons Attribution License (CC BY). The use, distribution or reproduction in other forums is permitted, provided the original author(s) and the copyright owner(s) are credited and that the original publication in this journal is cited, in accordance with accepted academic practice. No use, distribution or reproduction is permitted which does not comply with these terms.
*Correspondence: Bo Li, bGlib19zbWlsZUBob3RtYWlsLmNvbQ==
 Wen Zhong1,2,3
 Zequn Zhang
 Zhongqun Guo
 Kaijian Hu
