 Xiaotong Zhang
 Huamao Yuan
 Jinming Song
 Liqin Duan1,2,3,4
94% of researchers rate our articles as excellent or good
Learn more about the work of our research integrity team to safeguard the quality of each article we publish.
Find out more
ORIGINAL RESEARCH article
Front. Earth Sci., 25 April 2022
Sec. Marine Geoscience
Volume 10 - 2022 | https://doi.org/10.3389/feart.2022.861977
This article is part of the Research TopicSedimentation on the Continental Margins: From Modern Processes to Deep-Time RecordsView all 28 articles
The migration and enrichment of redox-sensitive trace elements (RSEs) from seawater to sediments are controlled not only by their geochemical properties but also by marine redox conditions. Therefore, RSEs, such as Mo, U, and V, are extensively used to indicate redox states in marine environments. To retrieve the historical redox state in the hypoxic zone near the Changjiang River Estuary and its adjacent waters, the distribution and enrichment degree of Mo, U, and V in a sediment core collected from the recurrently hypoxic region were investigated. The correlation analysis shows that the authigenic enrichment of Mo and U in sediment core 3,050–2 is primarily controlled by redox conditions, rather than sediment grain size, adsorption on organic matters, Fe–Mn (hydr)oxides, and terrigenous detritus input. Mo-U covariation is selected to analyze the evolution of redox conditions in the seasonally hypoxic zone. The MoEF/UEF values in this sediment core are almost between 0.1 and 0.3×Mo/Umodern seawater value and show a general decreasing trend with depth, indicating an overall progressive transition from oxic to suboxic conditions in this area since 2005. The close MoEF/UEF values and similar chronological Mo-U variations by comparing our results with previous studies in adjacent areas offer common evidence for the gradually intensified bottom water–oxygen stress, suggesting the possible application of MoEF/UEF in retrieving redox development in this coastal hypoxic zone.
Dissolved oxygen (DO), a vital factor for the growth and survival of organisms living on oxygen in the ocean, is closely related to the stable maintenance of marine ecosystems, and its concentration is generally used to indicate marine ecological environment conditions (Breitburg et al., 2018). With the impact of global change and human activities, the DO level has been decreasing in the open ocean and coastal waters since at least the middle of the 20th century (Schmidtko et al., 2017; Oschiles et al., 2018). As one of the most important changes in modern marine ecosystems, ocean deoxygenation further aggravates low DO content in the ocean (Keeling et al., 2010). During the last several decades, the occurrence of hypoxia (defined as oxygen concentration ≤2 mg/L) has been widely observed in many estuarine and coastal regions and is most likely accelerated by human activities (Watson, 2016). Exploring the historical hypoxic intensity and extensity in estuaries can, thus, help us gain a deep understanding of the changing marine environment.
The typical coastal hypoxic zone near the Changjiang River Estuary and its adjacent waters in the East China Sea has been recorded since the late 1950s (Wang, 2009). Based on the seasonal investigation data, the hypoxic zone generally develops at a water depth between 30 and 50 m, and the bottom water DO concentration (BWO) here shows a typical seasonal pattern (Wang et al., 2012): BWO begins to decline in late spring or early summer, reaches the lowest concentration in August, and rises again in autumn. Hypoxic evolution can be traced back to at least 2,600 years from benthic foraminifera and RSE geochemical evidence (Ren et al., 2019). In addition, evidence showed that the hypoxic extensity and intensity were highly variable in recent years (Zhang et al., 2019; Wu et al., 2020; Liu et al., 2021). Reconstruction of redox history can help us better evaluate mechanisms responsible for the variations of seasonal hypoxia and predict future patterns of hypoxia development, including its duration and magnitude.
Due to the lack of systematically and continuously direct DO observations over the past decades in the Changjiang River Estuary and its adjacent waters, it is difficult to directly evaluate the severity and historical variation of coastal hypoxia in this area. Redox-sensitive trace elements (RSEs), such as molybdenum (Mo), uranium (U), and vanadium (V), have been extensively applied as paleoredox proxies to reconstruct redox history due to their differential solubility and authigenic enrichment in various redox conditions (Russell and Morford, 2001; Algeo and Maynard, 2004; Algeo and Tribovillard, 2009; Chang et al., 2009; Morford et al., 2009). These paleoredox proxies are not only used to reconstruct past conditions but also modern systems (Algeo et al., 2012; Algeo and Li, 2020). Mo, U, and V exist in the form of dissolved high valence states and generally behave conservatively in oxic seawater, while they eventually diffuse into sediments through the sediment–water interface under reducing conditions. Due to different redox potentials and authigenic enrichment mechanisms, RSE authigenic enrichment degrees in sediments match well with different marine redox environments (Crusius and Thomson, 2003). Among them, enrichment of Mo primarily occurs in a euxinic environment, while U and V are generally enriched in a suboxic–anoxic environment (Morford and Emerson, 1999; Morford et al., 2009; Smrzka et al., 2019).
Unique geochemical behaviors of RSEs make them possible to be applied in the coastal hypoxic zone. Wu et al. (2020) suggested that Mo, U, and V were moderately enriched, while Mo and V were more sensitive to seasonal variation of nearshore hypoxia than U in the Changjiang Estuary. However, Xie et al. (2020) found that the redox state recorded by RSEs was inconsistent with the redox environment located in the inner continental shelf of the East China Sea. A similar result was also obtained in the oxygen minimum zone (OMZ) of the East Arabian Sea, in which the authors speculated that high deposition flux in continental shelf environment and DO seasonal volatility in coastal hypoxic zones might lead to the loss of signals recorded by RSEs in sediments (Acharya et al., 2015). Based on the previous limited research studies, RSE enrichment degree and response to seasonal hypoxia are still controversial in estuarine and coastal regions. It is necessary to further study enrichment mechanism and potential indication of RSEs in such area.
In this study, one sediment core was collected in the recurrently hypoxic region near the Changjiang River Estuary and its adjacent waters. The elemental geochemistry of RSEs and major elements (Al, Fe, and Mn) and the grain size and total organic carbon (TOC) were analyzed in the sediment core. We aim to examine the controlling factors on enrichment of RSEs and their potential indication for hypoxia history in the Changjiang River Estuary.
In August 2020, the sediment sample was collected with a Soutar-type box corer aboard R/V Kexue 3 in site 3,050-2 (30.49°N, 123.02°E) in the hypoxic zone near the Changjiang River Estuary and its adjacent waters (Figure 1). The overlying water was removed by slow side drainage with a suction hose. Acid-washed PVC tubes (with 10 cm diameter and 30 cm length) were inserted slowly and vertically inside the box corer to obtain undisturbed sediment cores. The water depth at the sampling location is 61 m. The DO concentration of bottom water was 1.76 mg/L determined by electrochemical probes and also calibrated by traditional Winkler titration on board (Guo et al., 2021). After collection, this short core was immediately transferred to a glove bag filled with N2 and was sectioned at a 1-cm interval at upper 10 and 2-cm interval at lower 20 cm. These sliced sediment samples were centrifuged at 4°C to separate pore water and then were immediately stored in a frozen (−20°С) chamber. After transport to the laboratory, the sediment samples were freeze-dried under vacuum and then were ground to less than 200 mesh (74 μm for mesh size) for further analysis.
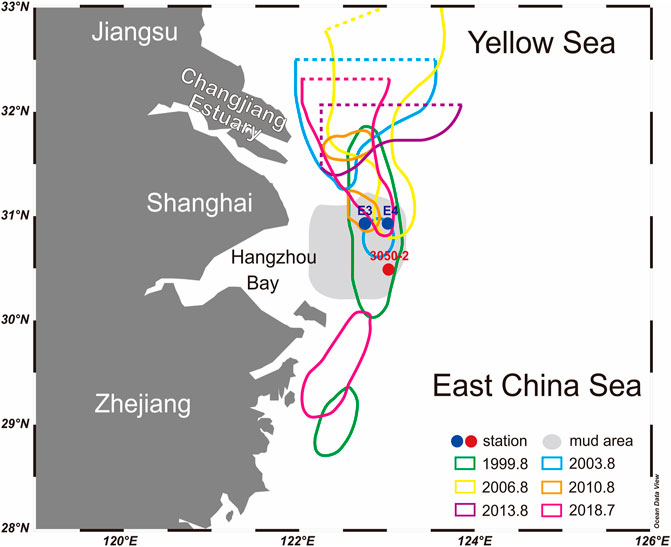
FIGURE 1. Changes of hypoxic zones near the Changjiang River Estuary and its adjacent waters with locations of core 3,050-2, E3, and E4 (Wu et al., 2020; Yin et al., 2020). Areas marked by solid and dotted lines in different colors were hypoxic zones (DO ≤ 2.0 mg/L) recorded in recent years. The details of these stations are given in Supplementary Table S1.
The grain size analysis was carried out using a laser particle size analyzer (1190L, Cilas, France). According to accumulative percentages of different grain sizes, the contents of clay (<4 μm), silt (4–63 μm), and sand (>63 μm) and their median size (D50 value) were calculated by previous procedures (Huang, 1999). Total organic carbon (TOC), total nitrogen (TN), and their stable carbon (δ13C) and nitrogen (δ15N) isotopes of sediment samples were measured by using an elemental analyzer (Flash EA IsoLink CN, Thermo Fisher Scientific, Germany) interfaced with an isotope ratio mass spectrometer (MAT 253 plus, Thermo Fisher Scientific, Germany) (Guo et al., 2021). International reference materials (EMA-B2151 and EMA-B2153) were used to check the operating status of the instrument. The analytical precision among six runs of a given sample was typically ±0.02%, ±0.003%, and ±0.15‰ for the carbon content, nitrogen content, and δ13C value, respectively.
The contents of Al, Fe, and Mn in sediments were measured by using a wavelength-dispersive X-ray fluorescence spectrometer (S8 Tiger, Bruker AXS, Germany). The sample preparation was strictly followed according to the work by Sun et al. (2020). The 0.6000 g pre-dried sample was mixed with the flux (lithium tetraborate: lithium metaborate = 67:33) weighing 6.0000 g in a platinum crucible. Then, 1 ml LiNO3 (22%) was taken as the oxidant and 0.6 ml LiBr (12%) as the mold, which were added and mixed uniformly. The crucible was loaded in a fusion bead machine, pre-oxidized at 700°C for 200 s, and then melted at 1,050°C for 10 min, with a uniform speed rotation for homogeneity. The fused mixture was slow-cooled in the crucible and formed into a smooth crack fused bead. The analytical accuracy was performed in the same procedure using national reference materials (GBW07336, GBW07122, GBW07448, and GBW07308), and the recoveries for Al, Fe, and Mn were 100.0 ± 0.6%, 100.4 ± 0.9%, and 98.9 ± 4.3%, respectively. The analytical precisions (defined as the relative standard deviation, RSD) were estimated by analyzing 12 replicate reference material samples (GBW07314) to be 0.81, 0.73, and 1.98% for Al, Fe, and Mn, respectively.
Trace element analyses including Mo, U, and V were carried out using an inductively coupled plasma mass spectrometer (ICP-MS, Agilent 7,900, Japan). We strictly followed the chemical pretreatment and analytical method established by Chen et al. (2017). Approximately, 0.05 g dried sediment powder was digested in a pre-cleaned Teflon container with a mixture of 1 ml HNO3 and 1 ml HF at around 190°C for 24 h. After cooling, the mixture was evaporated at 120°C to nearly dry state. A measure of 1 ml HNO3 was added to the residual and was evaporated to nearly dry state again. Then, 1 ml HNO3 and 4 ml ultrapure water were added and further digested at 190°C for 2 h. Finally, the digestion solution was accurately diluted to ∼ 100 g with 2% v/v HNO3. The analytical accuracy was performed in the same procedure using national reference materials (GBW07309, GBW07315, and PACS-3), and the recoveries for Mo, U, and V were 95.8 ± 3.8%, 102.7 ± 6.0%, and 101.0 ± 2.7%, respectively.
The RSE contents are generally normalized by Al (RSE/Al) to eliminate the interference of terrigenous detritus inputs (Zhang et al., 2017). In addition, the enrichment factor (RSEEF = (RSE/Al)sample/(RSE/Al)background) is defined to reflect RSE enrichment degree relative to the background values in sediments (Xie et al., 2019). The bottom RSE/Al values in core E4 (Figure 1, Wu et al., 2020) adjacent to core 3,050-2 were used as local background values in our research as they are less affected by environmental pollution and human activities. Based on different authigenic enrichment degrees of Mo and U in different redox conditions, Algeo and Tribovillard (2009) further proposed the MoEF/UEF value shown in Table 1, and the Mo-U covariation system could also be used to indicate the redox state of the bottom water environment (Morford and Emerson, 1999; Tang et al., 2015). Herein, we choose the authigenic Mo/U value in the modern Pacific Ocean (7.5, Tang et al., 2015) as the “Mo/Umodern seawater value”.
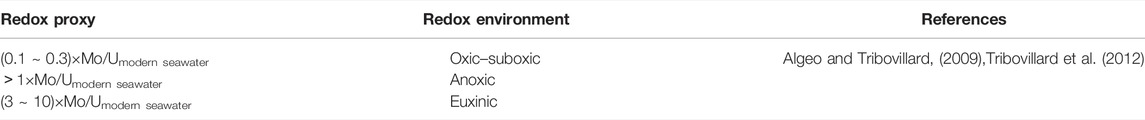
TABLE 1. MoEF/UEF value and associated redox environment.
Considering that the location of 3,050–2 was close to the adjacent sampling station of core E4 in the published study (Wu et al., 2020), the sedimentary details of E4 were applied in this study to estimate the depositional age of core 3,050–2. The mass accumulation rate (MAR) of E4 is relatively stable, with an average of ∼ 3.11 g/cm2/y, and the chronology of E4 could be dated back to the late 1980s. According to a series of fitting calculations (Supplementary Table S2), core 3,050-2 could be dated back to ∼ 2005, and the average deposition rate is ∼ 1.96 cm/y.
The median diameter (Supplementary Table S3) in core 3,050-2 is variable with depth, ranging from 9.42 to 77.88 μm, with an average of 21.82 μm. Grain size analysis shows that the predominant component is silt (4 ∼ 63 μm) with an average fraction of 51%, followed by sand (>63 μm) with an average fraction of 30%, and then clay (<4 μm) with an average fraction of 19%. In addition, the clay proportions show an overall decreasing trend with depth (Figure 2), and there is a slight increase at 0.5 ∼ 2.5 cm and 7.5 ∼ 9.5 cm. The maxima for the clay proportion occur at a depth of 2 ∼ 3 cm, accounting for 25.3%, whereas minima are found at 0 ∼ 1 cm, 7 ∼ 8 cm, and 28 ∼ 30 cm, accounting for 15.8, 15.1, and 12.2%, respectively.
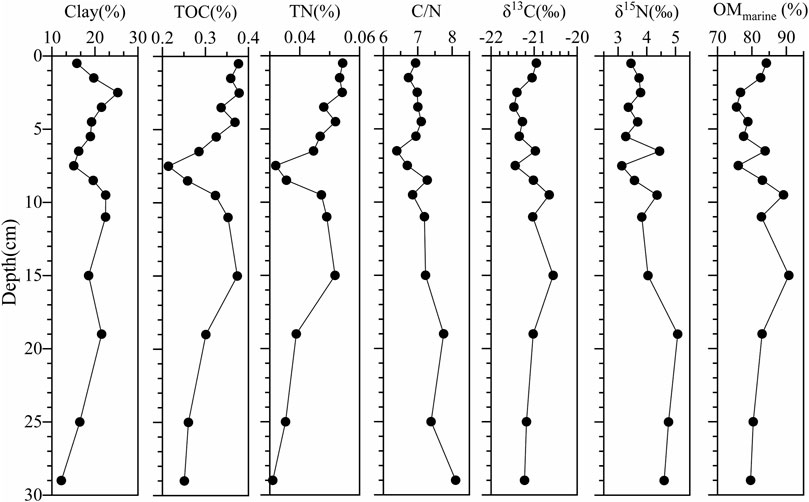
FIGURE 2. Down-core variations of clay (%), TOC, TN, C/N, δ13C, δ15N, and proportion of marine organic matter (OMmarine) in core 3,050–2.
The vertical distributions of total organic carbon (TOC), total nitrogen (TN), C/N values, and stable isotopic compositions of carbon (δ13C value) and nitrogen (δ15N value) in core 3,050–2 with depth are shown in Figure 2 (Supplementary Table S3). The contents of TOC (0.21∼0.38%) and TN (0.03∼0.05%) vary with depth, showing a general decrease with some variability superimposed, with an average of 0.32 and 0.05%, respectively. The contents are decreasing at 0.5∼7.5 cm and 15∼29 cm and increasing at 7.5∼15 cm. The C/N values show a slightly increasing trend with depth, ranging from 6.39 to 8.10, with an average of 7.10. This average ratio is close to the Redfield ratio (106:16 ≈ 6.6), which indicates that organic carbon is dominantly contributed by marine sources (Xie, 2019). The δ13C values are slightly fluctuant with depth, ranging from −21.5‰ to −20.6%, with an average of −21.1‰. Nevertheless, the δ15N values have a slightly increasing trend with depth, ranging from +3.1‰ to +5.1%, with an average of +3.9‰.
The binary mixing model of δ13C values (δ13Cmeasured = f × δ13Cmarine + (1-f) × δ13Cterrestrial, f is the proportion of marine organic matter) could be used to estimate the proportions of organic matter (OM) from terrestrial and marine sources (Yu, 2013). Previous studies in the Changjiang River Estuary and its adjacent waters have shown that δ13C values of marine source OM are generally between −21‰ and −19‰, which are higher than δ13C values of terrestrial OM (-27‰∼-25‰) (Yin et al., 2020). Therefore, δ13C values of the terrestrial and marine end member are selected to be −26‰ and −20‰, respectively. The results of this end-member model show that the proportion of marine source OM varies from 75.5 to 90.7%, with an average of 81.6%, indicating the majority of marine source OM in sediment core 3,050–2, and it is consistent with C/N values.
The vertical distribution of normalized RSE/Al values is shown in Figure 3 (Supplementary Table S3). Mo/Al values (0.038 × 10⁻⁴∼0.063 × 10⁻⁴) vary significantly with depth, with an average of 0.050 × 10⁻⁴. There is an obvious increase at 0.5∼1.5 cm, 7.5∼11 cm, and 25∼29 cm. The maximum Mo/Al value occurs at a depth of 11 cm (0.063 × 10⁻⁴). U/Al (0.277 × 10⁻⁴∼0.515 × 10⁻⁴) and V/Al (10.394 × 10⁻⁴∼12.240 × 10⁻⁴) values are slightly fluctuant with depth (except extreme bottom U/Al value), with an average of 0.331 × 10⁻⁴ and 11.368 × 10⁻⁴, respectively. The average values of U/Al and V/Al are slightly higher than those of post Archean Australian shale (PAAS, 0.164 × 10⁻⁴ and 7.937 × 10⁻⁴). Nevertheless, the average value of Mo/Al is mostly lower than that of post Archean Australian shale (PAAS, 0.053 × 10⁻⁴), except at a depth of 1.5 cm (0.056 × 10⁻⁴) and 11∼19 cm (0.054∼0.063 × 10⁻⁴) (Taylor and McLennan, 1985).
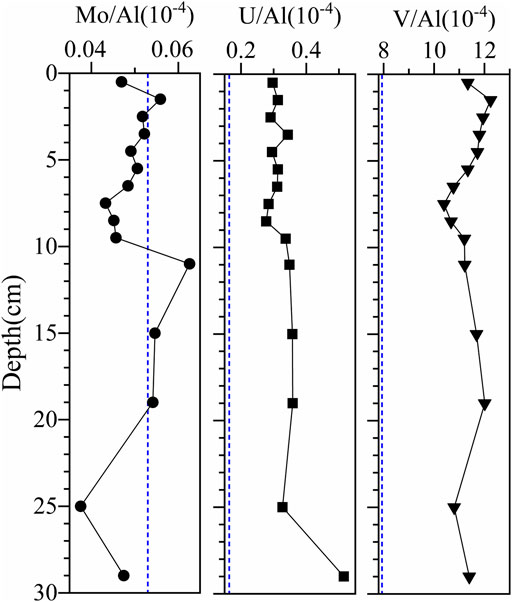
FIGURE 3. Down-core variations of RSE/Al values in core 3,050–2, and the blue dotted line represents average values of RSE/Al in post Archean Australian shale (PAAS).
In addition to the redox mechanisms mentioned previously, RSE migration and enrichment could be controlled by several other factors, such as organic matter and Fe–Mn redox cycling (Crusius et al., 1996; Morford and Emerson, 1999; Chang et al., 2009; Monien et al., 2014; Xie et al., 2019; Bennett and Canfield, 2020). To evaluate the controlling factors of RSEs in sediment core 3,050–2, the correlations between RSE/Al values and clay proportion, TOC, Fe/Al, and Mn/Al values were analyzed as shown in Figures 4A–D,F (Supplementary Table S4).
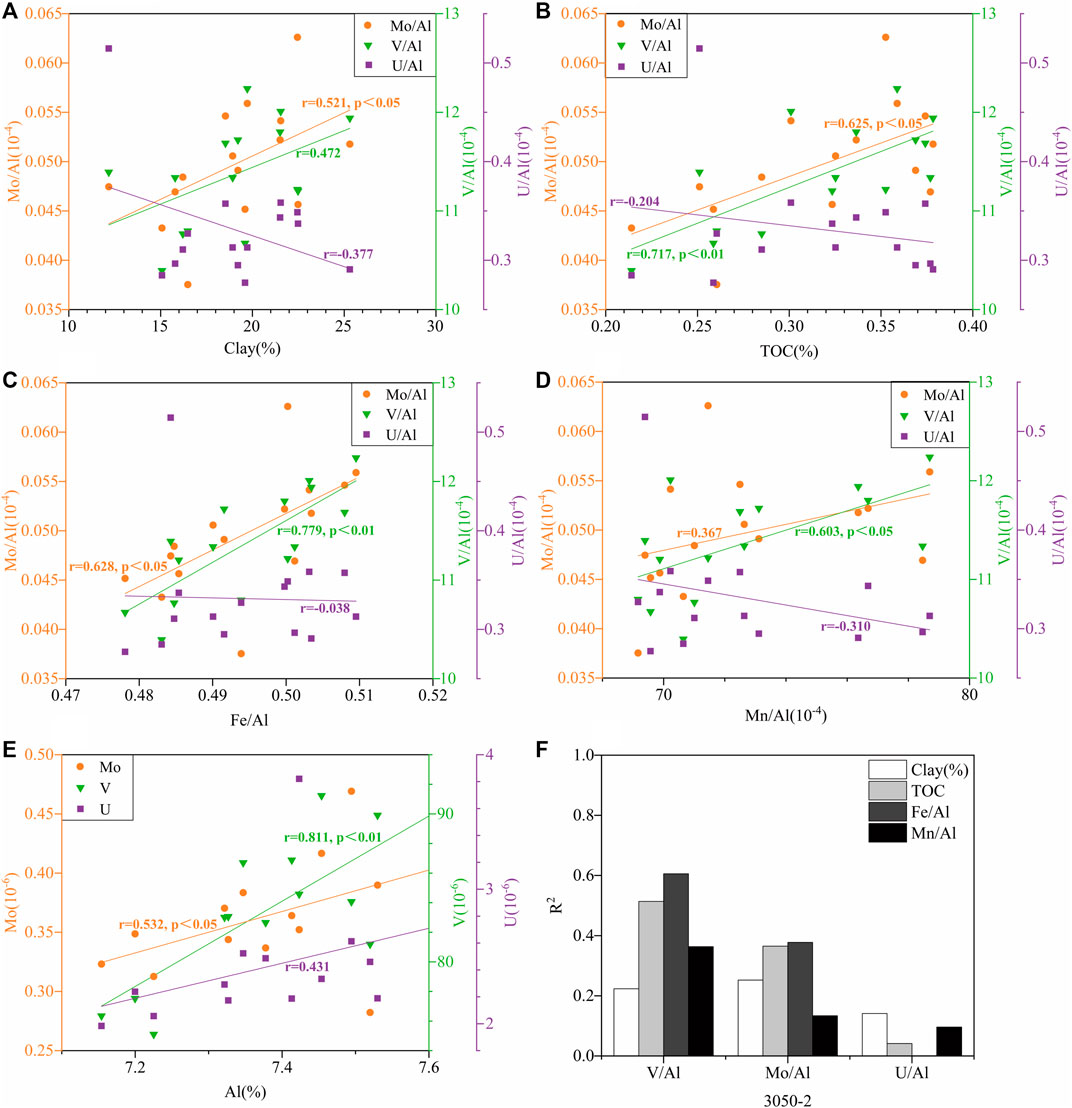
FIGURE 4. Correlation between RSE/Al values and clay proportion (A), TOC (B), Fe/Al value (C), Mn/Al value (D), and their R2 (F); correlation between RSEs and Al (E).
Mo, U, and V are easily removed by adsorption on organic matter and/or Fe-Mn (hydr)oxides in oxic conditions, and then, they could be released back into pore water when the environment becomes reducing (Smrzka et al., 2019). On the other hand, the degradation of sinking organic matter needs to consume dissolved oxygen; then, it could lead to hypoxia in bottom water, which provides the reducing condition for the migration and enrichment of RSEs (Wang et al., 2016; Wu et al., 2020). In the study area, there is no significant correlation between U/Al (R2 = 0.041), Mo/Al (R2 = 0.365) values, and TOC. Similar relationships between RSE/Al and TOC were also found in the mud area of the Changjiang Estuary, which suggest that TOC contents do not directly control enrichments of Mo and U in sedimentary records (Zhao et al., 2021), although adsorption on sedimentary OM might be a mechanism by which the enrichments occur (Smrzka et al., 2019; Bennett and Canfield, 2020). However, the significant correlation between V/Al values and TOC (r = 0.717, p < 0.01) might indicate that V is relatively easy to shuttle by absorption on sedimentary OM in this area. The weak correlations between Mo/Al, U/Al values and Fe/Al, and Mn/Al values (R2 = 0.001∼0.377) indicate that the controlling effect of Fe–Mn redox cycling on Mo and U in this area is not strong enough. However, V/Al and Fe/Al values have a relatively significant correlation (r = 0.779, p < 0.01), and V is more strongly affected by Fe redox cycling in this area, consistent with the results of Wu et al. (2020). V might be adsorbed on Fe-(hydr)oxides converting into sediments temporarily and then could be released with the reduction of Fe-(hydr)oxides (Smrzka et al., 2019; Xie et al., 2020).
Previous studies in the Changjiang River Estuary and its adjacent waters have demonstrated that trace elements were controlled by grain size in the offshore oxic environment (named “grain size effect”), and they are easily affected by terrigenous detritus, which are opposite to those in the hypoxic zone (Zhang et al., 2005; Xu et al., 2007). In our study, there is no significant correlation between RSE/Al values and clay proportion (R2 = 0.141∼0.252), which indicates that the “grain size effect” has a low impact on the distribution of RSEs in core 3,050–2. Similar results were also found by Zhang et al. (2005) and Xu et al. (2007), and they have discovered that RSEs were mainly controlled by redox conditions in the hypoxic zone off the Changjiang Estuary. Considering the nearshore input of terrigenous detritus, a similar correlation analysis between RSEs and Al was also performed (Figure 4E). The results show that V (R2 = 0.658, p < 0.01) is strongly disturbed by terrigenous detritus input, while Mo (R2 = 0.186) and U (R2 = 0.285) are less affected.
V is strongly affected by adsorption on organic matter, Fe redox cycling, and input of terrigenous detritus, and these factors could interfere with its sedimentary records of authigenic enrichment. Therefore, we consider that V could not be used as an effective proxy of marine hypoxia in this area. In contrast, Mo and U are less affected by adsorption on organic matter, Fe–Mn redox cycling, input of terrigenous detritus, and “grain size effect”. The authigenic enrichment of Mo and U is still primarily controlled by the intensity of reducing conditions; thus, it can be used for the analysis of hypoxia evolution in the study area.
As mentioned previously (Table 1), Mo-U covariation in modern unrestricted marine sediments could be used to assess bottom water redox conditions based on their differential geochemical behavior (Algeo and Tribovillard, 2009; Tribovillard et al., 2012). In the present study, we also use this system to analyze the evolution of redox conditions in the seasonally hypoxic zone. The vertical MoEF/UEF values in core 3,050–2 show a general decreasing trend with depth (Figure 5) and are basically between 0.1 and 0.3×Mo/Umodern seawater value, indicating an overall progressive transition from oxic to suboxic conditions in this site since 2005. The finding of gradually intensified hypoxia in the study area during the last 15 years is consistent with that of previous studies in the adjacent area (Figure 1, Wu et al., 2020), although the overlap of depositional age between these two studies is just from 2005 to 2012 (Figure 5). In this period, MoEF/UEF values in core 3,050–2 (0.643∼1.605) are similar to those in adjacent core E3 (1.004∼1.688) and E4 (0.800∼1.584), and all show the general increasing trends since 2005 (Figure 5). Therefore, the close MoEF/UEF values and similar variation at different locations offer common evidence for the oxygen stress in this coastal hypoxic zone.
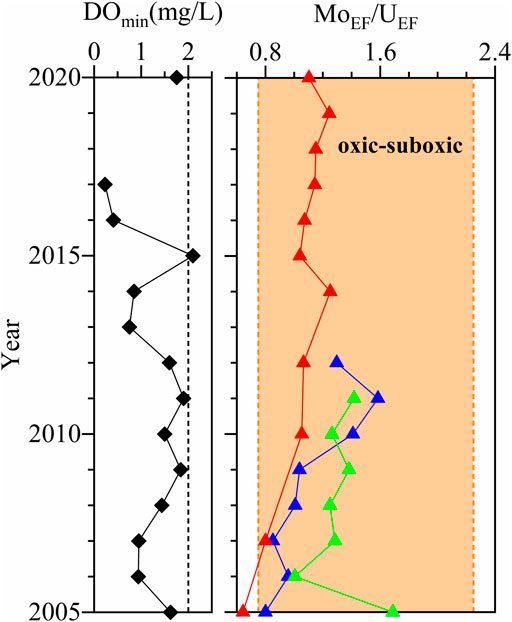
FIGURE 5. Observation data of minimum DO concentrations in the hypoxic zone off the Changjiang River Estuary and down-core variations of MoEF/UEF values in sediment core 3,050–2 (red), E3 (green), and E4 (blue) (Wu et al., 2020; Liu et al., 2021). Orange dashed lines represent 0.1 and 0.3 × Mo/Umodern seawater, and the orange shadow indicates an oxic–suboxic environment.
The compiled DO observation data showed that minimum DO concentrations of bottom waters in the hypoxic zone off the Changjiang River Estuary declined fluctuatingly in the recent 15 years. The hypoxic evolution is also well-registered by sedimentary MoEF/UEF values in core 3,050–2. From 2005 to 2014, the sampling station might be covered by the hypoxic zone, evidenced by the continuously increasing MoEF/UEF value and fluctuant decreasing minimum DO concentration. A significantly decreasing MoEF/UEF value and a relatively high minimum DO concentration were found in 2015, implying that the sampling station might not be covered by the hypoxic zone even temporarily. The recovery of hypoxia in this site after 2015 was recorded by obviously increasing MoEF/UEF values and decreasing minimum DO concentrations.
The authigenic sequestration depths of U and Mo are varied between SWI and relative deep layers within the sediment core, which depend on multiple controlling factors, such as oxygen penetration depth (OPD), sedimentary flux of OM, and sulfide concentration in pore water, especially in the seasonal hypoxia area (Algeo and Tribovillard, 2009; Tribovillard et al., 2012). Due to the lack of observation data mentioned previously, it is difficult to discriminate the potential effects of the offset between SWI and depth of authigenic Mo and U sequestration on these records. In addition, post-depositional remobilization in sediments and the potential impact of bioturbation and irrigation may also alleviate the robustness of the MoEF/UEF value in reconstructing past changes in benthic redox conditions (Crusius et al., 1996; Morford et al., 2009; Duan et al., 2019). However, it is suggested that the authigenic phases of Mo and U are effectively retained in the solid phase as the major proportion is largely unreactive in a eutrophic, low-salinity coastal setting (Jokinen et al., 2020). Moreover, consistent results of MoEF/UEF values and their correspondence with bottom DO levels between this study and previous works both suggest the possible application of the MoEF/UEF value in retrieving redox development in this area. As discussed previously, the OPD, dissolved Mo and U and sulfide concentration in pore water, and the fraction distribution of Mo and U in solid phase should be investigated together to further verify the feasibility of the MoEF/UEF proxy in tracking past changes in bottom water oxygenation in this seasonal hypoxia coastal setting.
The authigenic enrichment of Mo and U in sediment core 3,050–2 is primarily controlled by the redox conditions. MoEF/UEF values in core 3,050–2 indicate a general oxic–suboxic environment but are more prone to suboxic environment since 2005 in this area. The similar Mo-U covariation in core 3,050–2 and adjacent cores offer common evidence for the oxygen stress in this coastal hypoxic zone. The results could match well with hypoxic observation data in the Changjiang River Estuary and its adjacent waters and reveal the intensification of seasonal hypoxia in recent years. Our work suggests the possible application of the MoEF/UEF value in retrieving redox development in this area, though more marine chemical work should be investigated to further verify its feasibility.
The original contributions presented in the study are included in the article/Supplementary Material, further inquiries can be directed to the corresponding author.
XZ: conceptualization, methodology, formal analysis, investigation, writing—original draft, and visualization. HY: methodology, resources, writing—review and editing, and supervision. JS: project administration, supervision, and funding acquisition. LD: validation.
This work was supported by the Strategic Priority Research Program of the Chinese Academy of Sciences (No. XDA23050501), the National Natural Science Foundation of China (No. 41976037), and the Shandong Provincial Natural Science Foundation (No. ZR2020YQ28).
The authors declare that the research was conducted in the absence of any commercial or financial relationships that could be construed as a potential conflict of interest.
All claims expressed in this article are solely those of the authors and do not necessarily represent those of their affiliated organizations, or those of the publisher, the editors, and the reviewers. Any product that may be evaluated in this article, or claim that may be made by its manufacturer, is not guaranteed or endorsed by the publisher.
The authors are very grateful to the crews of R/V Kexue 3 for their sampling assistance.
The Supplementary Material for this article can be found online at: https://www.frontiersin.org/articles/10.3389/feart.2022.861977/full#supplementary-material
Acharya, S. S., Panigrahi, M. K., Gupta, A. K., and Tripathy, S. (2015). Response of Trace Metal Redox Proxies in continental Shelf Environment: the Eastern Arabian Sea Scenario. Continental Shelf Res. 106, 70–84. doi:10.1016/j.csr.2015.07.008
Algeo, T. J., and Li, C. (2020). Redox Classification and Calibration of Redox Thresholds in Sedimentary Systems. Geochimica et Cosmochimica Acta 287, 8–26. doi:10.1016/j.gca.2020.01.055
Algeo, T. J., and Maynard, J. B. (2004). Trace-element Behavior and Redox Facies in Core Shales of Upper Pennsylvanian Kansas-type Cyclothems. Chem. Geology. 206, 289–318. doi:10.1016/j.chemgeo.2003.12.009
Algeo, T. J., Morford, J., and Cruse, A. (2012). Reprint of: New Applications of Trace Metals as Proxies in Marine Paleoenvironments. Chem. Geology. 324-325, 1–5. doi:10.1016/j.chemgeo.2012.07.012
Algeo, T. J., and Tribovillard, N. (2009). Environmental Analysis of Paleoceanographic Systems Based on Molybdenum-Uranium Covariation. Chem. Geology. 268, 211–225. doi:10.1016/j.chemgeo.2009.09.001
Bennett, W. W., and Canfield, D. E. (2020). Redox-sensitive Trace Metals as Paleoredox Proxies: A Review and Analysis of Data from Modern Sediments. Earth-Science Rev. 204, 103175. doi:10.1016/j.earscirev.2020.103175
Breitburg, D., Levin, L. A., Oschlies, A., Grégoire, M., Chavez, F. P., Conley, D. J., et al. (2018). Declining Oxygen in the Global Ocean and Coastal Waters. Science 359, 46-+. doi:10.1126/science.aam7240
Chang, H., Chu, X., Feng, L., Huang, J., and Zhang, Q. (2009). Redox Sensitive Trace Elements as Paleoenvironments Proxies. Geol. Rev. 55, 91–99. doi:10.16509/j.georeview.2009.01.014
Chen, S., Wang, X., Niu, Y., Sun, P., Duan, M., Xiao, Y., et al. (2017). Simple and Cost-Effective Methods for Precise Analysis of Trace Element Abundances in Geological Materials with ICP-MS. Sci. Bull. 62, 277–289. doi:10.1016/j.scib.2017.01.004
Crusius, J., Calvert, S., Pedersen, T., and Sage, D. (1996). Rhenium and Molybdenum Enrichments in Sediments as Indicators of Oxic, Suboxic and Sulfidic Conditions of Deposition. Earth Planet. Sci. Lett. 145, 65–78. doi:10.1016/S0012-821X(96)00204-X
Crusius, J., and Thomson, J. (2003). Mobility of Authigenic Rhenium, Silver, and Selenium during Postdepositional Oxidation in marine Sediments. Geochimica et Cosmochimica Acta 67, 265–273. doi:10.1016/S0016-7037(02)01075-X
Duan, L., Song, J., Liang, X., Yin, M., Yuan, H., Li, X., et al. (2019). Dynamics and Diagenesis of Trace Metals in Sediments of the Changjiang Estuary. Sci. Total Environ. 675, 247–259. doi:10.1016/j.scitotenv.2019.04.190
Guo, J., Yuan, H., Song, J., Li, X., Duan, L., Li, N., et al. (2021). Evaluation of Sedimentary Organic Carbon Reactivity and Burial in the Eastern China Marginal Seas. J. Geophys. Res. Oceans 126. doi:10.1029/2021JC017207
Huang, S. (1999). Calculation of Grain Size Distribution Parameters of Sediments by Microsoft Excel. J. Chengdu U. Techno. 26, 195–198.
Jokinen, S. A., Koho, K., Virtasalo, J. J., and Jilbert, T. (2020). Depth and Intensity of the Sulfate-Methane Transition Zone Control Sedimentary Molybdenum and Uranium Sequestration in a Eutrophic Low-Salinity Setting. Appl. Geochem. 122, 104767. doi:10.1016/j.apgeochem.2020.104767
Keeling, R. F., Körtzinger, A., and Gruber, N. (2010). Ocean Deoxygenation in a Warming World. Annu. Rev. Mar. Sci. 2, 199–229. doi:10.1146/annurev.marine.010908.163855
Liu, H., Wang, Y., An, B., Qian, J., and Qiu, C. (2021). Study on the Variation Trend and Influencing Factors of Summer Hypoxia off the Yangtze River Estuary. Mar. Environ. Sci. 40, 341–351. doi:10.13634/j.cnki.mes.2021.03.003
Monien, P., Lettmann, K. A., Monien, D., Asendorf, S., Wölfl, A.-C., Lim, C. H., et al. (2014). Redox Conditions and Trace Metal Cycling in Coastal Sediments from the Maritime Antarctic. Geochimica et Cosmochimica Acta 141, 26–44. doi:10.1016/j.gca.2014.06.003
Morford, J. L., and Emerson, S. (1999). The Geochemistry of Redox Sensitive Trace Metals in Sediments. Geochimica et Cosmochimica Acta 63, 1735–1750. doi:10.1016/S0016-7037(99)00126-X
Morford, J. L., Martin, W. R., François, R., and Carney, C. M. (2009). A Model for Uranium, Rhenium, and Molybdenum Diagenesis in marine Sediments Based on Results from Coastal Locations. Geochimica et Cosmochimica Acta 73, 2938–2960. doi:10.1016/j.gca.2009.02.029
Oschlies, A., Brandt, P., Stramma, L., and Schmidtko, S. (2018). Drivers and Mechanisms of Ocean Deoxygenation. Nat. Geosci 11, 467–473. doi:10.1038/s41561-018-0152-2
Ren, F., Fan, D., Wu, Y., and Zhao, Q. (2019). The Evolution of Hypoxia off the Changjiang Estuary in the Last 3000 years: Evidence from Benthic Foraminifera and Elemental Geochemistry. Mar. Geology. 417, 106039. doi:10.1016/j.margeo.2019.106039
Russell, A. D., and Morford, J. L. (2001). The Behavior of Redox-Sensitive Metals across a Laminated-Massive-Laminated Transition in Saanich Inlet, British Columbia. Mar. Geology. 174, 341–354. doi:10.1016/S0025-3227(00)00159-6
Schmidtko, S., Stramma, L., and Visbeck, M. (2017). Decline in Global Oceanic Oxygen Content during the Past Five Decades. Nature 542, 335–339. doi:10.1038/nature21399
Smrzka, D., Zwicker, J., Bach, W., Feng, D., Himmler, T., Chen, D., et al. (2019). The Behavior of Trace Elements in Seawater, Sedimentary Pore Water, and Their Incorporation into Carbonate Minerals: a Review. Facies 65, 1–47. doi:10.1007/s10347-019-0581-4
Sun, X., Song, J., Yu, Y., Sun, L., and Liu, Y. (2020). Optimum Conditions for the Determination of 10 Main Elements in marine Sediments by the Fused Bead-X-ray Fluorescence Spectrometry. Mar. Environ. Sci. 39, 902–908. doi:10.13634/j.cnki.mes.2020.06.013
Tang, D., Shi, X., Zhao, X., Wang, X., and Song, G. (2015). Mo-U Covariation as an Important Proxy for Sedimentary Environment Redox Conditions-Progress, Problems and Prospects. Geoscience 29, 1–13.
Taylor, S. R., and McLennan, S. M. (1985). The Continental Crust: Its Composition and Evolution. Oxford: Black Well Scientific Publications.
Tribovillard, N., Algeo, T. J., Baudin, F., and Riboulleau, A. (2012). Analysis of marine Environmental Conditions Based Onmolybdenum-Uranium Covariation-Applications to Mesozoic Paleoceanography. Chem. Geology. 324-325, 46–58. doi:10.1016/j.chemgeo.2011.09.009
Wang, B. (2009). Hydromorphological Mechanisms Leading to Hypoxia off the Changjiang Estuary. Mar. Environ. Res. 67, 53–58. doi:10.1016/j.marenvres.2008.11.001
Wang, B., Wei, Q., Chen, J., and Xie, L. (2012). Annual Cycle of Hypoxia off the Changjiang (Yangtze River) Estuary. Mar. Environ. Res. 77, 1–5. doi:10.1016/j.marenvres.2011.12.007
Wang, H., Dai, M., Liu, J., Kao, S.-J., Zhang, C., Cai, W.-J., et al. (2016). Eutrophication-driven Hypoxia in the East China Sea off the Changjiang Estuary. Environ. Sci. Technol. 50, 2255–2263. doi:10.1021/acs.est.5b06211
Watson, A. J. (2016). Oceans on the Edge of Anoxia. Science 354, 1529–1530. doi:10.1126/science.aaj2321
Wei, Q., Yu, Z., Xia, C., Zang, J., Ran, X., and Zhang, X. (2011). A Preliminary Analysis on the Dynamic Characteristics of the Hypoxic Zone Adjacent to the Changjiang Estuary in Summer. Haiyang Xuebao 33, 100–109.
Wu, Y., Fan, D., Wang, D., and Yin, P. (2020). Increasing Hypoxia in the Changjiang Estuary during the Last Three Decades Deciphered from Sedimentary Redox-Sensitive Elements. Mar. Geology. 419, 106044. doi:10.1016/j.margeo.2019.106044
Xie, X. (2019). Redox Sensitive Elements (RSE) in One Sediment Core as the Environmental Change Indicators in Seasonal Hypoxic Waters of the Inner continental Shelf of the East China Sea. China: University of Chinese Academy of Sciences.
Xie, X., Yuan, H., Song, J., Duan, L., Liang, X., Wang, Q., et al. (2020). Response of Redox Sensitive Elements to Changes of Sedimentary Environment in Core Sediments of Seasonal Low-Oxygen Zone in East China Sea. Haiyang Xuebao 42, 30–43. doi:10.3969/j.issn.0253−4193.2020.02.004
Xie, X., Yuan, H., Song, J., Li, N., Li, X., Duan, L., et al. (2019). Indication of Redox Sensitive Elements in marine Sediments on Anoxic Condition of Water Environment. Geol. Rev. 65, 153–170. doi:10.16509/j.georeview.2019.03.013
Xu, S., Zhai, S., Zhang, A., Zhang, H., and Lu, H. (2007). Redox Environment Effect on the Redox-Sensitive Elements in Surface Sediments from the Yangtze Estuary Hypoxia Zone. Mar. Geol. Quat. Geol. 27, 1–8. doi:10.16562/j.cnki.0256-1492.2007.03.001
Yin, M., Duan, L., Song, J., and Zhang, N. (2020). Bacteriohopanepolyols and its Response to Hypoxic Environment in Surface Sediments of the Yangtze Estuary and its Adjacent Areas. Environ. Sci. 42, 1343–1353. doi:10.13227/j.hjkx.202007244
Yu, Y. (2013). Sedimentary Geochemical Records of Environmental Changes in the Changiiang Estuary and its Adjacent Waters for the Past century. China: University of Chinese Academy of Sciences.
Zhang, M., Guo, W., Shen, J., Liu, K., Zhou, L., Feng, Q., et al. (2017). New Progress on Geochemical Indicators of Ancient Oceanic Redox Condition. Bull. Geol. Sci. Techno. 36, 95–106. doi:10.19509/j.cnki.dzkq.2017.0412
Zhang, W., Wu, H., Hetland, R. D., and Zhu, Z. (2019). On Mechanisms Controlling the Seasonal Hypoxia Hot Spots off the Changjiang River Estuary. J. Geophys. Res. Oceans 124, 8683–8700. doi:10.1029/2019JC015322
Zhang, X., Zhai, S., Xu, S., Zhang, A., and Lu, H. (2005). The “Grain Size Effect” of Redox Sensitive Elements in the Sediments in the Hypoxia Zone of the Changjiang Estuary. Peri. Ocean U. China 35, 868–874. doi:10.16441/j.cnki.hdxb.2005.05.034
Keywords: Mo-U covariation system, redox-sensitive trace elements, marine hypoxia, environment indication, Changjiang Estuary
Citation: Zhang X, Yuan H, Song J and Duan L (2022) Response and Potential Indication to Hypoxia in the Changjiang River Estuary and its Adjacent Waters: Insight From Redox-Sensitive Trace Elements in Sediment Core. Front. Earth Sci. 10:861977. doi: 10.3389/feart.2022.861977
Received: 25 January 2022; Accepted: 25 March 2022;
Published: 25 April 2022.
Edited by:
Daidu Fan, Tongji University, ChinaReviewed by:
Tom Jilbert, University of Helsinki, FinlandCopyright © 2022 Zhang, Yuan, Song and Duan. This is an open-access article distributed under the terms of the Creative Commons Attribution License (CC BY). The use, distribution or reproduction in other forums is permitted, provided the original author(s) and the copyright owner(s) are credited and that the original publication in this journal is cited, in accordance with accepted academic practice. No use, distribution or reproduction is permitted which does not comply with these terms.
*Correspondence: Huamao Yuan, eXVhbmh1YW1hb0BxZGlvLmFjLmNu
Disclaimer: All claims expressed in this article are solely those of the authors and do not necessarily represent those of their affiliated organizations, or those of the publisher, the editors and the reviewers. Any product that may be evaluated in this article or claim that may be made by its manufacturer is not guaranteed or endorsed by the publisher.
Research integrity at Frontiers
Learn more about the work of our research integrity team to safeguard the quality of each article we publish.