
95% of researchers rate our articles as excellent or good
Learn more about the work of our research integrity team to safeguard the quality of each article we publish.
Find out more
ORIGINAL RESEARCH article
Front. Earth Sci. , 14 April 2022
Sec. Solid Earth Geophysics
Volume 10 - 2022 | https://doi.org/10.3389/feart.2022.861240
This article is part of the Research Topic Subduction and Collision Dynamics of Tectonic Plates View all 15 articles
 Liangliang Wang1,2
 Liming Dai1,2*Wei Gong1,2
 Sanzhong Li1,2Xiaodian Jiang1,2Hao Dong1,2Di Wang1,2Fakun Li1,2
 Shengyao Yu1,2
A specific configuration of the global subduction system is the parallel triple subduction. The widely accepted example of parallel triple subduction is the New Guinea region, including a northward dip at the New Britain Trench (NBT), a southward dip at the Trobriand Trough (TT), and North Solomon Trench (NST). Questions regarding the parallel triple subduction system remain largely unexplored in terms of factors controlling its initiation, duration, and dynamics. Here, we used two-dimensional numerical models to study the dynamics mechanism of the parallel triple subduction system in the New Guinea region. Four possible regimes were achieved: 1) the double subduction model, which includes the forward subduction jumping model (FSJ) and the subduction polarity reversal model (SPR) and 2) the parallel triple subduction model, which includes the tendency to the forward jumping model (TFSJ) and the tendency to polarity reversal (TSPR). By evaluating the four regimes with actual seismic data, we suggest that the pre-existing rupture and length of ocean–continent transition (OCT) determine the formation of the TT, while the formation of the NBT may be the result of the rheological strength differences between the Solomon Island Arc (SIA) and Solomon Sea Basin (SSB); the initial length of the SSB can regulate the competitive relationship between the TT and NBT, which also determines the present-day inactive state of the TT. A longer SSB makes the TT and NBT initiated independently, while a narrower SSB will allow interaction during subduction initiation of the TT and NBT.
It is well established that the multi-subduction system is an important component of modern plate tectonics (Holt et al., 2017; Stern and Gerya, 2018; Chesley et al., 2021; Lallemand and Arcay, 2021; Zhang and Leng, 2021; Fu et al., 2022). The multi-subduction system is a complex process, including subduction initiation (SI), interactions, and dynamics of multi-subduction zones. Previous studies have focused on only two subduction systems and rarely considered more subduction zones, such as the parallel triple subduction system (Mishin et al., 2008; Jagoutz et al., 2015; Huangfu et al., 2016; Holt et al., 2017; Zhang et al., 2017; Liao et al., 2018; Yang et al., 2018; Li et al., 2019; Lyu et al., 2019; Tao et al., 2020; Zhong and Li, 2020; Zhang and Leng, 2021). The parallel triple subduction system consists of three subduction zones that exist simultaneously, unlike the triple junction where three tectonic plates meet (Li et al., 2018). The parallel triple subduction system is a common process during the evolution of Earth, which is characteristic for both modern and ancient subduction collision zones, for example, in the Himalayan collision zone (Huangfu et al., 2018), the Central Asian Orogenic belt (Xiao et al., 2020), the active Izu–Bonin–Marianas and Ryukyu arcs (e.g. Faccenna et al., 2018), and the New Guinea region (Baldwin et al., 2012; Yang et al., 2021).
One of the modern examples is the New Britain Trench (NBT) and Trobriand Trough (TT) that resulted from the convergence of the Ontong–Java Plateau (OJP) and Solomon Island Arc (SIA) along the North Solomon Trench (NST) (Holm et al., 2016; Mann and Taira, 2004; Petterson et al., 1999; Stern, 2004; Tapster et al., 2014). The initial arrival of the OJP at the NST was at ∼22 Ma (Early Miocene) (Petterson et al., 1999). Then, the TT, as a zone of conflicting subduction, is expected to have been active between ca. 20 and 10 Ma, developing the Maramuni Arc on Papua New Guinea (Hall, 2002; Baldwin et al., 2012), whereas the NBT has been proposed to fall between 14 and 8 Ma (Petterson et al., 1999; Hall, 2002; Mann and Taira, 2004; Schellart et al., 2006; Austermann et al., 2011). The available geophysical data and topography suggest that subduction at the TT is currently inactive (Abers et al., 2002; Riisager et al., 2003; Wallace et al., 2004; Holm et al., 2019), whereas the subduction in the NBT is currently active (Figure 1B). Previous conceptual schemes and dynamical studies have emphasized the subduction polarity reversal, that is, the NBT maybe the result of the convergence of the OJP and SIA, rarely considered the SI of the TT and the interactions between the TT and NBT (Mishin et al., 2008; Baldwin et al., 2012; Dai et al., 2018; Brandl et al., 2020; Sun et al., 2021; Zhang and Leng, 2021; Almeida et al., 2022). Thus, the formation sequence, interactions, and dynamics of the parallel triple subduction in the New Guinea region remain elusive.
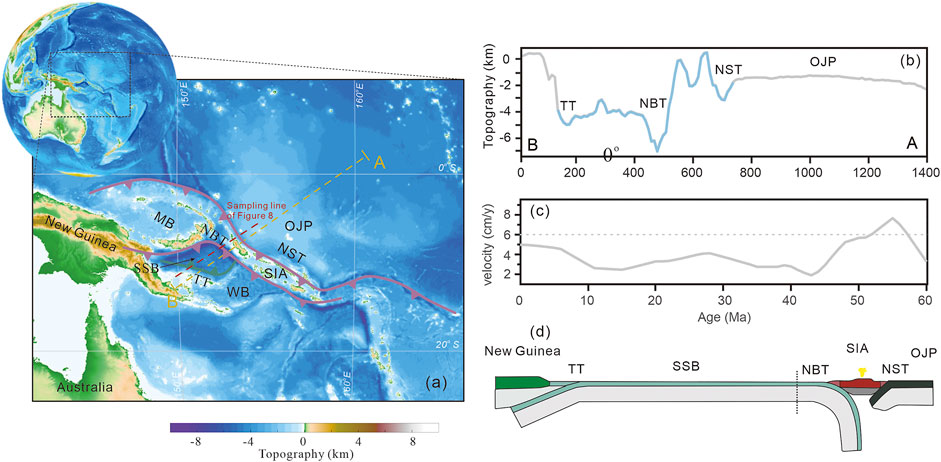
FIGURE 1. Map of the Papua New Guinea region. (A) Map of the New Guinea region modified from ETOPO1. The purple line represents active or potentially active subduction zones and the green line represents dead subduction zones. (B) Topographic profile from ETOPO1. The sampling points are shown by orange lines in Figure.1a. (C) Convergence rate from Müller et al., 2019. (D) Conceptual schemes from Baldwin et al., 2012. NBT: the New Britain Trench; TT: Trobriand Trough; NST: North Solomon Trench. MB: Manus Basin; OJP: Ontong–Java Plateau; SIA: Solomon Island Arc; WB: Woodlark Basin.
In this article, we study the dynamics and stability of parallel triple subduction systems. For this purpose, we use a series of coupled thermomechanical numerical models based on finite differences and marker-in-cell techniques. These models reveal unknown processes of the oceanic plateau convergence to induce multiple subduction systems, thus providing an explanation for enigmatic geodynamic features that may have ancient multiple subduction characteristics.
Our two-dimensional magmatic thermodynamic model simulated collision between the OJP and SIA, which led to the initiation of subduction in the back-arc basin. The governing equations of momentum, mass, and energy conservation are solved with the I2VIS code (Gerya and Yuen, 2003). This code is based on conservative finite differences and a non-diffusive marker-in-cell technique applied on a staggered non-uniform Eulerian grid. The 4,000 km × 670 km numerical model domain is resolved with non-uniform 699 × 134 rectangular grids with the highest grid resolution of 2 km in the 1,500-km-wide and 200-km-thick subduction area of the model. We track the material properties in the different compositional layers by deploying ∼7 million active Lagrangian markers. Complete details of the method are provided in a previous study (Gerya and Yuen, 2003).
The momentum conservation equation, incompressible continuity equation, and heat conservation equation are defined as follows:
(1) Stokes equation:
where σ′ij is the deviatoric stress tensor, g is the acceleration due to gravity, and density ρ depends on composition (C), melt fraction (M), pressure (P), and temperature (T).
(2) Conservation of mass is approximated by the incompressible continuity equation:
where Vi is the velocity vector.
(3) The heat conservation equations are
where DT/Dt is the full derivative of temperature with respect to time, Cp is the heat capacity, qi is the heat flux, H represents the sum of individual heat sources (e.g. radioactive heat production, shear heating, adiabatic heating, and latent heat), and k is the thermal conductivity, which itself is a function of temperature, pressure, and composition.
The numerical model contains partial melting calculations for multiple rock types and relies on the empirically defined linear relationship between the volume ratio and temperature of partial melting as follows:
where
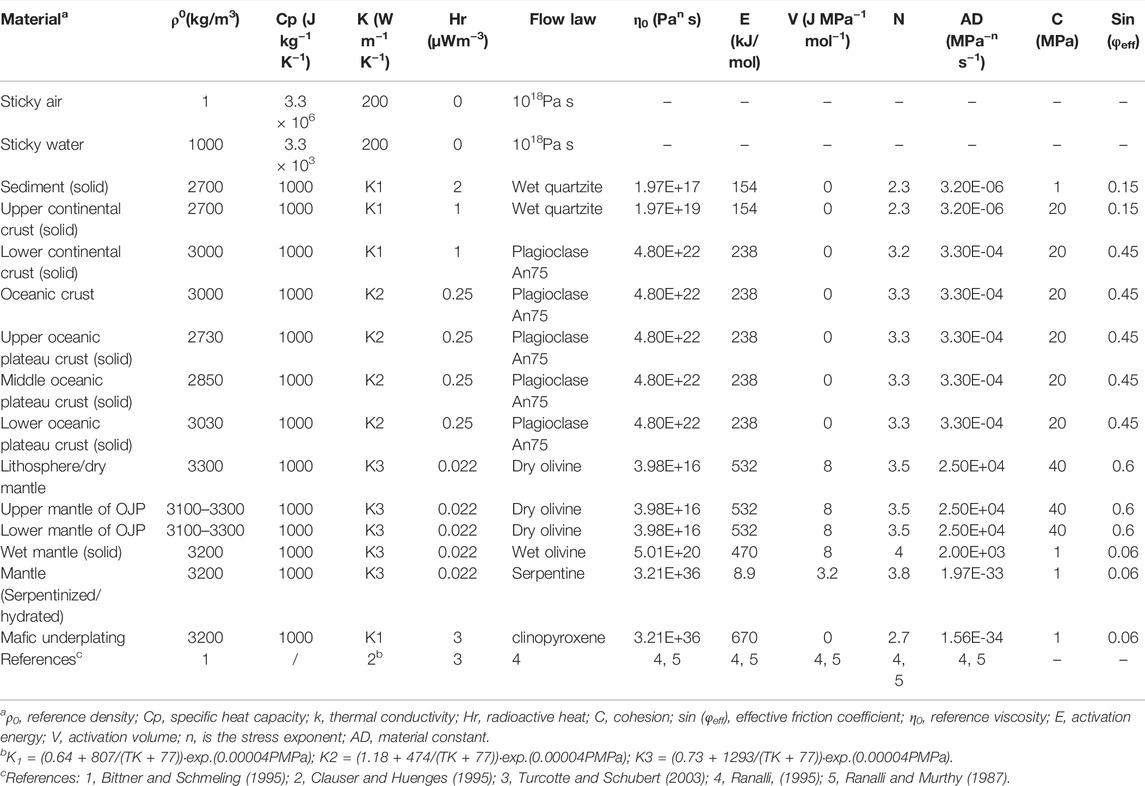
TABLE 1. Physical parameters in the model.
The rock density is dependent on the composition, melt fraction, temperature, and pressure. For partially molten rocks, the effective density obeys the following equations of state:
where
The rheology used in this study is viscoplastic. The creep flow is defined by the following equation:
where
Plastic failure is approximated with the Drucker–Prager yield relationship (Ranalli, 1995):
where
The topography changes because of erosion and sedimentation, which is defined as:
where
We conducted a series of numerical experiments with various island-arc crust thicknesses, back-arc basin length, and the ocean–continent transition (OCT) length and pre-existing lithospheric weakness in the OCT (Figure 2).
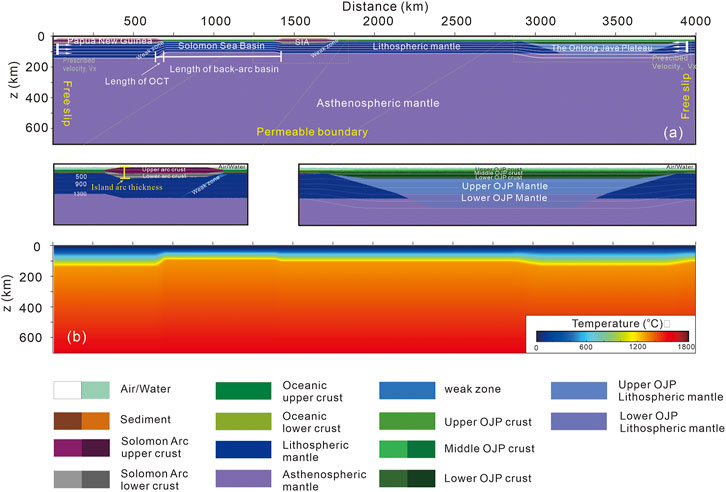
FIGURE 2. Initial model configuration and boundary conditions. Panel (A) shows initial model configuration. Panel (B) shows the temperature field. The left inset represents a zoomed-in image of the island arc. The right inset represents anenlargement of the OJP. The isotherms (white lines) start at 100°C and are plotted at intervals of 400°C. The color key for different materials is shown at the bottom.
The numerical models include two domains – the left-side continent with an arc/back-arc and the right-side oceanic plate with oceanic plateau. The transition between these two domains is demarcated by a weak zone.
The plateau is 1,120 km wide and has a 26.6-km-thick oceanic crust underlain by a depleted lithospheric mantle. The oceanic plate on which the OJP resides has a normal oceanic plate thickness of 8 km (Figure 2). Based on seismic wave speed data, we infer that the OJP crust is divided into three layers. The oceanic plateau crust is 26.6 km thick and consists of an upper crust (a 2.66-km-thick layer of basaltic rock), a middle crust (a 5.3-km-thick layer of gabbro), and an 18.64-km-thick layer of ductile ultramafic rock (Figure 2). Moreover, more recent data suggest that the OJP has a thick viscous mantle root (Tharimena et al., 2016; Isse et al., 2021). Seismic and geochemical constraints reveal that the lithospheric mantle beneath the plateau may also be stratified into two layers comprising a typical oceanic lithosphere (with a thickness of 44 km) underlain by a layer that includes a component of recycled Proterozoic lithosphere (with a thickness of 44 km) (Ishikawa et al., 2004, 2011; Mann and Taira, 2004; Covellone et al., 2015; Tharimena et al., 2016; Wang et al., 2017; Wang and Kusky, 2019; Isse et al., 2021). We determined the density of the plateau and the density of each layer from the P-wave velocity structure and then further constrained the correctness of the model using Crust1.0.
Previous studies suggested that the SIA is an island arc with continental crust affinity (Tapster et al., 2014). As such, in our model, we define the SIA with continental crust properties. The arc comprises two layers: the felsic upper crust, with wet quartzite rheological properties, and the mafic lower crust which has the rheological properties of plagioclase. According to the Crust1.0 model, our model arc’s crustal thickness is asymmetric. The left part has a thickness of 38 km, and the right part varies in the range of 38–42 km (Supplementary Table S1).
The initial thermal structure of the back-arc is defined by the plate cooling model with a plate depth of 88 km (Shi et al., 2020). The initial cooling age of the oceanic lithosphere is taken to be 30 Myr, which is similar to a previous numerical modeling study that investigated variations in oceanic–continental and intraoceanic subduction modes (Zhou et al., 2018, 2020; Li et al., 2019; Dai et al., 2020; Tao et al., 2020). The length of the back-arc basin is 650 km, 700 km, and 750 km based on plate reconstruction results (Müller et al., 2019).
The length of the OCT is 20, 30, 40, and 50 km. The OCT was either stable or with an initial 50-km-length weak zone which was probably due to large fractures based on previous speculation (Marwen et al., 2015). The continental domain comprises a 6-km-thick sedimentary layer, a 14-km-thick upper crust, a 15-km-thick lower crust, and an 85-km-thick lithospheric mantle. A thin “sticky air” layer with low density and viscosity was also applied (Crameri et al., 2012), which allowed the direct calculation of topography evolution. An asthenospheric mantle was imposed below the continental and oceanic lithosphere.
The initial temperature structure of the model varied from 0°C at the surface to 1300°C at the bottom of the lithospheric mantle (Shi et al., 2020). The initial temperature gradient of the asthenospheric mantle is ∼0.5°C/km (Shi et al., 2020). The detailed compositions and temperature profile of our model are shown in Figure 2. The rock properties and layer thicknesses vary depending on the model parameters (Table 1).
We applied free-slip boundary conditions at all boundaries except for the lower boundary that is permeable (Li et al., 2016). Subduction is prescribed by the total convergence rate RT = RR + RL, where RR and RL are locally imposed constant velocities for the right and the left plates, respectively (Figure 1C). Thus, the total convergence rate is controlled and not the rates of individual slabs driven by slab-pull. In this series model, the initial right plate velocity is 3 cm/yr until the thick, buoyant oceanic plateau just reaches the trench. Based on previous plate reconstruction results (Müller et al., 2019), once the plateau reaches the trench, we linearly decrease the left plate velocity to 3 cm/yr, although in nature, the subduction rate is controlled by the subduction dynamics itself.
We have run 54 model cases in total (Supplementary Table S1) to study the effects of the initial island-arc crust thickness, the length of the back-arc basin and the OCT, and pre-existing lithospheric weakness in the OCT (Figure 2A), on the evolution of parallel triple subduction systems. The numerical results are summarized as two contrasting models (Figure 3): 1) the double subduction model, which includes the forward subduction jumping model (FSJ) and the subduction polarity reversal model (SPR); 2) the parallel triple subduction model, which includes the tendency to the forward jumping model (TFSJ) and the tendency to polarity reversal (TSPR).
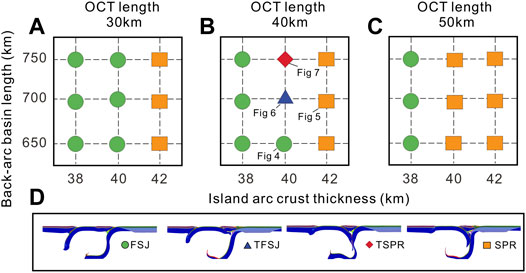
FIGURE 3. Summary of model results. Panel (A–C) shows the model results with different OCT length. Green circles correspond to numerical modeling results of the forward subduction jumping model (FSJ); orange squares represent the subduction polarity reversal model (SPR); the red diamonds correspond to numerical model results that the parallel triple subduction model tends to polarity reversal (TSPR); and dark blue triangles represent that the parallel triple subduction model tends to the jumping model (TFSJ). Panel (D) shows the four different types of model results.
The model results showed that the pre-existing lithospheric weakness and length of the OCT are fundamental for the SI in the OCT (Supplementary Table S1; Figure 3). If the length of the OCT is 40 km, the results with the pre-existing lithospheric weakness in the OCT region showed that all four modes can be predicted (Figure 3B). Otherwise, there will only be one mode: subduction polarity reversal, if there are no pre-existing weaknesses (Supplementary Table S1). To further study the length of OCT importance, additional models with a narrower and longer OCT (i.e., 30 and 50 km) were used. The results indicate that a narrow OCT favors the SI in the OCT, differing from models with a 40-km-length OCT, while the longer OCT prevents the formation (Supplementary Table S1).
In addition, the island-arc crust thickness and length of the back-arc basin have a contribution to the results as well (Figure 3). The model results show that when the island-arc thickness becomes thick and the subduction mode changes from the FSJ modes to the SPR modes (Figure 3A). In addition, the model results with the same arc thickness of 40 km showed that when the length of the back-arc basin increases, the subduction mode changes from an FSJ mode to a TFSJ mode and eventually, a TSPR mode (Figure 3B). The model results indicated that the increase in the length of the back-arc basin and the island-arc crust thickness favors the SPR (Figure 3A) and prevents the SI in the OCT (Figure 3).
Model 1 represents a typical example of forward subduction jumping model (Figure 4). The length of the OCT and back-arc basin and the initial thickness of the arc crust were set to 40, 650, and 40 km, respectively.
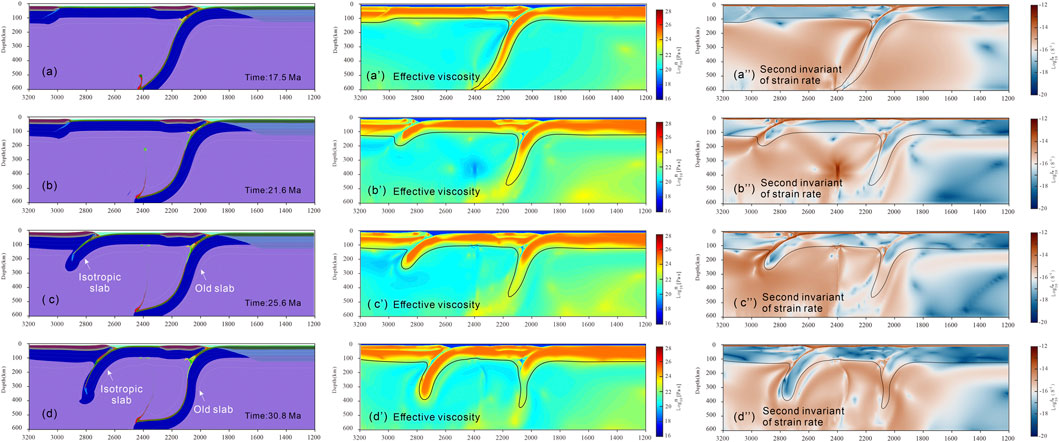
FIGURE 4. Evolutionary process of Model 1. Panels (A–D), (a’-d’), and (a’‘-d’‘) show rock composition, effective viscosity, and second invariant of the strain rate at different time steps, that is, 17.6, 21.6, 25.6, and 30.8 Ma, respectively. The color bars of viscosity and strain rate are shown on the left, while the color bar of composition is shown in Figure 2.
At the computational time of 17.5 Myr (Figure 4A), the oceanic plateau reached the subduction zone. At 21.6 Myr, the old subduction zone was blocked (Figure 4B). Subsequently, the OCT region begins to rupture accompanied by a high strain rate concentration under continuous compression (Figure 4B). After about 4 million years (Myr), under the dual effect of the continuous compression of the continental plate and obstruction of the oceanic plateau, the parallel subduction zone developed at the OCT (Figure 4C). After 30.8 Myr, the old subduction zone tends to break off while the newly formed subduction zone subducts to 400 km (Figure 4D). Thus, this model is typically characterized by the formation of forward double subduction zones and no subduction polarity reversal.
Model 2 represents a typical example of subduction zone polarity reversal modes (Figure 5). The length of the OCT and back-arc basin and the initial thickness of the arc crust were set to 40, 700, and 42 km, respectively.
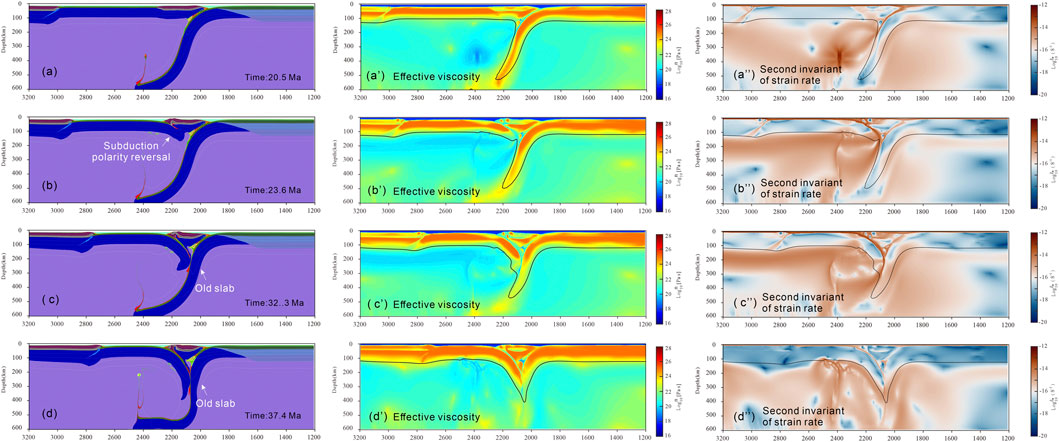
FIGURE 5. Evolutionary process of Model 2. Panels (A–D), (a’-d’), and (a’‘-d’‘) show rock composition, effective viscosity, and second invariant of the strain rate at different time steps, that is, 20.5, 23.6, 32.3 and 37.4 Ma, respectively. The color bars of viscosity and strain rate are shown on the left, while the color bar of composition is shown in Figure 2.
In this model, the SI occurred at the island-arc and back-arc basin transitional region (IBT) which was different from the isotropic subduction model (Figure 5). With continuous compression, the IBT and OCT regions were accompanied by a high strain rate concentration (Figure 5A). At 23.6 Myr (Figure 5B), the IBT region begins to rupture, and the SPR begins when the oceanic plateau just reached the trench, while the concentrated strain rate in the OCT region was not sufficient to cause lithospheric rupture. With the ongoing plate convergence, the new subduction slab collided with the old subduction slab and then resulted in the slab detachment of the old slab (Figure 5C,D). Thus, this model is typically characterized by the formation of subduction polarity reversal and no double isotropic subduction zones.
Model 3 represents a typical example of a parallel triple subduction model with a preference for isotropic jumping modes (Figure 6), which has the same parameters as Model 1 except that the length of the back-arc basin increases to 700 km.
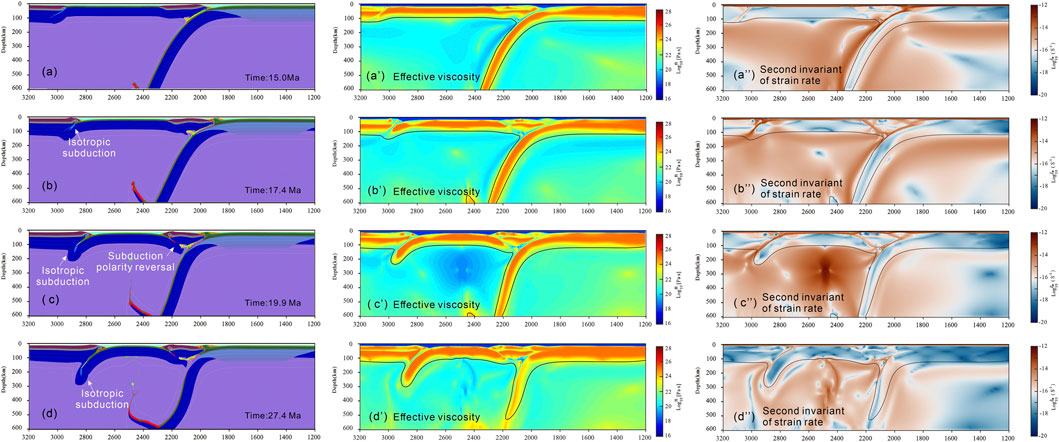
FIGURE 6. Evolutionary process of Model 3. Panels (A–D), (a’-d’), and (a’‘-d’‘) show rock composition, effective viscosity, and second invariant of the strain rate at different time steps, that is, 15.0, 17.4, 19.9 and 27.4 Ma, respectively. The color bars of viscosity and strain rate are shown on the left, while the color bar of composition is shown in Figure 2.
Similar to Model 1, the oceanic plate in Model 3 continuously subducted due to the right push force until the oceanic plateau reached the subduction zone. Similarly, with continuous compression, the OCT region begins to rupture, accompanied by a high strain rate concentration (Figure 4B). In addition, the isotropic subduction zone occurred at the OCT (Figure 6B). Unlike Model 1, the thickened island arc increased the rheological strength difference between the island-arc and the back-arc basin, making the SPR more easily occurring (Wang et al., 2022). Thus, at 17.4 to –19.9 Myr, the SPR occurred in the interaction region between the island-arc and the back-arc basin. However, the SPR was short-lived and maintained for about 3 Ma, resulting from the continuous subduction of the isotropic subduction zone. Thus, this model is typically characterized by the formation of parallel triple subduction, but more inclined to the subduction jumping.
Model 4 represents a typical example of a parallel triple subduction model with a preference for polarity reversal modes (Figure 7), which has the same parameters as Model 3 except that the length of the back-arc basin increases to 750 km.
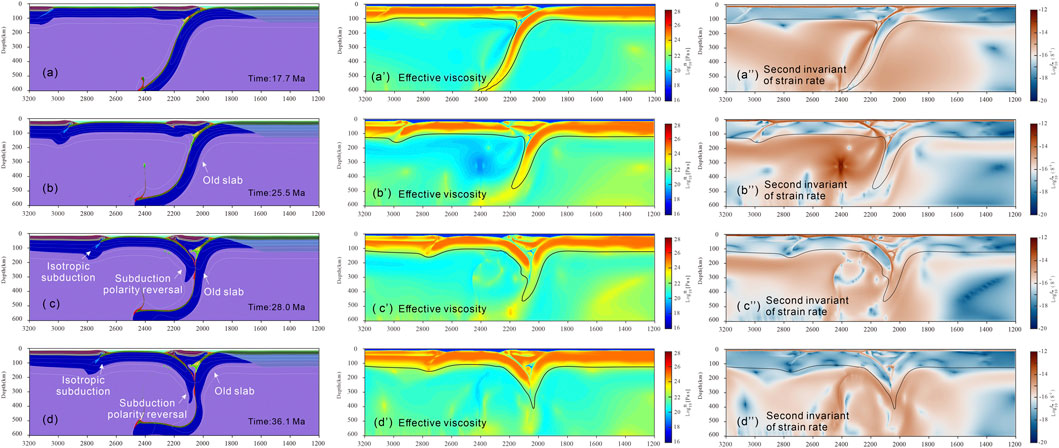
FIGURE 7. Evolutionary process of Model4. Panels (A–D), (a’-d’), and (a’‘-d’‘) show rock composition, effective viscosity, and second invariant of strain rate at different time steps, that is, 17.7, 25.5, 28.0 and 36.1 Ma, respectively . The color bars of viscosity and strain rate are shown on the left, while the color bar of composition is shown in Figure 2.
Similar to Model 3, with continuous compression, the OCT region begins to rupture, accompanied by a high strain rate concentration (Figure 4B). The isotropic subduction zone occurred at the OCT and subducted to about 200 km (Figure 6B). The SPR occurred in the interaction region between the island-arc and the back-arc basin. Contrary to Model 3, the isotropic subduction zone was short-lived, resulting from the continuous subduction of the reversal subduction. In addition, similar to case Model 2, with the ongoing plate convergence, the SPR slab collided with the old subduction slab and then resulted in the slab detachment of the old slab (Figure 7C,D). Thus, this model is typically characterized by the formation of parallel triple subductions, but more inclined to the SPR, which may fit best with the parallel triple subduction system in the New Guinea region (Figure 1D).
The modeling results presented previously give new insights into the mechanisms of a parallel triple subduction system and support the interpretation of similar natural cases, such as the New Guinea region (Figure 1). Some studies have argued for three dipping subduction zones (Figure 8): north-dipping at the NBT and south-dipping at the TT and NST (Baldwin et al., 2012; Holm et al., 2019). The seismicity at the TT lacks an organized (shallow-to-deep) pattern indicative of southward subduction, and the seismic reflection images show weakly deformed sediments (Holm et al., 2016). Overall, the available geophysical data suggest that subduction in the TT is currently inactive with subduction depth being less than 200 km (Holm et al., 2019), while the subduction in the NBT is currently more seismically active (Figure 8).
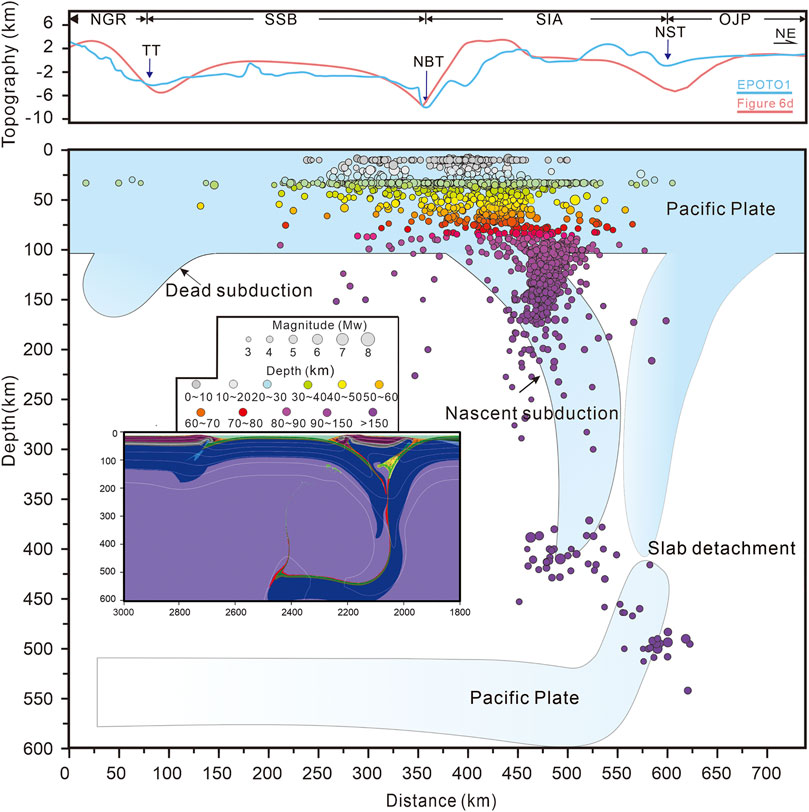
FIGURE 8. Model results versus natural data. The topographic data in the abovementioned figure are from ETOPO1, and the seismic data in the lower figure are from Geomap (http://www.geomapapp.org). The sampling line is shown by red lines in Figure 1A.
However, previous models have discussed the SI in the TT and NBT separately and have not linked the formation of both (Marwen et al., 2015; Wang et al., 2022). The complex processes involving the onset and death of parallel triple subduction zones in the New Guinea region are resolved in our numerical model. Although Models 3 and 4 also showed the onset and death of parallel triple subduction zones, the morphology in Model 3 is not consistent with present-day seismic data, which are more active in the isotropic subduction. Model 4 fits best with the parallel triple subduction systems in the New Guinea region, including subduction depth and subduction pattern (Figure 8). In addition, the topography profile of Model 4 can well match the present-day topography profile (Figure 8).
The initial island-arc crust thicknesses, length of the back-arc basin and OCT, and pre-existing lithospheric weakness in the OCT are the key driving factors for the parallel triple subduction system. The effects of the four main controlling factors are investigated in our study (Figure 3).
Our models suggested that the weaker zones in the OCT region have provided conditions for the rupture of the continental lithosphere and propagate to form a new subduction zone along the weak zones. In addition, the narrow OCT further weakened the rheological properties of the OCT region, making the subduction in the TT more likely to occur. Our results are consistent with those of previous studies suggesting a larger fracture in the TT region (Marwen et al., 2015), which may correspond to the pre-existing lithospheric weakness in the OCT of our models.
In addition, the formation of the NBT is controlled by the rheological strength difference between the SIA and SSB (Wang et al., 2022). The increase in the thickness of the island arc can effectively increase the rheological strength difference between the island-arc and the back-arc basin, which also causes the SPR to occur more easily (Wang et al., 2022).
The length of the OCT is also an important factor for mode selection. The length of the back-arc basin does not determine the onset of the subduction in the TT and NBT, but it can regulate the competitive relationship between the two subduction zones. Assuming that the SSB is narrow, the models showed that the subduction in the TT and NBT form a strong competitive relationship under a convergence background. The formation of the TT and NBT depends on which one has a weaker rheological strength before the SI. In contrast, if the length of the back-arc basin increases, the subduction in the TT and NBT forms a weak competitive relationship, and the subductions in the TT and NBT are initiated relatively independently. Which one can form depends on whether other parameters satisfy the conditions for the SI, that is, the initial island-arc thicknesses, length of the OCT, and pre-existing lithospheric weakness in the OCT. If the conditions are satisfied on both the modes, the TT and NBT both can be formed. After the onset of subduction, the one which is more fully developed will remain active and the other one will be dead. If both subduction zones are fully developed, then an opposing subduction will be formed (Holt et al., 2017; Candioti et al., 2020).
Our numerical model results may also provide significant insight into the SI time of different subduction zones in the New Guinea subduction system. Although the present-day geological evidence has constrained the ages of the two subduction zones, the NBT (14–8 Ma) and the TT (20–10 Ma), to a certain range, there is no clear evidence for the sequence of the two subduction zones (Petterson et al., 1999; Hall, 2002; Mann and Taira, 2004; Schellart et al., 2006; Austermann et al., 2011; Baldwin et al., 2012; Holm et al., 2013). However, based on our numerical model, we propose that the NBT was formed later than the TT, and the TT began to be inactive about 3 Myr after the formation of the NBT.
Therefore, based on the latest reconstruction results (Müller et al., 2019), we suggest that the initial arrival of the OJP at the NST (NST) at ∼22 Ma (Early Miocene) was termed a “soft docking” event (Figure 9B). In addition, the TT, as a zone of conflicting subduction, occurred first (Figure 9C), which leads to the arc volcanic rocks of the Papua Peninsula (Baldwin et al., 2012; Holm et al., 2019; Faccenna et al., 2021). After about 3–4 Myr, the northward NBT begins to develop. At this stage, the region progresses from the FSJ model (Figure 4) to the TFSJ model (Figure 6), while the subduction zone in the TT still dominates (Figure 9). Subsequently, under continuous advancing subduction, the subduction in the NBT gradually becomes the main channel for convergent stress release, and the region evolves to the TSPR model (Figure 6; Figure 9D). Then, the new slab near the island arc interacts with the old Pacific slab to result in the slab detachment of the old Pacific slab (Figure 9E).
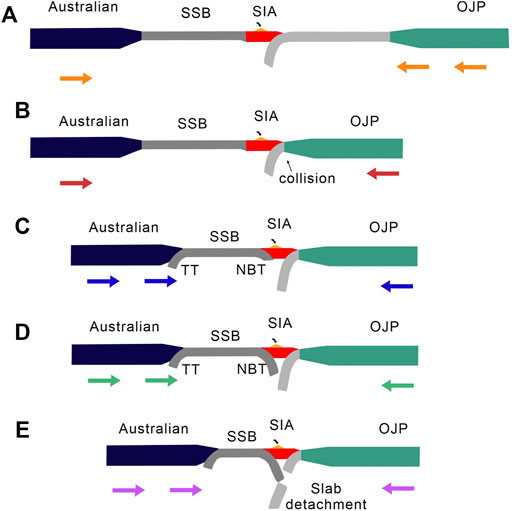
FIGURE 9. Schematic diagram for the evolution of the New Guinea region as a sequence of stages for important events. Panel (A–E) represent different stages of evolution. The arrows represent the direction of plate movement.
We constructed a series of 2D thermal-mechanical numerical models to investigate the patterns and key parameters controlling the parallel triple subduction system. The model results showed that the subduction patterns can be divided into four main types: 1) the double subduction model, which includes the forward subduction jumping model (FSJ) and the subduction polarity reversal model (SPR) and 2) the parallel triple subduction model, which includes the tendency to the forward jumping model (TFSJ) and the tendency to polarity reversal (TSPR).
Our model suggested that a pre-existing weak zone in the OCT is necessary for the formation of the parallel triple subduction system, which has provided conditions for the rupture of the lithosphere. In addition, a narrower OCT favors the SI in the OCT, while a thicker island arc favors the SI in the IBT. The length of the back-arc basin does not determine the onset of the subduction in the TT and NBT, but it can regulate the competitive relationship between the two subduction zones. In addition, the onset and death of parallel triple subduction zones observed in our model can successfully explain the geological observations of multiple subductions in the New Guinea region from 25 Ma to the present day.
We suggest that the pre-existing lithospheric weakness and length of the OCT in Papua New Guinea determine the formation of the TT, whereas the formation of the NBT is controlled by the rheological strength difference between the SIA and SSB; the initial length of the SSB can regulate the competitive relationship between the TT and NBT, which also determines the present-day inactive state of the TT. If the SSB is longer, the TT and NBT are initiated independently, while a narrower SSB will allows the interaction of the TT and NBT during the SI. In addition, we explain in detail the tectonic evolution of the parallel triple subduction system in the New Guinea region based on our results.
The raw data supporting the conclusions of this article will be made available by the authors, without undue reservation.
LW wrote the manuscript. LW and LD conceptualized the study, developed the methodology, and performed the numerical simulation and validation. WG conceptualized the study. SL and XJ acquired the funding and supervised the study. HD, DW, FL and SY performed the investigation, data curation, and validation.
The research leading to these results has received funds from NSFC projects (Grant Nos 91958214, 91855208, 91858215, 41402172, 41688103, 42121005, and 42176064), the National Key Technologies R&D Program (2017YFC0601401; 2017YFC0601300-01; 2016YFC0601002), Taishan Scholar Programs to Profs. SL (tspd20210305) and Yongjiang Liu (ts20190918) and Qingdao Leading innovation talents (19-3-2-19-zhc), and the Fundamental Research Funds for the Central Universities (202161011).
The authors declare that the research was conducted in the absence of any commercial or financial relationships that could be construed as a potential conflict of interest.
All claims expressed in this article are solely those of the authors and do not necessarily represent those of their affiliated organizations, or those of the publisher, the editors, and the reviewers. Any product that may be evaluated in this article, or claim that may be made by its manufacturer, is not guaranteed or endorsed by the publisher.
The Supplementary Material for this article can be found online at: https://www.frontiersin.org/articles/10.3389/feart.2022.861240/full#supplementary-material
Abers, G. A., Ferris, A., Craig, M., Davies, H., Lerner-Lam, A. L., Mutter, J. C., et al. (2002). Mantle Compensation of Active Metamorphic Core Complexes at Woodlark Rift in Papua New Guinea. Nature 418, 862–865. doi:10.1038/nature00990
Almeida, J., Riel, N., Rosas, F. M., Duarte, J. C., and Schellart, W. P. (2022). Polarity-reversal Subduction Zone Initiation Triggered by Buoyant Plateau Obstruction. Earth Planet. Sci. Lett. 577, 117195. doi:10.1016/J.EPSL.2021.117195
Austermann, J., Ben-Avraham, Z., Bird, P., Heidbach, O., Schubert, G., and Stock, J. M. (2011). Quantifying the Forces Needed for the Rapid Change of Pacific Plate Motion at 6Ma. Earth Planet. Sci. Lett. 307, 289–297. doi:10.1016/j.epsl.2011.04.043
Baldwin, S. L., Fitzgerald, P. G., and Webb, L. E. (2012). Tectonics of the New Guinea Region. Annu. Rev. Earth Planet. Sci. 40, 495–520. doi:10.1146/annurev-earth-040809-152540
Bittner, D., and Schmeling, H. (1995). Numerical Modelling of Melting Processes and Induced Diapirism in the Lower Crust. Geophys. J. Int. 123, 59–70.
Brandl, P. A., Hannington, M. D., Geersen, J., Petersen, S., and Gennerich, H.-H. (2020). The Submarine Tectono-Magmatic Framework of Cu-Au Endowment in the Tabar-To-Feni Island Chain, PNG. Ore Geology. Rev. 121, 103491. doi:10.1016/j.oregeorev.2020.103491
Candioti, L. G., Schmalholz, S. M., and Duretz, T. (2020). Impact of Upper Mantle Convection on Lithosphere Hyperextension and Subsequent Horizontally Forced Subduction Initiation. Solid Earth 11, 2327–2357. doi:10.5194/se-11-2327-2020
Chesley, C., Naif, S., Key, K., and Bassett, D. (2021). Fluid-rich Subducting Topography Generates Anomalous Forearc Porosity. Nature 595, 255–260. doi:10.1038/s41586-021-03619-8
Clauser, C., and Huenges, E. (1995). “Thermal conductivity of rocks and minerals,” in Rock physics and phase relationsEditors T. J. Ahrens (Washington, DC: American Geophysical Union), 105–126.
Covellone, B. M., Savage, B., and Shen, Y. (2015). Seismic Wave Speed Structure of the Ontong Java Plateau. Earth Planet. Sci. Lett. 420, 140–150. doi:10.1016/j.epsl.2015.03.033
Crameri, F., Schmeling, H., Golabek, G. J., Duretz, T., Orendt, R., Buiter, S. J. H., et al. (2012). A Comparison of Numerical Surface Topography Calculations in Geodynamic Modelling: an Evaluation of the 'sticky Air' Method. Geophys. J. Int. 189, 38–54. doi:10.1111/j.1365-246X.2012.05388.x
Dai, L., Li, S., Li, Z.-H., Somerville, I., Suo, Y., Liu, X., et al. (2018). Dynamics of Exhumation and Deformation of HP-UHP Orogens in Double Subduction-Collision Systems: Numerical Modeling and Implications for the Western Dabie Orogen. Earth-Science Rev. 182, 68–84. doi:10.1016/J.EARSCIREV.2018.05.005
Dai, L., Wang, L., Lou, D., Li, Z. H., Dong, H., Ma, F., et al. (2020). Slab Rollback versus Delamination: Contrasting Fates of Flat‐Slab Subduction and Implications for South China Evolution in the Mesozoic. J. Geophys. Res. Solid Earth 125, 1–18. doi:10.1029/2019jb019164
Faccenna, C., Becker, T. W., Holt, A. F., and Brun, J. P. (2021). Mountain Building, Mantle Convection, and Supercontinents: Revisited. Earth Planet. Sci. Lett. 564, 116905. doi:10.1016/J.EPSL.2021.116905
Faccenna, C., Holt, A. F., Becker, T. W., Lallemand, S., and Royden, L. H. (2018). Dynamics of the Ryukyu/Izu-Bonin-Marianas Double Subduction System. Tectonophysics 746, 229–238. doi:10.1016/j.tecto.2017.08.011
Fu, D., Huang, B., Johnson, T. E., Wilde, S. A., Jourdan, F., Polat, A., et al. (2022). Boninitic Blueschists Record Subduction Initiation and Subsequent Accretion of an Arc-Forearc in the Northeast Proto-Tethys Ocean. Geology 50, 10–15. doi:10.1130/g49457.1
Gerya, T. V., and Yuen, D. A. (2003). Characteristics-based Marker-In-Cell Method with Conservative Finite-Differences Schemes for Modeling Geological Flows with Strongly Variable Transport Properties. Phys. Earth Planet. Interiors 140, 293–318. doi:10.1016/j.pepi.2003.09.006
Hall, R. (2002). Cenozoic Geological and Plate Tectonic Evolution of SE Asia and the SW Pacific: Computer-Based Reconstructions, Model and Animations. J. Asian Earth Sci. 20. doi:10.1016/S1367-9120(01)00069-4
Holm, R. J., Rosenbaum, G., and Richards, S. W. (2016). Post 8 Ma Reconstruction of Papua New Guinea and Solomon Islands: Microplate Tectonics in a Convergent Plate Boundary Setting. Earth-Science Rev. 156, 66–81. doi:10.1016/j.earscirev.2016.03.005
Holm, R. J., Spandler, C., and Richards, S. W. (2013). Melanesian Arc Far-Field Response to Collision of the Ontong Java Plateau: Geochronology and Petrogenesis of the Simuku Igneous Complex, New Britain, Papua New Guinea. Tectonophysics 603, 189–212. doi:10.1016/j.tecto.2013.05.029
Holm, R. J., Tapster, S., Jelsma, H. A., Rosenbaum, G., and Mark, D. F. (2019). Tectonic Evolution and Copper-Gold Metallogenesis of the Papua New Guinea and Solomon Islands Region. Ore Geology. Rev. 104, 208–226. doi:10.1016/j.oregeorev.2018.11.007
Holt, A. F., Royden, L. H., and Becker, T. W. (2017). The Dynamics of Double Slab Subduction. Geophys. J. Int. 209, ggw496–265. doi:10.1093/gji/ggw496
Huangfu, P., Li, Z.-H., Gerya, T., Fan, W., Zhang, K.-J., Zhang, H., et al. (2018). Multi-terrane Structure Controls the Contrasting Lithospheric Evolution beneath the Western and central-eastern Tibetan Plateau. Nat. Commun. 9, 1–11. doi:10.1038/s41467-018-06233-x
Huangfu, P., Wang, Y., Cawood, P. A., Li, Z.-H., Fan, W., and Gerya, T. V. (2016). Thermo-mechanical Controls of Flat Subduction: Insights from Numerical Modeling. Gondwana Res. 40, 170–183. doi:10.1016/j.gr.2016.08.012
Ishikawa, A., Maruyama, S., and Komiya, T. (2004). Layered Lithospheric Mantle beneath the Ontong Java Plateau: Implications from Xenoliths in Alnöite, Malaita, Solomon Islands. J. Petrol. 45, 2011–2044. doi:10.1093/petrology/egh046
Ishikawa, A., Pearson, D. G., and Dale, C. W. (2011). Ancient Os Isotope Signatures from the Ontong Java Plateau Lithosphere: Tracing Lithospheric Accretion History. Earth Planet. Sci. Lett. 301, 159–170. doi:10.1016/j.epsl.2010.10.034
Isse, T., Suetsugu, D., Ishikawa, A., Shiobara, H., Sugioka, H., Ito, A., et al. (2021). Seismic Evidence for a Thermochemical Mantle Plume Underplating the Lithosphere of the Ontong Java Plateau. Commun. Earth Environ. 2, 1–7. doi:10.1038/s43247-021-00169-9
Jagoutz, O., Royden, L., Holt, A. F., and Becker, T. W. (2015). Anomalously Fast Convergence of India and Eurasia Caused by Double Subduction. Nat. Geosci 8, 475–478. doi:10.1038/NGEO2418
Lallemand, S., and Arcay, D. (2021). Subduction Initiation from the Earliest Stages to Self-Sustained Subduction: Insights from the Analysis of 70 Cenozoic Sites. Earth-Science Rev. 221, 103779. doi:10.1016/J.EARSCIREV.2021.103779
Li, S., Zhao, S., Liu, X., Cao, H., Yu, S., Li, X., et al. (2018). Closure of the Proto-Tethys Ocean and Early Paleozoic Amalgamation of Microcontinental Blocks in East Asia. Earth-Science Rev. 186, 37–75. doi:10.1016/J.EARSCIREV.2017.01.011
Li, Z.-H., Gerya, T., and Connolly, J. A. D. (2019). Variability of Subducting Slab Morphologies in the Mantle Transition Zone: Insight from Petrological-Thermomechanical Modeling. Earth-Science Rev. 196, 102874. doi:10.1016/j.earscirev.2019.05.018
Li, Z.-H., Liu, M., and Gerya, T. (2016). Lithosphere Delamination in continental Collisional Orogens: A Systematic Numerical Study. J. Geophys. Res. Solid Earth 121, 5186–5211. doi:10.1002/2016JB013106
Liao, J., Malusà, M. G., Zhao, L., Baldwin, S. L., Fitzgerald, P. G., and Gerya, T. (2018). Divergent Plate Motion Drives Rapid Exhumation of (Ultra)high Pressure Rocks. Earth Planet. Sci. Lett. 491, 67–80. doi:10.1016/j.epsl.2018.03.024
Lyu, T., Zhu, Z., and Wu, B. (2019). Subducting Slab Morphology and Mantle Transition Zone Upwelling in Double-Slab Subduction Models with Inward-Dipping Directions. Geophys. J. Int. 218, 2089–2105. doi:10.1093/gji/ggz268
Mann, P., and Taira, A. (2004). Global Tectonic Significance of the Solomon Islands and Ontong Java Plateau Convergent Zone. Tectonophysics 389, 137–190. doi:10.1016/j.tecto.2003.10.024
Marwen, Chaouachi., Andrzej, Falenty., Kathleen, Sell., Frieder, Enzmann., and Michael Kersten, D. H. (2015). Eduction, Extension, and Exhumation of Ultrahigh-Pressure Rocks in Metamorphic Core Complexes Due to Subduction Initiation. Geochem. Geophys. Geosystems 18, 1541–1576. doi:10.1002/2015GC005847.Received
Mishin, Y. A., Gerya, T. V., Burg, J.-P., and Connolly, J. A. D. (2008). Dynamics of Double Subduction: Numerical Modeling. Phys. Earth Planet. Interiors 171, 280–295. doi:10.1016/j.pepi.2008.06.012
Müller, R. D., Zahirovic, S., Williams, S. E., Cannon, J., Seton, M., Bower, D. J., et al. (2019). A Global Plate Model Including Lithospheric Deformation along Major Rifts and Orogens since the Triassic. Tectonics 38, 1884–1907. doi:10.1029/2018TC005462
Petterson, M. G., Babbs, T., Neal, C. R., Mahoney, J. J., Saunders, A. D., Duncan, R. A., et al. (1999). Geological-tectonic Framework of Solomon Islands, SW Pacific: Crustal Accretion and Growth within an Intra-oceanic Setting. Tectonophysics 301, 35–60. doi:10.1016/S0040-1951(98)00214-5
Ranalli, G. (1995). Rheology of the Earth, Deformation and Flow Process in Geophysics and Geodynamics 2nd EdnLondon, United Kingdom: Chapman & Hall.
Ranalli, G., and Murphy, D. C. (1987). Rheology Stratification of the Lithosphere. Tectonophysics 132, 281–295. doi:10.1016/0040-1951(87)90348-9
Riisager, P., Hall, S., Antretter, M., and Zhao, X. (2003). Paleomagnetic Paleolatitude of Early Cretaceous Ontong Java Plateau Basalts: Implications for Pacific Apparent and True Polar Wander. Earth Planet. Sci. Lett. 208, 235–252. doi:10.1016/S0012-821X(03)00046-3
Schellart, W. P., Lister, G. S., and Toy, V. G. (2006). A Late Cretaceous and Cenozoic Reconstruction of the Southwest Pacific Region: Tectonics Controlled by Subduction and Slab Rollback Processes. Earth-Science Rev. 76, 191–233. doi:10.1016/j.earscirev.2006.01.002
Shi, Y.-N., Niu, F., Li, Z.-H., and Huangfu, P. (2020). Craton Destruction Links to the Interaction between Subduction and Mid-lithospheric Discontinuity: Implications for the Eastern North China Craton. Gondwana Res. 83, 49–62. doi:10.1016/j.gr.2020.01.016
Stern, R. J., and Gerya, T. (2018). Subduction Initiation in Nature and Models: A Review. Tectonophysics 746, 173–198. doi:10.1016/j.tecto.2017.10.014
Stern, R. (2004). Subduction Initiation: Spontaneous and Induced. Earth Planet. Sci. Lett. 226, 275–292. doi:10.1016/j.epsl.2004.08.00710.1016/s0012-821x(04)00498-4
Sun, B., Kaus, B. J. P., Yang, J., Lu, G., Wang, X., Wang, K., et al. (2021). Subduction Polarity Reversal Triggered by Oceanic Plateau Accretion: Implications for Induced Subduction Initiation. Geophys. Res. Lett. 48, e2021GL095299. doi:10.1029/2021GL095299
Tao, J., Dai, L., Lou, D., Li, Z.-H., Zhou, S., Liu, Z., Li, S., Dong, H., Lan, H., Wang, L., and Li, F. (2020). Accretion of oceanic plateaus at continental margins: Numerical modeling. Gondwana Research 81, 390–402. doi:10.1016/j.gr.2019.11.015
Tapster, S., Roberts, N. M. W., Petterson, M. G., Saunders, A. D., and Naden, J. (2014). From Continent to Intra-oceanic Arc: Zircon Xenocrysts Record the Crustal Evolution of the Solomon Island Arc. Geology 42, 1087–1090. doi:10.1130/G36033.1
Tharimena, S., Rychert, C. A., and Harmon, N. (2016). Seismic Imaging of a Mid-lithospheric Discontinuity beneath Ontong Java Plateau. Earth Planet. Sci. Lett. 450, 62–70. doi:10.1016/j.epsl.2016.06.026
Turcotte, B., and Schubert, B. T. (2003). Geodynamics. Cambridge University Press Vol. 450 (2), 136–136.
Wallace, L. M., Stevens, C., Silver, E., McCaffrey, R., Loratung, W., Hasiata, S., et al. (2004). GPS and Seismological Constraints on Active Tectonics and Arc-Continent Collision in Papua New Guinea: Implications for Mechanics of Microplate Rotations in a Plate Boundary Zone. J. Geophys. Res. 109. doi:10.1029/2003JB002481
Wang, L., Dai, L., Gong, W., Li, S., Jiang, X., Foulger, G., et al. (2022). Subduction Initiation at the Solomon Back‐Arc Basin: Contributions from Both Island Arc Rheological Strength and Oceanic Plateau Collision. Geophys. Res. Lett. 49, 1–11. doi:10.1029/2021gl097666
Wang, Z., Kusky, T. M., and Capitanio, F. A. (2017). Ancient Continental Lithosphere Dislocated beneath Ocean Basins along the Mid-lithosphere Discontinuity: A Hypothesis. Geophys. Res. Lett. 44, 9253–9260. doi:10.1002/2017GL074686
Wang, Z., and Kusky, T. M. (2019). The Importance of a Weak Mid-lithospheric Layer on the Evolution of the Cratonic Lithosphere. Earth-Science Rev. 190, 557–569. doi:10.1016/j.earscirev.2019.02.010
Xiao, W., Song, D., Windley, B. F., Li, J., Han, C., Wan, B., et al. (2020). Accretionary Processes and Metallogenesis of the Central Asian Orogenic Belt: Advances and Perspectives. Sci. China Earth Sci. 63, 329–361. doi:10.1007/s11430-019-9524-6
Yang, G., Li, Y., Tong, L., Wang, Z., Si, G., Lindagato, P., et al. (2022). Natural Observations of Subduction Initiation: Implications for the Geodynamic Evolution of the Paleo-Asian Ocean. Geosystems and Geoenvironment 1, 100009. doi:10.1016/J.GEOGEO.2021.10.004
Yang, S.-H., Li, Z.-H., Gerya, T., Xu, Z.-Q., and Shi, Y.-L. (2018). Dynamics of Terrane Accretion during Seaward continental Drifting and Oceanic Subduction: Numerical Modeling and Implications for the Jurassic Crustal Growth of the Lhasa Terrane, Tibet. Tectonophysics 746, 212–228. doi:10.1016/j.tecto.2017.07.018
Zhang, Q., Guo, F., Zhao, L., and Wu, Y. (2017). Geodynamics of Divergent Double Subduction: 3-D Numerical Modeling of a Cenozoic Example in the Molucca Sea Region, Indonesia. J. Geophys. Res. Solid Earth 122, 3977–3998. doi:10.1002/2017JB013991
Zhang, S., and Leng, W. (2021). Subduction Polarity Reversal: Induced or Spontaneous? Geophys. Res. Lett. 48, 1–11. doi:10.1029/2021GL093201
Zhong, X., and Li, Z. H. (2020). Subduction Initiation during Collision‐Induced Subduction Transference: Numerical Modeling and Implications for the Tethyan Evolution. J. Geophys. Res. Solid Earth 125, 0–3. doi:10.1029/2019JB019288
Zhou, X., Li, Z.-H., Gerya, T. V., and Stern, R. J. (2020). Lateral Propagation-Induced Subduction Initiation at Passive continental Margins Controlled by Pre-existing Lithospheric Weakness. Sci. Adv. 6, 1–10. doi:10.1126/sciadv.aaz1048
Keywords: triple subduction system, the New Guinea region, thermal structure, numerical simulation, rheological strength differences
Citation: Wang L, Dai L, Gong W, Li S, Jiang X, Dong H, Wang D, Li F and Yu S (2022) Co-Evolution of Parallel Triple Subduction Systems in the New Guinea Region: A Systematic Numerical Study. Front. Earth Sci. 10:861240. doi: 10.3389/feart.2022.861240
Received: 24 January 2022; Accepted: 03 March 2022;
Published: 14 April 2022.
Edited by:
Jie Liao, Sun Yat-sen University, ChinaReviewed by:
Xin Zhou, University of Minnesota Twin Cities, United StatesCopyright © 2022 Wang, Dai, Gong, Li, Jiang, Dong, Wang, Li and Yu. This is an open-access article distributed under the terms of the Creative Commons Attribution License (CC BY). The use, distribution or reproduction in other forums is permitted, provided the original author(s) and the copyright owner(s) are credited and that the original publication in this journal is cited, in accordance with accepted academic practice. No use, distribution or reproduction is permitted which does not comply with these terms.
*Correspondence: Liming Dai, ZGxtaW5nQG91Yy5lZHUuY24=
Disclaimer: All claims expressed in this article are solely those of the authors and do not necessarily represent those of their affiliated organizations, or those of the publisher, the editors and the reviewers. Any product that may be evaluated in this article or claim that may be made by its manufacturer is not guaranteed or endorsed by the publisher.
Research integrity at Frontiers
Learn more about the work of our research integrity team to safeguard the quality of each article we publish.