- 1School of Atmospheric Sciences, Sun Yat-sen University, and Southern Marine Science and Engineering Guangdong Laboratory (Zhuhai), Zhuhai, China
- 2Yingde Meteorological Bureau, Qingyuan, China
- 3Guangdong Province Key Laboratory for Climate Change and Natural Disaster Studies, Sun Yat-sen University, Zhuhai, China
This study investigates the large-scale circulation anomalies of strong and weak cold surges in southern China. Results show that the strong and weak surges are associated with a distinct Rossby wave train across Eurasia projecting onto the Scandinavia (SCAND) and Eurasian (EU) patterns. On one hand, the strong surge is preceded by a positive SCAND pattern and a transition of the EU pattern from its negative to positive phase. The corresponding wave train propagates southeastward from East Asia to the North Pacific. This is associated with a strong intensification of the Siberian high, a deepened East Asian trough, and a sharp meridional pressure gradient between northern and southern China; these advect intense cold air masses from Siberia to southern China. On the other hand, the weak surge is preceded by a negative SCAND pattern and a positive EU pattern. The corresponding wave train does not propagate from East Asia to the North Pacific. This wave train has a weak impact on the East Asian winter monsoon circulation and corresponds to weak cold air advections towards southern China. Overall, the intra-seasonal variation of the Eurasian teleconnection patterns is crucial for a comprehensive understanding of the cold surge in southern China.
1 Introduction
During the boreal winter, the cold air outbreak associated with the breakdown of the cold-core Siberian high often intrudes equatorward over the East Asian continent, which is also literally described as cold surge or winter monsoon surge (Chin, 1969; Lau and Li, 1984; Ding, 1994; Chang et al., 2006). The southward intrusion of a cold surge often results in strengthening of the near-surface northerly wind and an abrupt temperature drop in the subtropical region of East Asia, including southern China (Chang et al., 1979; Wu and Chan, 1995). Although the winter climate in southern China is warmer than the northern China, the severe cold air activity occurs in southern China occasionally, such as the persistent icy rain and snowstorms in early 2008 (Ding et al., 2008; Tao and Wei, 2008; Wen et al., 2009; Zhou et al., 2009), the “once-in-the-century” cold surge in late January 2016 (Cheung et al., 2016; Ma and Zhu, 2019; Yamaguchi et al., 2019) and the intense cold surges in late 2020 (Bueh et al., 2022; Dai et al., 2022; Zheng et al., 2022). Under the global warming background, the frequency of cold extremes is projected to substantially decrease [Seneviratne et al., 2021 (Ch. 11 in IPCC AR6 report)]. However, under a warmer climate, the center of extreme cold events is projected to shift southward towards southern China (Ma et al., 2012). During the recent decades, the abrupt change between warm and cold extremes has occurred more frequently in China (Chen et al., 2019). Hence, it is valuable to have an improved physical understanding of the cold surge in southern China, which is the objective of this study.
The cold air activity affecting China is generally originated from three regions: 1) west of Novaya Zemlya over the Arctic Ocean, 2) east of Novaya Zemlya over the Arctic Ocean, and 3) south of Iceland over the Atlantic Ocean (Ding and Krishnamurti, 1987). The cold air masses from these regions usually travel across central Siberia (70°–90°E, 43°–65°N) and intrudes China via the northwestern, western and/or eastern pathway (Ding and Krishnamurti, 1987). When a synoptic-scale trough in the mid- and upper troposphere deepens over central Siberia, the surface Siberian high intensifies due to radiative cooling ahead of the trough intensifies and the northerly cold air advection from the polar region (Ding, 1990; Wu and Chan, 1997). The eastward migration of the upper-level trough triggers an eastward movement of the Siberian high. When the Siberian high touches the Tibetan Plateau, the Siberian high breaks down and initiates a cold surge (Hsu, 1987; Yao et al., 2016). The cold surge migrates southeastward to the main part of China, which takes around 2 days from northern China to the South China Sea (Chu, 1978). The cold surge affects the convection and precipitation over the South China Sea and the Maritime Continents (Lim and Chang, 1981; Liu et al., 2021), as well as the baroclinic wave activity across the North Pacific (Lau and Lau, 1984).
The development of an East Asian cold surge is often related to the Rossby wave train over Eurasia (Joung and Hitchman, 1982; Takaya and Nakamura, 2005a; Park et al., 2011; Pang and Lu, 2019). During the cold surge development, the mid- and upper-tropospheric geopotential height in central Asia and East Asia is often out of phase (Chang and Lau, 1980, 1982). Specifically, a ridge is located at central Asia and a trough is located aloft the Siberian high, where the former is also called Ural ridge in literature. The Ural ridge enhances the cold air advection from the vicinity of Novaya Zemlya to Siberia that reinforces the Siberian high (Takaya and Nakamura, 2005b). Hence, the Ural ridge is regarded as a dynamic precursor of the East Asian cold surge (Tao, 1957; Lu and Chang, 2009). The persistence of a Ural ridge is called Ural blocking, which is a key precursor of the severe cold air outbreak in East Asia (Tao, 1957; Zhou et al., 2009; Cheung et al., 2016; Chen et al., 2021; Yao et al., 2022). The long-term variations in the frequency of Ural blocking and that of cold extremes in southern China are strongly correlated (Cheung et al., 2015).
The development of Ural blocking is preceded by the intensification of an upstream cyclone over the European continent. The low-high-low geopotential height anomaly pattern over Europe, the Urals and East Asia is the leading mode of the winter-mean geopotential height anomaly over Eurasia (Cheung et al., 2012). Such a Eurasian Rossby wave train often resembles the Eurasian (EU) pattern, the East Atlantic/West Russia (EA/WR) pattern and the Scandinavian (SCAND) pattern (Bueh and Nakamura, 2007; Liu et al., 2014; Lim, 2015; Wang et al., 2019). Previous studies have analyzed extensively the relationship between the Rossby waves and the East Asian winter climate on monthly and longer timescales (He and Wang, 2013; Lim and Kim, 2013; Takaya and Nakamura, 2013; Liu et al., 2014; Chen and Song, 2019; Li et al., 2019; Qiao et al., 2020), whereas their linkage on the sub-monthly timescales is less studied. Recently, Pang et al. (2020, 2022) showed that the long-lived cold surge (longer than 5 days) in the South China Sea is associated with a negative SCAND pattern and Siberian blocking. Here, we will demonstrate that the low-frequency circulation anomalies over the mid-latitude Eurasia prior to the occurrence of strong and weak cold surges in southern China are distinct, which have a distinct evolution of the EU pattern and the SCAND pattern.
2 Data and Methods
2.1 Data
We used daily archives from the NCEP-NCAR reanalysis datasets with a horizontal resolution of 2.5° × 2.5° at 17 isobaric levels from 1,000 to 10 hPa. The study period includes the 41 winters from 1979/80 to 2019/20, e.g., the winter 1979/80 denotes the winter from December 1979 to February 1980 (December-January-February; DJF). The daily climatology is defined as the 30-year period from 1980 to 2009.
2.2 Cold Surge
When a cold surge passes through southern China, the sea level pressure (SLP) increases and then the surface air temperature drops abruptly. Here, the cold surge in southern China is defined using the daily surface air temperature averaged over the region 22.5°–25.0°N and 112.5°–117.5°E. The begin of a cold surge (day + 0) satisfies the following two criteria: 1) the daily temperature drop exceeds the 10-th percentile of all winter days (−1.44°C), i.e. a significant drop in temperature (“surge”), 2) the daily temperature is lower than the daily climatology, i.e. below-average temperature (“cold”). A cold surge is terminated (day + n) when either 1) the daily temperature exceeds the daily climatology for two consecutive days or 2) the daily temperature increases and the daily temperature exceeds the temperature averaged in the previous 2 days.
Following the above criteria, 344 cold surges are identified. The average number of cold surges per winter is eight, which is close to the number in previous literature; for example, Park et al. (2011) showed that the South China coast has about ten surges per winter (see their Figure 10D), and Pang and Lu (2019) found that southern China has about nine surges per winter. The intensity of a cold surge is defined as the difference between the daily-mean temperature on day+0 and the lowest daily temperature throughout the cold surge. The strong and weak surges are defined as the first and last 25-th percentile (86 events = 344 × 0.25) of the cold surge intensity, i.e. the surge leads to a larger and smaller temperature drop in southern China, respectively.
The daily temperature change and the daily temperature anomaly averaged over southern China (22.5°–25.0°N and 112.5°–117.5°E) from day-5 to day+7 of the cold surge are presented in Figure 1. The maximum temperature drop occurs between day+0 and day+1 (i.e., the value on day+0 shown in Figure 1A), where the magnitude reaches +5.0°C for the strong surge and +2.0°C for the weak surge. Compared to the weak surge, the larger temperature drop during the occurrence of the strong surge (Figure 1A) is characterized by a sharper temperature change from a larger above-normal value (+4°C) to a stronger below-normal value (−4°C) (Figure 1B). After the arrival of the cold surge, the minimum temperature is attained on day+2 for both strong and weak surges, where in the strong surge such a low temperature is comparable on day+2 and day+3 (Figure 1B). The cold anomaly in southern China lasts for around 6 days in the strong surge and only 3 days in the weak surge (Figure 1B). Overall, the strong surge is more intense and more persistent; it has a stronger impact on the weather in southern China than the weak surge. We will compare the large-scale circulation features of the strong and weak surges in section 3.2.
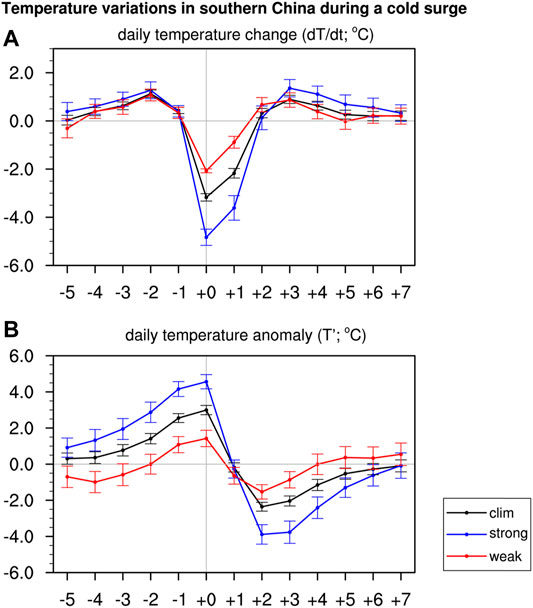
FIGURE 1. Temperature variations in southern China (22.5°–25.0°N and 112.5°–117.5°E) from day-5 to day +7 of a cold surge: (A) daily temperature change (difference between day n + 1 and day n), (B) daily temperature anomaly. Unit: °C. In each plot, black, blue and red color represents the climatological, strong and weak cold surge, respectively. Solid lines indicate the values averaged across the surges belonging to the same category, and error bars denote the 95% confidence interval derived from the standard error across the surges belonging to the same category.
The composite method is used to depict the large-scale circulation features of the climatological, strong and weak cold surges. A two-tailed Student’s t-test is used to determine the level of significance of the circulation anomalies in the strong and weak surges versus the climatological cold surge.
2.3 Low-Frequency Circulation Features
The unfiltered circulation anomalies are composed of high-frequency and low-frequency components, where the high-frequency component is related to the synoptic disturbance. A 10-day low-pass filter is used extract the low-frequency geopotential height, where the synoptic disturbances are filtered out. Based on the low-frequency geopotential height, we can deduce if the large-scale circulation features resemble a low-frequency Rossby wave train and specific teleconnection patterns. This low-frequency field is also used to compute the horizontal component of the stationary wave activity fluxes (Takaya and Nakamura, 2001) that diagnose the propagation of low-frequency Rossby waves over the Eurasian continent
where U and V are the zonal and meridional component of the winter climatological flow V (i.e. basic state), p is the pressure level, ѱ’ is the perturbation stream function derived from the 10-day low-pass filtered geopotential height anomaly.
We also investigate the linkage between the teleconnection patterns and the cold surges on sub-seasonal timescales. The NAO, EU and SCAND patterns are obtained by applying a rotated empirical orthogonal function (REOF) analysis to the DJF-mean 700-hPa geopotential height, which follows the definition in Barnston and Livezey (1987). The first, sixth and ninth REOF (REOF1, REOF6 and REOF9) pattern resembles the NAO, the EU pattern and the SCAND pattern (Figure 2). Then, these REOF patterns are projected onto the daily 700-hPa geopotential height anomalies in order to obtain the daily NAO, EU and SCAND indices.
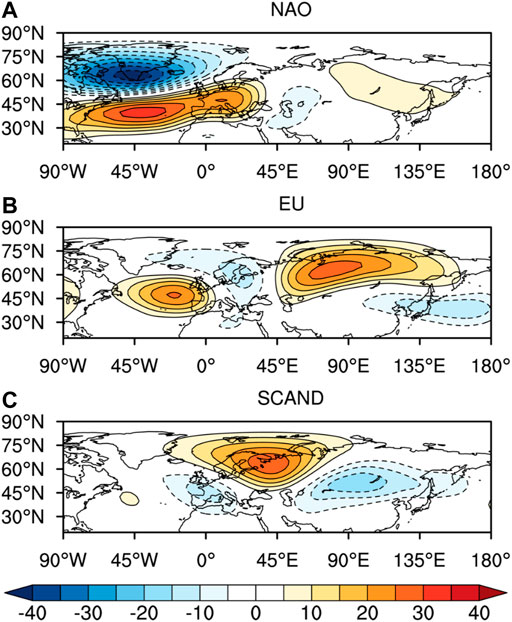
FIGURE 2. The positive phase of (A) the NAO (North Atlantic Oscillation), (B) the EU (Eurasian) pattern and (C) the SCAND (Scandinavian) pattern obtained from the REOF analysis performed to the DJF-mean 700-hPa geopotential height anomalies from 1979/80 to 2019/20 [following the definition in Barnston and Livezey (1987)].
3 Results
3.1 Climatology of the Cold Surge
We revisit the large-scale circulation anomalies of the climatological cold surge in southern China before comparing the strong and weak cold surges. The development of a climatological cold surge is preceded by a dipole anomaly resembling an eastward shift of the positive phase of NAO, with a high centered near the Iberian Peninsula (Figure 3A1). Such a dipole pattern weakens from day-4 to day-1 (Figures 3A1–D1), indicating a decaying positive NAO-like pattern preceding the occurrence of the cold surge in southern China (Figure 4). Meanwhile, an anomalous upper-tropospheric ridge moves eastward from eastern Europe and intensifies over the Ural Mountains (Figures 3A1–D1). The above results are analogous to the impact of a decaying NAO event on the Ural ridge and the East Asian winter circulation mentioned by previous studies (Luo et al., 2010; Sung et al., 2011; Wang et al., 2011; Song and Wu, 2017; Lyu et al., 2019).
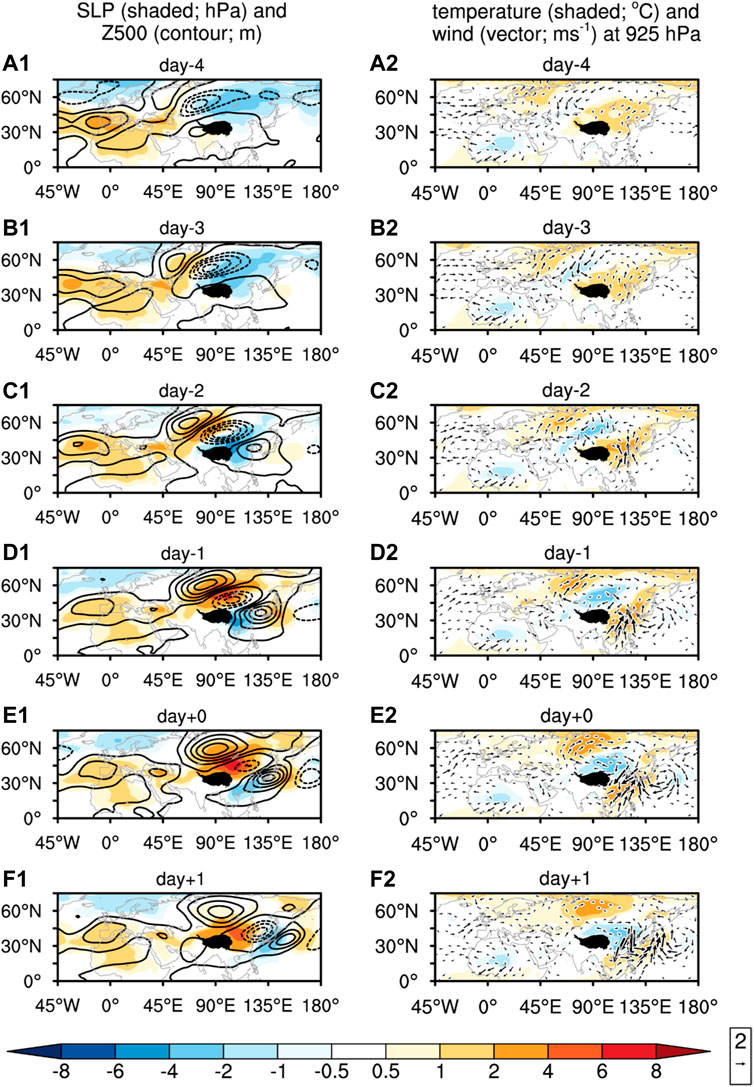
FIGURE 3. Climatology of (A1–F1) the sea level pressure anomalies (shaded; hPa) and the 500-hPa geopotential height anomalies (contour interval: 10 m), and (A2–F2) the air temperature (shaded; °C) and wind (vector; ms−1) at the 925 hPa from day-4 and day +1 of a cold surge. Stippling denotes the Tibetan Plateau. Note that the zero contour lines are omitted and positive/negative values are denoted by solid/dashed lines.
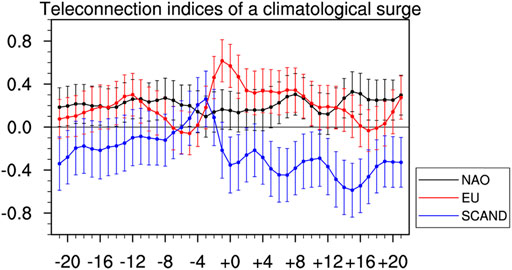
FIGURE 4. Daily time-series of normalized NAO, EU and SCAND indices from day-21 to day +21 of a climatological cold surge, where the error bars indicate the 95% confidence interval of the teleconnection indices derived from the standard error across the 344 cold surges.
The intensification of the Ural ridge from day-4 to day-1 (Figures 3A1-D1) is associated with stronger cold air advection from the polar region to Siberia (Figures 3A2–D2). The northerly cold air advection reinforces the upper-tropospheric trough over western Siberia and the cold-core Siberian high near the surface, where these circulation features become prominent between day-2 to day-1 (Figures 3C1, D1, C2, D2). While the Siberian high intensifies from day -1 to day +0, the Siberian high and its associated upper-tropospheric trough move eastward across the northeastern flank of the Tibetan Plateau (Figures 3D1, E1). Following that, from day +0 to day +1, the positive anomaly over Siberia (45°–60°N, 80°–120°E) weakens and the positive SLP anomaly center moves southeastward (Figures 3E1, F1), indicating the breakdown and southeastward migration of the Siberian high. The movement of Siberian high results in a southeastward intrusion of the cold air masses towards southern China, which is characterized by an abrupt drop of the surface air temperature in southern China according to the cold surge definition (also inferred from Figures 3E2, F2).
When the cold surge approaches southern China, the temperature and SLP gradients along southern China tighten (Figures 3E1, E2). Whereas southern China is warmer than normal with a below-normal SLP, northern China is cooler than normal with an above-normal SLP (Figures 3E1, E2). Accompanying the southeastward migration of the Siberian high, the tightened gradients advect cold air towards southern China and cause an abrupt drop in the surface air temperature. The passage of the cold surge across southern China is also characterized by strengthening of the northerly wind, where the anomalous wind direction changes from southerly to northerly from day +0 to day +1 (Figures 3E2, F2). The large-scale circulation anomalies of the climatological cold surge resemble the northerly surge in southern China mentioned in Wu and Chan (1995, 1997).
In short, the development of a climatological cold surge follows an eastward propagating Rossby wave train associated with the decay of a positive NAO-like pattern. The following changes in the Eurasian teleconnection are also denoted (Figure 4): First, the SCAND pattern is transited from a slight positive phase to a negative phase: this is related to the eastward movement of a positive height anomaly (ridge) from eastern Europe to Siberia (Figures 3A1–E1), where the positive height anomaly over eastern Europe is projected onto the positive SCAND phase. Second, a positive EU pattern evolves: this is related to the positive height anomalies over eastern Atlantic and Siberia and the negative height anomalies over Scandinavia and around 40°N in East Asia (Figures 3D1–F1). Are the strong and weak cold surges associated with circulation anomalies analogous to the climatological cold surge?
3.2 Distinct Evolution of Strong and Weak Cold Surges
3.2.1 Strong Cold Surge
The strong and weak surges in southern China are preceded by pronounced circulation anomalies over the mid-latitude Eurasian continent (Figure 5), where the circulation anomalies associated with the strong surge are different from the positive NAO-like pattern associated with the climatological cold surge (left panel in Figure 5 vs. left panel in Figure 3). Compared to the climatological surge, the development of the strong surge is preceded by a less apparent dipole-like pattern over the North Atlantic and a stronger anomalous high over northern Europe (Figures 5A1, B1). The stronger European high advects more cold polar air towards the eastern Europe and the high-latitude Asia (Figures 6A1, B1) than the climatological surge (Figure 3A2). This anomalous high is associated with a Rossby wave train emanating from the North Atlantic to Siberia (Figure 7A1).
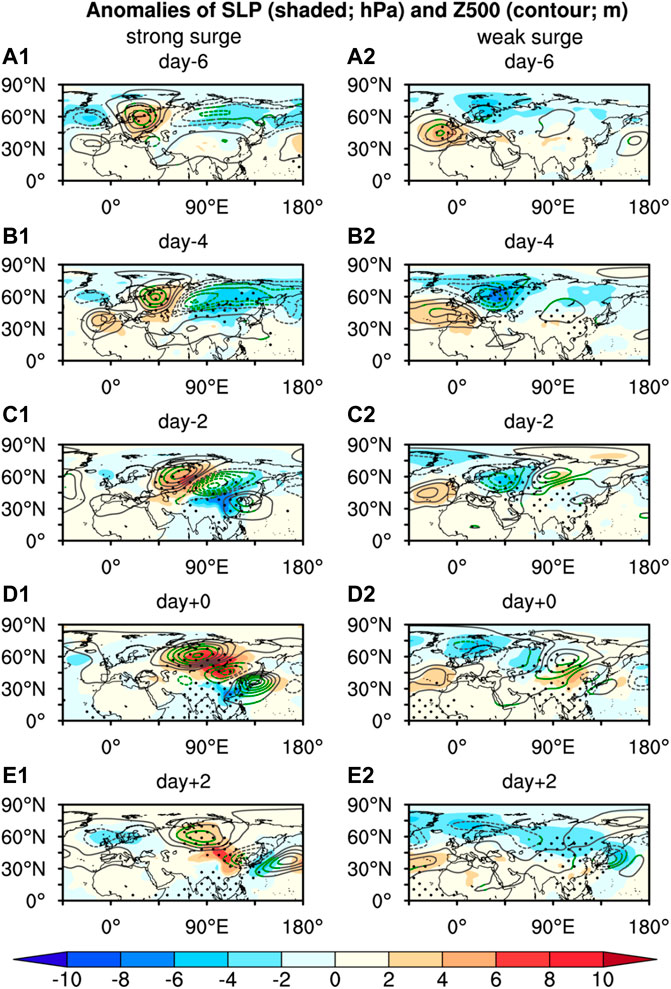
FIGURE 5. Composite anomalies of sea level pressure (shaded; hPa) and 500-hPa geopotential height (contour interval: 15 m) from day-6 to day+2 of a (A1–E1) strong and (A2–E2) weak cold surge. Dots and Green contours indicate the 95% confidence interval that is significantly different from the climatological cold surge using the two tailed Student’s t-test. Note that the zero contour lines are omitted and positive/negative values are denoted by solid/dashed lines.
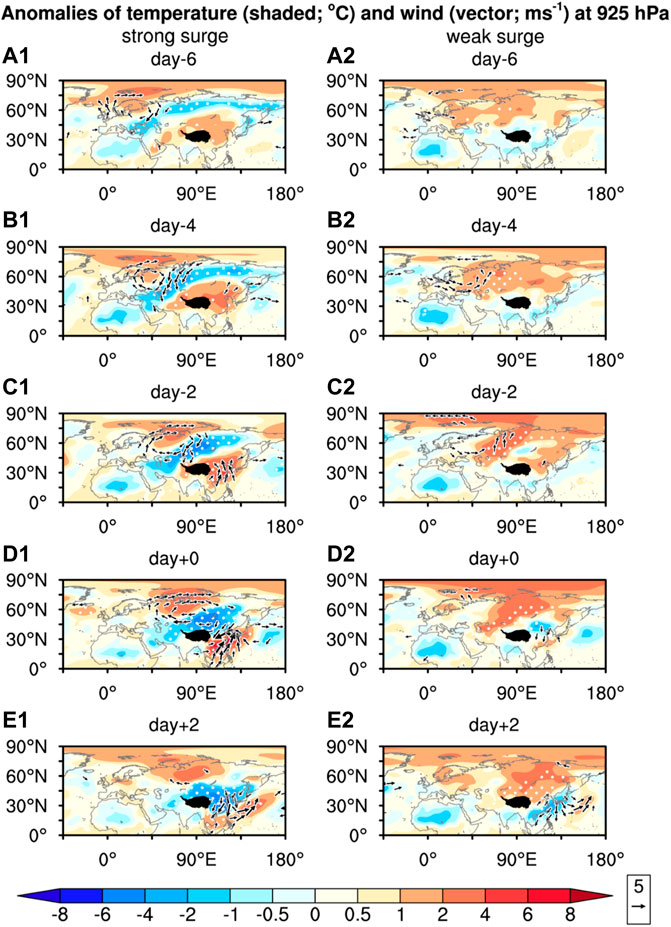
FIGURE 6. As in Figure 5, but for the composite anomalies of air temperature (shaded; °C) and wind (vector; ms−1) at 925 hPa. White dots and vectors indicate the anomalies significantly different from the climatological cold surge at the 95% confidence level using the two tailed Student’s t-test.
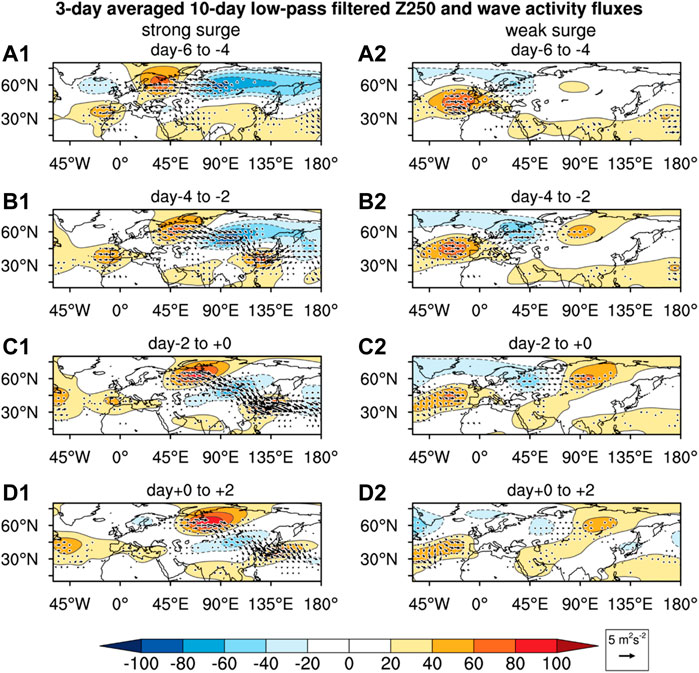
FIGURE 7. The 3-day averaged 10-day low-pass filtered 250-hPa geopotential height anomalies (shaded; m) and the stationary wave activity fluxes (vector; m2s−2) during the evolution of a (A1–D1) strong and (A2–D2) weak cold surge. Note that the zero contour lines are omitted and positive/negative values are denoted by solid/dashed lines.
The anomalous high over Eurasia represents a stronger meridional-type circulation over part of the mid-latitude Eurasian continent. When the anomalous high is located over Europe from day-6 to day-4, an anomalous low spreads across the high-latitude Asia (Figures 5A1, B1). The anomalous low is associated with stronger westerly wind over Siberia that advects less cold polar air equatorward over Asia. Correspondingly, the Siberian high and the East Asian cold air activity are weaker than normal, which can be depicted by a negative SLP anomaly over Siberia (Figures 5A1, B1) and warm anomalies in East Asia (Figures 6A1, B1). From day-4 to day-2, associated with the southeastward propagation of wave activity fluxes from western Siberia to East Asia (Figure 7A2), the weaker Siberian high extends southeastward to southern China (Figures 5B1, C1), and southern China is warmer than normal associated with southerly wind anomalies (weaker northerly wind; Figure 6C1). The above results suggest that the development of the strong surge begins with a stronger zonal-type circulation over Asia that causes a weaker Siberian high.
The East Asian circulation north of 40°N undergoes a sharp transition from the stronger zonal-type circulation to the stronger meridional-type circulation from day-2 to day +0 of the strong surge (Figures 5C1, D1). Associated with the eastward propagation of the Rossby wave train over the mid-latitude Eurasian continent (Figures 7B1, C1), the anomalous high moves from eastern Europe to Ural-Siberia. The anomalous Ural-Siberian high strengthens the northerly cold advection from the polar region to western Siberia, and the pronounced cold anomalies spread southeastward to the northern China (Figures 6C1, D1). The downstream portion of this anomalous high reinforces the upper-tropospheric convergence and the near-surface divergence over western Siberia (Ding, 1990), which in turn substantially strengthens the upper-tropospheric trough over western Siberia and the near-surface Siberian high (Figures 5C1, D1). Downstream of the upper-tropospheric trough over western Siberia is an upper-tropospheric high centered near 40°N over East Asia. Such an anomalous high advects warm air from the Pacific towards southern China, which corresponds to southerly wind anomalies and warm anomalies over southern China (Figures 6C1, D1). In addition, the SLP over southern China is still below normal (Figures 5C1, D1), which is related to the southeastward extension of the weak Siberian high associated with the southeastward propagation of the Rossby wave train (Figures 5C1, D1, Figure 7C1). Altogether, prior to the occurrence of the strong cold surge in southern China, pressure and temperature gradients are tightened between northern China and southern China accompanying the southeastward propagation of a Rossby wave train signal across East Asia.
During the outbreak of the strong cold surge, the anomalous Ural-Siberian high remains quasi-stationary with an equivalent barotropic structure, which resembles a blocking ridge (Figures 5D1, E1). The blocking ridge over Ural-Siberia favors the occurrence of a severe cold surge in southern China (Cheung et al., 2015; Pang et al., 2020). The downstream impact of the Ural blocking ridge on southern China can be depicted by the southeastward propagation of the Rossby wave train over East Asia (Figures 7C1, D1). Specifically, the anomalous cyclone downstream of the blocking ridge moves southward from day +0 to day +2 (Figures 5D1, E1). This implies deepening of the East Asian trough that enhances the southward intrusion of intense cold air masses from Siberia to southern China (Leung et al., 2015). The temperature in southern China sharply drops from day +0 to day +2, where the anomaly changes from significant positive to significant negative (Figures 6D1, E1) that is consistent with Figure 1B. Overall, the evolution of the strong surge is linked to the eastward propagation of a Rossby wave train from Europe to the North Pacific, which is similar to the wave train-type cold surge mentioned in previous studies (Joung and Hitchman, 1982; Takaya and Nakamura, 2005a; Park et al., 2011).
The Rossby wave train associated with the strong cold surge (Figures 7A1–D1) is linked to the sub-seasonal change in the EU and SCAND patterns. Between day-6 to day-4 of the strong surge, the Rossby wave train over Eurasia consists of a negative height anomaly over the North Atlantic, a positive height anomaly over Scandinavia and another negative height anomaly is centered over central Asia (Figure 7A1). This spatial pattern strongly resembles the negative phase of EU (Figure 8A), which is linked to weaker East Asian winter monsoon activity. Between day-4 to day-2, the negative height anomaly over the North Atlantic weakens, the positive height anomaly over Scandinavia slightly moves eastward, and the negative height anomaly over Asia strengthens (Figure 7B1). These circulation anomalies are linked to the intensification of the Siberian high; they are projected onto the positive phase of SCAND (Figure 8A). The Rossby wave train propagates eastward further across the East Asian continent (Figures 7C1, D1) during the occurrence of the strong surge. Between day +0 and day +2, the height anomalies over a large part of the Eurasian continent are opposite in sign to the height anomalies between day-6 and day-4 (Figures 7D1 vs. 7A1), such that the EU pattern attains its positive phase (Figure 8A).
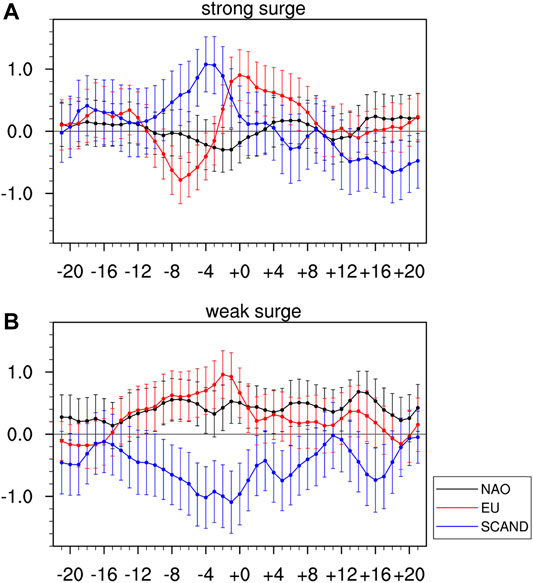
FIGURE 8. As in Figure 4, but for a (A) strong and (B) weak cold surge.
In short, the eastward propagation of Eurasian wave train associated with the strong surge is characterized by a transition of the EU pattern from its negative to positive phase and the evolution of a positive SCAND pattern, whereas the NAO signal is weak (Figure 8A). Note that the positive SCAND pattern and the EU pattern is peaked at day-3 and day +0, respectively. The positive SCAND pattern can be regarded as a precursor of the strong surge, whereas the occurrence of strong surge is projected onto the positive EU pattern.
3.2.2 Weak Cold Surge
The circulation anomalies over the mid-latitude Eurasia preceding the development of the weak surge are in sharp contrast to those preceding the development of the strong surge (right panel vs. left panel in Figure 5). From day-6 to day +0 of the weak surge, a dipole-like anomaly persists over the Euro-Atlantic region (Figures 5A2–D2), which resembles an eastward shift of the positive NAO-like pattern as in the climatological surge (Figures 3A1–E1). Meanwhile, an anomalous low with an equivalent barotropic structure moves eastward from Scandinavia to the Ural Mountains (Figures 5A2–D2). This anomalous low advects warm air towards the Ural-Siberian region (Figures 6A2–D2). The development of this anomalous low is associated with the emanation of wave activity fluxes from an anomalous high located at the mid-latitude Euro-Atlantic region (Figures 7A2, B2). These anomalous pressure systems correspond to a stronger meridional pressure gradient and stronger zonal flow over the European continent. Hence, the evolution of the weak surge begins with a stronger zonal-type circulation over Europe.
When the anomalous low is located upstream adjacent to the Siberian high region from day-2 to day +0 (Figures 5C2–D2), the low strengthens the southwesterly warm advection towards the Siberian high (Figures 6C2, D2), which unlikely reinforces the Siberian high. Meanwhile, associated with the eastward propagation of a Rossby wave train over the mid-latitude Eurasia (Figures 7C2, D2), an anomalous high develops over central Siberia (Figures 5C2, D2). This anomalous high strengthens the northeasterly advection from eastern Siberia towards central Siberia (Figures 6C2, D2). Such northeasterly advection favors intensification of the Siberian high, where climatologically the air temperature in the eastern Siberia is also lower than the central-western Siberia (figure not shown). Comparatively, the anomalous high over Siberia associated with the weak surge is less intense than the strong cold surge (Figures 5C2, D2 vs. Figures 5C1, D1), corresponding to a weaker intensification of the Siberian high.
Moreover, the intensification of the Siberian high preceding the occurrence of the weak surge is associated with a weaker propagation of the Rossby wave train compared to the strong surge (Figures 7B2, C2 vs. Figures 7B1, C1). During the occurrence of the weak surge, the associated mid-latitude Eurasian Rossby wave train does not propagate further eastward towards the Pacific Ocean (Figures 7C2, D2), and the anomalous low downstream of the anomalous high over Siberia is less apparent (Figures 5D2, E2). In other words, compared to the strong surge, the mid-latitude Eurasian Rossby wave train associated with the weak surge has a weaker impact on the East Asian trough and the cold air activity affecting southern China. The weaker impact on southern China is evidenced by the smaller temperature variation in southern China during the passage of the weak surge than the strong surge (Figures 6D2, E2 vs. Figures 6D1, E1; see also Figure 1B).
The Rossby wave train associated with the weak cold surge is linked to the sub-seasonal change in the NAO, EU and SCAND patterns, where the evolution of these patterns is different from the strong cold surge (Figures 8B vs. Figure 8A). The wave train preceding the occurrence of the weak surge consists of pronounced circulation anomalies in the Euro-Atlantic region, with negative height anomalies over Scandinavia and positive height anomalies in eastern Atlantic (Figures 7A2, B2). Such a northeast-southwest oriented dipole pattern partly resembles the positive NAO and the positive EU (Figure 8B). When the negative height anomalies move eastward towards the Ural Mountains, the positive height anomalies over central Siberia evolve (Figures 7B2, C2). These circulation anomalies are projected stronger onto the positive EU and the negative SCAND pattern (Figure 8B). The EU and SCAND patterns attain the peak intensity around day-2 to day-1. Moreover, the dipole-like anomaly over the North Atlantic persists during the development of the weak surge (Figures 7A2–C2), such that the positive NAO persists (Figure 8B). Therefore, the weak cold surge evolves under a positive NAO-like background, together with the establishment of a positive EU pattern and a negative SCAND pattern.
4 Summary and Conclusions
The development of the climatological, strong and weak cold surges in southern China is associated with the eastward propagation of a Rossby wave train across the Eurasian continent. Whereas the wave train propagation associated with the climatological and weak surges follows the decay of the positive NAO-like pattern, the wave train propagation associated with the strong surge is not preceded by a NAO-like signal. The wave trains preceding the occurrence of the strong and weak surges have a distinct evolution of the SCAND and EU patterns, and these wave trains exert a different impact on the East Asian circulation:
1) An opposite phase of the SCAND (Scandinavian) pattern: The Rossby wave train associated with the strong surge accompanies an eastward movement of an anomalous anticyclone from Europe to Ural-Siberia, whereas the wave train associated with the weak surge accompanies an eastward movement of an anomalous low from Scandinavia to the Ural Mountains. Such a discrepancy is reflected by an opposite phase of SCAND, which is positive (negative) preceding the strong (weak) surge;
2) Different evolution of the EU (Eurasian) pattern: Prior to the occurrence of the strong and weak surges, the Siberian high intensifies that is associated with an anomalous high over Siberia and an anomalous low over East Asia. Such an anomalous high-low couplet is projected onto the positive EU pattern and it attains a peak near the outbreak of the strong and weak surges. Whereas the positive EU pattern evolves preceding the occurrence of the weak cold surge, it sharply transits from the negative to positive phase during the evolution of the strong surge.
3) Distinct impact on the East Asian circulation: The strong surge is associated with a stronger southeastward propagation of the Rossby wave train from Ural-Siberia to the North Pacific. This accompanies a transition of East Asian circulation from the zonal type to the meridional type. During the transition, a sharp pressure gradient is established between northern and southern China. The southward intrusion of cold air into southern China is enhanced by deepening of the East Asian trough. The temperature in southern China sharply drops from a pronounced warm anomaly to a pronounced cold anomaly, and the cold anomaly persists for nearly a week. In contrast, the weak surge is not associated with a Rossby wave propagation from Siberia to the North Pacific. Such a Rossby wave train has a weak impact on the East Asian trough and the associated cold air activity in southern China. The associated meridional pressure gradient over China is much smaller than the strong surge, and hence the cold surge results in a smaller temperature drop in southern China. The cold anomaly lasts for around 3 days.
In conclusions, the strong and weak cold surges in southern China are preceded by contrasting large-scale atmospheric circulation over the European continent around 1 week before the arrival of the cold surges. The European circulation influences the cold surge via the Rossby wave train and the associated impact on the Siberian high, the East Asian trough and the meridional pressure gradient between northern and southern China. The occurrence of the cold surge is projected onto the positive EU-like pattern, whereas the cold surge intensity is affected by the precursory SCAND-like pattern. The positive/negative SCAND-like pattern is followed by a strong/weak surge with more/less persistent cold anomaly in southern China. Our results highlight the importance of considering the impact of the Eurasian teleconnection patterns on the cold surge in southern China in addition to the NAO.
This study analyzes the cold surge in the entire DJF period. Indeed, we find that slightly more strong surges occurring in December and more weak surges in January. For a more comprehensive understanding of the cold surge in southern China, we need to analyze the dynamics underlying the intra-seasonal variation of the Eurasian teleconnections in different winter periods (say, early, middle and late winter), as well as considering the individual and combined effect of tropical and extratropical forcing on the Eurasian teleconnection patterns and the cold surge.
Data Availability Statement
The original contributions presented in the study are included in the article/Supplementary Material, further inquiries can be directed to the corresponding author.
Author Contributions
JL conducted data analysis and wrote the draft of manuscript. H-NC designed this study and finalized the manuscript.
Funding
This study was supported by the Guangdong Natural Science Foundation (Grant No. 2021A1515012419), Guangdong Province Key Laboratory for Climate Change and Natural Disaster Studies (Grant No. 2020B1212060025), the National Natural Science Foundation of China (Grant No. 41905050, 42088101) and the Innovation Group Project of the Southern Marine Science and Engineering Guangdong Laboratory (Zhuhai) (No. 311021001).
Conflict of Interest
The authors declare that the research was conducted in the absence of any commercial or financial relationships that could be construed as a potential conflict of interest.
Publisher’s Note
All claims expressed in this article are solely those of the authors and do not necessarily represent those of their affiliated organizations, or those of the publisher, the editors and the reviewers. Any product that may be evaluated in this article, or claim that may be made by its manufacturer, is not guaranteed or endorsed by the publisher.
Acknowledgments
We greatly appreciate the constructive feedback provided by the two reviewers that improves the clarity of the manuscript.
References
Barnston, A. G., and Livezey, R. E. (1987). Classification, Seasonality and Persistence of Low-Frequency Atmospheric Circulation Patterns. Mon. Wea. Rev. 115, 1083–1126. doi:10.1175/1520-0493(1987)115<1083:csapol>2.0.co;2
Bueh, C., and Nakamura, H. (2007). Scandinavian Pattern and Its Climatic Impact. Q.J.R. Meteorol. Soc. 133, 2117–2131. doi:10.1002/qj.173
Bueh, C., Peng, J., Lin, D., and Chen, B. (2022). On the Two Successive Supercold Waves Straddling the End of 2020 and the Beginning of 2021. Adv. Atmos. Sci. 39, 591–608. doi:10.1007/s00376-021-1107-x
Chang, C.-P., Erickson, J. E., and Lau, K. M. (1979). Northeasterly Cold Surges and Near-Equatorial Disturbances over the Winter MONEX Area during December 1974. Part I: Synoptic Aspects. Mon. Wea. Rev. 107, 812–829. doi:10.1175/1520-0493(1979)107<0812:ncsane>2.0.co;2
Chang, C.-P., and Lau, K. M. (1982). Short-term Planetary-Scale Interactions over the Tropics and Midlatitudes during Northern Winter. Part I: Contrasts Between Active and Inactive Periods. Mon. Wea. Rev. 110, 933–946. doi:10.1175/1520-0493(1982)110<0933:stpsio>2.0.co;2
Chang, C.-P., and Lau, K. M. W. (1980). Northeasterly Cold Surges and Near-Equatorial Disturbances over the Winter MONEX Area during December 1974. Part II: Planetary-Scale Aspects. Mon. Wea. Rev. 108, 298–312. doi:10.1175/1520-0493(1980)108<0298:ncsane>2.0.co;2
Chang, C.-P., Wang, Z., and Hendon, H. (2006). “The Asian Winter Monsoon,” in The Asian Monsoon. Editor B. Wang (Heidelberg: Praxis), 89–127.
Chen, D., Qiao, S., Zhu, X., Cheung, H.-N., Freychet, N., Hao, X., et al. (2021). Anthropogenic Influence on Northern Hemisphere Blocking during the winter 1960/1961-2012/2013. Environ. Res. Lett. 16, 094029. doi:10.1088/1748-9326/ac1d0e
Chen, S., and Song, L. (2019). The Leading Interannual Variability Modes of Winter Surface Air Temperature over Southeast Asia. Clim. Dyn. 52, 4715–4734. doi:10.1007/s00382-018-4406-x
Chen, Y., Liao, Z., and Zhai, P. (2019). Coincidence of Increasingly Volatile Winters in China with Arctic Sea-Ice Loss during 1980-2018. Environ. Res. Lett. 14, 124076. doi:10.1088/1748-9326/ab5c99
Cheung, H. H. N., Zhou, W., Lee, S.-M., and Tong, H.-W. (2015). Interannual and Interdecadal Variability of the Number of Cold Days in Hong Kong and Their Relationship with Large-Scale Circulation. Mon. Wea. Rev. 143, 1438–1454. doi:10.1175/MWR-D-14-00335.1
Cheung, H. H. N., Zhou, W., Leung, M. Y. T., Shun, C. M., Lee, S. M., and Tong, H. W. (2016). A Strong Phase Reversal of the Arctic Oscillation in Midwinter 2015/2016: Role of the Stratospheric Polar Vortex and Tropospheric Blocking. J. Geophys. Res. Atmos. 121, 13443–13457. doi:10.1002/2016JD025288
Cheung, H. N., Zhou, W., Mok, H. Y., and Wu, M. C. (2012). Relationship between Ural-Siberian Blocking and the East Asian Winter Monsoon in Relation to the Arctic Oscillation and the El Niño-Southern Oscillation. J. Clim. 25, 4242–4257. doi:10.1175/JCLI-D-11-00225.1
Chu, E. W. K. (1978). A Method for Forecasting the Arrival of Cold Surges in Hong Kong. Hong Kong Observatory Tech. 43, 31.
Dai, G., Li, C., Han, Z., Luo, D., and Yao, Y. (2022). The Nature and Predictability of the East Asian Extreme Cold Events of 2020/21. Adv. Atmos. Sci. 39, 566–575. doi:10.1007/s00376-021-1057-3
Ding, Y., and Krishnamurti, T. N. (1987). Heat Budget of the Siberian High and the Winter Monsoon. Mon. Wea. Rev. 115, 2428–2449. doi:10.1175/1520-0493(1987)115<2428:hbotsh>2.0.co;2
Ding, Y., Wang, Z., Song, Y., and Zhang, J. (2008). Causes of the Un-precedented Freezing Disaster in January 2008 and Its Possible Association with the Global Warming. Acta Meteorol. Sin. 22, 538–558.
He, S., and Wang, H. (2013). Impact of the November/December Arctic Oscillation on the Following January Temperature in East Asia. J. Geophys. Res. Atmos. 118, 12981–12998. doi:10.1002/2013JD020525
Hsu, H.-H. (1987). Propagation of Low-Level Circulation Features in the Vicinity of Mountain Ranges. Mon. Wea. Rev. 115, 1864–1893. doi:10.1175/1520-0493(1987)115<1864:pollcf>2.0.co;2
Joung, C. H., and Hitchman, M. H. (1982). On the Role of Successive Downstream Development in East Asian Polar Air Outbreaks. Mon. Wea. Rev. 110, 1224–1237. doi:10.1175/1520-0493(1982)110<1224:otrosd>2.0.co;2
Lau, K.-M., and Li, M.-T. (1984). The Monsoon of East Asia and Its Global Associations-A Survey. Bull. Amer. Meteorol. Soc. 65, 114–125. doi:10.1175/1520-0477(1984)065<0114:tmoeaa>2.0.co;2
Lau, N.-C., and Lau, K.-M. (1984). The Structure and Energetics of Midlatitude Disturbances Accompanying Cold-Air Outbreaks over East Asia. Mon. Wea. Rev. 112, 1309–1327. doi:10.1175/1520-0493(1984)112<1309:tsaeom>2.0.co;2
Leung, M. Y.-T., Cheung, H. H.-N., and Zhou, W. (2015). Energetics and Dynamics Associated with Two Typical mobile Trough Pathways Over East Asia in Boreal Winter. Clim. Dyn. 44, 1611–1626. doi:10.1007/s00382-014-2355-6
Li, J., Zheng, F., Sun, C., Feng, J., and Wang, J. (2019). Pathways of Influence of the Northern Hemisphere Mid-high Latitudes on East Asian Climate: A Review. Adv. Atmos. Sci. 36, 902–921. doi:10.1007/s00376-019-8236-5
Lim, H., and Chang, C.-P. (1981). A Theory for Midlatitude Forcing of Tropical Motions during Winter Monsoons. J. Atmos. Sci. 38, 2377–2392. doi:10.1175/1520-0469(1981)038<2377:atfmfo>2.0.co;2
Lim, Y.-K., and Kim, H.-D. (2013). Impact of the Dominant Large-Scale Teleconnections on winter Temperature Variability over East Asia. J. Geophys. Res. Atmos. 118, 7835–7848. doi:10.1002/jgrd.50462
Lim, Y.-K. (2015). The East Atlantic/West Russia (EA/WR) Teleconnection in the North Atlantic: Climate Impact and Relation to Rossby Wave Propagation. Clim. Dyn. 44, 3211–3222. doi:10.1007/s00382-014-2381-4
Liu, Q., Chen, G., Wang, L., Kanno, Y., and Iwasaki, T. (2021). Southward Cold Airmass Flux Associated with the East Asian Winter Monsoon: Diversity and Impacts. J. Clim. 34, 3239–3254. doi:10.1175/JCLI-D-20-0319.1
Liu, Y., WangZhou, L. W., Zhou, W., and Chen, W. (2014). Three Eurasian Teleconnection Patterns: Spatial Structures, Temporal Variability, and Associated Winter Climate Anomalies. Clim. Dyn. 42, 2817–2839. doi:10.1007/s00382-014-2163-z
Lu, M.-M., and Chang, C.-P. (2009). Unusual Late-Season Cold Surges during the 2005 Asian winter Monsoon: Roles of Atlantic Blocking and the Central Asian Anticyclone. J. Clim. 22, 5205–5217. doi:10.1175/2009JCLI2935.1
Luo, D., Zhou, W., and Wei, K. (2010). Dynamics of Eddy-Driven North Atlantic Oscillations in a Localized Shifting Jet: Zonal Structure and Downstream Blocking. Clim. Dyn. 34, 73–100. doi:10.1007/s00382-009-0559-y
Lyu, M., Wu, Z., Shi, X., and Wen, M. (2019). Distinct Impacts of the MJO and the NAO on Cold Wave Amplitude in China. Q.J.R. Meteorol. Soc. 145, 1617–1635. doi:10.1002/qj.3516
Ma, S., and Zhu, C. (2019). Extreme Cold Wave over East Asia in January 2016: A Possible Response to the Larger Internal Atmospheric Variability Induced by Arctic Warming. J. Clim. 32, 1203–1216. doi:10.1175/jcli-d-18-0234.1
Ma, T., Wu, Z., and Jiang, Z. (2012). How Does Coldwave Frequency in China Respond to a Warming Climate? Clim. Dyn. 39, 2487–2496. doi:10.1007/s00382-012-1354-8
Pang, B., Lu, R., and Ren, R. (2022). Impact of the Scandinavian Pattern on Long-Lived Cold Surges over the South China Sea. J. Clim. 35, 1773–1785. doi:10.1175/JCLI-D-21-0607.1
Pang, B., Lu, R., and Ren, R. (2020). Influence of Siberian Blocking on Long-Lived Cold Surges over the South China Sea. J. Clim. 33, 6945–6956. doi:10.1175/JCLI-D-19-0944.1
Pang, B., and Lu, R. (2019). Two Distinct Types of Extratropical Circulation Anomalies Associated with Cold Surges over the South China Sea. J. Clim. 32, 5069–5084. doi:10.1175/JCLI-D-19-0041.1
Park, T.-W., Ho, C.-H., and Yang, S. (2011). Relationship between the Arctic Oscillation and Cold Surges over East Asia. J. Clim. 24, 68–83. doi:10.1175/2010JCLI3529.1
Qiao, S., Zou, M., Cheung, H. N., Zhou, W., Li, Q., Feng, G., et al. (2020). Predictability of the Wintertime 500 hPa Geopotential Height over Ural-Siberia in the NCEP Climate Forecast System. Clim. Dyn. 54, 1591–1606. doi:10.1007/s00382-019-05074-8
Seneviratne, S. I., Zhang, X., Adnan, M., Badi, W., Dereczynski, C., Di Luca, A., et al. (2021). “Chapter 11: Weather and Climate Extreme Events in a Changing Climate IPCC, 2021: Summary for Policymakers,” in Climate Change 2021: The Physical Science Basis. Contribution of Working Group I to the Sixth Assessment Report of the Intergovernmental Panel on Climate Change [Masson-Delmotte Valérie]. Editors P. Zhai, A. Pirani, S. L. Connors, C. Péan, S. Berger, N. Caudet al. (Cambridge University PressPress).
Song, L., and Wu, R. (2017). Processes for Occurrence of Strong Cold Events over Eastern China. J. Clim. 30, 9247–9266. doi:10.1175/JCLI-D-16-0857.1
Sung, M.-K., Lim, G.-H., Kug, J.-S., and An, S.-I. (2011). A Linkage between the North Atlantic Oscillation and its Downstream Development Due to the Existence of a Blocking Ridge. J. Geophys. Res. 116, D11107. doi:10.1029/2010JD015006
Takaya, K., and Nakamura, H. (2001). A Formulation of a Phase-Independent Wave-Activity Flux for Stationary and Migratory Quasigeostrophic Eddies on a Zonally Varying Basic Flow. J. Atmos. Sci. 58, 608–627. doi:10.1175/1520-0469(2001)058<0608:afoapi>2.0.co;2
Takaya, K., and Nakamura, H. (2005b). Geographical Dependence of Upper-Level Blocking Formation Associated with Intraseasonal Amplification of the Siberian High. J. Atmos. Sci. 62, 4441–4449. doi:10.1175/JAS3628.110.1175/JCLI-D-12-00842.1
Takaya, K., and Nakamura, H. (2013). Interannual Variability of the East Asian Winter Monsoon and Related Modulations of the Planetary Waves. J. Clim. 26, 9445–9461. doi:10.1175/jcli-d-12-00842.1
Takaya, K., and Nakamura, H. (2005a). Mechanisms of Intraseasonal Amplification of the Cold Siberian High. J. Atmos. Sci. 62, 4423–4440. doi:10.1175/JAS3629.1
Tao, S. (1957). A Study of Activities of Cold Airs in East Asian Winter, Handbook of Short-Term Forecast, China Meteorological Administration. Beijing: Meteorology Press, 60–92. (In Chinese).
Tao, S., and Wei, J. (2008). Severe Snow and Freezing Rain in January 2008 in the Southern China. Climatic Environ. Res. 13, 337–350. (In Chinese).
Wang, L., Liu, Y., Zhang, Y., Chen, W., and Chen, S. (2019). Time-Varying Structure of the Wintertime Eurasian Pattern: Role of the North Atlantic Sea Surface Temperature and Atmospheric Mean Flow. Clim. Dyn. 52, 2467–2479. doi:10.1007/s00382-018-4261-9
Wang, X., Wang, C., Zhou, W., Wang, D., and Song, J. (2011). Teleconnected Influence of North Atlantic Sea Surface Temperature on the El Niño Onset. Clim. Dyn. 37, 663–676. doi:10.1007/s00382-010-833-z10.1007/s00382-010-0833-z
Wen, M., Yang, S., Kumar, A., and Zhang, P. (2009). An Analysis of the Large-Scale Climate Anomalies Associated with the Snowstorms Affecting China in January 2008. Mon. Wea. Rev. 137, 1111–1131. doi:10.1175/2008MWR2638.1
Wu, M. C., and Chan, J. C. L. (1995). Surface Features of Winter Monsoon Surges over South China. Mon. Wea. Rev. 123, 662–680. doi:10.1175/1520-0493(1995)123<0662:sfowms>2.0.co;2
Wu, M. C., and Chan, J. C. L. (1997). Upper-Level Features Associated with Winter Monsoon Surges Over South China. Mon. Wea. Rev. 125, 317–340. doi:10.1175/1520-0493(1997)125<0317:ulfaww>2.0.co;2
Yamaguchi, J., Kanno, Y., Chen, G., and Iwasaki, T. (2019). Cold Air Mass Analysis of the Record-Breaking Cold Surge Event over East Asia in January 2016. J. Meteorol. Soc. Jpn. 97, 275–293. doi:10.2151/jmsj.2019-015
Yao, S., Sun, Q., Huang, Q., and Chu, P. (2016). The 10-30-Day Intraseasonal Variation of the East Asian Winter Monsoon: The Temperature Mode. Dyn. Atmospheres Oceans 75, 91–101. doi:10.1016/j.dynatmoce.2016.07.001
Yao, Y., Zhang, W., Luo, D., Zhong, L., and Pei, L. (2022). Seasonal Cumulative Effect of Ural Blocking Episodes on the Frequent Cold Events in China During the Early Winter of 2020/21. Adv. Atmos. Sci. 39, 609–624. doi:10.1007/s00376-021-1100-4
Yihui, D. (1990). Build-Up, Air Mass Transformation and Propagation of Siberian High and Its Relations to Cold Surge in East Asia. Meteorl. Atmos. Phys. 44, 281–292. doi:10.1007/BF01026822
Zheng, F., Yuan, Y., Ding, Y., Li, K., Fang, X., Zhao, Y., et al. (2022). The 2020/21 Extremely Cold Winter in China Influenced by the Synergistic Effect of La Niña and Warm Arctic. Adv. Atmos. Sci. 39, 546–552. doi:10.1007/s00376-021-1033-y
Keywords: cold surge, Siberian high, Rossby wave train, Eurasian pattern, Scandinavian pattern
Citation: Lin J and Cheung H-N (2022) Distinct Mid-Latitude Eurasian Rossby Wave Trains Preceding Strong and Weak Cold Surges in Southern China. Front. Earth Sci. 10:861015. doi: 10.3389/feart.2022.861015
Received: 24 January 2022; Accepted: 17 March 2022;
Published: 12 April 2022.
Edited by:
Dabang Jiang, Institute of Atmospheric Physics (CAS), ChinaReviewed by:
Zhongda Lin, Institute of Atmospheric Physics (CAS), ChinaDong Si, Institute of Atmospheric Physics (CAS), China
Copyright © 2022 Lin and Cheung. This is an open-access article distributed under the terms of the Creative Commons Attribution License (CC BY). The use, distribution or reproduction in other forums is permitted, provided the original author(s) and the copyright owner(s) are credited and that the original publication in this journal is cited, in accordance with accepted academic practice. No use, distribution or reproduction is permitted which does not comply with these terms.
*Correspondence: Ho-Nam Cheung, emhhbmdobGFuNUBtYWlsLnN5c3UuZWR1LmNu, aG9mZm1hbmNoZXVuZ0BnbWFpbC5jb20=
 Juanjuan Lin1,2
 Ho-Nam Cheung