 Andrea Barone
 Maurizio Fedi
 Susi Pepe1
 Giuseppe Solaro
 Pietro Tizzani
 Raffaele Castaldo
- 1Institute for Electromagnetic Sensing of the Environment (IREA), National Research Council (CNR), Naples, Italy
- 2Department of Earth, Environmental, and Resources Science (DiSTAR), University of Naples Federico II, Naples, Italy
In this work, we propose a multi-scale approach for modeling the ground deformation field of volcanic sources. The methodology is based on the use of Multiridge and ScalFun methods to analyze the elastic deformation fields by providing source information, such as the depth, the horizontal position, and its morphological features. This strategy is alternative with respect to the classical inverse approaches since it allows overcoming some aspects of the ambiguities related to the interpretation of DInSAR measurements. Indeed, the multi-scale method does not need a priori constraints on the model parameters to achieve an unambiguous solution. First, we argue on the general physical conditions so that the deformation field, generally represented by biharmonic functions, also satisfies Laplace’s equation and the law of homogeneity. This occurs in the case of sources with hydrostatic pressure-change embedded in an elastic half-space. In these conditions, the properties of harmonic and homogeneous functions can be employed to model the ground deformation fields using multi-scale procedures. Then, we demonstrate the soundness of the proposed approach through the application of Multiridge and ScalFun methods to synthetic tests. We analyze the fields generated by spherical, pipes- and sills-like sources and consider different model settings, as the layered half-space, the noisy, and the multi-source scenarios. For all these simulations, we achieve unconstrained information related to the source geometry with satisfying accuracy. Finally, in order to show the flexibility of the multi-scale approach in different volcanic environments, we use Multiridge and ScalFun methods for analyzing DInSAR measurements relevant to Uturuncu, Okmok, and Fernandina volcanoes, retrieving information about their volcanic systems. In the first case, we point out a transient source at a depth of 4.5 km b.s.l., which is activated during 2006–2007 together with the stable and well-known Altiplano Puna Magma Body (APMB); in the second one, we retrieve a concentrated body at a depth of 3.1 km b.s.l. during 2003–2004; and in the last case, we interpret the 2013 unrest episode as caused by a pipe-like source located at a depth of 1.7 km b.s.l.
1 Introduction
The volcanic system monitoring is now accomplished by supervising the variation in space and time of different physical dimensions. The development of remote sensing technologies has allowed the ground deformation to be increasingly employed (Dzurisin, 2007). Differential SAR Interferometry (DInSAR) provides spatial and temporal dense measurements, which are suitable for modeling the changes of physical and geometrical parameters of deep and shallow volcanic reservoirs (e.g., Tizzani et al., 2015; Pepe et al., 2019; Castaldo et al., 2021; Rodriguez-Molina et al., 2021).
The most often used strategy to model DInSAR measurements for volcanic monitoring purposes is the parametric inverse modeling (e.g., Battaglia et al., 2013). This approach aims to iteratively identify the parameters of the best-fit Analytical Model (AM) (e.g., Mogi, 1958; Sun, 1969; Geerstma and Van Opstal, 1973; Okada, 1985; McTigue, 1987; Yang and Davis, 1988; Bonaccorso and Davis, 1999; Fialko et al., 2001) through the minimization of a priori selected misfit functions. The AMs expressions are usually retrieved considering the elastic framework (Love, 1906), which is just an approximation of the physical features of volcanic scenarios leading to limitations on model inferences, as well as for the case of elastic half-spaces (e.g., Hickey et al., 2016).
The interpretation of DInSAR measurements is affected by several ambiguities (Dietrick and Decker, 1975; Fialko et al., 2001; Battaglia et al., 2008; Castaldo et al., 2018; Barone et al., 2019). Indeed, this dataset generally provides a discontinuous 2D spatial picture of one or two of the three principal components of the ground deformation field, whose estimates can be also affected by instrumental and/or experimental errors. Therefore, the identification of the representative AM for the analyzed volcanic scenario can be ambiguous, unless the constraining information is available (Dietrick and Decker, 1975). Although several approaches have been proposed to choose the best-fit model (e.g., Battaglia et al., 2008), the use of a wrong representative AM could lead to an incorrect retrieval of its parameters, such as the source depth and/or pressure-change (Fialko et al., 2001). The ambiguities of the inherent nature can also occur. The immediate example is the Mogi model (Mogi, 1958). Specifically, some of its parameters (i.e., the pressure-change
In this framework, we propose an alternative approach for the modeling of DInSAR measurements in volcanic environment, which is an efficient choice over inverse methods, especially in the case of unavailability of constraining information. The methodology requires that the deformation field is expressed by harmonic and homogeneous functions. In particular, the use of multi-scale procedures, such as the Multiridge (Fedi et al., 2009) and ScalFun (Fedi, 2007) methods, is suitable for the retrieval of the source geometrical parameters, or rather the depth, horizontal position, and morphological features (e.g.: Milano et al., 2016; Paoletti et al., 2020). The approach follows the theory of Laplace’s equation (Blakely, 1996) and the homogeneity law (Olmsted, 1961), without using the iterative procedures and misfit functions minimization. With regard to the ground deformation field in volcanic environment, Castaldo et al. (2018) and Barone et al. (2019) have already applied Multiridge and Scalfun methods, reducing their validity only to the Mogi source case.
In this article, we generalize the use of multi-scale procedures to the analysis of field generated by point-spherical, pipes- and sills-like ideal sources. We first study the physical conditions such that the biharmonic deformation field (Love, 1906) also satisfies Laplace’s equation and the homogeneity laws. This allows us to take advantage of the properties of the harmonic and homogeneous functions to analyze the DInSAR measurements with a multi-scale approach. Then, we show the validity of the proposed conditions by testing the Multiridge and ScalFun methods on different numerical models simulated with the Comsol Multiphysics software (https://www.comsol.com/). We start from the investigation of the geometrical parameters of spherical, pipe- and sill-like sources by analyzing the synthetic vertical and E-W deformation components. Subsequently, we consider the additional model settings as the source embedded in a layered elastic half-space, the case with random noise and the multi-source scenario. We also employ the
We apply the Multiridge and ScalFun methods to analyze the deformation patterns retrieved by DInSAR measurements of the three American volcanoes characterized by different geodynamic settings and geochemical features. We study the vertical deformation related to the 2006–2007 uplift event occurred at Uturuncu volcano (Bolivia), retrieved by ENVISAT satellite data, in order to better characterize the transient shallow source with the ScalFun method. At Okmok volcano (Aleutian Islands of Alaska, United States), we analyze the vertical derivatives of descending LOS deformation to assess the scale-invariance vs.
Finally, we discuss our results in relation to the available geological/volcanic models and to the interpretations of geophysical/geodetic data, highlighting the advantages, limitations, and future developments of the proposed multi-scale approach.
2 Materials and Methods
The multi-scale approach is based on the analysis of the variation of the ground deformation field at different scales, where the term scale is referred to the distance between the field source and the measurement surface. In this work, we refer to source distributions that have their support at just one point, known as ideal sources (e.g., Fedi et al., 2015; Vitale and Fedi 2020). Examples related to the volcanic deformations are the point-spherical source (3D concentrated body), whose properties have been already analyzed by Castaldo et al. (2018); the pipe-like source, which generally is nonconcentrated along the
In this section, we treat the general physical conditions so that the biharmonic deformation field satisfies Laplace’s equation and the homogeneity law. Then, we describe the used multi-scale methods.
2.1 Harmonic Properties of the Deformation Field
A scalar function
and the deformation field
To understand for which conditions Eq. 2 is satisfied, we consider Navier’s relation for equilibrium under surface traction (Love, 1906),
where,
and we divide both the members by
Therefore,
At this stage, we consider the strain-stress relations expressed by Hooke’s Law (Sadd, 2005),
and, by substituting them into Eq. 6,
we get:
that is
where,
In the framework of deforming volcanic bodies, Eq. 11 is always satisfied for a hydrostatic pressure-change within the source embedded in a homogeneous elastic half-space.
The harmonic functions enjoy two crucial field transformations in the wavenumber domain: the upward continuation and the vertical differentiation (Blakely, 1996). The upward continuation is used to form the multi-scale deformation 3D spatial dataset starting from the 2D spatial measured data (i.e., DInSAR measurements). The upward continued field
where,
The vertical differentiation of order
2.1.1 Multiridge Method
The method is based on the analysis of the so-called ridges, i.e., the lines formed by joining the zeros of the field and its derivatives at several scales (multiridge subset). The ridges intersection provides information on the field source position (Fedi et al., 2009).
Since the method is based on a level-to-level approach (Fedi et al., 2009) and the measurement surface of the DInSAR data (topography) is uneven, the first step is the upward continuation from the uneven surface to a flat one, called draped-to-flat continuation. We numerically generate a ground deformation field that could have been measured as relocated onto a constant measurements level (Castaldo et al., 2018). This is performed in the continuous wavelet transform (CWT) domain (Ridsdill-Smith and Dentith, 1999). A 3D spatial multi-scale dataset is then generated through the flat-to-flat upward continuation (Blakely, 1996) to a set of different scales, in agreement with Eq. 12.
The second step is based on searching out the zeros of the vertical (multiridge subset I) and horizontal (multiridge subset II) derivatives of the deformation field at different scales
where
The following ridges equations are then retrieved since
Equations 17–19 are simple straight lines, which intersect each other at the source’s center
In the third step, the best-fit linear regressions of the multiridge subsets allow the identification of the ridges, and the retrieval of their intersections gives back the source position. Equations 14–19 show that ridges intersections occur at the body center for the point-spherical sources. However, ridges intersections can indicate the different features of the analyzed body, such as the top or the boundaries of the pipe- and sill-like sources.
In the last step, we evaluate the uncertainties of the estimated parameters, as follows: (i) for each multiridge subset, we calculate the linear regression
2.2 Homogeneity Properties of Deformation Field
A homogeneous function
where,
where,
The homogeneity properties reflect the type of field source. In the case of the harmonic deformation field, which is the first-order derivative of a Newtonian potential, we get the homogeneity degree of the source
and, in turn, the structural index of the source
2.2.1 Scalfun Method
This method is based on the properties of the scaling function, which is particularly suited to analyze a multi-scale dataset. Let us consider the
where
which means that when
Therefore, by using in Eq. 25 the estimated depth
The uncertainties related to the estimates of
3 Results
3.1 Application to Synthetic Deformation Fields
We show the validity of the multi-scale approach by applying Multiridge and ScalFun methods to synthetic deformation fields. We simulate both harmonic and nonharmonic fields using a Finite Element (FE) approach (COMSOL Multiphysics software), which allows us to model different scenarios or to accurately reproduce fields satisfying the Eq. 11 and Laplace’s equation (Eq. 2).
We consider the simple and geometrically finite sources, characterized by hydrostatic
We start from the analysis of the vertical deformation components (
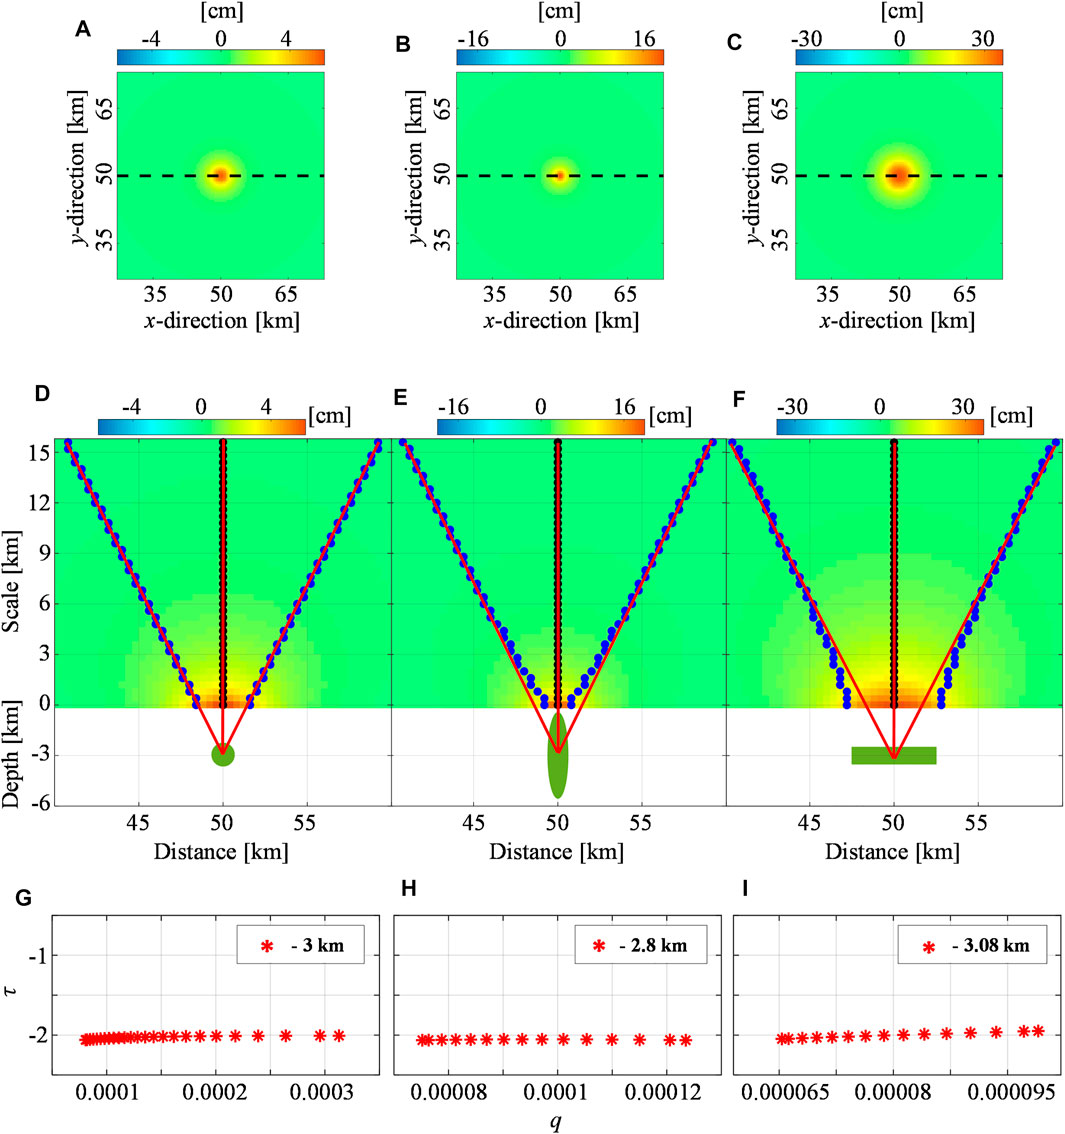
FIGURE 1. Spherical, pipe-, and sill-like synthetic sources: vertical deformation. Modeled vertical component (
We also analyze these cases using the vertical differentiation of the ground deformation field. We calculate the first-order vertical derivatives (
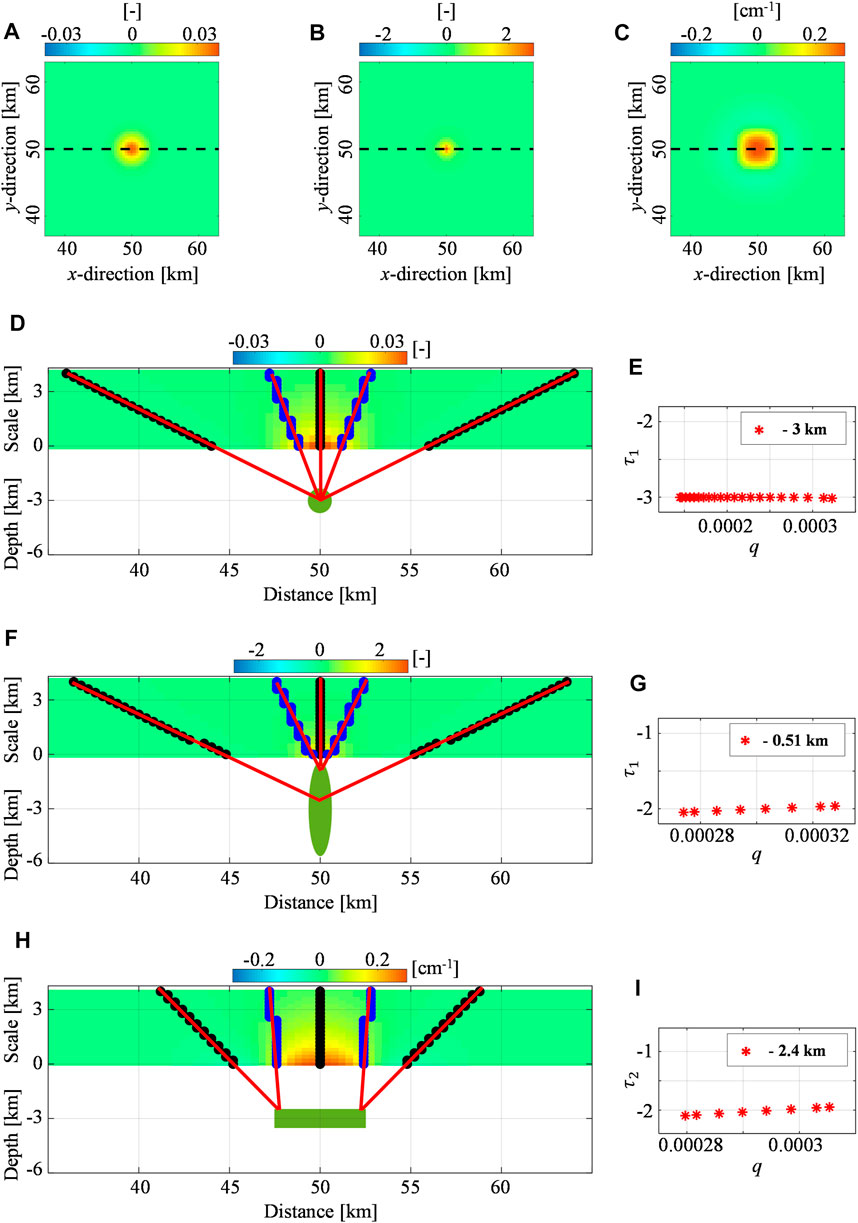
FIGURE 2. Spherical, pipe-, and sill-like synthetic sources: vertical derivative of the vertical deformation. (A,B) First-order (
Similar considerations occur by analyzing the E-W deformation components and their vertical derivatives, whose results are reported in Supplementary Figures S2, S3.
For what concern the layered scenario (IV), we analyze the vertical component (Figure 3A) of the deformation (
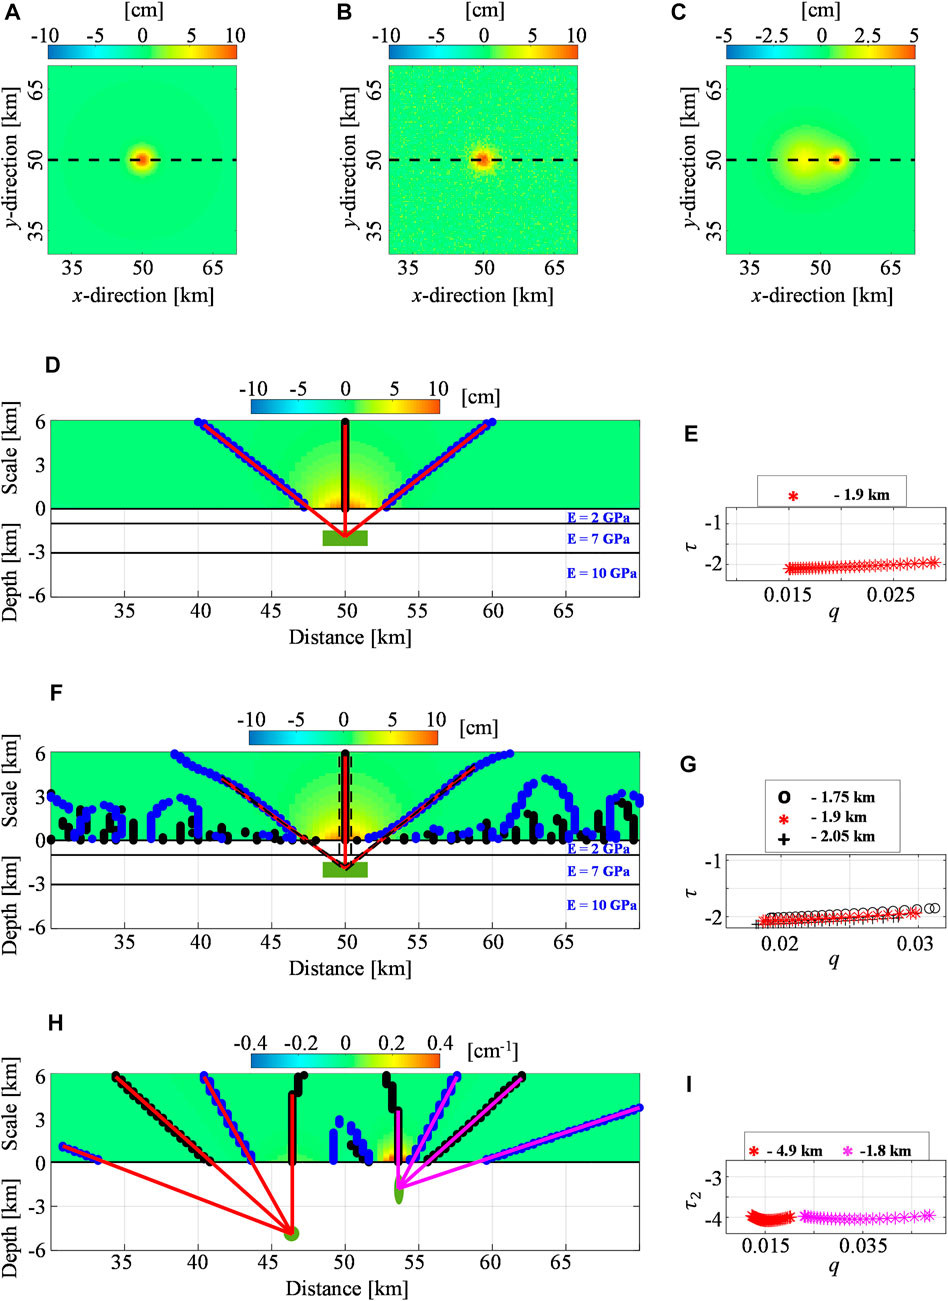
FIGURE 3. Layered half-space, noisy, and multi-source synthetic cases. The modeled vertical component related to the (A) layered half-space case, (B) noisy test, and (C) multi-source scenario. The black dashed lines indicate the positions of the analyzed profiles. The Multiridge and ScalFun methods applied to the (D,E) layered half-space case, (F,G) noisy test, and (H,I) multi-source scenario. Vertical deformations and vertical derivatives are also shown at different scales
A summary of the performed tests is reported in Table 1.
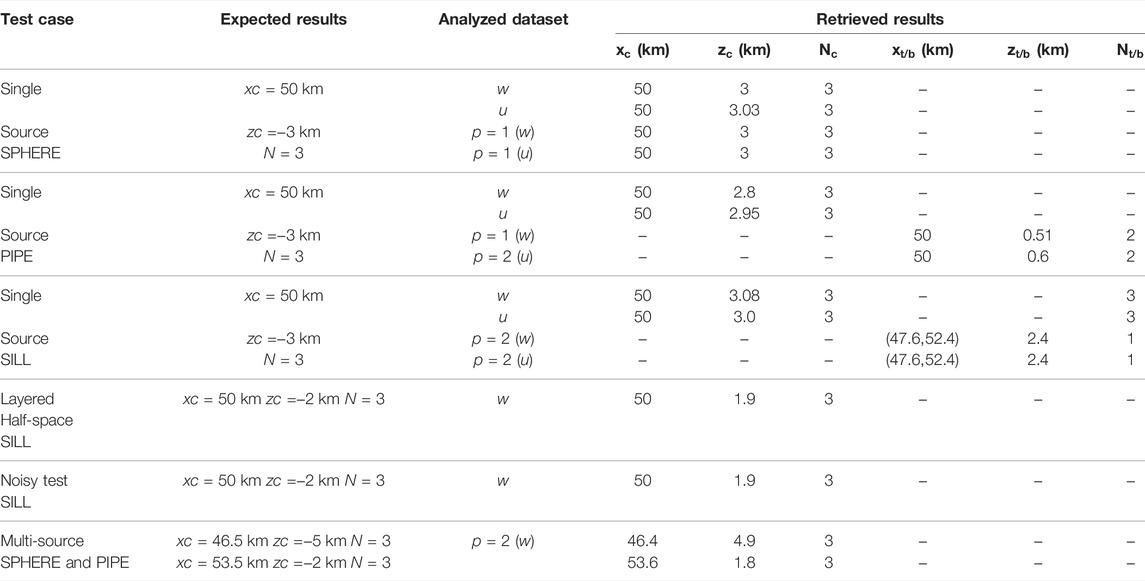
TABLE 1. Summary of application to synthetic cases. w, u, and p are related to the analyzed dataset and stand for the vertical, EW components, and the order of the analyzed vertical derivative of the synthetic ground deformation field, respectively. x, z, and N indicate the horizontal coordinates, the depth, and the structural index parameters, while the subscripts c and t/b are related to the center and top/boundaries of the source, respectively.
3.2 Application to Real Cases
3.2.1 Uturuncu Volcano
Uturuncu volcano (Figure 4) lies on a large continental crustal magma body and its magmatism is the result of eastwards subduction of the Nazca oceanic plate beneath the South American continent (de Silva and Gosnold, 2007). It is a long-dormant effusive stratovolcano located at almost the center of the largest up doming zone on the Earth, the Altiplano-Puna Volcanic Complex (APVC) (Gottsmann et al., 2017). This site has been studied within the interdisciplinary PLUTONS project (Pritchard et al., 2018) through the analysis of different datasets. Both the geophysical and geochemical studies have highlighted the deep Altiplano-Puna Magma Body (APMB) (Allmendinger et al., 1997; Schmitz et al., 1997; Schilling et al., 1997; Chmielowski et al., 1999; Zandt et al., 2003; Sparks et al., 2008; del Potro et al., 2013; Ward et al., 2014; Comeau et al., 2015; Comeau et al., 2016; Perkins et al., 2016; Kukarina et al., 2017; Ward et al., 2017; McFarlin et al., 2017), whose role in producing the observed multi-decade decimeter-scale deformation signal is surely crucial. Indeed, several authors have interpreted InSAR measurements by modeling the deformation field through a deep source with different geometry associated to the APMB (Pritchard and Simons, 2002; Pritchard and Simons, 2004; Fialko and Pearse, 2012; Henderson and Pritchard, 2013; Hickey et al., 2013; Walter and Motagh, 2014; Gottsmann et al., 2017; Henderson and Pritchard, 2017; Barone et al., 2019). In addition to this, geochemical, petrological, and geophysical analyses have also supported the existence of shallow magma storage (Sparks et al., 2008; Jay et al., 2012; Muir et al., 2014; Alvizuri and Tape, 2016; Comeau et al., 2016), despite the condition that related deformation source may have transient nature (Lau et al., 2018). Accordingly, Barone et al. (2019) have analyzed the 2005–2008 ENVISAT DInSAR time-series through a combination of the cross-correlation analysis and Multiridge method to delineate a multisource scenario, consisting of the deep APMB source and a transient shallow one.
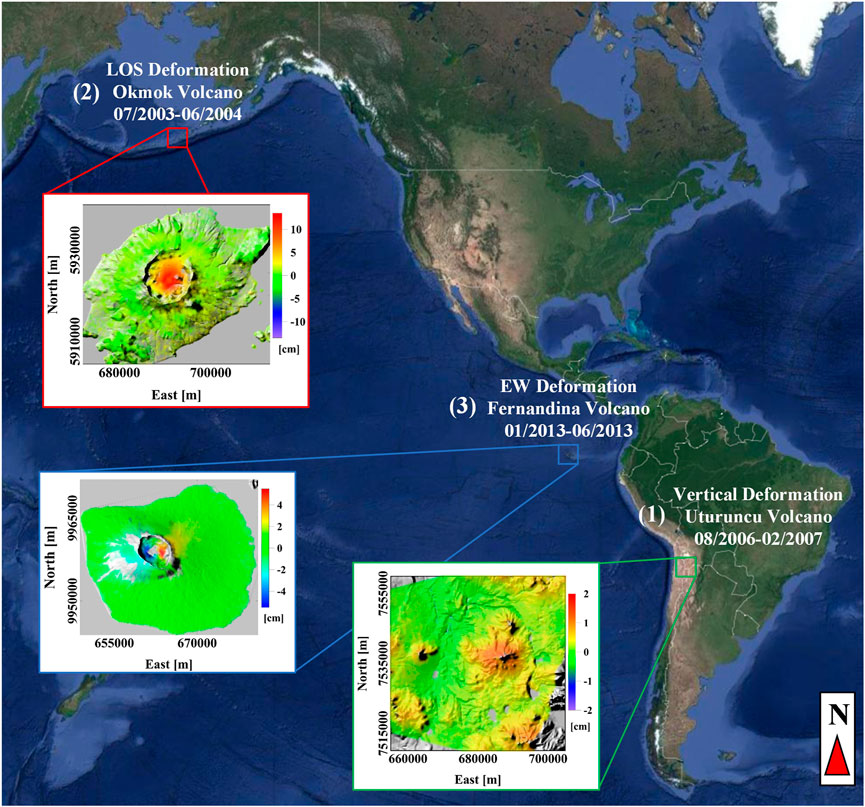
FIGURE 4. Unrest volcanoes case studies. The geographic location and DInSAR measurements of the three volcanic sites considered for the application of the Multiridge and ScalFun methods: (1) Uturuncu volcano and the related cumulative vertical deformation recorded between 08/2006 and 02/2007 (dataset from Barone et al., 2019); (2) Okmok volcano and the related LOS deformation recorded in the time interval 07/2003–06/2004 along descending orbit (dataset from Castaldo et al., 2018); and (3) Fernandina volcano and the related cumulative E-W deformation recorded between 01/2013 and 06/2013 (dataset from Pepe et al., 2017).
In this work, we use the multi-scale approach to analyze the same dataset (Figure 4) of Barone et al. (2019) related to the August 2006 - February 2007 unrest by focusing our study on the characterization of the shallow transient source through the use of the ScalFun method. We consider the cumulative vertical deformation (
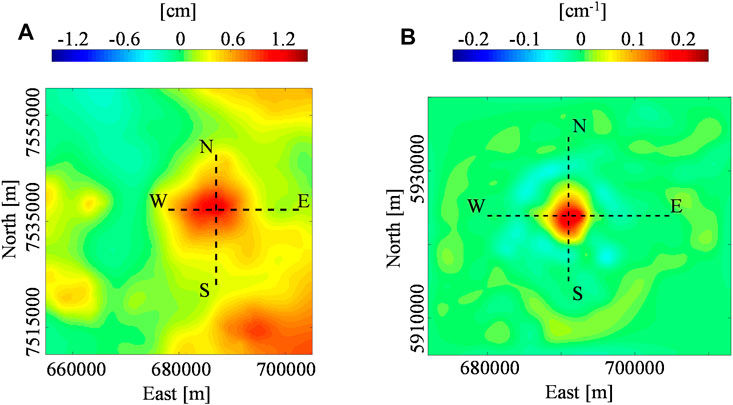
FIGURE 5. Deformation maps at Uturuncu and Okmok volcano. (A) Uturuncu volcano: cumulative vertical deformation referred to the 6.5 km a.s.l. scale and recorded in the time interval 08/2006–02/2007. (B) Okmok volcano: second-order vertical derivative of the LOS deformation referred to the 2 km a.s.l. scale and recorded in the time interval 07/2003–06/2004 along the descending orbit.
In Figure 6, we show the results of our application by considering the E-W and N-S profiles (black dashed lines in Figure 5A). Specifically, we analyze the 3D spatial multi-scale dataset up to the
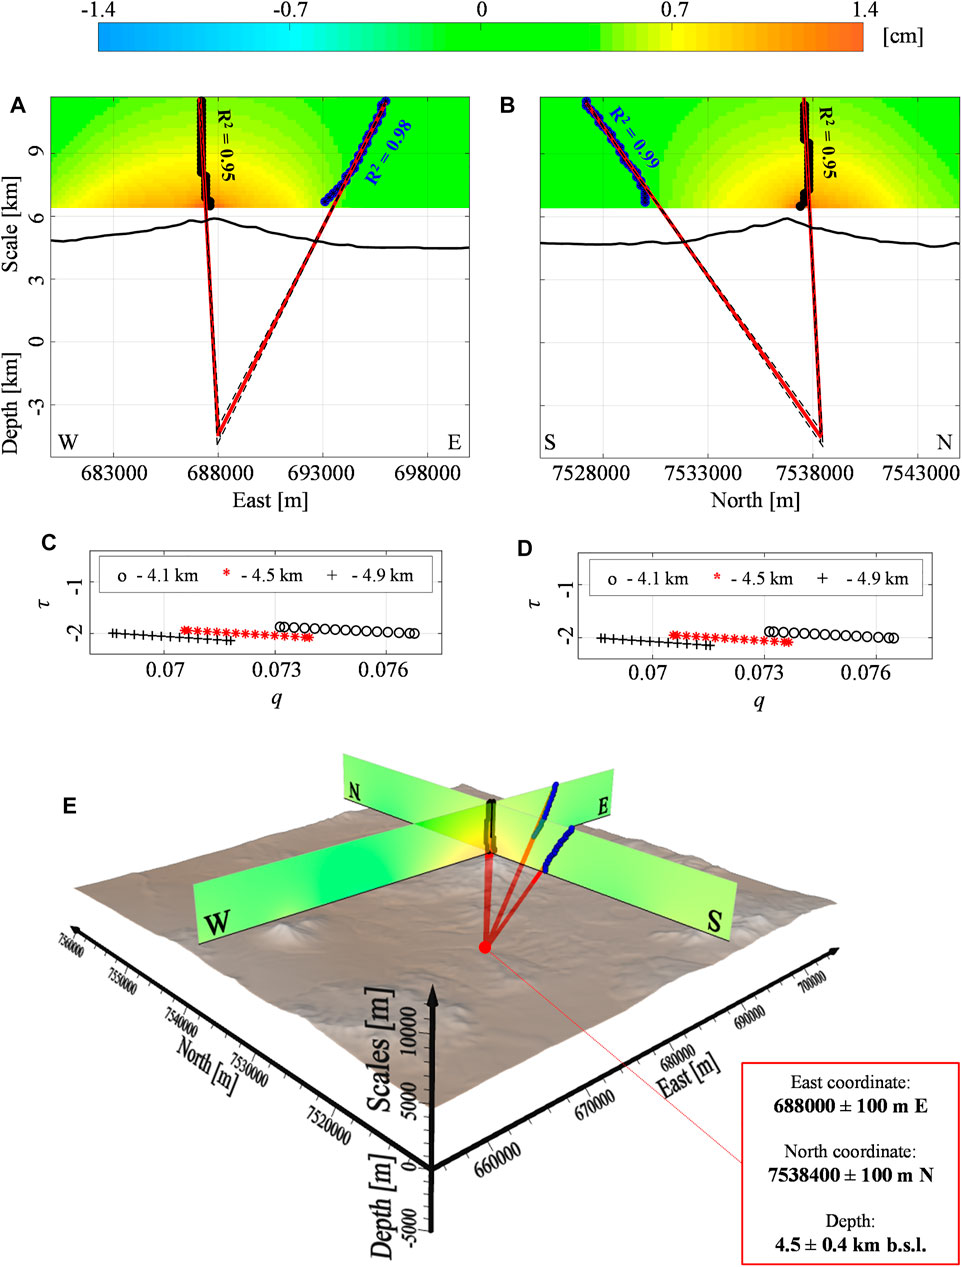
FIGURE 6. Uturuncu volcano: vertical deformation. The Multiridge method along the (A) W-E and (B) S-N oriented sections of the vertical component (
3.2.2 Okmok Volcano
Okmok volcano (Figure 4) is located on the oceanic crust as the results of the subduction between the Pacific and North American plates. It is an active basaltic shield volcano located at the north-eastern part of the Umnak Island in Alaska, US (Finney et al., 2008). For this site, the deformation data has provided consistent information through the source modeling of the unrest phenomena that occurred before the 2008 eruption. Several authors have used different approaches and modeled the deformation source through spherical geometries and the Mogi source at a depth of 3–4 km b.s.l. (e.g.: Lu et al., 2005; Masterlark et al., 2010; Biggs et al., 2010; Masterlark et al., 2012; Castaldo et al., 2018; Xue et al., 2020). In particular, Castaldo et al. (2018) have already considered the multi-scale approach to study the LOS deformation acquired by the ENVISAT satellite along the descending orbit during the period July 2003—June 2004 by retrieving a Mogi source at −3.4 km b.s.l.
In this framework, we consider the dataset presented by Castaldo et al. (2018) and apply the vertical differentiation operator. We calculate a regular grid (natural neighbor interpolator) with 100 m sampling step and compute the second-order (
In Figure 7, we show the results along the E-W and N-S sections (black dashed lines in Figure 5B) of a 3D spatial multi-scale dataset up to the 12 km a.s.l. scale. We identify the ridges intersection at −3.1 ± 0.4 km b.s.l. depth with UTM coordinate at 691000 ± 100 m E and 5924000 ± 200 m N (Figures 7A,B). This solution is characterized by the ScalFun method with
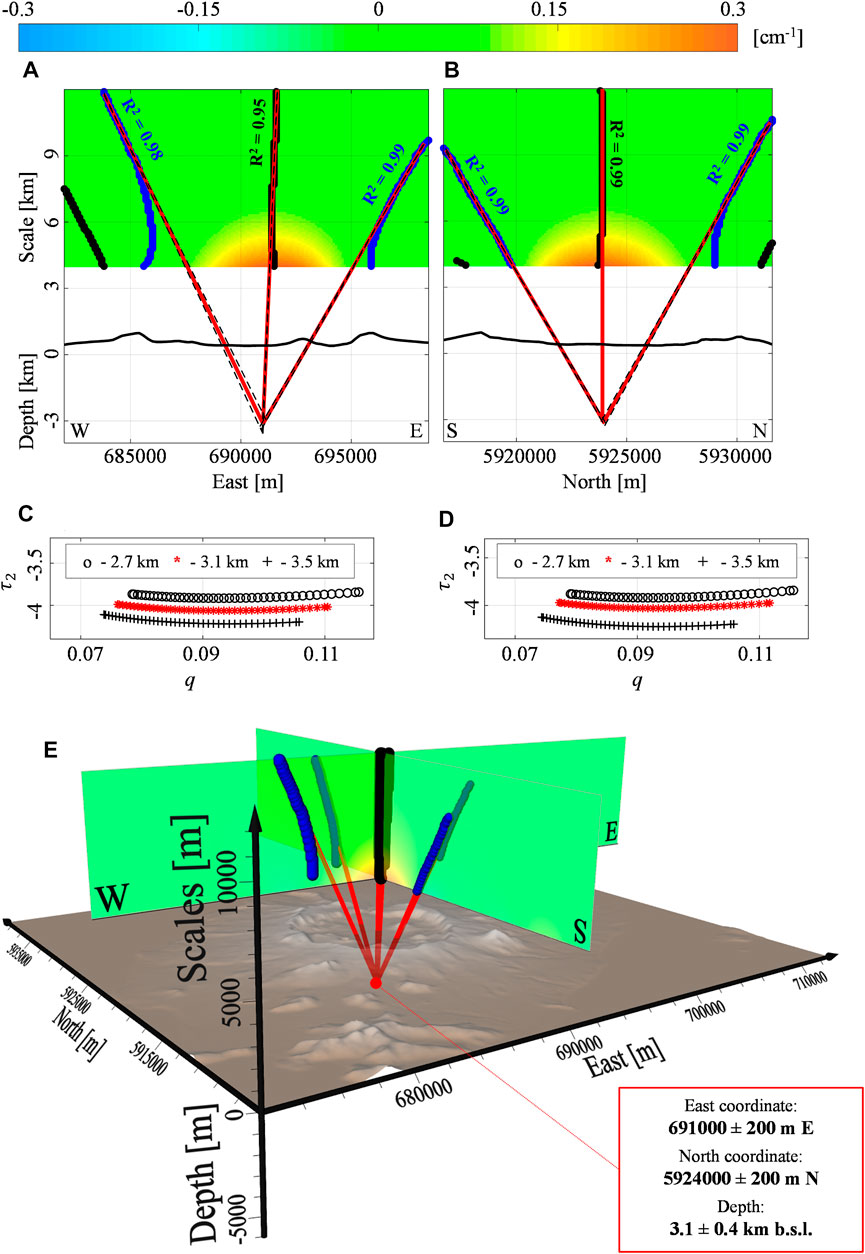
FIGURE 7. Okmok volcano: second-order vertical derivative of LOS deformation. The Multiridge method along the (A) W-E and (B) S-N oriented sections of the second-order (
3.2.3 Fernandina Volcano
Fernandina Volcano, located on the Nazca Plate (Figure 4), is one of the most active centers of the Galapagos Archipelago that mainly erupts tholeiitic basalt (McBirney and Williams, 1969). Several authors have used both the DInSAR and GPS measurements for modeling its volcanic system using the source mechanism as sills and dikes (Jonsson et al., 1999; Chadwick et al., 2011; Bagnardi and Amelung, 2012). The most suitable deformation model seems to be a shallow dipping sill intrusion at about 1 km b.s.l. (Bagnardi and Amelung, 2012). This model is able to match well with the volcanic and structural features as the change of the eruptive fissures orientations from sub-horizontal to vertical, which occurs if the feeding of the circumferential fissures is near the caldera margin or when a twist feeds fissure eruptions on the flanks (Bagnardi et al., 2013; Corbi et al., 2015). Moreover, a deep magmatic reservoir is also pointed out at about 5 km b.s.l. and it is hydraulically connected with the shallower one (Bagnardi and Amelung, 2012). Indeed, Pepe et al. (2017) have proposed a pipe-like source with a depth of 1.5 km b.s.l. to model the 2012–2013 unrest event. This result has been associated with mechanisms of magma migration from the deep cumulate complex to shallow the volcanic reservoirs within the same magmatic feeding system.
In this scenario, we start from the same processed SAR images (COSMO-SkyMed satellite images) by Pepe et al. (2017) and apply the multi-scale approach. The dataset (Figures 8A,B) shows an unrest with the vertical and E-W mean velocity of
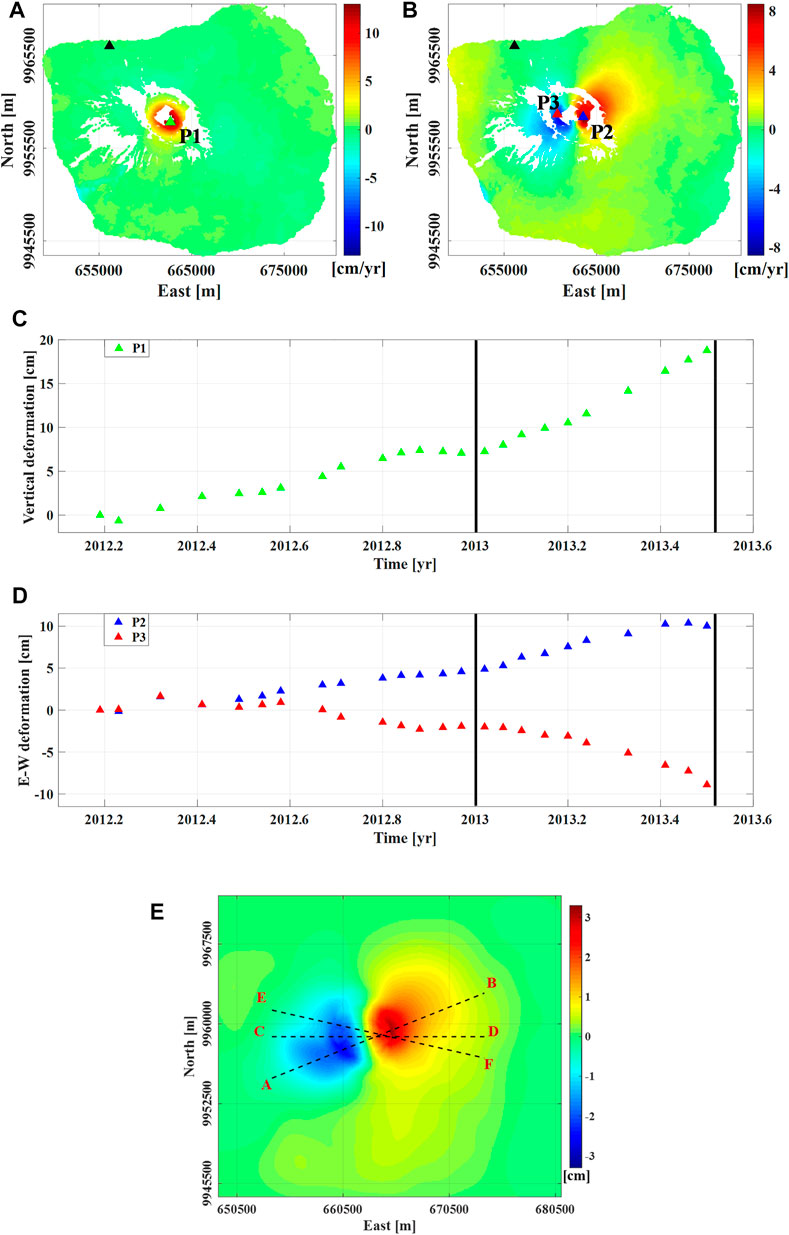
FIGURE 8. DInSAR measurements at Fernandina volcano. The mean (A) vertical and (B) E-W velocity related to the time interval 2012–2013.5; black triangles indicate the reference pixel, while the green, blue, and red triangles the location of P1, P2, and P3 pixels, respectively. (C) Vertical and (D) E-W components of the deformation measured during the 2012–2013.5 time interval at P1 and P2-P3 pixels, respectively; black vertical continuous lines represent the selected temporal period. (E) Cumulative E-W deformation referred to the 1.5 km a.s.l. scale and recorded in the time interval 01/2013–06/2013. UTM-WGS84 projection zone: 15S.
We make some comments by considering the CD profile (black dashed lines in Figure 8E), which is E-W oriented. The application of the Multiridge method to the first-order vertical derivative shows that the ridges intersect at the point coordinates (662700 E ± 100 m, 9958800 N m) with 1.7 ± 0.4 km b.s.l. depth (Figure 9A). We apply the ScalFun method to both the left and right multiridge subset II by characterizing the solution with
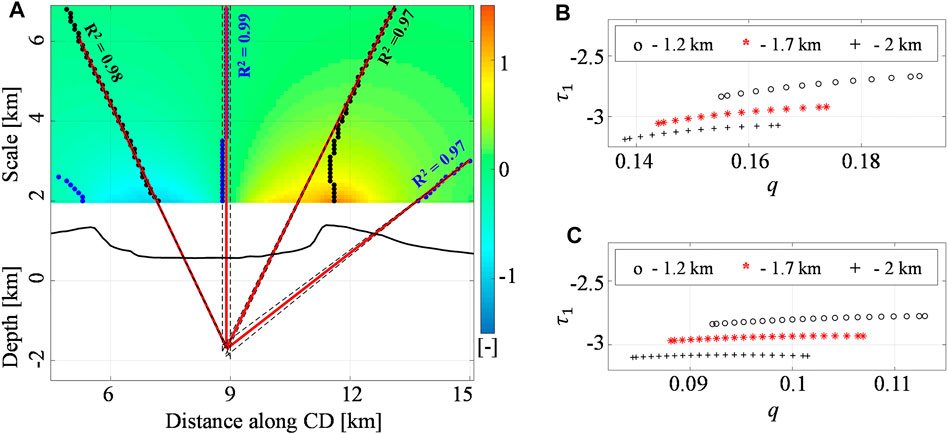
FIGURE 9. Fernandina volcano: the first-order vertical derivative of E-W deformation. (A) The Multiridge method along the CD section of the first-order (
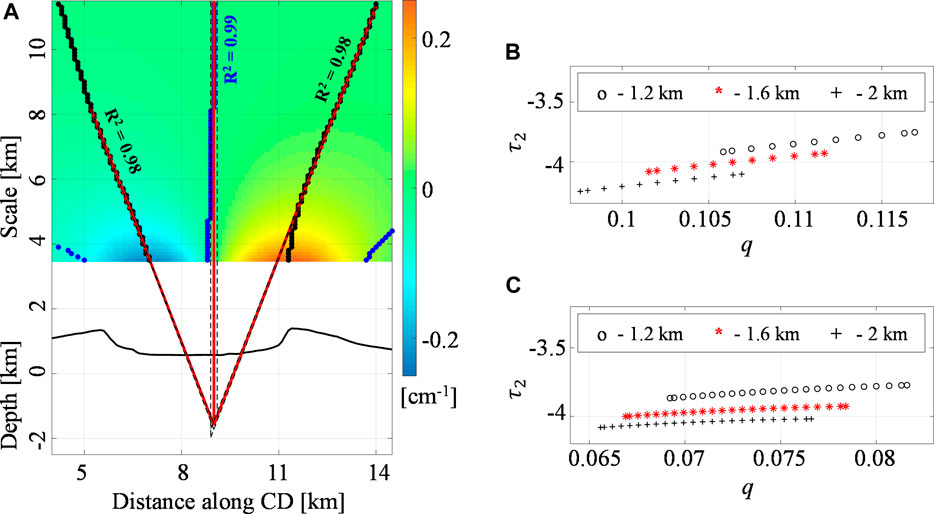
FIGURE 10. Fernandina volcano: the second-order vertical derivative of E-W deformation. (A) The Multiridge method along the CD section of the second-order (
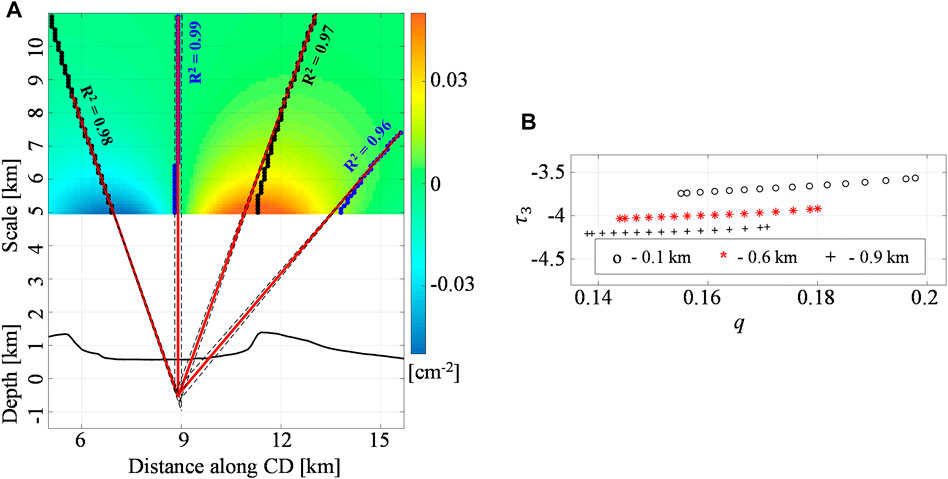
FIGURE 11. Fernandina volcano: the third-order vertical derivative of E-W deformation. (A) The Multiridge method along the CD section of the third-order (
We carry out the analogous analyses by considering the other AB and EF profiles, which results for each order
We summarize the retrieved results in Table 2.
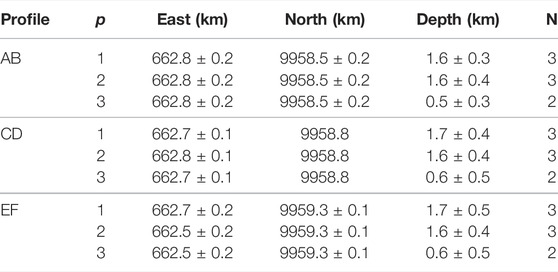
TABLE 2. Source solutions for Fernandina volcano retrieved in this study.
4 Discussion
In this work, we use the multi-scale approach to analyze DInSAR measurements and model the deformation sources in several volcanic environments. The proposed procedure is based on the harmonic and homogeneous properties of the deformation field, which has to satisfy Laplace’s equation and the homogeneity law. In these conditions, we employ the Multiridge and ScalFun methods to retrieve the unconstrained geometrical information, such as the depth, the horizontal position, and the morphological features, by considering the properties of point-spherical, pipe-, and sill-like ideal sources. Despite some limitations affecting the multi-scale approach, it represents an alternative strategy with respect to the classical optimization/inverse methods since its solutions do not depend on a priori constraints of model parameters.
In this section, we will discuss the validity of the proposed multi-scale approach through: (1) theoretical argumentations, (2) application to synthetic deformation fields, and (3) different real cases.
4.1 Theory and Methods
We focus on the conditions for which the pressurized volcanic bodies generate a harmonic and homogeneous ground deformation field. In this framework, we show that Laplace’s equation and the homogeneity law are surely satisfied in the case of hydrostatically pressurized sources embedded in a homogeneous elastic half-space. It is well-known that these conditions are just an approximation of the real volcanic scenario (e.g., Gudmundsson, 2006; Hickey et al., 2016), as well as the case of many AMs. One of these is the Mogi model (Mogi, 1958). Its analytical expression is represented by the gradient of a Newtonian potential in the form
Here, we show that the proposed multi-scale strategy is based on two methods: The Multiridge method provides information on the center of deformation sources by evaluating the ridges intersection, which can also occur, for the pipes, sills, and dykes, at their top and/or boundaries. The ScalFun method characterizes the source shape through the estimates of the structural index
4.2 Application to Synthetic Tests
We perform several tests on the simulated harmonic and homogeneous fields. In particular, we analyze the vertical and E-W deformation components. Although the simulated N-S one should be available, we do not consider it since this study is conceived for the analysis of DInSAR measurements, which do not provide this information, due to the near-polar orbit of the SAR sensors. However, the harmonic and homogeneous properties of the deformation field also allow the involvement of the LOS components in the framework of the multi-scale procedure (Castaldo et al., 2018). In addition to the field component, we employ their vertical differentiations of order
It is worth noting that our simulations have shown that the Multiridge and ScalFun methods are valid tools to study the harmonic deformation fields of homogeneous sources. They have provided, in the worst cases, estimates on the depth to the source center affected by
We obtain comparable errors on source parameters by analyzing the nonharmonic fields, generated by a sill embedded in a layered half-space (IV) and with the same random noise (V). In both the simulations, we retrieve the source depth to the center with only 5% error with respect to the expected values. This finding demonstrates that the Multiridge and ScalFun methods in the same conditions can be extended to the analysis of nonharmonic fields, as in the case of layered heterogeneous medium with weak physical parameters contrasts. Furthermore, we observe that the noisy dataset does not affect the multi-scale results, at least for the source center estimate.
Finally, with the last test (VI), we show the flexibility of the proposed methodology, which can be also used to analyze a multi-source scenario. This occurs by exploiting the vertical derivatives of the field that allow us to detect the parameters of both the modeled sources, with a maximum estimated error of 10% at the depth to the center.
4.3 Application to Real Cases
We use the Multiridge and ScalFun methods for analyzing three different American volcanoes. We show the applicability of the multi-scale approach in different volcanic environments, since the same geodynamics settings and geochemical features do not characterize the considered systems.
Unlike the previous synthetic cases, we evaluate
We perform the first application at Uturuncu volcano (Bolivia), which is located on the largest updoming zones on the Earth. In this framework, it is well known that the deep APMB source has a crucial role for the observed multi-decade decimeter-scale deformation signal (Allmendinger et al., 1997; Schmitz et al., 1997; Schilling et al., 1997; Chmielowski et al., 1999; Pritchard and Simons, 2002; Zandt et al., 2003; Pritchard and Simons, 2004; Sparks et al., 2008; Fialko and Pearse, 2012; del Potro et al., 2013; Henderson and Pritchard, 2013; Hickey et al., 2013; Walter and Motagh, 2014; Ward et al., 2014; Comeau et al., 2015; Comeau et al., 2016; Perkins et al., 2016; Gottsmann et al., 2017; Kukarina et al., 2017; Ward et al., 2017; McFarlin et al., 2017; Henderson and Pritchard, 2017; Pritchard et al., 2018; Barone et al., 2019), despite the evidences of geophysical, seismological, and petrological data analyses also highlighting the hypothesis of shallow sources (Sparks et al., 2008; Jay et al., 2012; Muir et al., 2014; Alvizuri and Tape, 2016; Comeau et al., 2016; Lau et al., 2018; Barone et al., 2019). We study the cumulative vertical deformation related to the transient 2007 unrest, for which the AMPB is supposed to be not responsible of the observed ground deformation field (Barone et al., 2019). Our results infer the depth to the source center of 4.5 km b.s.l., with a structural index
We perform the second analysis at Okmok volcano (Alaska, United States), where the multi-scale approach has been already applied to the single LOS component. In this work, we consider the same dataset of Castaldo et al. (2018), but we apply the Multiridge and ScalFun methods to its second-order vertical derivative. Here, the higher resolution analysis shows the scale-invariance vs.
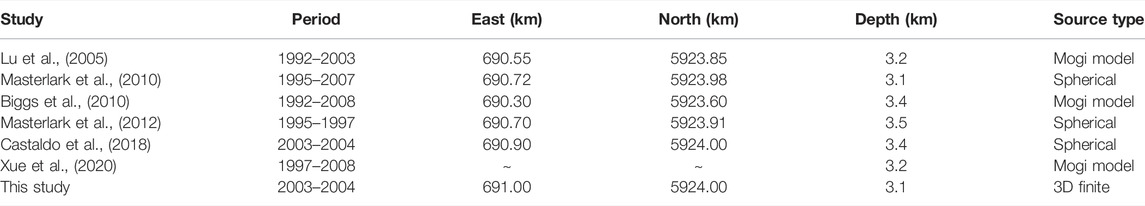
TABLE 3. Source locations for Okmok volcano. Depths are b.s.l.
Finally, we apply the multi-scale methods to evaluate the depth, horizontal location, and morphological features of the deformation source related to the 2013 unrest at Fernandina volcano. Different from the previous real cases, we analyze the E-W deformation component. We specify that the coherent measurement points (Figure 8A) are not well distributed at the summit caldera (uncorrelated signals), where the maximum vertical deformation is expected. A better data distribution is observed at the volcano flanks, where the maxima and minima of the E-W deformation anomaly are located. Our findings point out two clusters of solutions with different
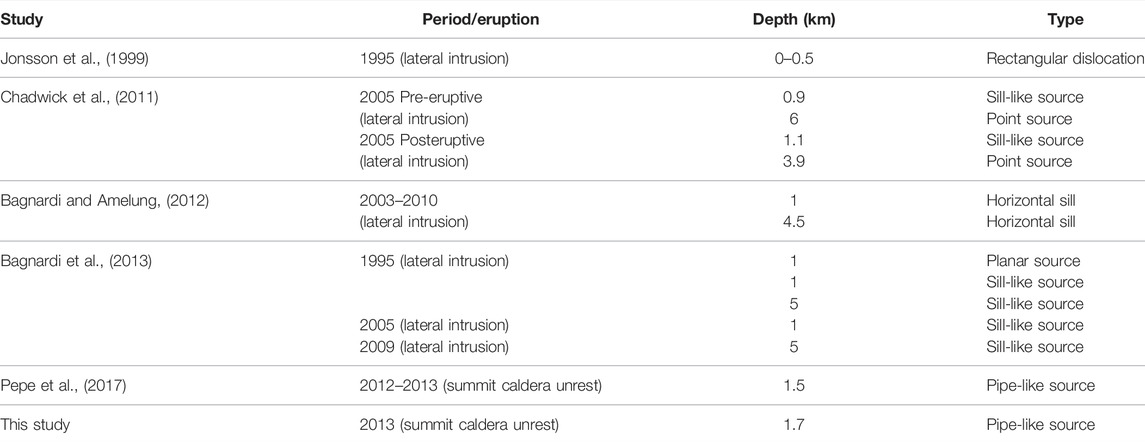
TABLE 4. Source locations for Fernandina volcano. Depths are b.s.l.
4.4 Concluding Remarks
We conclude the work by listing the main features of the proposed multi-scale approach.
The methodology represents an alternative procedure with respect to the optimization/inverse methods, which, differently from our approach, generally need to fix information, such as the medium elastic parameters, the source physical parameters, and its geometry.
The methods provide an unconstrained source geometrical model, while they do not provide information on the source physical parameters. Their results can also be used as constraints for the inverse/optimization modeling procedures, aiming at estimating a more complete set of source parameters.
The methods are suitable to:
• Analyze any deformation components;
• Perform high-resolution analyses by using the vertical differentiation operator;
• Model multi-source cases;
and their results:
• Do not depend on lower variations of the physical parameters of the elastic half-space;
• Are stable vs. noise.
Although the presented multi-scale approach is restricted to the analysis of sources as point-spherical, pipe-, and sill-like ones, future developments will concern the use of Multiridge and ScalFun methods in the case of sources with complex geometry.
Data Availability Statement
The data analyzed in this study is subject to the following licenses/restrictions: The datasets can be accessed by contacting the corresponding author. Requests to access these datasets should be directed to Y2FzdGFsZG8uckBpcmVhLmNuci5pdA==.
Author Contributions
AB: validation, writing the original draft. MF: supervision, review and editing. SP: data curation. GS: data curation, review and editing. PT: supervision, review and editing. RC: conceptualization, supervision, review and editing.
Funding
This work has been supported by the projects DTA.AD003.433—PRIN 2017—FLUIDs and DTA.AD004.286 “Accordo 2019–2021 Dipartimento Protezione Civile e CNR—IREA”.
Conflict of Interest
The authors declare that the research was conducted in the absence of any commercial or financial relationships that could be construed as a potential conflict of interest.
Publisher’s Note
All claims expressed in this article are solely those of the authors and do not necessarily represent those of their affiliated organizations, or those of the publisher, the editors, and the reviewers. Any product that may be evaluated in this article, or claim that may be made by its manufacturer, is not guaranteed or endorsed by the publisher.
Acknowledgments
We would like to thank the Editor and the reviewers for critically reviewing the manuscript and providing valuable comments to improve the quality of the manuscript.
Supplementary Material
The Supplementary Material for this article can be found online at: https://www.frontiersin.org/articles/10.3389/feart.2022.859479/full#supplementary-material
References
Allmendinger, R. W., Jordan, T. E., Kay, S. M., and Isacks, B. L. (1997). The Evolution of the Altiplano-Puna Plateau of the central Andes. Annu. Rev. Earth Planet. Sci. 25, 139–174. doi:10.1146/annurev.earth.25.1.139
Alvizuri, C., and Tape, C. (2016). Full Moment Tensors for Small Events (Mw. Geophys. J. Int. 206, 1761–1783. doi:10.1093/gji/ggw247
Bagnardi, M., Amelung, F., and Poland, M. P. (2013). A New Model for the Growth of Basaltic Shields Based on Deformation of Fernandina Volcano, Galápagos Islands. Earth Planet. Sci. Lett. 377-378, 358–366. doi:10.1016/j.epsl.2013.07.016
Bagnardi, M., and Amelung, F. (2012). Space-geodetic Evidence for Multiple Magma Reservoirs and Subvolcanic Lateral Intrusions at Fernandina Volcano, Galápagos Islands. J. Geophys. Res. 117, B10406. doi:10.1029/2012JB009465
Barone, A., Fedi, M., Tizzani, P., and Castaldo, R. (2019). Multiscale Analysis of DInSAR Measurements for Multi-Source Investigation at Uturuncu Volcano (Bolivia). Remote sensing 11, 703. doi:10.3390/rs11060703
Battaglia, M., Cervelli, P. F., and Murray, J. R. (2013). dMODELS: A MATLAB Software Package for Modeling Crustal Deformation Near Active Faults and Volcanic Centers. J. Volcanology Geothermal Res. 254, 1–4. doi:10.1016/j.jvolgeores.2012.12.018
Battaglia, M., Gottsmann, J., Carbone, D., and Fernández, J. (2008). 4D Volcano Gravimetry. Geophysics 73, WA3–WA18. doi:10.1190/1.2977792
Biggs, J., Lu, Z., Fournier, T., and Freymueller, J. T. (2010). Magma Flux at Okmok Volcano, Alaska, from a Joint Inversion of Continuous GPS, Campaign GPS, and Interferometric Synthetic Aperture Radar. J. Geophys. Res. 115, B12401. doi:10.1029/2010JB007577
Blakely, J. R. (1996). Potential Theory in Gravity and Magnetic Applications. revised ed. Cambridge: Cambridge University Press.
Bonaccorso, A., and Davis, P. M. (1999). Models of Ground Deformation from Vertical Volcanic Conduits with Application to Eruptions of Mount St. Helens and Mount Etna. J. Geophys. Res. 104 (B5), 10531–10542. doi:10.1029/1999JB900054
Castaldo, R., Barone, A., Fedi, M., and Tizzani, P. (2018). Multiridge Method for Studying Ground-Deformation Sources: Application to Volcanic Environments. Sci. Rep. 8, 13420. doi:10.1038/s41598-018-31841-4
Castaldo, R., Tizzani, P., and Solaro, G. (2021). Inflating Source Imaging and Stress/Strain Field Analysis at Campi Flegrei Caldera: The 2009-2013 Unrest Episode. Remote Sensing 13 (12), 2298. doi:10.3390/rs13122298
Chadwick, W. W., Jónsson, S., Geist, D. J., Poland, M., Johnson, D. J., Batt, S., et al. (2011). The May 2005 Eruption of Fernandina Volcano, Galápagos: The First Circumferential dike Intrusion Observed by GPS and InSAR. Bull. Volcanol. 73 (6), 679–697. doi:10.1007/s00445-010-0433-0
Chmielowski, J., Zandt, G., and Haberland, C. (1999). The Central Andean Altiplano-Puna Magma Body. Geophys. Res. Lett. 26 (6), 783–786. doi:10.1029/1999GL900078
Comeau, M. J., Unsworth, M. J., and Cordell, D. (2016). New Constraints on the Magma Distribution and Composition beneath Volcán Uturuncu and the Southern Bolivian Altiplano from Magnetotelluric Data. Geosphere 12 (5), 1391–1421. doi:10.1130/GES01277.1
Comeau, M. J., Unsworth, M. J., Ticona, F., and Sunagua, M. (2015). Magnetotelluric Images of Magma Distribution beneath Volcán Uturuncu, Bolivia: Implications for Magma Dynamics. Geology 43 (3), 243–246. doi:10.1130/G36258.1
Corbi, F., Rivalta, E., Pinel, V., Maccaferri, F., Bagnardi, M., and Acocella, V. (2015). How Caldera Collapse Shapes the Shallow Emplacement and Transfer of Magma in Active Volcanoes. Earth Planet. Sci. Lett. 431, 287–293. doi:10.1016/j.epsl.2015.09.028
de Silva, S. L., and Gosnold, W. D. (2007). Episodic Construction of Batholiths: Insights from the Spatiotemporal Development of an Ignimbrite Flare-Up. J. Volcanology Geothermal Res. 167, 320–335. doi:10.1016/j.jvolgeores.2007.07.015
del Potro, R., Díez, M., Blundy, J., Camacho, A. G., and Gottsmann, J. (2013). Diapiric Ascent of Silicic Magma beneath the Bolivian Altiplano. Geophys. Res. Lett. 40, 2044–2048. doi:10.1002/grl.50493
Dieterich, J. H., and Decker, R. W. (1975). Finite Element Modeling of Surface Deformation Associated with Volcanism. J. Geophys. Res. 80 (29), 4094–4102. doi:10.1029/jb080i029p04094
Fedi, M. (2007). DEXP: A Fast Method to Determine the Depth and the Structural index of Potential fields Sources. Geophysics 72 (1), I1–I11. doi:10.1190/1.2399452
Fedi, M., Florio, G., and Paoletti, V. (2015). MHODE: a Local-Homogeneity Theory for Improved Source-Parameter Estimation of Potential fields. Geophys. J. Int. 202, 887–900. doi:10.1093/gji/ggv185
Fedi, M., Florio, G., and Quarta, T. A. (2009). Multiridge Analysis of Potential fields: Geometric Method and Reduced Euler Deconvolution. Geophysics 74 (4), L53–L65. doi:10.1190/1.3142722
Fialko, Y., Khazan, Y., and Simons, M. (2001). Deformation Due to a Pressurized Horizontal Circular Crack in an Elastic Half-Space, with Applications to Volcano Geodesy. Geophys. J. Int. 146, 181–190. doi:10.1046/j.1365-246x.2001.00452.x
Fialko, Y., and Pearse, J. (2012). Sombrero Uplift above the Altiplano-Puna Magma Body: Evidence of a Ballooning Mid-crustal Diapir. Science 338, 6104250–6104252. doi:10.1126/science.1226358
Finney, B., Turner, S., Hawkesworth, C., Larsen, J., Nye, C., George, R., et al. (2008). Magmatic Differentiation at an Island-Arc Caldera: Okmok Volcano, Aleutian Islands, Alaska. J. Petrol. 49 (5), 857–884. doi:10.1093/petrology/egn008
Florio, G., Fedi, M., and Pašteka, R. (2014). On the Estimation of the Structural index from Low-Pass Filtered Magnetic Data. Geophysics 79 (6), J67–J80. doi:10.1190/geo2013-0421.1
Geerstma, J., and Van Opstal, K. (1973). A Numerical Technique for Predicting Subsidence above Compacting Reservoirs, Based on the Nucleus of Strain Concept. Verhandelingen Kon. Ned. Geol. Mijnbouwk. Gen. 28, 63
Gottsmann, J., Blundy, J., Henderson, S., Pritchard, M. E., and Sparks, R. S. J. (2017). Thermomechanical Modeling of the Altiplano-Puna Deformation Anomaly: Multiparameter Insights into Magma Mush Reorganization. Geosphere 13, GES014201. doi:10.1130/GES01420.1
Gudmundsson, A. (2006). How Local Stresses Control Magma-Chamber Ruptures, Dyke Injections, and Eruptions in Composite Volcanoes. Earth-Science Rev. 79 (1-2), 1–31. doi:10.1016/j.earscirev.2006.06.006
Henderson, S. T., and Pritchard, M. E. (2013). Decadal Volcanic Deformation in the Central Andes Volcanic Zone Revealed by InSAR Time Series. Geochem. Geophys. Geosyst. 14 (5), 1358–1374. doi:10.1002/ggge.20074
Henderson, S. T., and Pritchard, M. E. (2017). Time-dependent Deformation of Uturuncu Volcano, Bolivia, Constrained by GPS and InSAR Measurements and Implications for Source Models. Geosphere 13 (6), 1834–1854. doi:10.1130/GES01203.1
Hickey, J., Gottsmann, J., and del Potro, R. (2013). The Large-Scale Surface Uplift in the Altiplano-Puna Region of Bolivia: A Parametric Study of Source Characteristics and Crustal Rheology Using Finite Element Analysis. Geochem. Geophys. Geosyst. 14 (3), 540–555. doi:10.1002/ggge.20057
Hickey, J., Gottsmann, J., Nakamichi, H., and Iguchi, M. (2016). Thermomechanical Controls on Magma Supply and Volcanic Deformation: Application to Aira Caldera, Japan. Sci. Rep. 6, 32691. doi:10.1038/srep32691
Hudson, T. S., Kendall, J.-M., Pritchard, M. E., Blundy, J. D., and Gottsmann, J. H. (2022). From Slab to Surface: Earthquake Evidence for Fluid Migration at Uturuncu Volcano, Bolivia. Earth Planet. Sci. Lett. 577, 117268. doi:10.1016/j.epsl.2021.117268
Jay, J. A., Pritchard, M. E., West, M. E., Christensen, D., Haney, M., Minaya, E., et al. (2012). Shallow Seismicity, Triggered Seismicity, and Ambient Noise Tomography at the Long-Dormant Uturuncu Volcano, Bolivia. Bull. Volcanol 74, 817–837. doi:10.1007/s00445-011-0568-7
Jónsson, S., Zebker, H., Cervelli, P., Segall, P., Garbeil, H., Mouginis-Mark, P., et al. (1999). A Shallow-Dipping dike Fed the 1995 Flank Eruption at Fernandina Volcano, Galápagos, Observed by Satellite Radar Interferometry. Geophys. Res. Lett. 26 (8), 1077–1080. doi:10.1029/1999GL900108
Kukarina, E., West, M., Keyson, L. H., Koulakov, I., Tsibizov, L., and Smirnov, S. (20172017). Focused Magmatism beneath Uturuncu Volcano, Bolivia: Insights from Seismic Tomography and Deformation Modeling. Geosphere 13 (6), 1855–1866. doi:10.1130/GES01403.1
Lau, N., Tymofyeyeva, E., and Fialko, Y. (2018). Variations in the Long-Term Uplift Rate Due to the Altiplano-Puna Magma Body Observed with Sentinel-1 Interferometry. Earth Planet. Sci. Lett. 491, 43–47. doi:10.1016/j.epsl.2018.03.026
Love, A. E. H. (1906). A Treatise on the Mathematical Theory of Elasticity. second ed. Cambridge: Cambridge University Press.
Lu, Z., Masterlark, T., and Dzurisin, D. (2005). Interferometric Synthetic Aperture Radar Study of Okmok Volcano, Alaska, 1992-2003: Magma Supply Dynamics and Postemplacement Lava Flow Deformation. J. Geophys. Res. 110, B02403. doi:10.1029/2004JB003148
Masterlark, T., Feigl, K. L., Haney, M., Stone, J., Thurber, C., and Ronchin, E. (2012). Nonlinear Estimation of Geometric Parameters in FEMs of Volcano Deformation: Integrating Tomography Models and Geodetic Data for Okmok Volcano, Alaska. J. Geophys. Res. 117, a–n. doi:10.1029/2011JB008811
Masterlark, T., Haney, M., Dickinson, H., Fournier, T., and Searcy, C. (2010). Rheologic and Structural Controls on the Deformation of Okmok Volcano, Alaska: FEMs, InSAR, and Ambient Noise Tomography. J. Geophys. Res. 115, B02406. doi:10.1029/2009JB006324
McBirney, A. R., and Williams, H. (1969). Geology and Petrology of the Galápagos Islands. Geol. Soc. Am. Mem. 118, 1–197. doi:10.1130/mem118-p1
McFarlin, H., Christensen, D., McNutt, S. R., Ward, K. M., Ryan, J., Zandt, G., et al. (2017). Receiver Function Analyses of Uturuncu Volcano, Bolivia and Vicinity. Geosphere 14 (1), 50–64. doi:10.1130/GES01560.1
McTigue, D. F. (1987). Elastic Stress and Deformation Near a Finite Spherical Magma Body: Resolution of the point Source Paradox. J. Geophys. Res. 92 (B12), 12931–12940. doi:10.1029/JB092iB12p12931
Milano, M., Fedi, M., and Fairhead, J. D. (2016). The Deep Crust beneath the Trans-European Suture Zone from a Multiscale Magnetic Model. J. Geophys. Res. Solid Earth 121, 6276–6292. doi:10.1002/2016JB012955
Mogi, K. (1958). Relation between Eruptions of Various Volcanoes and the Deformations of Ground Surfaces Around Them, 36. Tokyo: Bullettin of the Earthquake Research Institute, University of Tokio, 99–134.
Muir, D. D., Blundy, J. D., Rust, A. C., and Hickey, J. (2014). Experimental Constraints on Dacite Pre-eruptive Magma Storage Conditions beneath Uturuncu Volcano. J. Petrol. 55 (4), 749–767. doi:10.1093/petrology/egu005
Okada, Y. (1985). Surface Deformation Due to Shear and Tensile Faults in a Half-Space. Bullettin Seismological Soc. America 75 (4), 1135–1154. doi:10.1785/bssa0750041135
Paoletti, V., Milano, M., Baniamerian, J., and Fedi, M. (2020). Magnetic Field Imaging of Salt Structures at Nordkapp Basin, Barents Sea. Geophys. Res. Lett. 47, e2020GL089026. doi:10.1029/2020GL089026
Pepe, S., Castaldo, R., De Novellis, V., D'Auria, L., De Luca, C., Casu, F., et al. (2017). New Insights on the 2012-2013 Uplift Episode at Fernandina Volcano (Galápagos). Geophys. J. Int. 211, 673–685. doi:10.1093/gji/ggx330
Pepe, S., De Siena, L., Barone, A., Castaldo, R., D'Auria, L., Manzo, M., et al. (2019). Volcanic Structures Investigation through SAR and Seismic Interferometric Methods: The 2011-2013 Campi Flegrei Unrest Episode. Remote Sensing Environ. 234, 111440. doi:10.1016/j.rse.2019.111440
Perkins, J. P., Ward, K. M., de Silva, S. L., Zandt, G., Beck, S. L., and Finnegan, N. J. (2016). Surface Uplift in the Central Andes Driven by Growth of the Altiplano Puna Magma Body. Nat. Commun. 7, 13185. doi:10.1038/ncomms13185
Pritchard, M. E., de Silva, S. L., Michelfelder, G., Zandt, G., McNutt, S. R., Gottsmann, J., et al. (2018). Synthesis: PLUTONS: Investigating the Relationship between Pluton Growth and Volcanism in the Central Andes. Geosphere 14 (3), 954–982. doi:10.1130/GES01578.1
Pritchard, M. E., and Simons, M. (2002). A Satellite Geodetic Survey of Large-Scale Deformation of Volcanic Centres in the central Andes. Nature 418, 167–171. doi:10.1038/nature00872
Pritchard, M. E., and Simons, M. (2004). Surveying Volcanic Arcs with Satellite Radar Interferometry: The Central Andes, Kamchatka, and beyond. GSA Today 14, 8. doi:10.1130/1052-5173(2004)014<4:svawsr>2.0.co;2
Reid, A. B., Allsop, J. M., Granser, H., Millett, A. J., and Somerton, I. W. (1990). Magnetic Interpretation in Three Dimensions Using Euler Deconvolution. Geophysics 55 (1), 80–91. doi:10.1190/1.1442774
Ridsdill‐Smith, T. A., and Dentith, M. C. (1999). The Wavelet Transform in Aeromagnetic Processing. Geophysics 64 (4), 1003–1013. doi:10.1190/1.1444609
Rodríguez-Molina, S., González, P. J., Charco, M., Negredo, A. M., and Schmidt, D. A. (2021). Time-Scales of Inter-eruptive Volcano Uplift Signals: Three Sisters Volcanic Center, Oregon (United States). Front. Earth Sci. 8 (645), 1–30. doi:10.3389/feart.2020.577588
Schilling, F. R., Partzsch, G. M., Brasse, H., and Schwarz, G. (1997). Partial Melting below the Magmatic Arc in the central Andes Deduced from Geoelectromagnetic Field Experiments and Laboratory Data. Phys. Earth Planet. Interiors 103, 17–31. doi:10.1016/S0031-9201(97)00011-3
Schmitz, M., Heinsohn, W.-D., and Schilling, F. R. (1997). Seismic, Gravity and Petrological Evidence for Partial Melt beneath the Thickened Central Andean Crust (21-23°S). Tectonophysics 270, 313–326. doi:10.1016/S0040-1951(96)00217-X
Sparks, R. S. J., Folkes, C. B., Humphreys, M. C. S., Barfod, D. N., Clavero, J., Sunagua, M. C., et al. (2008). Uturuncu Volcano, Bolivia: Volcanic Unrest Due to Mid-crustal Magma Intrusion. Am. J. Sci. 308, 727–769. doi:10.2475/06.2008.01
Sun, R. J. (1969). Theoretical Size of Hydraulically Induced Horizontal Fractures and Corresponding Surface Uplift in an Idealized Medium. J. Geophys. Res. 74, 5995–6011. doi:10.1029/JB074i025p05995
Tizzani, P., Battaglia, M., Castaldo, R., Pepe, A., Zeni, G., and Lanari, R. (2015). Magma and Fluid Migration at Yellowstone Caldera in the Last Three Decades Inferred from InSAR, Leveling, and Gravity Measurements. J. Geophys. Res. Solid Earth 120, 2627–2647. doi:10.1002/2014JB011502
Vitale, A., and Fedi, M. (2020). Self-constrained Inversion of Potential fields through a 3D Depth Weighting. Geophysics 85 (6), G143–G156. doi:10.1190/GEO2019-0812.1
Walter, T. R., and Motagh, M. (2014). Deflation and Inflation of a Large Magma Body beneath Uturuncu Volcano, Bolivia? Insights from InSAR Data, Surface Lineaments and Stress Modelling. Geophys. J. Int. 198, 462–473. doi:10.1093/gji/ggu080
Ward, K. M., Delph, J. R., Zandt, G., Beck, S. L., and Ducea, M. N. (2017). Magmatic Evolution of a Cordilleran Flare-Up and its Role in the Creation of Silicic Crust. Sci. Rep. 7, 90471–90478. doi:10.1038/s41598-017-09015-5
Ward, K. M., Zandt, G., Beck, S. L., Christensen, D. H., and McFarlin, H. (2014). Seismic Imaging of the Magmatic Underpinnings beneath the Altiplano-Puna Volcanic Complex from the Joint Inversion of Surface Wave Dispersion and Receiver Functions. Earth Planet. Sci. Lett. 404, 43–53. doi:10.1016/j.epsl.2014.07.022
Xue, X., Freymueller, J., and Lu, Z. (2020). Modeling the Posteruptive Deformation at Okmok Based on the GPS and InSAR Time Series: Changes in the Shallow Magma Storage System. J. Geophys. Res. Solid Earth 125, e2019JB017801. doi:10.1029/2019JB017801
Yang, X.-M., Davis, P. M., and Dieterich, J. H. (1988). Deformation from Inflation of a Dipping Finite Prolate Spheroid in an Elastic Half-Space as a Model for Volcanic Stressing. J. Geophys. Res. 93 (B5), 4249–4257. doi:10.1029/JB093iB05p04249
Keywords: multi-scale methods, volcano deformation, source modeling, DInSAR measurements, signal analysis, Uturuncu volcano, Okmok volcano, Fernandina volcano
Citation: Barone A, Fedi M, Pepe S, Solaro G, Tizzani P and Castaldo R (2022) Modeling the Deformation Sources in Volcanic Environments Through Multi-Scale Analysis of DInSAR Measurements. Front. Earth Sci. 10:859479. doi: 10.3389/feart.2022.859479
Received: 21 January 2022; Accepted: 25 March 2022;
Published: 10 May 2022.
Edited by:
Michael Zhdanov, The University of Utah, United StatesReviewed by:
Oleg E. Melnik, Lomonosov Moscow State University, RussiaElizabeth Eiden, Cornell University, United States
Copyright © 2022 Barone, Fedi, Pepe, Solaro, Tizzani and Castaldo. This is an open-access article distributed under the terms of the Creative Commons Attribution License (CC BY). The use, distribution or reproduction in other forums is permitted, provided the original author(s) and the copyright owner(s) are credited and that the original publication in this journal is cited, in accordance with accepted academic practice. No use, distribution or reproduction is permitted which does not comply with these terms.
*Correspondence: Raffaele Castaldo, Y2FzdGFsZG8uckBpcmVhLmNuci5pdA==