 Ran Zhang
 Jianmeng Sun
 Zhigang Cheng
 Bixiao Xin
 Hao Chen
95% of researchers rate our articles as excellent or good
Learn more about the work of our research integrity team to safeguard the quality of each article we publish.
Find out more
ORIGINAL RESEARCH article
Front. Earth Sci. , 03 May 2022
Sec. Economic Geology
Volume 10 - 2022 | https://doi.org/10.3389/feart.2022.858899
This article is part of the Research Topic Advances in the Exploration and Development of Unconventional Oil and Gas: From the Integration of Geology and Engineering View all 32 articles
The rapid growth in energy demand has placed more attention on the exploration and development of oil and gas in ultradeep reservoirs. However, deep buried rocks in the special “three high” geological environment exhibit significantly different mechanical response characteristics and microstructural features compared with shallow rocks, which requires more targeted experiments and theoretical research. In this work, tight carbonate rocks obtained from five different burial depths ranging from 6077 to 6738 m are used to carry out quasi in situ triaxial compression tests under dry and saturated states. Combined with digital rock modeling based on computed tomography scans, the macromechanical responses and microstructural charactersites of the target samples with the variation of depth are analyzed. The results indicate that the long-term strength of deep rocks is much closer to the peak strength than that of shallow rocks, which can reach 94%–99% of the peak strength. The deeper-buried samples exhibit more pronounced plasticity under the same high confining pressure, and their elastic modulus is more likely to be weakened by pore water. Meanwhile, the ratios of residual strength to peak strength increase as the burial depth increases. Interestingly, the samples with weaker structures are more prone to alternate strain hardening and strain softening during the postpeak stage. On the other hand, the distribution of microstructural parameters for different depths is presented to help interpret the mechanical behaviors, and the difference in the dynamic and static elastic modulus of saturation is significantly connected with the mean pore–throat ratios. These results could provide a reference for research on deep rock mechanics.
With the development of petroleum and gas exploitation and the rapid growth in energy demand, more attention has been given to the deep-underground and deep-sea domains (Kang et al., 2010; Li and Feng, 2013; Ranjith et al., 2017; De Santis et al., 2020). Countries have made significant improvements at 6000–10,000 m in technical exploration capabilities as their development priorities focus on the strategic deployment of oil and gas resources. The number of ultradeep wells has increased greatly, and the depth has deepened continuously. In less than 40 years, the world’s deepest drilling record improved by nearly 6000 m, reaching 15,000 m, and the depth of exploitation in China reached 8,882 m in 2020 (as shown in Figure 1). It is worth noting that different countries and institutions do not have a unified definition of “ultradeep”, the Ministry of Land and Resources of China (Wang J. et al., 2013) and the United States Geological Survey (Dyman et al., 1998) defined reservoirs with burial depth greater than 4,500 m as deep oil and gas reservoirs and over 6000 m as ultra-deep oil and gas reservoirs. This definition is adopted in this paper.
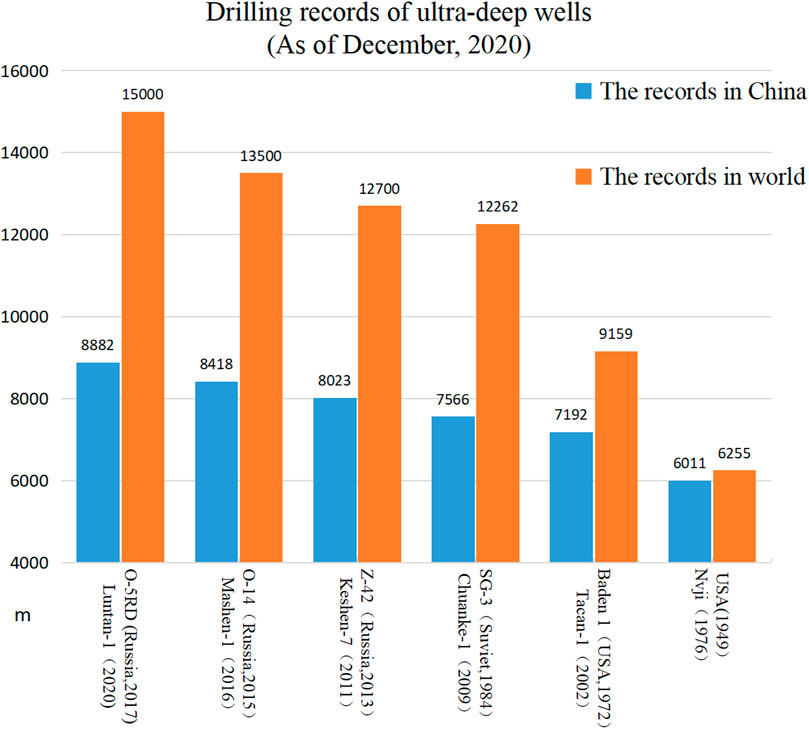
FIGURE 1. Drilling records of ultradeep wells in China and the world.
The accurate measurement of rock mechanics parameters and the understanding of corresponding mechanical response mechanisms are prerequisites for effective oil and gas exploitation. However, the deep buried rock in the special “three high” (high ground stress, high earth temperature, high karst water pressure) geological environment exhibits different mechanical response characteristics and microstructural features compared with shallow reservoirs (Yang et al., 2014; Vorobiev and Morris, 2019), such as strong rheological properties, the brittleness–ductility transition of the rock, significant time effects, failure mechanisms under high geostress and the mechanisms of disaster occurrence (Pusch, 1993; Malan and Basson, 1998; Malan, 1999; Zhang et al., 2000). These traits make traditional linear elastic longitudinal and transverse wave theory and continuum mechanics, which are widely used in geophysics, rock mechanics and seismology, unable to accurately predict the mechanical parameters and interpret the experimental results. As a result, engineering demands have prompted deep rock mechanics to become a focus since the 1970s (Kaiser and Cai, 2012; Gong et al., 2018; Wang et al., 2018; Wu et al., 2019). In terms of experiments, Liang et al. (2020) employed a triaxial apparatus under simulated reservoir pressure and temperature conditions to research the creep characteristics of shale in the Cooper Basin at more than 3000 m underground. Tarasov and Randolph. (2008) investigated the impact of the frictionless shear effect of a seismically active gold mine at great depth on the rockburst process. Huang et al. (2020) showed that the mass, longitudinal wave velocity, peak stress and elastic modulus of sandstone at 1000 m deep decreased obviously by 0.43%, 7.87%, 70.20% and 88.10%, respectively, after acid-dry-wet (A-D-W) cycles. Kaiser and Kim. (2015) observed that in situ rock strength may be greater than what has been extrapolated from the laboratory; furthermore, they indicated that empirical rock mass strength estimation faces a great challenge in anticipating the actual behavior of brittle rocks during laboratory testing. In strength theory, because the failure of deep rock is no longer controlled by the brittle energy and fracture toughness, the Coulomb-Mohr criterion is invalid, and various nonlinear criteria and unified strength theories of linearity and nonlinearity have been developed successively (Zienkiewicz, 1977; Hoek and Brown, 1997; Tzanakis, 1997; Yu et al., 2004). For example, Singh et al. (1989) summarized the rock strength criteria under a lateral stress of 700 MPa and proposed a nonlinear rock strength criterion on this basis.
Although a series of results have been achieved in the field of deep rock mechanisms, there are few basic studies on rock mechanical parameters below 6,000 m and the mechanism of variation with depth. Kang et al.(2019; Peng et al., 2020) researched the variation in static and dynamic mechanical properties of granite with burial depths in the range of 750–1,250 m, and the law of energy evolution in the process of rock failure under different burial depths was discussed; nevertheless, the in situ geological conditions of the sample were not fully considered. Xie et al. (2021) tested the mechanical behavior of rocks under in situ geological conditions at 10 different burial depths, but the large burial depth span of 1000–6,400 m could make the regular behavior of the variation with depth less obvious. As a rule, the geological conditions become more complex as the depth increases, and the deep scientific phenomena become more obvious; for instance, rockburst, zonal fracture and low-frequency resonance in deep rock mass engineering response become more serious as the depth increases (Li et al., 2020). Furthermore, the precision of the traditional fracture pressure model is still able to meet the engineering requirements above 6,000 m depth for the target area in this paper but has a large error after more than 6,000 m. Therefore, targeted experiments and theoretical studies on ultradeep rocks, especially in situ conditions, appear to be particularly meaningful. These studies also provide calibration and constraints for numerical simulations and petrophysical trend prediction analyses (Tang, 1997; Avseth et al., 2003; Zhu et al., 2012).
On the other hand, the current research on rocks at different depths has been mainly focused on the macromechanical properties and the effects of different confining pressures and temperatures on the mechanical behavior of rocks (Al-Shayea et al., 2000; Liang et al., 2017; Peng et al., 2019), and carbonate rock samples with complex pore structure show complex elastic property changes after fluid saturation, and rock samples show stronger fluid-rock skeleton interaction. As far as we know, the current research on rock at different burial depths rarely involves the influences of the micropore structure of rocks and pore water under the long-term “three high” geological environment on the mechanical response characteristics. However, the influence of the microscopic structural characteristics on the macroscopic characteristics of rocks is more significant for rocks with low porosity and permeability; moreover, rheological theory and continuum elasticity cannot reveal the microscopic mechanism of the difference between dynamic and static elastic parameters, so a comprehensive study of macroscopic mechanical parameters and microstructural parameters of rocks at different depths is helpful to deepen the understanding of the scientific phenomena of deep rocks. The extensive application of X-ray CT scanning technology provides a useful nondestructive method to obtain the microscopic structure and parameters of rock for petroleum engineering, geotechnical mechanics and construction engineering. Based on grayscale CT or scanning electron microscopy images, digital rock technology has the advantage of being able to perform various simulations and describe the pore structure characteristics by reconstructing a digital rock model (Zhao et al., 2013; Jiang et al., 2017; Dong et al., 2018; Huaimin et al., 2018), and it is of practical significance to study the relationship between macro-mechanical behavior and micro-structure of rock (Zhang et al., 2019).
According to the above points, deep carbonate rock, which is often accompanied by low porosity and permeability, developed microstructure and significant nonlinear mechanical phenomena, could be used as a reference research object. Deep carbonate reservoirs are widely distributed around the world and account for 35% of proven deep recoverable reserves. Therefore, in this paper, the mechanical parameters of five sets of carbonate rock sampled from 6023 m to 6738 m underground in the Tarim Basin were measured under quasi in situ conditions. The experimental method and procedures are introduced in Section 2. Using high-resolution CT, five digital rocks of different depths were reconstructed, and then combined with the burial depth, their microstructural parameters and mechanical behaviors were recorded experimentally and analyzed in Section 3. Finally, conclusions were obtained and summarized based on this study.
The full diameter carbonate core samples in experimentation were collected form the two adjacent ultra deep wells of Gucheng area of the Tarim Basin, Xinjiang Oil Field (as shown in Figure 2), where gathered 70 percent of ultradeep wells and 90 percent of special ultradeep wells of China. Samples with basically the same composition were divided into five groups based on their burial depth, respectively, 6077, 6234, 6488, 6652 and 6738 m underground, and because the high coring failure rate, there were merely four to six samples per group. According to the standards specified by International Society for Rock Mechanics, the rock cores were processed into cylinders with a 50 mm dimensions of in diameter and 100 mm in height, the roughness of two end surface of the rock was confined into 0.05 mm, and the deviation of diameter was not exceed 0.5 mm. Then, to avoid the influence of oil and inorganic salt in the primary water on parameters, the samples were washed in the core automatic oil washing instrument with the organic solvent extraction method.
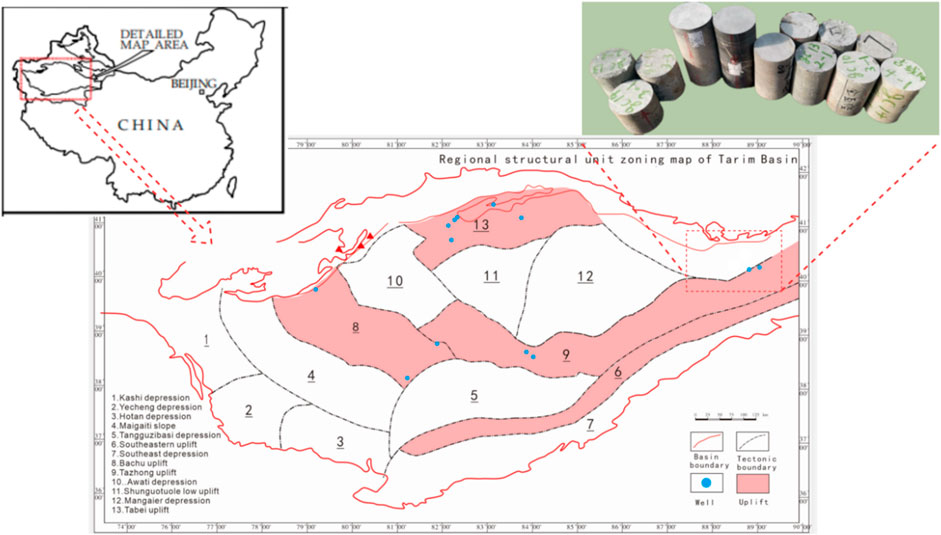
FIGURE 2. Map of Tarim basin, including a schematic diagram of the full-diameter core sampling location.
As shown in Figure 3, the experimental section was mainly composed of three parts: a triaxial compression experiment, acoustic emission velocity test and X-ray computed tomography (CT) scanning. An RTR-2000 high pressure rock triaxial dynamic testing system produced by GCTS was used for the triaxial load part to obtain the peak strength, long term strength, static elasticity modulus, static Poisson’s ratio and Biot coefficient. This system can measure rock physical parameters under high temperature and pressure, and its maximum capacity of confining pressure and temperature can reach 210 MPa and 200°C, respectively, which generally conforms to the conditions tested in situ at a depth of 6,000 m. At the same time that the triaxial test was carried out, the dynamic elasticity modulus, dynamic Poisson’s ratio, and velocity of transverse and longitudinal waves were detected by a ULT-100 ultrasonic testing instrument produced by GCTS. The instrument was equipped with a corresponding 1 MHZ ultrasonic transmission and digital acquisition function to achieve the whole acoustic test process. Finally, the grayscale images of rock samples used to extract the microscopic parameters and numerical simulation were obtained from a micronanometer three-dimensional topological imaging microscopy system (MicroXCT-400, Xradia, United States). In addition, the normal triaxial confining pressure (σ₁>σ₂ = σ₃) was adopted in this experiment.
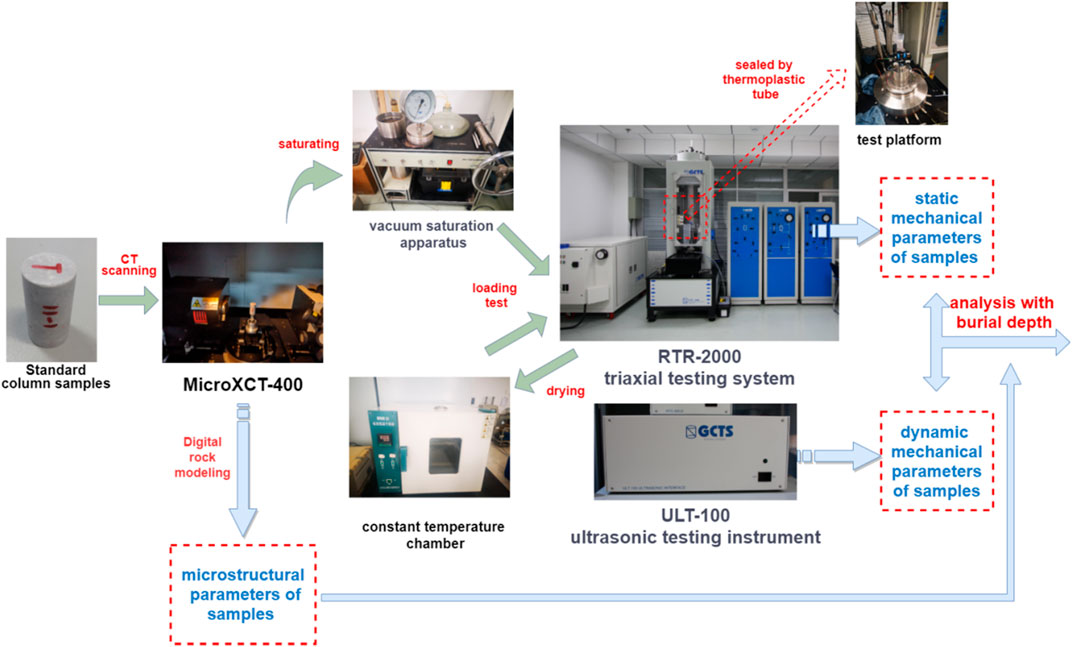
FIGURE 3. Schematic diagram showing the experimental equipment and procedures.
Before carrying out the triaxial test, all of the samples were measured for basic physical properties, including the mass and density of the rock specimen, porosity, and permeability, with a vernier caliper, electronic balance and nitrogen porosity meter. Among them, five samples were selected from different burial depths Hdep for full-field CT scanning at a 12 micron resolution. The CT scanning images of the samples are shown in Figure 4.
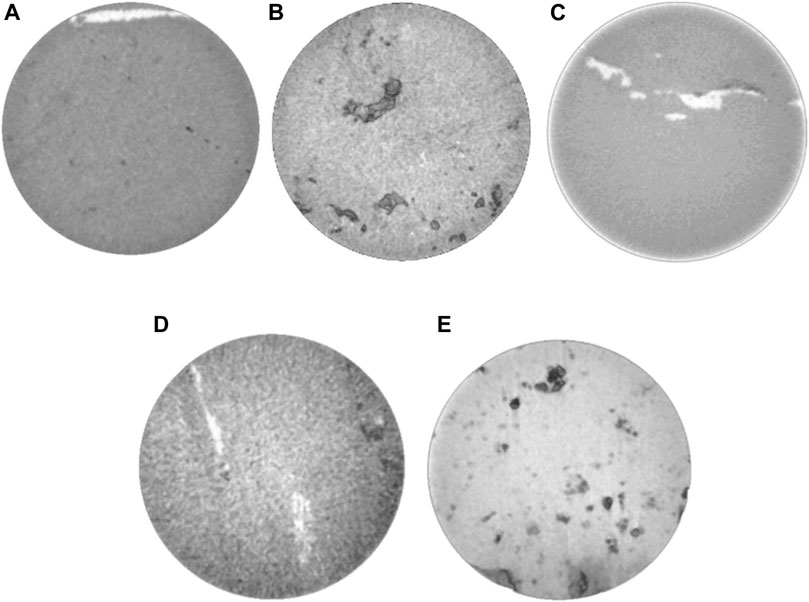
FIGURE 4. Greyscale of the scanned samples at different burial depths (A) Hdep = 6077 m (B) Hdep = 6234 m (C) Hdep = 6488 m (D) Hdep = 6652 m (E) Hdep = 6738 m.
To further elucidate the mechanical properties of carbonate rock in ultradeep reservoirs, the experiment was carried out under quasi in situ conditions. In situ geology generally includes the in situ temperature, humidity, composition, stress, osmotic pressure, and other geological parameters (Xie et al., 2021). In this paper, we mainly consider the stress and temperature that most obviously affect the mechanical response. Temperature gradients typically range from 20°C/km to 30°C/km as the crust deepens, and this value in western and central China is approximately 25°C/km (Pang et al., 2015). According to the in situ stress measurement of the target area, the overburden pressure gradient is approximately 23.8 MPa/km. Thus, the ranges of the in situ temperature and stress of the formation in which the samples were located are approximately 150–168°C and 143–160 MPa. Different from previous studies focusing on the effect of confining pressure and temperature, this experiment aims to investigate the influence of the intrinsic properties, especially the microstructure of rocks at different burial depths, on mechanical parameters. Therefore, samples of different burial depths were tested under the same conditions of confining pressure and temperature in this work, and the specific parameter values take the value around the middle section of the target formation, i.e., the experimental temperature was 160°C, and the confining pressure was 150 MPa. Meanwhile, to study the influence of the saturation state on the transition relationship between dynamic and static mechanical parameters, samples were subjected to immersion treatment and drying treatment in sequence to obtain the mechanical parameters in the saturated state and the dry state.
The specific experimental steps were as follows: First, the samples were put into a core vacuum saturation apparatus for 24 h, and then the saturated samples were fixed with a thermplastic tube on the platform and sealed with a slightly heated hot fan. A pair of deformation sensors were attached to the radial and axial directions of the sample. Second, an acoustic sensor was adhered to the sample, and a coupling agent was evenly applied between the sample and the end cap of the acoustic probe to ensure sufficient coupling. Then, the experimental setup began to load the confining pressure and heat after debugging the initial sensor value. Finally, the displacement loading method was used with a loading rate of 0.002 mm/min until the axial loading pressure reached approximately 100 MPa. Considering that the peak strength of the sample is generally large, and the sample has a long elastic stage during the axial compression loading process, in order not to damage the sample as much as possible, and to ensure the accuracy of the subsequent experiments, it is not necessary to load the axial compression too much when measuring the chord modulus. Therefore, the axial pressure is added to 100 MPa when the saturated elastic modulus is measured. During the experiment, the acoustic emission signal not received by the sensor increased significantly, which proved that the microstructure of brittle carbonate samples was not damaged.
Similarly, the above process was conducted to measure the same parameters of the samples in the dry state after drying the saturated sample in a constant temperature chamber at 40°C for 24 h. However, the loading process continued until the sample broke to obtain the compressive strength and postpeak characteristics of the samples. In addition, it is worth noting that a small initial mechanical load added in this triaxial test has the ability to avoid the initial friction effect on the experimental results.
Pore structure is an important factor affecting the mechanical properties and dynamic static parameter relationship of rock, especially for carbonate rocks with strong anisotropy. To describe the inner pore and fracture structures of samples from different burial depths, the actual digital rocks were constructed using a physical experimental method (Arns et al., 2004). Based on grayscale CT scanning images, we adopted the maximum classification method to generate binary images of samples after nonlocal filtering (Yu et al., 2008). Then, the rock matrix and pore–fracture space were extracted, as shown in Figure 5. Finally, the 3D actual digital rock was constructed by superimposing the segmented images.
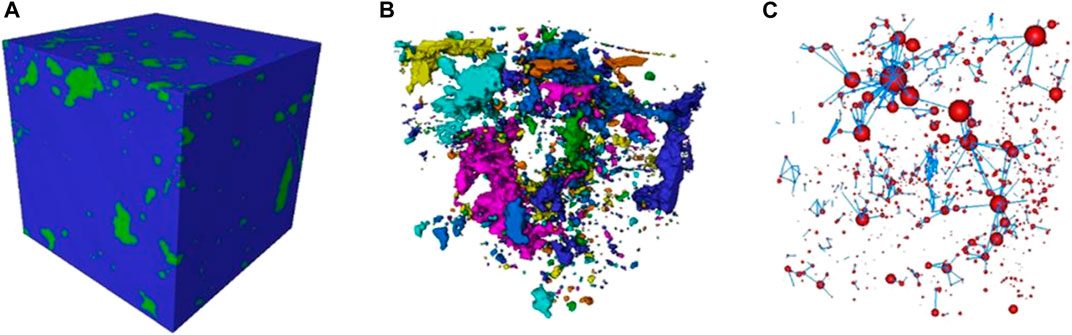
FIGURE 5. (A) Image of the actual digital rock of the sample, a voxel size of 300*300*300 pixels (B) Pore-fracture space of the sample after clustering (C) Model pore network of the actual digital rock.
According to the segmentation of pore–fracture space, the characteristics of pore structure could be quantitatively described by extracting the corresponding pore network model of samples. The model proposed that the pore network comprises pores and throats. Using the maximal ball method, the irregular cross section of pores and throats can be interpreted as different regular shapes (Pelayo and Schmidt, 2008).
The specific procedure is as follows: The isolated rock skeleton particles of the rock are removed, and then the central axis of the pore space is established by the Lee–Kashyap–Chu algorithm (Wang C.-c. et al., 2013). Then, the center position of each pore in the central axis system is determined, and the optimized pore space is optimized into pores and throats. Finally, the model of the pore network was established to reflect real pore space topology and geometric features (Wang C.-c. et al., 2013).
According to the statistical information of the pore network model extracted by using the maximal ball method, the structural parameters can be obtained, including the pore throat ratio, pore and throat radius, coordination number, and throat and pore shape factor. Among them, the nondimensional shape factor G characterizes the degrees of irregularity of pores or throats defined by:
where V is the volume of the pore or throat space, L is the length of the pore or throat space, and As2 is the surface area of the pore or throat space. Therefore, the positive correlation of the value of G indicates the regularity of the pore or throat space; for instance, G reaches the maximum when the space is round, and a triangular G is in the range of 0–0.0481. In addition, the process of simplification follows the principle of shape factor conservation, i.e., the geometry used to characterize a pore or throat has a shape factor equal to the shape factor of the pore or throat.
As shown in Figure 6, the chord modulus Ech was chosen as the calculation method of the static elasticity modulus ES (Spencer Jr, 1981), i.e., the slope of string between the arbitrary two point of the stress strain curve in the elastic range, and the static Poisson’s ratio μs is given by:
where εd(50), εh(50) are the axial and radial compression strain when the principle stress difference is 50% of the maximum value. The conventional transmission was used in the wave velocity measurement, namely, calculate the wave velocity by reading the arrival time of the wave head, which can be represented by:
where L is the length of sample (mm), VS and VP are the transverse and longitudinal wave velocity, TS and TP are the propagation time of the transverse and longitudinal wave in samples (μs), TSM and TPM are the instrument reading during the transverse and longitudinal measurements (μs), and TSO, TPO are the zero reading of the instrument (μs).
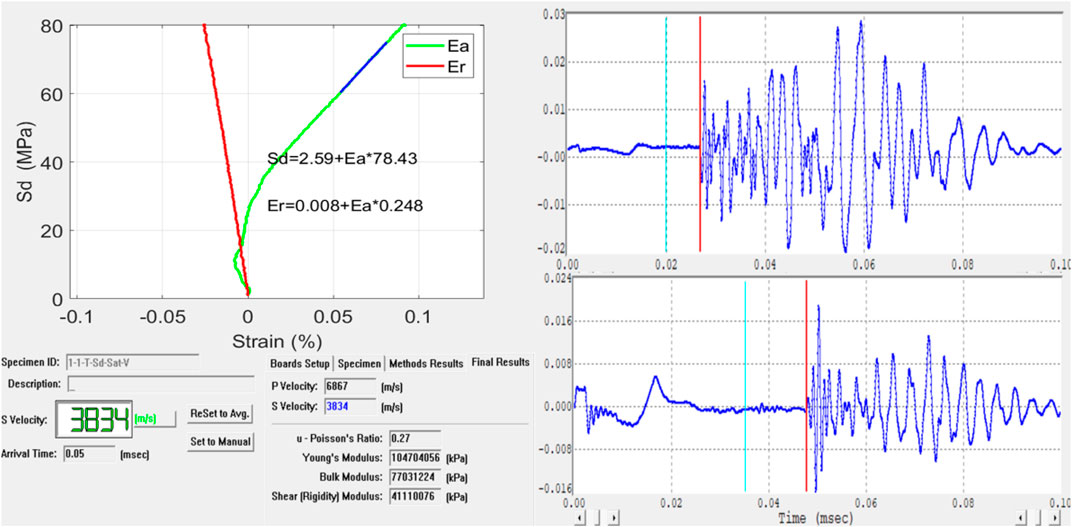
FIGURE 6. Experimental data of the dynamic and static mechanical parameter, Sd is deviatoric stress, Ea is axial strain and Er is radial strain, the figure on the left is the stress strain curve, upper right of the figure is longitudinal wave waveform, low right of the figure is the transverse wave waveform.
Then, the dynamic elasticity modulus ED and the dynamic Poisson’s ratio μD respectively defined by:
and we set the elasticity modulus in saturated and dry states as Es and Ed. Finally, the experiment results and the microstructure parameters of the samples for different burial depths were summarized in Table 1, where σP is the peak strength, σR is the residual strength and σB is the long term strength, B is the Biot coefficient, Rp is the mean pore radius, Rt isthe mean throat radius, Lt is the mean throat length, Gp is the mean pore shape factor, Gt is the mean throat shape factor, Pp-t is the mean pore throat ratio and C is the coordination number. In addition, the pore fracture space of the samples for different burial depths after clustering were presented in Figure 7, the model pore network of digital rock for different burial depths were presented in Figure 8.
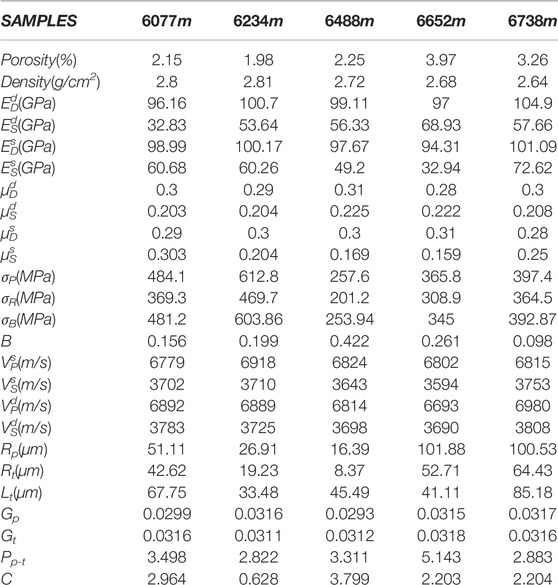
TABLE 1. Experiment results and microstructure parameters of the samples for different burial depths.
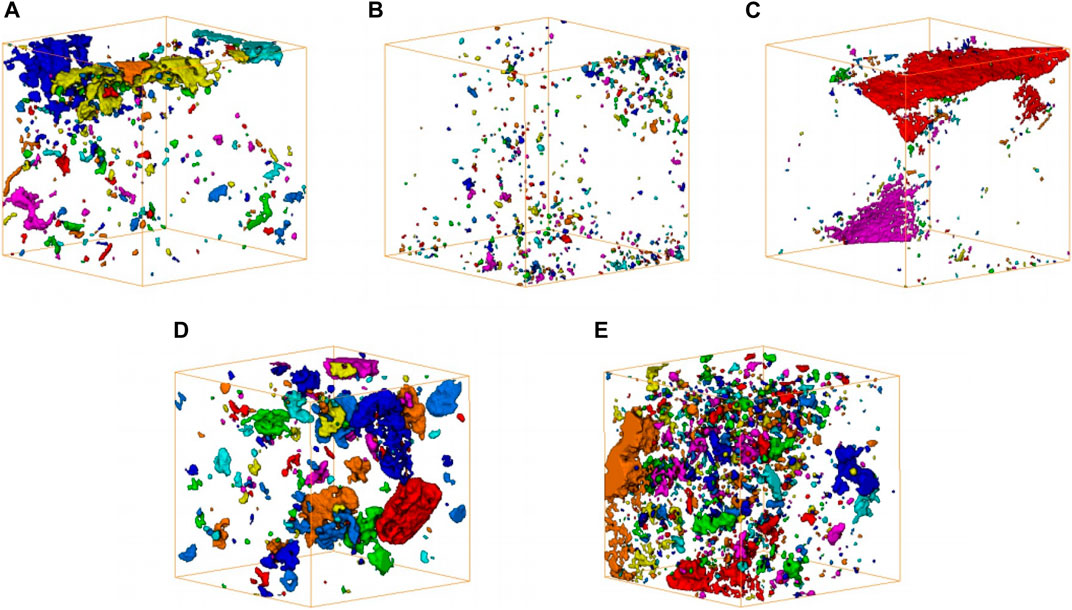
FIGURE 7. Pore fracture space of the scanned sample at different burial depths after clustering (A) Hdep = 6077 m (B) Hdep = 6234 m (C) Hdep = 6488 m (D) Hdep = 6652 m (E) Hdep = 6738 m.
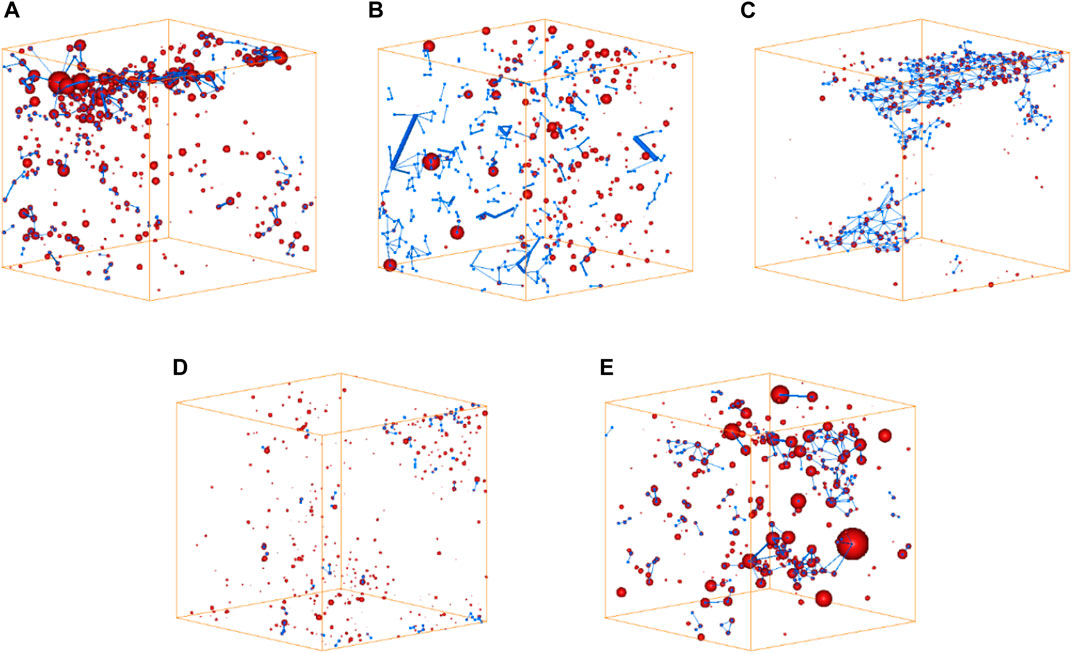
FIGURE 8. Model pore network of the digital rock of the samples at different burial depths (A) Hdep = 6077 m (B) Hdep = 6234 m (C) Hdep = 6488 m (D) Hdep = 6652 m (E) Hdep = 6738 m.
The stress-strain curves of the samples chosen for CT scanning obtained under triaxial compression are displayed in Figures 9, 10. Clearly, there is a large span between the peak strength of different burial depths; the minimum peak strength of the five sets of rock samples is 262.5 MPa, and the maximum peak reaches 612.8 MPa. The results reflect the strong heterogeneity of the carbonate reservoir, which does not show a significant correlation with burial depth.
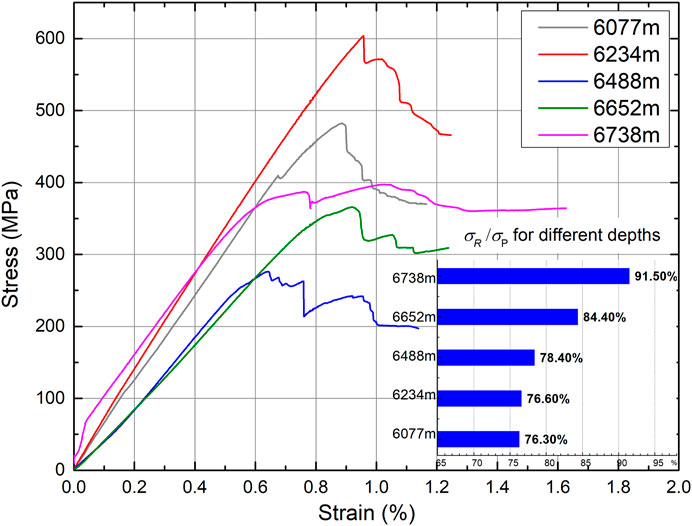
FIGURE 9. Axial stress strain curves of the scanned samples at different burial depths.
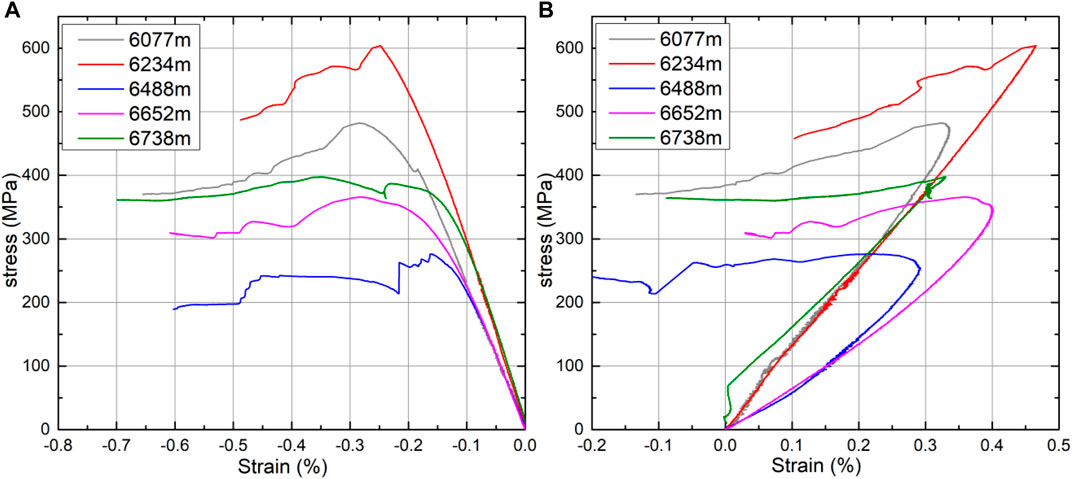
FIGURE 10. (A) Radial stress strain curves of the scanned samples for different burial depths (B) Volumetric stress strain curves of the scanned samples for different burial depths.
Remarkably, samples of different burial depths present discrepant postpeak characteristics, all of which exhibit plastic flow, especially for a sample burial depth of 6738 m, but the samples buried at 6488, 6652 and 6738 m alternately exhibit strain hardening and strain softening; this seems to be more pronounced in samples of low strength. In Figure 7C–E, this phenomenon could be construed as samples with weaker structures (fractures and caves, Figure 7C–E) becoming more prone to local instability after compaction and developing microfractures; after the strain softening process during the recompaction of expanded microfractures, the sample has increased strength manifested as strain hardening, and the effect of fracture on rock strength is more obvious.
In Figure 9, we can see that the samples have both high levels of peak strength and residual strength. After the process of compression achieves the ultimate failure stress, the nonlinear rebound of the stress–strain curves is more evident as the burial depth increases. It is worth noting that the residual strength is closer to its corresponding peak strength as the burial depth increases, and the ratios of residual strength to peak strength in sequence are 76.3%, 76.6%, 78.4%, 84.4%, 91.5% as the burial depth increases. This may be due to the pore structure, the method and degree of cementation and other factors of the more deeply buried samples under the long-term “three high” geological environment that make the sample exhibit more plasticity under high stress. Although the influence of temperature on the dislocation motion of the carbonate is not significant (Araújo et al., 1997), the influence of pressure on mechanical twin crystals, such as calcite in carbonate, is obvious.
As shown in Figure 10A, the radial strain obviously lags behind the axial strain, and the peak of the radial stress–strain curves are more rounded compared with the axial stress–strain curves, which may indicate that the radial samples have a stronger resistance to damage. As shown in Figure 10B, the samples buried at 6234 m, 6488 m and 6738 m exhibit rock dilatancy (Cook, 1970). Alkan et al. (2007) defined the turning point of the volume from compression to expansion as the compression–expansion boundary (C/D boundary), and Martin (Martin and Read, 1992) considered that the axials stress corresponding to the C/D boundary is the crack damage stress, namely, the long-term strength σB. In general, the long-term strength is between 60% and 80% of the peak strength (Szczepanik et al., 2003); however, the long-term strength reaches 94%–99% of the peak strength in this experiment (as shown in Table 1). This is also the result of the rock being under high in situ stress for a long time.
The dynamic and static mechanical parameters and the conversion relationship between them play an important guiding role in underground engineering and the process of oil and gas development. Compared with sandstone, limestone or mudstone, carbonate rocks have a poorer dynamic and static correlation, and the accuracy of the dynamic–static parameter conversion model often decreases with increasing burial depth. The main factors causing the difference of dynamic and static elastic moduli are the effect of pore structure on wave propagation, the occurrence state of fluid and the velocity dispersion (Warpinski et al., 1998), Jing et al.(2016; 2017) has done meaningful work on the analysis and understanding of strong compressional wave velocity dispersion and the influence of fabric and saturation inhomogeneity on wave propagation by establishing theoretical models. And the relationship between the static and dynamic mechanical parameters of all samples in the dry or saturated state is displayed in Figure 11.
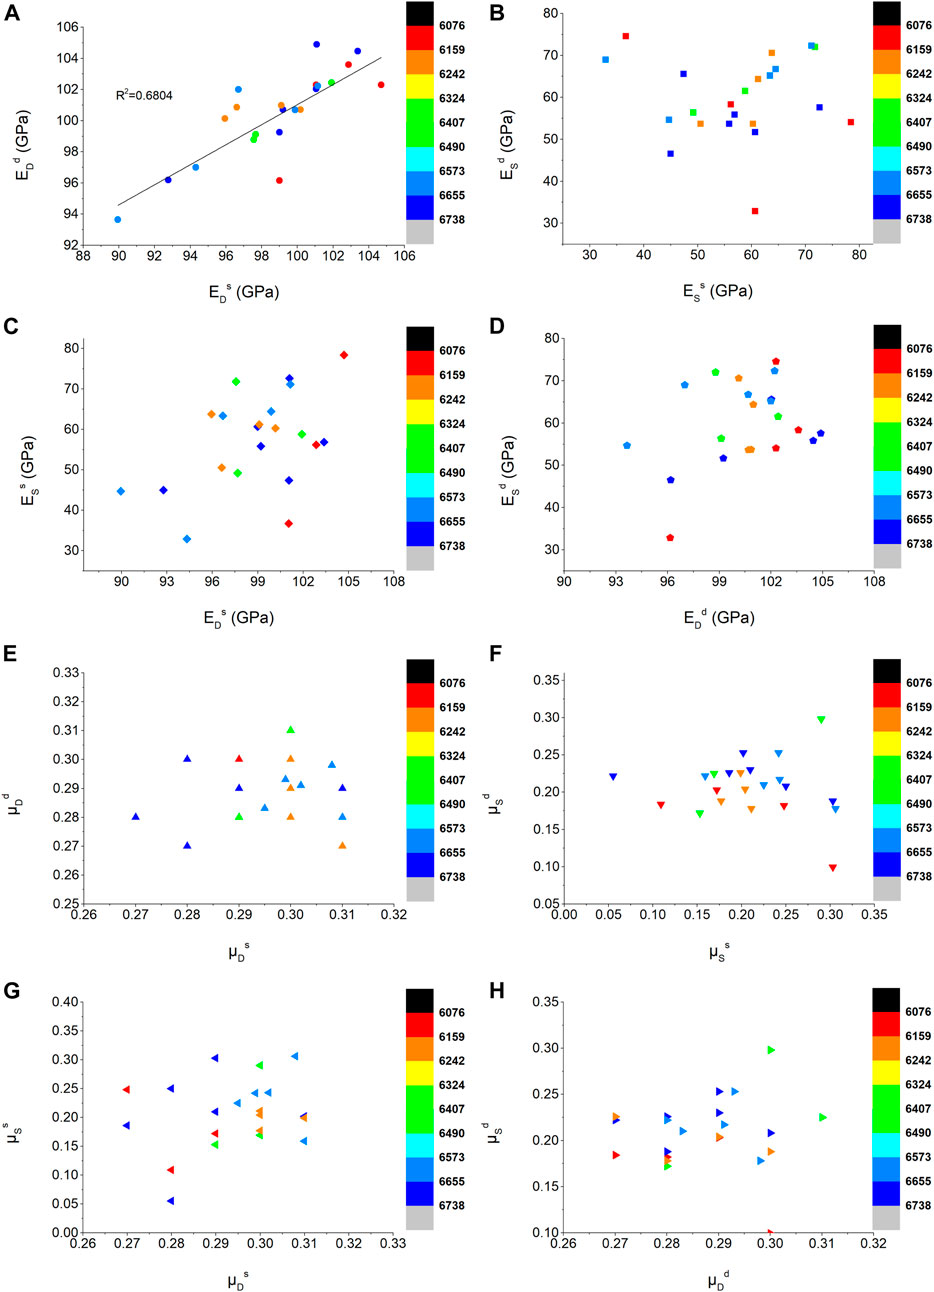
FIGURE 11. (A) Relationship of EdD and EsD of all samples at different burial depths (B) Relationship of EdS and EsS at different burial depths (C) Relationship of EsS and EsD at different burial depths (D) Relationship of EdS and EdD at different burial depths (E) Relationship of µdD and µsD at different burial depths (F) Relationship of µdS and µsS at different burial depths (G) Relationship of µsS and µsD at different burial depths (H) Relationship of µdS and µdD at different burial depths.
As shown in Figures 11A,B, there is a certain linear relationship between EdD and EsD; however, EdS and EsS are not the case, and compared to the dynamic modulus, the presence of pore water has a more obvious impact on the static mechanical parameters (Figure 12A, C). In general, for rocks that are not prone to physicochemical reactions with water, the presence of incompressible pore water has an effect of resistance on longitudinal deformation of the sample during loading, which is reflected in the macromechanical parameter being the increase in elastic modulus. However, in this experiment, the influence of pore water on the elastic modulus may be increased or decreased. By analyzing the relationship between the Es - Ed of the samples and their burial depth, Figure 13 illustrates that the effect of pore water on the elastic modulus is related to the burial depth of the sample. At a relatively shallow position, pore water increases the elastic modulus, but with increasing depth, the influence of pore water on the elastic modulus tends to decrease. Combining the conclusions from the previous section that pore structure, the method and degree of cementation and other factors of the buried deeper samples under the long-term “three high” geological environment make the sample exhibit more plasticity with increased burial depth, the results in Figure 13 can be interpreted as the deeper-buried samples under high stress for a long time exhibit more plasticity, and their dynamic and static elastic modulus is more likely to be weakened by pore water. This phenomenon seems to be more pronounced for the dynamic modulus than for the static modulus. In addition, the mean values of Es - Ed of all samples show a similar trend with the Es - Ed of five samples for the CT scan (Figure 13A,C, Figure 13B,D), which reflects the representativeness of the sample selected for scanning to some extent.
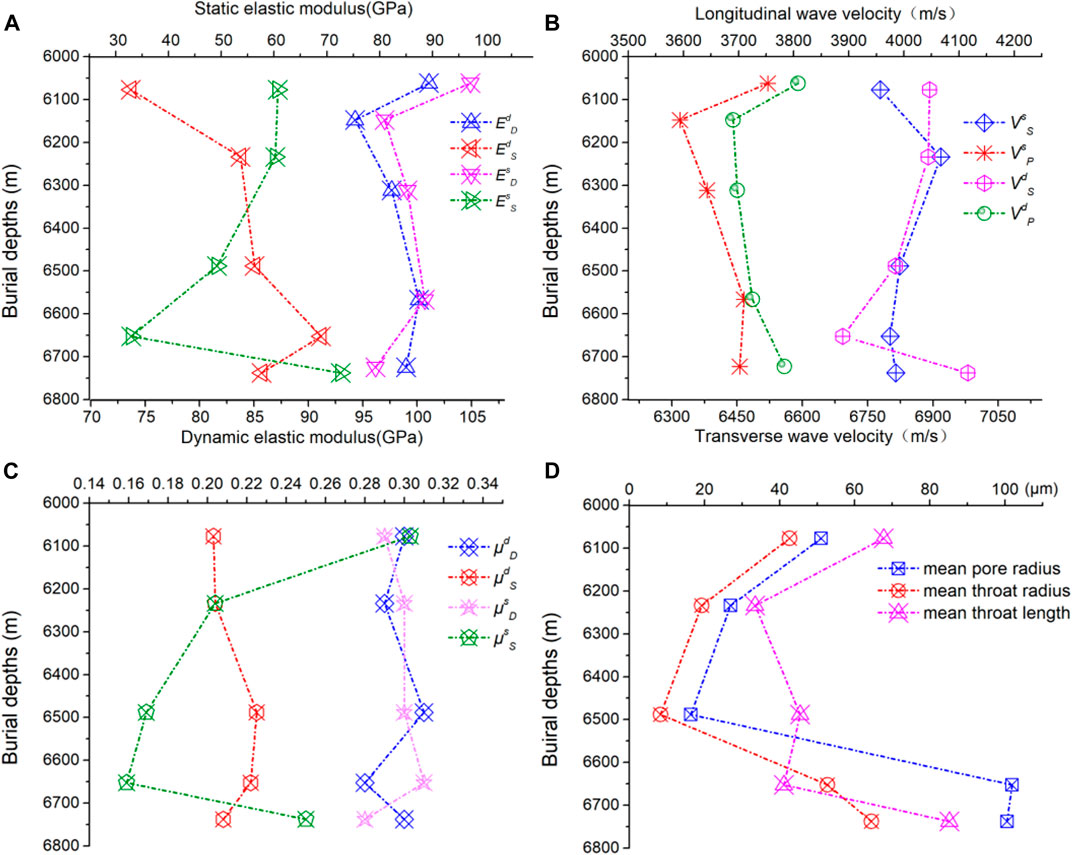
FIGURE 12. (A) EdD, EdS, EsD and EsS of the scanned samples at different burial depths (B) V sS, V sP, V dS and V dP of the scanned samples at different burial depths (C) µdD, µdS, µsD and µsS of the scanned samples at different burial depths (D) mean Rp, Rt and Lt of the scanned samples at different burial depths.
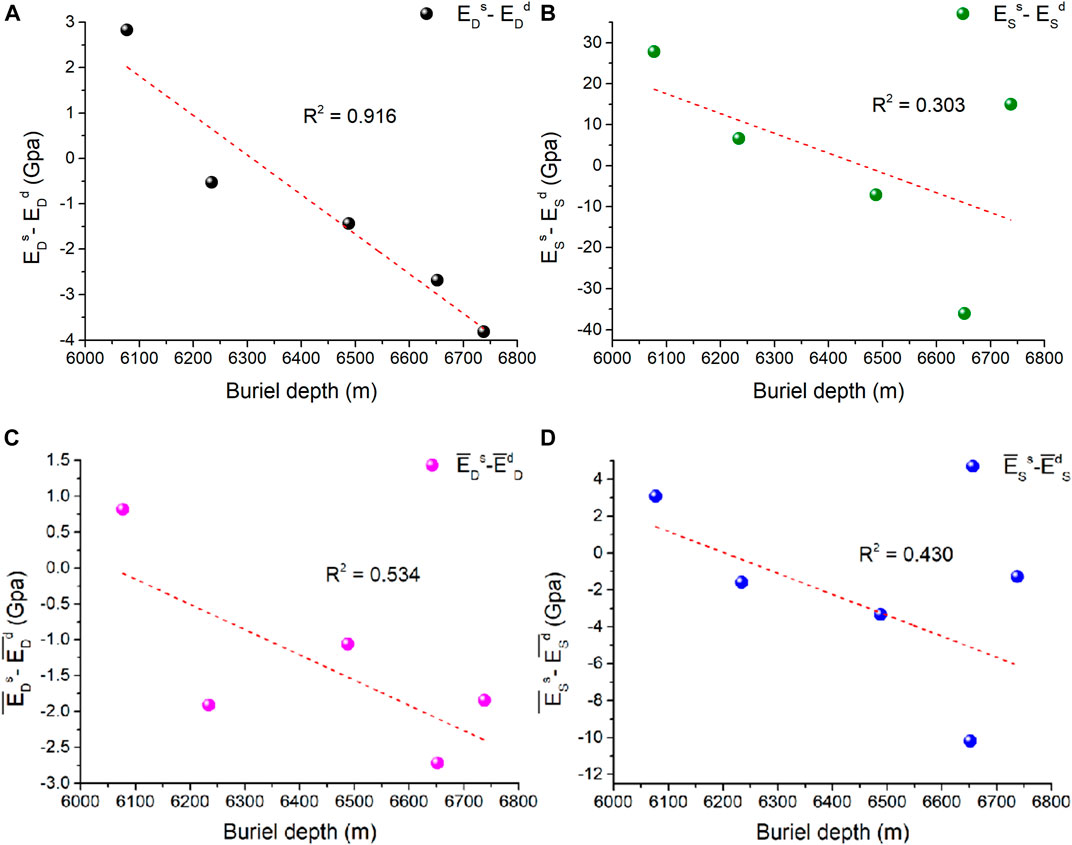
FIGURE 13. (A) Variation of EsD - EdD of the scanned samples with burial depth (B) Variation of EsS - EdS of the scanned samples with burial depth (C) Variation of mean EsD - EdD of all the samples with burial depth (D) Variation of mean EsS - EdS of all the samples with burial depth.
The main internal factors that cause the difference in dynamic and static mechanical parameters are pore structure, fracture and pore fluid. As shown in Figure 11C and Figure 12D, the correlation between ED and ES is poor regardless of the presence of pore fluid for different burial depths. On the other hand, the difference in dynamic parameters between samples is smaller than that in static parameters, the maximum values of EdD and EsD are 104.91 and 104.70 GPa, and the minimum values of EdD and EsD are 93.65 and 89.94 GPa. Correspondingly, the maximum values of EdS and EsS are 74.56 and 78.43 GPa, and the minimum values of EdS and EsS are 32.83 and 32.94 GPa. The ratio of ES to ED is approximately 0.4–0.7, and the average values of EdS/EdD and EsS/EsD are 0.592 and 0.578, respectively. This is approximate to the Evans. (1973) and Warpinski et al. (1998) view that the static elastic modulus is one half of its dynamic elastic modulus.
A schematic of the parameters of the pore structure probability distribution from different burial depths is shown in Figures 14, 15, and the pore size variation with burial depth is presented in Figure 12D. The probability distribution of these structural parameters reflects the geometric properties of the samples and attempts to display the effect of depth change on the geometric size and shape of the pore and throat in the pore network model. Figure 13D shows that the pore–throat size of the sample decreases first and then increases with increasing depth. As shown in Figure 14A and Figure 14B, the pore radius and throat radius of the samples are situated on the same order of magnitude, reflecting that the samples have small pores and thin throats in porous media. The distributions of pore and throat radii differ widely among the samples and have a complex pore size structure. The pore and throat degree of sorting, which represents the concentration of the size distribution, first decreases and then significantly increases with burial depth, and it is positively related to pore throat size. The pore throat degrees of sorting of samples at 6652 m and 6738 m are smaller than those of the shallower rocks; moreover, the pore throat degree of sorting of samples at 6488 m is maximal, and the peaks are focused at approximately 20 and 12 μm.
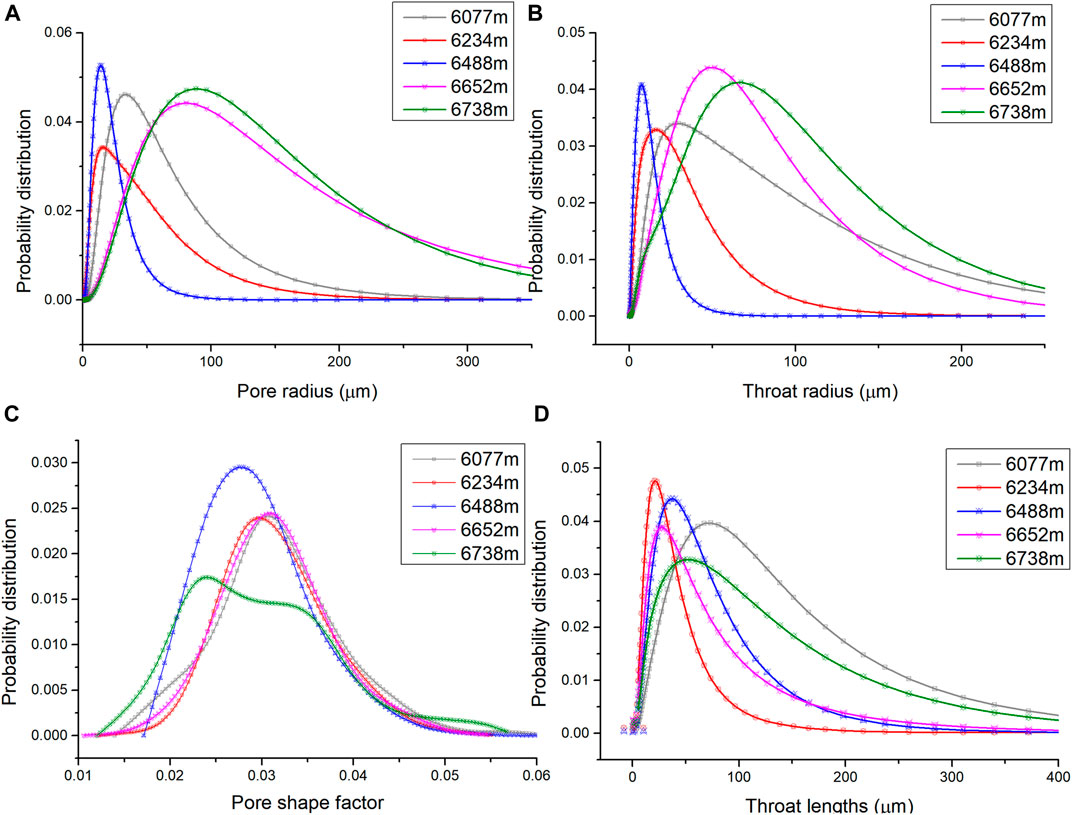
FIGURE 14. (A) Pore radius probability distribution curves for different burial depths (B) Throat radius probability distribution curves for different burial depths (C) Pore shape factor probability distribution curves for different burial depths (D) Throat length probability distribution curves for different burial depths.
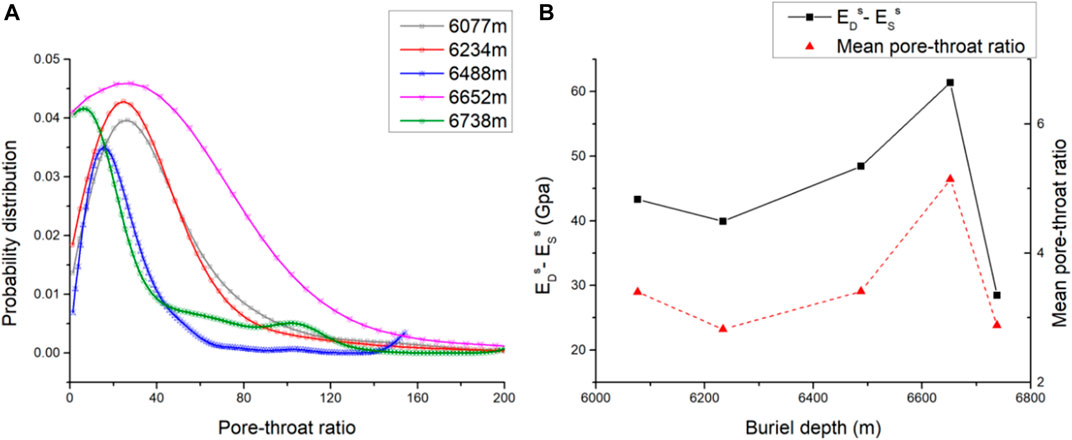
FIGURE 15. (A) Pore–throat ratio probability distribution curves for different burial depths (B) EsD - EsS and the mean pore–throat ratio of samples as functions of burial depth.
In Figure 14C, we can see that, except for the 6738 m sample, the pore shape factors of other samples have normal distribution characteristics, of which the probability distributions of the burial depths at 6077, 6234 and 6652 m are similar and their pore shape factors are mainly approximately 0.03. In contrast, the probability distributions of the 6738 m sample have three peaks near 0.022, 0.034 and 0.054, which indicates that the samples have more abundant cave and fracture structures. The probability distribution of throat lengths displayed in Figure 14D presents a contradistinctive result to the probability distribution of pore and throat radius, the samples of 6077 and 6738 m have a longer throat compared to the other samples, and even those above 300 μm are still distributed.
The pore–throat ratio, which refers to the ratio of the pores in the local range to the average of the radius of all the throat connections, is regarded as a commonly used parameter to evaluate the homogeneity of the pore network model. Specifically, the decrease in the pore throat ratio is embodied in the decrease between the pore radius and throat radius, namely, the more uniform the development of the pore space on the microscopic scale. The probability distribution of the pore–throat ratio for different burial depths is displayed in Figure 15A.
As shown in the plot of EsD - EsS and the mean pore–throat ratio of samples as a function of burial depth in Figure 15B, it is obvious that limited by the strong heterogeneity of the reservoir and the number of samples, although EsD - EsS does not present an apparent regularity of variation with burial depth, the values of EsD - EsS are significantly connected with the mean pore–throat ratios. EsD - EsS, as a function of the mean pore–throat ratio Rp-t, can be expressed as:
The pore–throat ratio has always been regarded as an important microstructural parameter that affects the permeability and electrical properties of rocks; however, this result indicates that the pore–throat structure form has an influence on the difference in dynamic and static elastic modulus in the presence of pore water.
This study attempts to study the microstructure and macromechanical behavior of carbonate rocks obtained from five different burial depths (6077–6738 m underground). To focus on the intrinsic properties of rocks at different burial depths, five groups of samples from different depths were subjected to triaxial testing under a confining pressure and temperature of approximately 6,400 m (150 MPa, 160°C), and the microstructural parameters of five samples from different groups were extracted by CT scanning and digital rock modeling. The following conclusions can be drawn:
(1) Due to the strong anisotropism and the inherent limits of the number of samples, the peak strength, residual strength, wave velocity, and static and dynamic elastic modulus of the samples do not show obvious correlations with burial depth, and the same is true for the microstructural parameters. However, the microstructure of the samples has a significant influence on the macroscopic mechanical behaviors.
(2) Different from the long-term strength of shallow rock, which is 60%–80% of the peak strength, the long-term strength of the samples in this experiment can reach 94%–99% of the peak strength. This reflects the influence of long-term high stress on the rock strength structure.
(3) With increasing depth, the plastic characteristics of the samples become more obvious, and the ratios of the residual strength to its peak strength increase with increasing burial depth, which in sequence are 76.3%, 76.6%, 78.4%, 84.4%, and 91.5%. The samples with more developed fractures and caves alternately experience strain hardening and strain softening during the postpeak stage. This phenomenon may be explained by the fact that samples with more weak structures are more prone to local instability after compaction and develop microfractures. After the strain softening process during the recompaction of expanded microfractures, the sample has stronger strength manifested as strain hardening.
(4) The influence of pore water on the elastic modulus of samples varies with burial depth. Within the depth of the samples in this experiment, pore water can enhance the elastic modulus of relatively shallow samples and weaken the elastic modulus of relatively deep samples. Es - Ed has a linear decreasing relationship with burial depth; this phenomenon is more obvious for the dynamic modulus.
(5) The probability distribution of pore radius, throat radius, pore shape factor, throat length and pore–throat ratio for different burial depths are presented. The results showed that the sample had small pores and thin throats in porous media, and the pore–throat size generally decreased and then increased with increasing depth. Moreover, the values of EsD - EsS are significantly connected with the mean pore–throat ratios, and EsD - EsS can be expressed as a function of the mean pore–throat ratio Rp-t.
Conventional triaxial experiments combined with digital core technology that can analyze and observe microstructures help us better understand the macromechanical behavior of rocks. Limited by the number of samples, the experimental results only provide a certain degree of reference for deep rock mechanics. But through this work, we can clearly see that deep rock under the three-high environment for a long time exhibits some characteristics that differ from shallow rocks, while some features have a certain relationship with the buried depth. This further shows that targeted experiments and theoretical research on deep rock are necessary.
The original contributions presented in the study are included in the article/Supplementary Material, further inquiries can be directed to the corresponding author.
JS and ZC contributed to conception of the study, RZ wrote the first draft of the manuscript, HC was in charge of the experiments in the rock mechanics section, BX performed the statistical analysis and the modeling of digital rocks, RZ, JS, ZC and BX wrote sections of the manuscript. All authors contributed to manuscript revision, read, and approved the submitted version.
This work was financially supported by the National Natural Science Foundation of China (Grants No. 41874138), Innovative Project for Graduate Students (Grant Nos. YCX2021024).
Author ZC is employed by China Petroleum Logging CO. LTD.
The remaining authors declare that the research was conducted in the absence of any commercial or financial relationships that could be construed as a potential conflict of interest.
All claims expressed in this article are solely those of the authors and do not necessarily represent those of their affiliated organizations, or those of the publisher, the editors and the reviewers. Any product that may be evaluated in this article, or claim that may be made by its manufacturer, is not guaranteed or endorsed by the publisher.
Al-Shayea, N. A., Khan, K., and Abduljauwad, S. N. (2000). Effects of Confining Pressure and Temperature on Mixed-Mode (I-II) Fracture Toughness of a limestone Rock. Int. J. Rock Mech. Mining Sci. 37 (4), 629–643. doi:10.1016/s1365-1609(00)00003-4
Alkan, H., Cinar, Y., and Pusch, G. (2007). Rock Salt Dilatancy Boundary from Combined Acoustic Emission and Triaxial Compression Tests. Int. J. Rock Mech. Mining Sci. 44 (1), 108–119. doi:10.1016/j.ijrmms.2006.05.003
Araújo, R., Sousa, J., and Bloch, M. (1997). Experimental Investigation on the Influence of Temperature on the Mechanical Properties of Reservoir Rocks. Int. J. Rock Mech. Mining Sci. 34 (3-4), 298–e291298. e216. doi:10.1016/s1365-1609(97)00065-8
Arns, C. H., Knackstedt, M. A., Pinczewski, W. V., and Martys, N. S. (2004). Virtual Permeametry on Microtomographic Images. J. Pet. Sci. Eng. 45 (1-2), 41–46. doi:10.1016/j.petrol.2004.05.001
Avseth, P., Flesche, H., and Van Wijngaarden, A.-J. (2003). AVO Classification of Lithology and Pore Fluids Constrained by Rock Physics Depth Trends. The Leading Edge 22 (10), 1004–1011. doi:10.1190/1.1623641
Cook, N. G. W. (1970). An experiment Proving that Dilatancy Is a Pervasive Volumetric Property of Brittle Rock Loaded to Failure. Rock Mech. 2 (4), 181–188. doi:10.1007/bf01245573
De Santis, F., Renaud, V., Gunzburger, Y., Kinscher, J., Bernard, P., and Contrucci, I. (2020). In Situ monitoring and 3D Geomechanical Numerical Modelling to Evaluate Seismic and Aseismic Rock Deformation in Response to Deep Mining. Int. J. Rock Mech. Mining Sci. 129, 104273. doi:10.1016/j.ijrmms.2020.104273
Dong, H., Sun, J., Lin, Z., Fang, H., Li, Y., Cui, L., et al. (2018). 3D Pore-type Digital Rock Modeling of Natural Gas Hydrate for Permafrost and Numerical Simulation of Electrical Properties. J. Geophys. Eng. 15 (1), 275–285. doi:10.1088/1742-2140/aa8a8e
Dyman, T. S., Schmoker, J. W., and Root, D. H. (1998). USGS Assesses Deep Undiscovered Gas Resource. Oil Gas J. 96, 16.
Evans, W. M. (1973). A System for Combined Determination of Dynamic and Static Elastic Properties, Permeability, Porosity and Resistivity of Rocks. Austin, TX: The University of Texas at Austin.
Gong, F., Ye, H., and Luo, Y. (2018). The Effect of High Loading Rate on the Behaviour and Mechanical Properties of Coal-Rock Combined Body. Shock and vibration, 1–9. doi:10.1155/2018/4374530
Hoek, E., and Brown, E. (1997). Practical Estimates of Rock Mass Strength. Int. J. Rock Mech. Mining Sci. 34 (8), 1165–171. doi:10.1016/s1365-1609(97)80069-x
Huaimin, D., Jianmeng, S., Likai, C., Liyuan, S., Weichao, Y., Yafen, L., et al. (2018). Study on the Effects of Natural Gas Hydrate Cementation Mode on the Physical Properties of Rocks. J. Geophys. Eng. 15 (4), 1399–1406. doi:10.1088/1742-2140/aab625
Huang, X., Pang, J., Liu, G., and Chen, Y. (2020). Experimental Study on Physicomechanical Properties of Deep sandstone by Coupling of Dry-Wet Cycles and Acidic Environment. Adv. Civil Eng 4, 1–17.doi:10.1155/2020/2760952
Jiang, Y., Sun, J., Gao, J., Zhang, P., and Cui, J. (2017). A Simulation of Mud Invasion and Characteristics of Array Laterolog Responses in a Low-Permeability Gas Reservoir: a Case Study. J. Geophys. Eng. 14 (3), 456–465. doi:10.1088/1742-2140/aa5e69
Jing, B., Xu, W., Fu, L., Carcione, J. M., and Lin, Z. (2017). Rock Anelasticity Due to Patchy Saturation and Fabric Heterogeneity: A Double Double‐porosity Model of Wave Propagation. J. Geophys. Res. Solid Earth 122, S1. doi:10.1002/2017jb014667
Jing, H., Xingxing, C., Jose, M., and Haung, X. (2016). Compressional Wave Dispersion Due to Rock Matrix Stiffening by clay Squirt Flow. Geophys. Res. Lett. 43 (12), 6186–6195. doi:10.1002/2016GL069312
Kaiser, P. K., and Cai, M. (2012). Design of Rock Support System under Rockburst Condition. J. Rock Mech. Geotechnical Eng. 4 (3), 215–227. doi:10.3724/sp.j.1235.2012.00215
Kaiser, P. K., and Kim, B.-H. (2015). Characterization of Strength of Intact Brittle Rock Considering Confinement-dependent Failure Processes. Rock Mech. Rock Eng. 48 (1), 107–119. doi:10.1007/s00603-014-0545-5
Kang, K.-J., Cheng, J.-P., Chen, Y.-H., Li, Y., Shen, M., Wu, S., et al. (2010). “"Status and Prospects of a Deep Underground Laboratory in China,” in Proceedings, 11th International Conference on Topics in astroparticle and underground physics in Memory of Julio Morales (TAUP 2009), Rome, Italy, July 1-5, 2009 (Rome, Italy: IOP Publishing), 012028.
Kang, P., Zhaopeng, L., Quanle, Z., Zhenyu, Z., and Jiaqi, Z. (2019). Static and Dynamic Mechanical Properties of Granite from Various Burial Depths. Rock Mech. Rock Eng. 52 (10), 3545–3566. doi:10.1007/s00603-019-01810-y
Li, C., Xie, H., and Wang, J. (2020). Anisotropic Characteristics of Crack Initiation and Crack Damage Thresholds for Shale. Int. J. Rock Mech. Mining Sci. 126, 104178. doi:10.1016/j.ijrmms.2019.104178
Li, S. C., Feng, X. D., and Li, S. C. (2013). Numerical Model for the Zonal Disintegration of the Rock Mass Around Deep Underground Workings. Theor. Appl. Fracture Mech. 67-68, 65–73. doi:10.1016/j.tafmec.2013.11.005
Liang, Y., Li, Q., Gu, Y., and Zou, Q. (2017). Mechanical and Acoustic Emission Characteristics of Rock: Effect of Loading and Unloading Confining Pressure at the Postpeak Stage. J. Nat. Gas Sci. Eng. 44, 54–64. doi:10.1016/j.jngse.2017.04.012
Liang, Z., Chen, Z., and Rahman, S. S. (2020). Experimental Investigation of the Primary and Secondary Creep Behaviour of Shale Gas Reservoir Rocks from Deep Sections of the Cooper Basin. J. Nat. Gas Sci. Eng. 73, 103044. doi:10.1016/j.jngse.2019.103044
Malan, D., and Basson, F. (1998). Ultra-deep Mining: the Increased Potential for Squeezing Conditions. J. South. Afr. Inst. Mining Metall. 98 (7), 353–363.
Malan, D. F. (1999). Time-dependent Behaviour of Deep Level Tabular Excavations in Hard Rock. Rock Mech. Rock Eng. 32 (2), 123–155. doi:10.1007/s006030050028
Martin, C., and Derek, C. (1993). The Strength of Massive Lac du Bonnet Granite Around Underground Openings [microform]. Dissertation Abstracts International.
Pang, X.-Q., Jia, C.-Z., and Wang, W.-Y. (2015). Petroleum Geology Features and Research Developments of Hydrocarbon Accumulation in Deep Petroliferous Basins. Pet. Sci. 12 (1), 1–53. doi:10.1007/s12182-015-0014-0
Pelayo, A., and Schmidt, B. (2008). Maximal ball Packings of Symplectic-Toric Manifolds. Int. Math. Res. Notices, 121–136. doi:10.48550/arXiv.0704.1036
Peng, K., Liu, Z., Zou, Q., Wu, Q., and Zhou, J. (2020). Mechanical Property of Granite from Different Buried Depths under Uniaxial Compression and Dynamic Impact: an Energy-Based Investigation. Powder Tech. 362, 729–744. doi:10.1016/j.powtec.2019.11.101
Peng, K., Zhou, J., Zou, Q., and Yan, F. (2019). Deformation Characteristics of Sandstones during Cyclic Loading and Unloading with Varying Lower Limits of Stress under Different Confining Pressures. Int. J. Fatigue 127, 82–100. doi:10.1016/j.ijfatigue.2019.06.007
Pusch, R. (1993). Mechanisms and Consequences of Creep in Crystalline Rock. Compr. rock Eng. 1, 227–241.
Ranjith, P. G., Zhao, J., Ju, M., De Silva, R. V. S., Rathnaweera, T. D., and Bandara, A. K. M. S. (2017). Opportunities and Challenges in Deep Mining: a Brief Review. Engineering 3 (4), 546–551. doi:10.1016/j.eng.2017.04.024
Singh, J., Ramamurthy, T., and Rao, G. (1989). “Strength of Rocks at Depth,” in ISRM International Symposium, Pau, France, August 30–September 2, 1989 (Pau, France: OnePetro).
Spencer, J. W. (1981). Stress Relaxations at Low Frequencies in Fluid-Saturated Rocks: Attenuation and Modulus Dispersion. J. Geophys. Res. 86 (B3), 1803–1812. doi:10.1029/jb086ib03p01803
Szczepanik, Z., Milne, D., Kostakis, K., and Eberhardt, E. (2003). “Long Term Laboratory Strength Tests in Hard Rock,” in 10th ISRM Congress: Johannesburg: OnePetro.
Tang, C. (1997). Numerical Simulation of Progressive Rock Failure and Associated Seismicity. Int. J. Rock Mech. Mining Sci. 34 (2), 249–261. doi:10.1016/s0148-9062(96)00039-3
Tarasov, B. G., and Randolph, M. F. (2008). Frictionless Shear at Great Depth and Other Paradoxes of Hard Rocks. Int. J. Rock Mech. Mining Sci. 45 (3), 316–328. doi:10.1016/j.ijrmms.2007.06.001
Tzanakis, C. (1997). The Quest of beauty in Research and Teaching of Mathematics and Physics: A Historical Approach. Nonlinear Anal. Theor. Methods Appl. 30 (4), 2097–2105. doi:10.1016/s0362-546x(96)00249-0
Vorobiev, O. Y., and Morris, J. P. (2019). Modeling Dynamic Fracture in Granite under In Situ Conditions at High Temperatures and Pressures. Int. J. Rock Mech. Mining Sci. 113, 241–254. doi:10.1016/j.ijrmms.2018.11.007
Wang, C.-C., Yao, J., Yang, Y.-F., and Wang, X. (2013a). Study on Resolution Selection for Digital Rock Construction with CT Scanning Method. Sci. Tech. Eng. 13, 1671–1815.
Wang, J., Feng, L., Zhao, L., and Snowden, S. (2013b). China's Natural Gas: Resources, Production and its Impacts. Energy Policy 55, 690–698. doi:10.1016/j.enpol.2012.12.034
Wang, Y., Guo, P., Dai, F., Li, X., Zhao, Y., and Liu, Y. (2018). Behavior and Modeling of Fiber-Reinforced clay under Triaxial Compression by Combining the Superposition Method with the Energy-Based Homogenization Technique. Int. J. Geomech. 18 (12), 04018172. doi:10.1061/(asce)gm.1943-5622.0001313
Warpinski, N., Peterson, R., Branagan, P., Engler, B., and Wolhart, S. (1998). “In Situ stress and Moduli: Comparison of Values Derived from Multiple Techniques,” in SPE annual technical conference and exhibition, New Orleans, LA, September 27–30, 1998 (New Orleans, LA: OnePetro).
Wu, F., Chen, J., and Zou, Q. (2019). A Nonlinear Creep Damage Model for Salt Rock. Int. J. Damage Mech. 28 (5), 758–771. doi:10.1177/1056789518792649
Xie, H., Li, C., He, Z., Li, C., Lu, Y., Zhang, R., et al. (2021). Experimental Study on Rock Mechanical Behavior Retaining the In Situ Geological Conditions at Different Depths. Int. J. Rock Mech. Mining Sci. 138, 104548. doi:10.1016/j.ijrmms.2020.104548
Yang, H. Q., Zeng, Y. Y., Lan, Y. F., and Zhou, X. P. (2014). Analysis of the Excavation Damaged Zone Around a Tunnel Accounting for Geostress and Unloading. Int. J. Rock Mech. Mining Sci. 69, 59–66. doi:10.1016/j.ijrmms.2014.03.003
Yu, Y., Jiang, J., and Zhang, L. (2008). A New Distance Metric Learning Algorithm. Inf. Electron. Eng. 6, 115–119. doi:10.3969/j.issn.1672-2892.2008.02.009
Yu, M., Yu, M., and Yu, M.-H. (2004). Unified Strength Theory and its Applications. Berlin: Spinger.
Zhang, L., Ba, J., Fu, L., Carcione, J. M., and Cao, C. (2019). Estimation of Pore Microstructure by Using the Static and Dynamic Moduli. Int. J. Rock Mech. Mining Sci. 113, 24–30. doi:10.1016/j.ijrmms.2018.11.005
Zhang, Z. X., Kou, S. Q., Jiang, L. G., and Lindqvist, P.-A. (2000). Effects of Loading Rate on Rock Fracture: Fracture Characteristics and Energy Partitioning. Int. J. Rock Mech. Mining Sci. 37 (5), 745–762. doi:10.1016/s1365-1609(00)00008-3
Zhao, J., Sun, J., Liu, X., Chen, H., and Cui, L. (2013). Numerical Simulation of the Electrical Properties of Fractured Rock Based on Digital Rock Technology. J. Geophys. Eng. 10 (5), 055009. doi:10.1088/1742-2132/10/5/055009
Zhu, W. C., Bai, Y., Li, X. B., and Niu, L. L. (2012). Numerical Simulation on Rock Failure under Combined Static and Dynamic Loading during SHPB Tests. Int. J. Impact Eng. 49, 142–157. doi:10.1016/j.ijimpeng.2012.04.002
Keywords: ultradeep rock, different depths, carbonate rocks, digital rock, mechanical parameters, microstructural parameters
Citation: Zhang R, Sun J, Cheng Z, Xin B and Chen H (2022) Mechanical Behavior and Microstructural Characteristics of Ultradeep Tight Carbonate Rocks With Different Burial Depths. Front. Earth Sci. 10:858899. doi: 10.3389/feart.2022.858899
Received: 20 January 2022; Accepted: 11 April 2022;
Published: 03 May 2022.
Edited by:
Gang Lei, King Fahd University of Petroleum and Minerals, Saudi ArabiaCopyright © 2022 Zhang, Sun, Cheng, Xin and Chen. This is an open-access article distributed under the terms of the Creative Commons Attribution License (CC BY). The use, distribution or reproduction in other forums is permitted, provided the original author(s) and the copyright owner(s) are credited and that the original publication in this journal is cited, in accordance with accepted academic practice. No use, distribution or reproduction is permitted which does not comply with these terms.
*Correspondence: Jianmeng Sun, c3Vuam1AdXBjLmVkdS5jbg==
Disclaimer: All claims expressed in this article are solely those of the authors and do not necessarily represent those of their affiliated organizations, or those of the publisher, the editors and the reviewers. Any product that may be evaluated in this article or claim that may be made by its manufacturer is not guaranteed or endorsed by the publisher.
Research integrity at Frontiers
Learn more about the work of our research integrity team to safeguard the quality of each article we publish.