 Yongjin Wu
 Qing Zhang
 Xiuli Ding2
- 1Department of Engineering Mechanics, College of Mechanics and Materials, Hohai University, Nanjing, China
- 2Key Laboratory of Geotechnical Mechanics and Engineering of Ministry of Water Resources, Changjiang River Scientific Research Institute, Wuhan, China
- 3Changjiang Institute of Survey, Planning, Design and Research, Wuhan, China
High slope stability control is a crucial technical issue in water conservancy and hydropower project construction. This issue is relevant throughout the entire engineering-related survey, design, construction, and operation process. This paper reports a recent case in which significant deep-seated deformation occurred during slope excavation. Several unfavorable structural surfaces were revealed throughout the slope’s undercutting process, particularly fault fz39, which ran diagonally through the entire slope from top to bottom. On the slope surface, damage such as cracking, bulging, and local slippage appeared. The measured value of multipoint displacement meters increased in a stepwise pattern with each blast, and the maximum measured value exceeded 100 mm. The studied slope’s whole excavation and reinforcement process is described in detail. We analyzed the deformation mechanism of the excavation slope by combining the geological conditions, real-time safety monitoring findings, and site deformation characteristics. The slope reinforcement scheme was optimized based on the preceding analyses. We used a three-dimensional numerical calculation program to simulate the slope excavation and unloading process to reproduce the current mechanical state of the slope, evaluate the reinforcement measures, and provide a useful reference for decision making. The analysis shows that the deformation behavior of the studied slope is closely related to fault fz39 and fracture L920, and presents a typical wedge failure mode. The deep-seated deformation of the excavation slope occurs at the junction of the wedge and bedrock, which is mainly affected by unfavorable geological structure surfaces, excavation unloading, and blasting vibration. The reinforcement scheme of unloading at the top of the slope and large-tonnage cables are established. The numerical analysis results showed that the design of the slope reinforcement measures was appropriate and ensured slope stability. The work described in this paper deepens our understanding of the occurrence of large deep-seated deformation on the structural-controlled slope under the action of excavation and improves the design philosophy.
Introduction
High rock slopes are the main geological environment found in large-scale hydraulic projects, such as the Three Gorges Project, the Southwest Large Hydropower Group, and the Hanjiang-to-Weihe River Valley Water Diversion Project. Most of these projects are located in high mountain valley areas with steep valley slopes, high in situ stress in the riverbed, complex geological structures, and frequent geological disasters, including landslides. The excavation scale of engineered slopes is large and requires multiple blasting excavations over a certain period. The unloading mechanism of slope excavation is complex, which may aggravate or trigger new landslide disasters. For example, the resurrection of ancient landslides occurred in Tianshengqiao II Hydropower Station because of blasting excavation of the plant slope (Xia and Lu, 1986); 106,000 m3 of landslides occurred during the excavation of the left bank slope of Manwan Hydropower Station (Liu, 1990); buckling failure of the Dabengliugou Stockyard Slope of Jinping I Hydropower Station occurred because of excavation (Dong et al., 2013); toppling failure of antidip layered rock high slope occurred at the left bank intake of Longtan Hydropower Station (Zhou, 2015); the wedge-shaped rock block failure during the excavation of the Tongjiashan reach of the Qinhuai East River in Nanjing (Qin et al., 2022); and a landslide occurred on the left bank of Vajont Reservoir, Italy, triggered by water storage (Mantovani and Vita-Finzi, 2003).
Landslide control is the key to the construction and safe operation of projects. Several scholars have analyzed the key factors leading to landslides (Ersmann, 1979; Petley and Allison, 1997; Huang, 2008; De Blasio, 2011). Rock mass structure is one of the most important conditions for landslide formation. Huang (2007) summarized and analyzed large-scale landslides in China since the beginning of the 20th century. Qiao (2002) summarized 14 main structural types of landslides. In slope excavation research, qualitative and quantitative studies have been conducted on rock stress and rock structure changes, unloading mechanical properties, crack growth and properties evaluation of the rock materials, intrinsic models and yield criteria, slope evolution, and disaster-causing mechanisms during engineering unloading (Ha, 1997; Sheng et al., 2000; Wyllie and Mah, 2004; Zhou et al., 2004; Lu et al., 2013; Ersöz and Topal, 2018; Yang et al., 2019; Zheng et al., 2019; Yang et al., 2020b; Yang et al., 2021c). In slope-blasting excavation research, Lu et al. (2008) studied the transient characteristics of excavation unloading. Onederra et al. (2013) simulated fully coupled explosive blast-induced hazards, and Hu et al. (2018) conducted a numerical experimental study on blasting damage control. The main objective of landslide control is to reduce the sliding force or increase landslide resistance (Segalini and Giani, 2004; Petley et al., 2005; Wei et al., 2006). Regarding landslide control, Zhang et al. (2002) and Dai (2002) carried out theoretical and experimental studies on the interaction between landslides and antislip piles. Ge and Liu (1988), Li (2010), and Zhu et al. (2021) carried out theoretical studies on the interaction mechanism between prestressed anchor cables and landslides, and Gu et al. (2000) and Zhu et al. (2017) carried out relevant studies by experiments. In terms of slope stability analysis, the limit equilibrium method and numerical analysis methods have been further developed (Giani, 1992; Donald and Chen, 1997; Dawson et al., 1999; Chen et al., 2001; Zheng and Zhao, 2004; Zheng, 2007; Zhu and Qian, 2007; Yang et al., 2020a; Yang et al., 2021a; Yang et al., 2021b).
Overall, research on the excavation and unloading process of high rock slope is still based on qualitative and semiquantitative studies, which focus mainly on slope stability analysis, scheme optimization, and control effects. The disaster-causing mechanism, phased control of the evolution process, and control methods based on real-time monitoring information, however, still require further research. This paper introduces a case study of the rock slope at Huangjinxia Water Control Project. In the process of slope excavation, unfavorable structural surfaces such as fz39 and L920 were revealed. Deformation phenomena, such as cracking and bulging, appeared on the excavated face, and tension cracks occurred at the rear edge of the origin slope. In addition, the monitoring data showed that the deformation was mostly located in the deep part of the slope and jumped in a stepwise growth after each blast. As of June 2019, the maximum measured deformation value had exceeded 100 mm. The entire excavation and reinforcement process of the studied slope are detailed in this paper. On the basis of real-time safety monitoring, we categorized the deformation process into three stages, and each stage included the processes of “excavation–deformation and damage–verification–reinforcement–deformation convergence.” These stages provide insight into issues related to rock slope stability. Finally, we simulated the excavation process of the slope by numerical analysis to reproduce its current mechanical state and evaluate subsequent reinforcement design. This successful case study involving large, deep-seated deformation control of an excavated slope improves design philosophy and provides valuable references for the design and construction of similar projects.
An Outline of the Studied Slope
Project Overview
The Hanjiang-to-Weihe River Valley Water Diversion Project, also known as the South-North Water Transfer Project in Shaanxi Province, is the first water transfer project to have crossed the Yellow River Basin, the Yangtze River basins, and the Qinling Mountains (Figure 1). The project diverts water from the Hanjiang River into the Weihe River. The major projects include the Huangjinxia Water Control Project, Sanhekou Water Control Project, and Qingling Water Tunnel. The Huangjinxia Water Control Project is one of the main water sources for the whole project, which is located in the upper reaches of the Hanjiang River. The major structures consist of water-retaining, water release, pumping station, power station, and navigation structures. The water-retaining building is a concrete gravity dam with a crest elevation of 455 m and a maximum dam height of 63 m. The pumping station and power station are located on the left bank of the river. The riverbed pumping station and the hydropower station behind the dam are placed forward and backward along the flow direction, respectively.
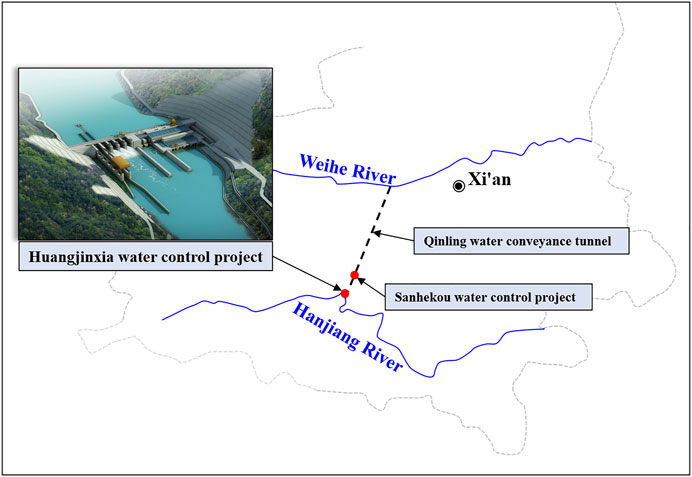
FIGURE 1. Schematic diagram of the project.
Design of the Study Slope
The object of study was the slope of the pump station and power station inlet of the Huangjinxia Water Control Project (Figure 2A). The slope is located along the left bank, from 16.8 to 162.9 m upstream of the dam axis. According to the Design Code for Engineering Slopes in Water Resources and Hydropower Projects (The Water Conservancy Standards Compilation Group of the People’s Republic of China, 2007a), the slope grade is Grade 1. In the preliminary design stage, no controlling structural surfaces, such as fz39 and L920, were found on the slope. The basic principle of slope design is to ensure the stability of strongly weathered rock mass. The design scheme of the slow follows (Figure 2B):
1. The maximum height of the excavation slope was 133.4 m. The top elevation was approximately 540 m, and the lowest elevation was 406.6 m. The middle of the excavated slope was Highway 1 with an elevation of 455 m. The slope above Highway 1 was 85 m in height, which was excavated in five levels, and the design excavation slope ratio was 1:0.4–1:0.7. The slope below Highway 1 was 48.4 m in height, which was excavated in three levels, and the designed excavation slope ratio was 1:0.3–1:0.7.
2. The support measures included system anchors, mat reinforcement, and shotcrete. In addition, two rows of cables with a length of 25 m and a prestress of 1,000 kN were arranged on the slopes with an elevation of 519–502 m and an elevation of 502–485 m.
3. The drainage measures included drainage holes with a length of 4 m, and two rows were arranged on each stage slope.
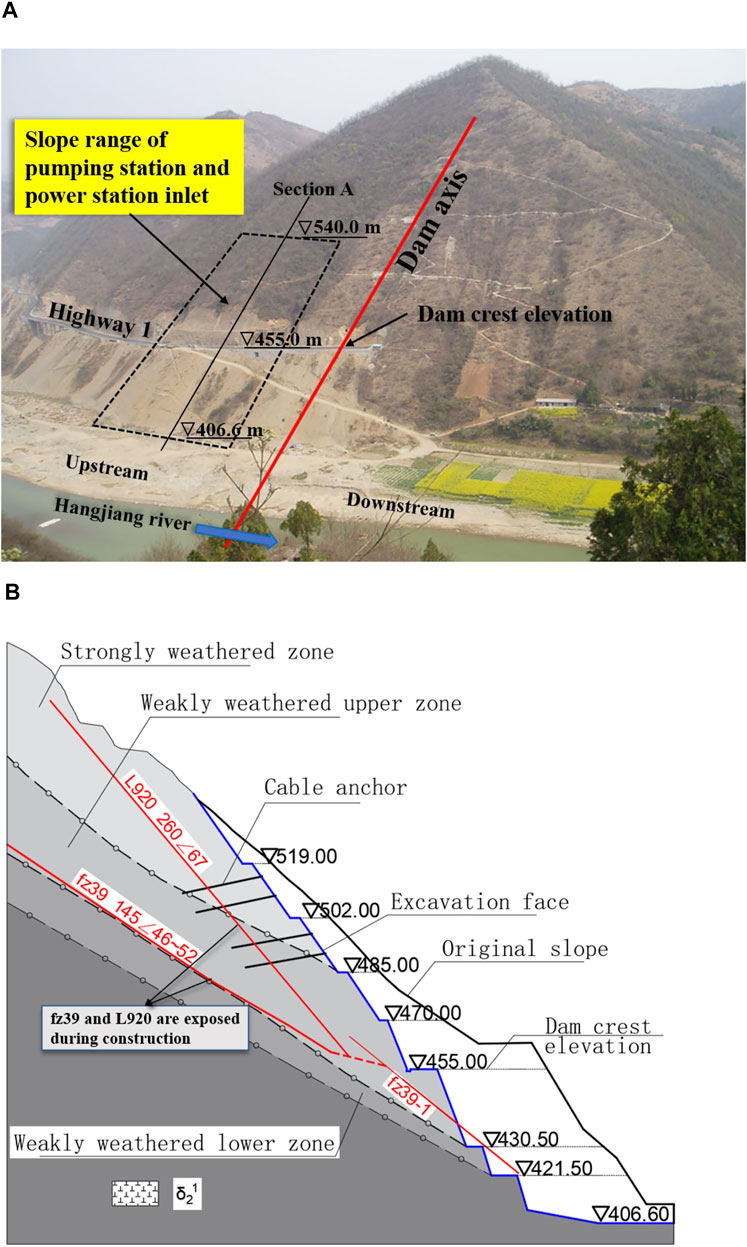
FIGURE 2. Basic situation of the study slope: (A) covering range; (B) original design.
Geological Conditions
Lithology
The studied slope was located at a protrusion between two small gullies, revealing a three-sided empty shape. The natural slope was 290–313° in direction and 37–45° in slope angle. The strata were mainly Early Proterozoic Qingbaikou diorite invaded by felsic dykes and monzonitic granite dykes. The strongly weathered rock masses were mainly distributed above 485 m in elevation and generally had a fractured structure. The rock fractures were extremely developed, and the cores were mostly fragmented.
Geological Structure
The results of statistical analysis showed that four main groups of structural surfaces had developed on the studied slope. The distribution of representative structural surfaces is shown in Figures 3A,B.
1. Strike direction NNW group: These structural surfaces were inclined to the upstream riverbed side, which were most developed at the slope. Their orientation was on average 255°–270°∠60°–270°; the intersection angle with the slope was on average 55°–70°. The developmental spacing was generally 0.5–2.0 m, with representative ones being long fractures L919 and L920.
2. Strike direction NEE group: Their orientation was on average 160°–180°∠ 60°–80°; the intersection angle with the slope was on average 20°–30°. These structural surfaces were nearly parallel to the slope direction and inclined to the downstream riverbed side, and representative ones were small faults fz46 and fz54.
3. Strike direction NE group: Their orientation was on average 120°–150°∠35°–55°. The number of structural surfaces in this group was small, but they generally were developed on a larger scale, such as fault fz39.
4. Strike direction NWW group: Their orientation was on average 10°–30°∠45°–75°. These structural surfaces were nearly parallel to the slope direction and inclined toward the inside of the slope. Mainly monzonitic granite dykes were dominant.
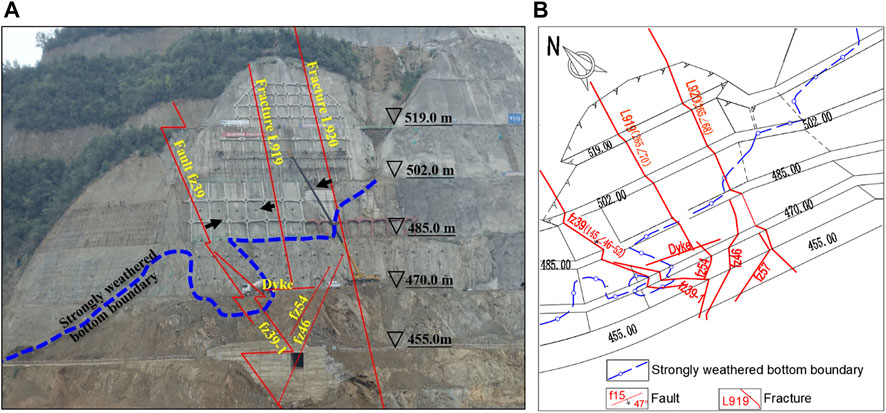
FIGURE 3. Distribution of main structural surfaces: (A) photograph; (B) geological sketch.
Characteristics of Main Structural Surfaces
Fracture L920 developed at an elevation of 502 to 455 m. The orientation was on average 265°–270°∠55°–67°. The fracture planes were generally planar and infilled with debris and locally attached with mud films. Below an elevation of 485 m, the developmental spacing was generally 0.2–0.5 m (Figure 4A).
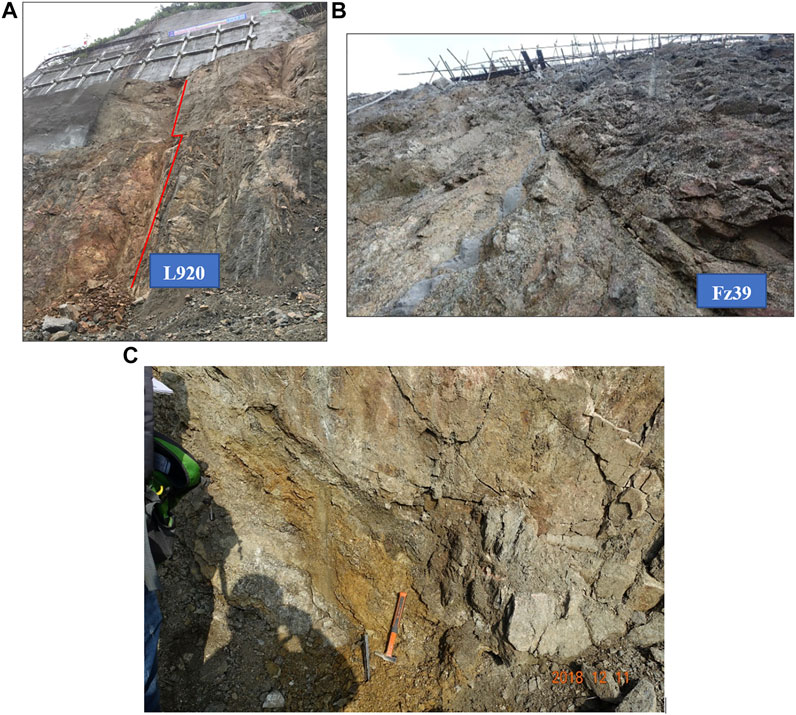
FIGURE 4. Photographs of main structural surfaces: (A) fracture L920; (B) fault fz39; (C) mud of fault fz39.
Fault fz39 was the largest fault revealed by slope excavation (Figure 4B), which ran through the whole slope from top to bottom. Its extension length was more than 150 m, and its width was approximately 0.1–0.3 m. The orientation was on average 145°∠46°–52° (the branch fault fz39-1 below the elevation of 470 m: 136°–144°∠43°–47°). The intersection angle with the slope was on average 51°–55°. The fault inclined toward the downstream riverbed side, which was an extroverted structural surface with a medium dip angle. According to the direction of scratch and step, fault fz39 was a positive translation fault. The fault was mainly cataclastic rock, and mud attached to the fault surface or local mud phenomenon was a severe problem (Figure 4C). The mud thickness was generally 1–3 cm and could reach 10 cm locally. Overall, the physical and mechanical properties of fault fz39 were very poor.
Hydrogeology
The groundwater type of the slope was mainly bedrock fracture water. The excavation faces were dry. Through drainage holes, boreholes, and anchor holes, we found that the groundwater was located below an elevation of 470 m and was buried at a shallow level inside the slope. The horizontal depth of the water table was 15–25 m—thus, the lower the elevation, the shallower the depth of burial.
Behavior of the Slope Rock Masses
Construction Process of the Slope
The slope was excavated mainly by presplitting blasting (Figure 5). The presplitting hole and buffering hole were designed as inclined holes according to the excavation face, and the main blasting hole was designed as a vertical hole with a depth of 7.5 m. For each stage of the slope, the presplitting holes were formed once, and the main blasting holes were formed by blasting in two steps.
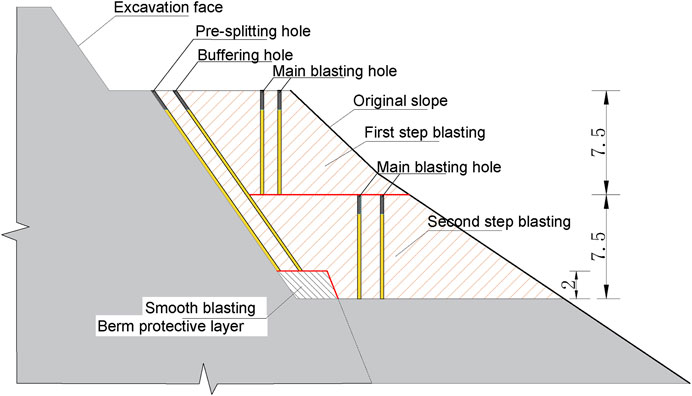
FIGURE 5. Blasting excavation method.
The excavation of the slope started in November 2015. By May 2016, the excavation of the slope above an elevation of 485 m was finished. The construction of the slope was suspended until April 2018, and construction resumed on April 9, 2018. Then, until May 9, 2018, the slope at an elevation range of 485–470 m was excavated in place. From July 2018 to March 2019, the excavation of the slope at an elevation range of 470–455 m was finished, during which time six blasts were carried out. As of June 2019, the slope above Highway 1 (elevation 455 m) had been excavated completely, and a total of five sets of multipoint displacement meters (M18-22ZPR) and nine sets of anchor dynamometers (D01ZBP, D10–17ZPR) had been installed.
Deformation and Failure Process of the Slope
The main deformation process of the excavation slope was categorized into three stages (Figure 6A), and each stage included to the process of “excavation–deformation and damage–verification–reinforcement–deformation convergence.” Curves of the maximum deformation vs. time of multipoint displacement meters are shown in Figure 6B. The arrangement of the monitoring instruments, as well as the time and range of each blast, are shown in Figure 6C.
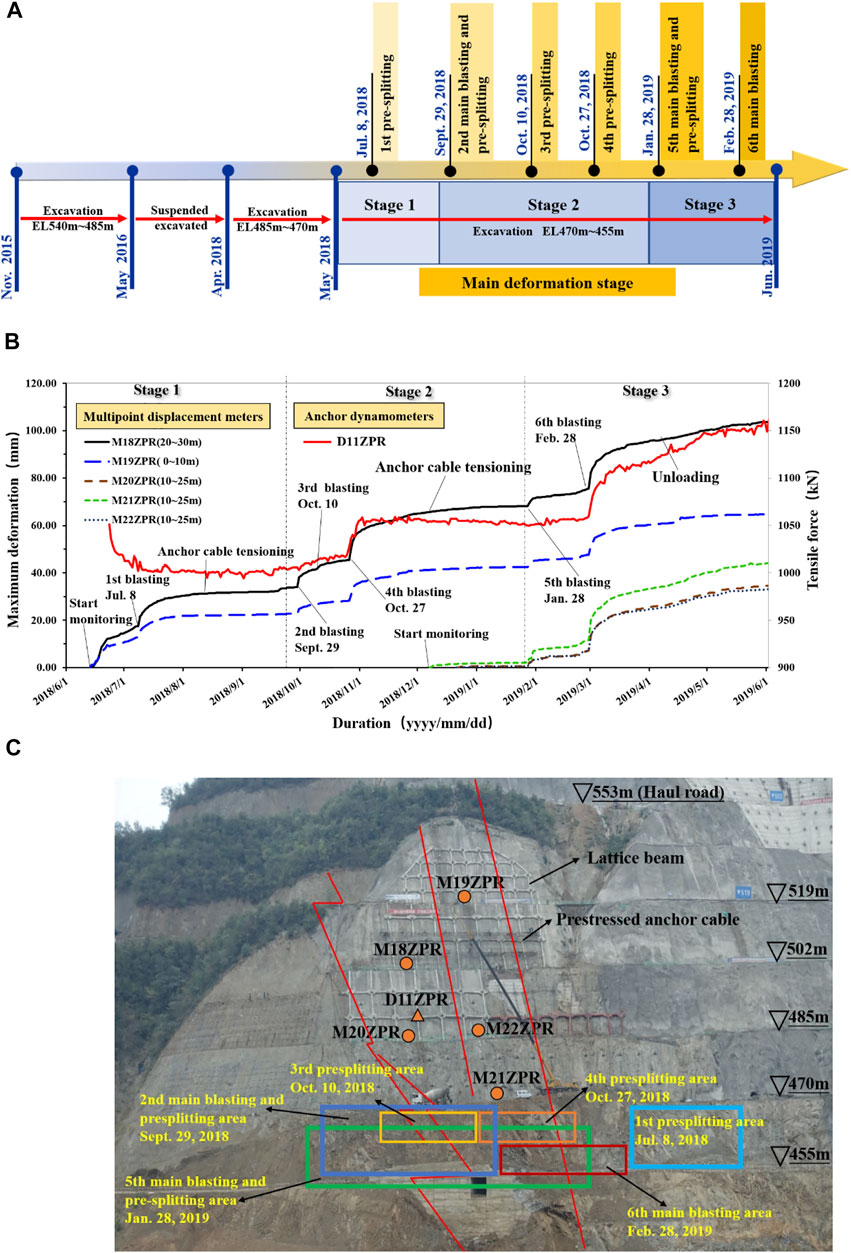
FIGURE 6. Deformation process of the excavation slope: (A) three stages; (B) deformation curves; (C) range of each blasting.
Stage 1
After excavation of the slope in the elevation range of 485–470 m, we found cracks on the inner side of the road at an elevation of 502 m, and three horizontal cracks appeared on the excavated face above an elevation of 519 m. On July 8, 2018, after the first presplitting blasting of the slope at the elevation range of 470–455 m, the shotcrete on the downstream side of the slope in the elevation range of 519–502 m showed a bulging phenomenon. In addition, cracks also appeared in the anchor pier and lattice beam (Figure 7A).
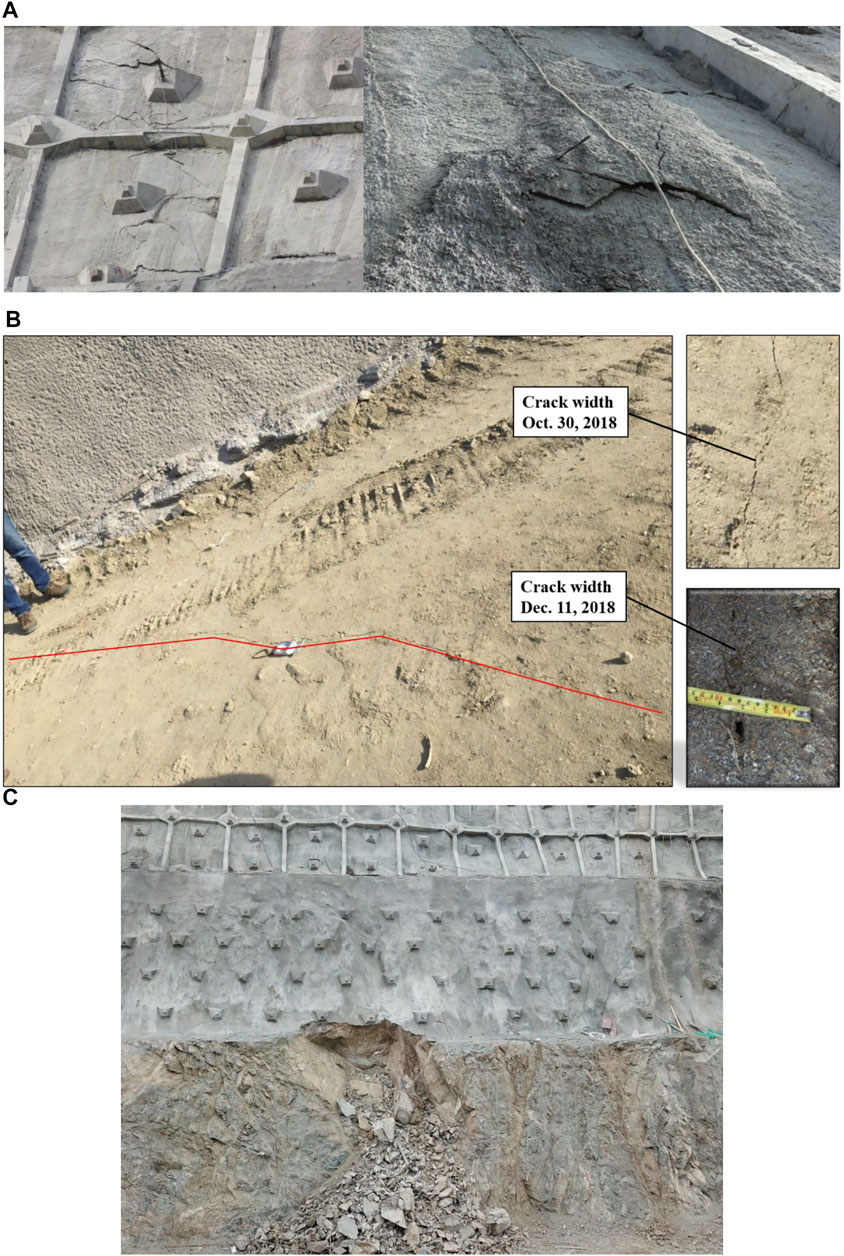
FIGURE 7. Failure behaviors of the excavation slope: (A) stage 1; (B) stage 2; (C) stage 3.
Multipoint displacement meters M18ZPR and M19ZPR were installed on June 13, 2018. After installation, the measured value continued to increase. The deep deformation measured by M18ZPR and M19ZPR mainly occurred in intervals of 20–30 m and 0–10 m, respectively. After the first blasting on 8 July 2018, all meters showed a step-like jump in growth. Then, the excavation was suspended, and additional support measures were considered to reinforce the slope. The reinforcing support measures featured the use of long prestressing cables that ran through the structural surfaces fz39 and L920. The prestressing cable tension was either 1,000 or 1,500 kN, and the length was between 35 m and 60 m. With the installation of additional cable support measures, the curves of deformation vs. time gradually converged. By the end of September 2018, the deformation obtained by the multipoint displacement meters M18ZPR (20–30 m) and M19ZPR (0–10 m) reached 26.2 and 14.6 mm, respectively.
Stage 2
On September 29, October 10, and October 27, 2018, the slope was excavated by blasting three times in the elevation range of 470–455 m. The measured values of M18ZPR and M19ZPR in each blasting also showed a step-like jump in growth with a large value. Obvious cracking occurred at the excavation face and along the rear edge of the slope (elevation 553 m), and the cracks tended to grow (Figure 7B).
Thereafter, the excavation was suspended again. Priority was given to the construction of prestressed cables. By the end of December 2018, the additional support measures (designed in the first stage) above 470 m were completed. The curves of deformation vs. time gradually converged again. By the end of January 2019, the deformation of the multipoint displacement meters M18ZPR (20–30 m) and M19ZPR (0–10 m) reached 51.9 and 30.83 mm, respectively. In addition, three sets of multipoint displacement meters M20ZPR, M21ZPR, and M22ZPR were installed in December 2018. By the end of January 2019, the measured values increased slightly, with a maximum of 1.86 mm.
Stage 3
From January 28 to February 28, 2019, the remaining part of the slope with an elevation range of 470–455 m was excavated by blasting. After blasting, one anchor pier cover at an elevation of 472 m appeared to be fractured, the transverse crack width of the slope with an elevation of 471 m increased significantly, and the shotcrete on the slope above an elevation 471 m showed a bulging phenomenon. On March 8, 2019, after rainfall, local collapse failure occurred along the slope below an elevation of 472 m and above fault fz39, with a volume of approximately 40 m3 (Figure 7C).
After the sixth blasting, the measured values of five sets of multipoint displacement meters increased greatly. As of June 2019, the measured values of M18ZPR, M20ZPR, M19ZPR, M22ZPR, and M21ZPR increased by 23.46, 29.36, 15.04, 21.90, and 34.85 mm, respectively.
Monitoring Data Analysis
Five sets of multipoint displacement meters constituted two monitoring sections perpendicular to the excavation face. The multipoint displacement meters M18ZPR and M20ZPR were located on the upstream side, and M19ZPR, M22ZPR, and M21ZPR were located on the downstream side. Figures 8A–D shows the positional connection between the multipoint displacement meters, cables, and structural surfaces in typical sections. Figures 9A–C shows the curves of deformation vs. time and cable tension vs. time.
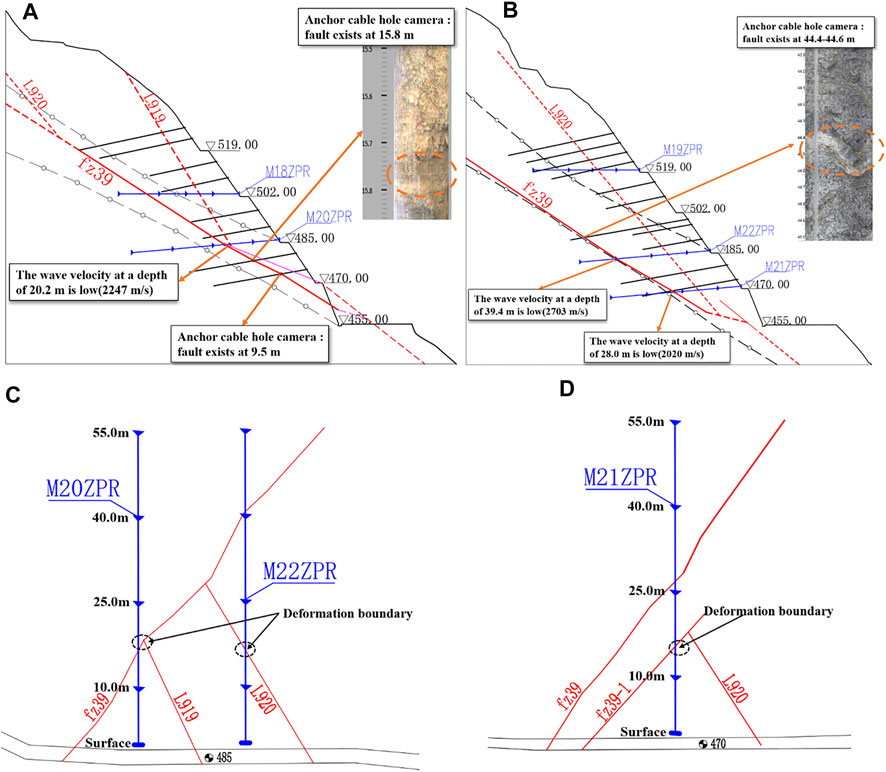
FIGURE 8. The positional connection between multipoint displacement meters, cables, and structural surfaces in typical sections: (A) upstream longitudinal profile; (B) downstream longitudinal profile; (C) elevation 485 m flat section; (D) elevation 470 m flat section.
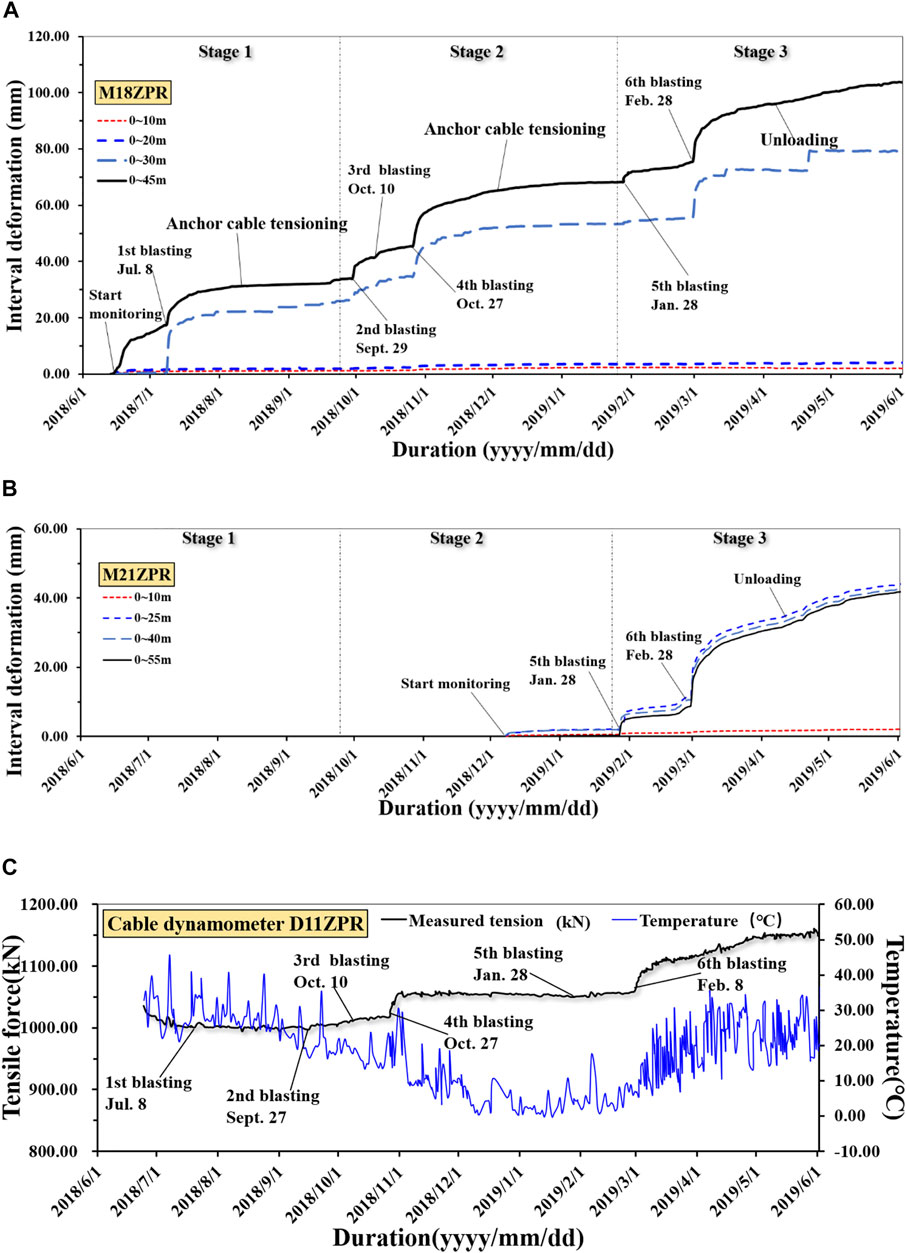
FIGURE 9. The curves of deformation vs. time and cable tension vs. time: (A) M18ZPR; (B) M21ZPR; (C) D11ZPR.
Relationship Between Deformation Depth and Structural Surface
The deep-seated deformation measured by the multipoint displacement meters occurred mainly in the hole-depth ranges of 20–30 m (M18ZPR), 0–10 m (M19ZPR), 10–25 m (M20ZPR), 10–25 m (M21ZPR), and 10–25 m (M22ZPR). These results were consistent with the inferred location of structural surfaces fz39 and L920 in the slope. This finding indicated that the deformation failure of the slope was controlled mainly by the structural surfaces fz39 and L920 and mainly occurred in the area within the intersection of structural surfaces fz39 and L920. The failure showed obvious block deformation behaviors, and the deformation of the structural surface accounted for a high proportion of the total deformation.
Curves of Deformation vs. Time
The measured values of the multipoint displacement meters all showed step-like jump growth, and the jumping times were all related to the nearby blasting times. As of June 2019, the measured values were 104.84 mm (M18ZPR), 64.92 mm (M19ZPR), 36.57 mm (M20ZPR), 46.42 mm (M21ZPR), and 35.20 mm (M22ZPR). Although the overall deformation of the slope has not yet converged, the deformation rate has been decreasing gradually. Because M20ZPR, M21ZPR, and M22ZPR detected only the deformation caused by the partial excavation of the slope at the elevation range of 470–455 m, the total deformation was smaller than that measured by M18ZPR and M19ZPR, but the recent increments varied significantly.
Temporal and Spatial Characteristics of Deformation
The time-dependent deformation characteristics of the slope were not obvious. The deformation mainly occurred at the blasting time of each stratified excavation and gradually stabilized after the excavation stops. This meant that the deformation was affected mainly by unfavorable geological structural surfaces, excavation unloading, and blasting vibrations. Furthermore, the stress-rebalancing adjustment time after excavation and blasting disturbance was increased.
According to spatial deformation characteristics, the deformation of the multipoint displacement meter crossing fault fz39 in the upstream was large, whereas that of crossing fracture L920 was slightly smaller and showed non-coordinated deformation along the upstream and downstream sides. After the blasting on 28 February 2019, the deformation increment showed that the deformation in the lower part was larger than that in the middle and upper parts.
Curves of Cable Tension vs. Time
The cable tension continued to change with the deformation of the slope. Since late October 2018, affected by blasting, the cable tension began to grow simultaneously along with the deformation. In particular, since the blasting on 28 February 2019, the cable tension growth significantly accelerated, and the measured jumping growth time and change law were consistent with the deformation. As of June 2019, the measured value of D11ZPR in the lower part of the slope reached 114.3% of the cable locked value 1,000 kN.
Influencing Factors of Deep-Seated Deformation
Internal Factors
A large number of rock engineering accidents have shown that unstable rock masses often suffer a slip, tensile fracture, or distorted deformation along a suitable structural surface or the combined boundary of multiple structural surfaces, resulting in the instability of the rock slope. According to an analysis of the geological conditions and deformation characteristics, the deformation behavior of the slope was closely related to fault fz39 and fracture L920. Fault fz39 was inclined toward the downstream riverbed side, which was an extroverted structural surface with a medium dip angle. Fault fz39 ran through the entire slope from top to bottom, and the physical and mechanical properties were very poor. Combining fault fz39 with fracture L920 could form a double-sided sliding block, KT21 (Figure 10A). The orientation of the intersection line was on average 190°∠38°, which was inclined toward the outside of the slope. The dip angle of the intersection line was less than the slope angle, and block KT21 was a potentially unstable block. The top elevation of block KT21 was approximately 570 m, the revealed elevation of the intersection line was approximately 420 m, and the total volume was approximately 7.9 × 10⁴ m3 (Figures 10B,C). The block KT21 is a typical double-sided sliding wedge (Figure 10D).
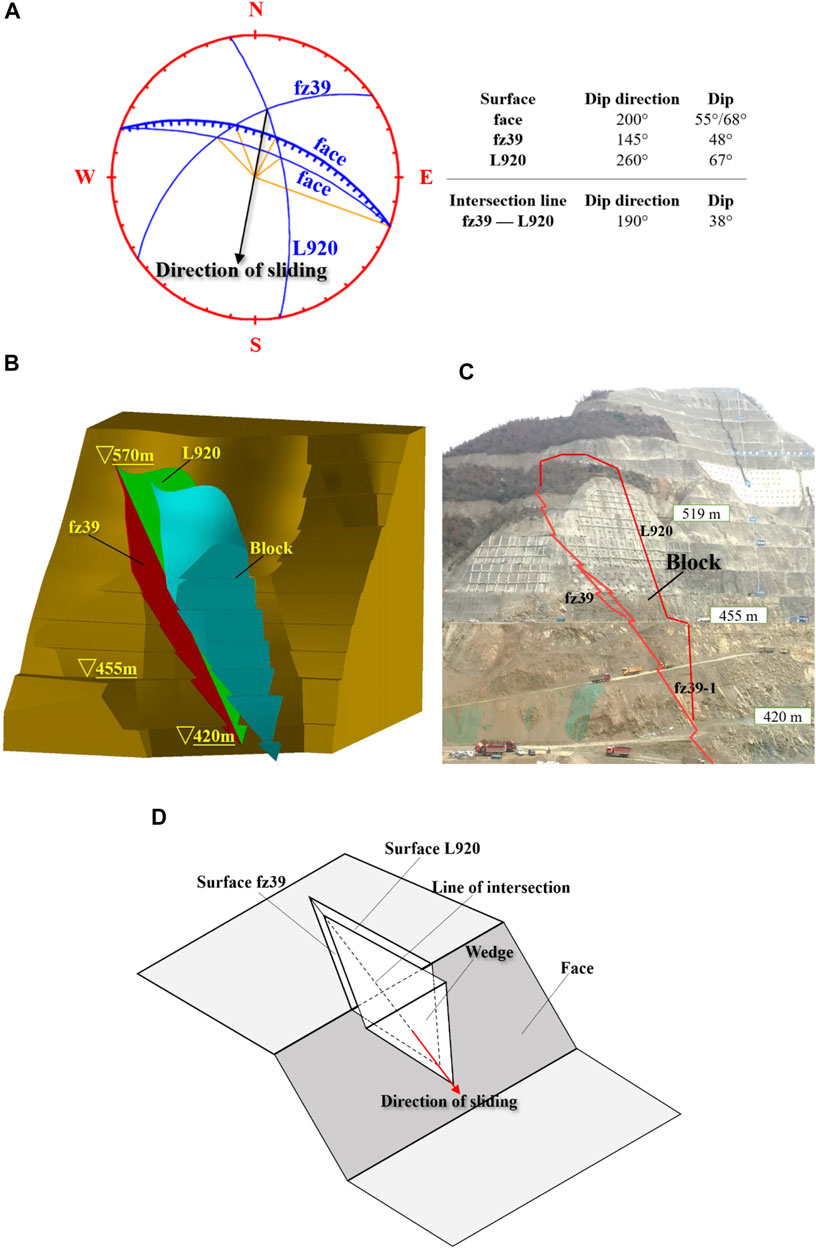
FIGURE 10. Block KT21: (A) stereographic projection; (B) block shape; (C) block location; (D) wedge failure mode.
Extrinsic Factors
Excavation and Unloading
The slope was excavated and unloaded from top to bottom on a large scale. The excavated volume at each grade of slope gradually increased, and the grade of the excavation slope became steeper. The rock masses were affected by unloading disturbance, and the in situ stress field was constantly changing, which made the slope structure and its intermechanical relationship changed adversely. In particular, in the process of excavating the slope at an elevation range of 485–455 m, fault fz39 was gradually revealed on the excavation face. Fault fz39 was inclined toward the outside and cut along the foot of the excavation slope. As a result, the supporting effect of the “locking section” at the foot of the slope was weakened, and the bearing capacity decreased significantly.
Blasting Vibration
The blasting load acted directly on the slope as an external force, which reduced the shear resistance of the rock mass structure. The repeated vibration of blasting reduced the mechanical strength of the structural surface (Wang and Qian, 1995; Liu, 2007). By analyzing the curves of deformation vs. time, blasting vibration was undoubtedly an important external inducement to aggravate slope deformation. The deformation occurred mainly after each blasting time. The increments of multipoint displacement meters measured values ranged from 1.0 to 16.00 mm within 7 days after each blasting, which then gradually stabilized after excavation stopped. After the sixth blasting at the end of February 2019, the deformation rate was large in the first 3 days, and the maximum deformation rate of the orifice reached 5.74 mm/d (M18ZPR), 3.10 mm/d (M19ZPR), 4.87 mm/d (M20ZPR), 6.45 mm/d (M21ZPR), and 5.13 mm/d (M22ZPR) (Figure 11). Then, the deformation rate gradually decreased. Certain fluctuations, however, did not fully converge, which indicated that the stress rebalancing adjustment time was long after blasting disturbances during slope excavation.
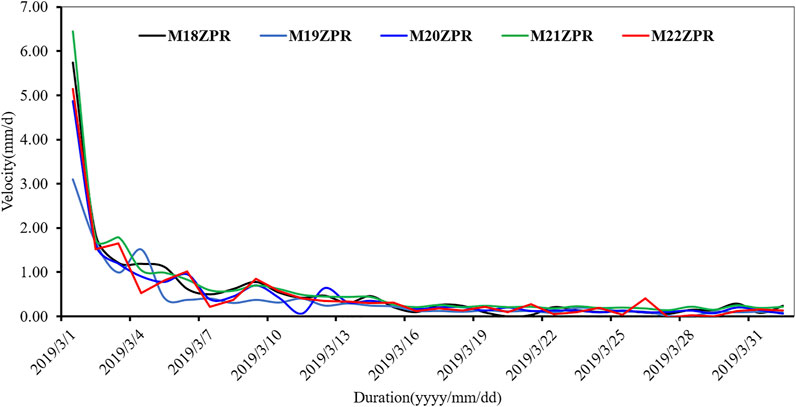
FIGURE 11. Deformation rate after the sixth blasting.
Rain
Rainfall also had a certain influence on deformation, according to monitoring data analysis, and the observed values of multipoint displacement meters rose slightly after rainfall. Fault fz39 had a certain water-blocking effect. Groundwater activity was strong in the poorly weathered rock mass above fault fz39 and below 470 m elevations. Groundwater had a shallow burial depth, with a horizontal depth of less than 30 m, which was the major enhanced drainage region.
Deformation Mechanism
The slope presented a typical wedge failure mode. Fault fz39 was the upstream slip surface A of the wedge, with poor properties and a relatively slow dip, which was the main controlling structural surface of the wedge. Fracture L920 and the same group of fractures were the downstream slip surface B of the wedge, which was a release surface of the wedge. The sliding direction was downward sliding along the intersection line of fz39 and L920. The deep-seated deformation of the excavation slope occurred at the junction of the wedge and bedrock, which was affected mainly by unfavorable geological structure surfaces, excavation unloading, and blasting vibration. With the excavation of the slope, fault fz39 was gradually revealed on the excavation face, and the supporting effect of the “locking section” at the foot of the slope was weakened. These factors contributed to a decrease in the overall bearing capacity of the slope. For the blasting near the area, because of the action of stress waves, the rock mass would deform under the instantaneous impact of the blasting power and collapsed locally, which generally was a local failure. For the blasting far area, such as the area near fault fz39, the stress wave evolved into a seismic wave. The original structural surfaces were dislocated or expanded by seismic inertia force, which reduced the shear performance of the rock mass structure. This kind of damage affected a wide spatial range and penetrated deep into the interior of the rock mass. As a result, when the seismic inertia force caused by the seismic wave reached a certain intensity, it may have contributed to dynamic instability.
Reinforcement Design and Numerical Analysis of the Slope Stability
Reinforcement Support Measures
We established the reinforcement design scheme of unloading at the top of the slope and large-tonnage cables based on geological circumstances, deformation characteristics, site construction, and general project needs.
Unloading Measures
The unloading area had the lowest elevation of 519 m and the highest elevation of 637 m. Seven floors were dug in the unloading area. The overall slope ratio was one to one. The entire volume of the unloading area was around 107,400 m3, with block KT21’s capacity reduced by roughly 29,000 m3.
Prestressed Cable Measures
On the slope with an elevation range of 502–470 m, 195 cables with tensile forces of 1,000–1,500 kN have been installed. Additionally, concrete slabs and three rows of wires (T = 2,700 kN) were placed on the slope between 485 and 470 m, concrete slabs and four rows of cables (T = 2,700 kN) were placed between 470 and 455 m, and concrete slabs and four rows of cables (T = 2,700 kN) were placed between 455 and 429 m.
Drainage Measures
At altitudes of 455 m and 519 m, two draining adits were constructed, and 35 m deep drainage holes were installed at the top of the adit to lower groundwater levels.
Numerical Analysis of Slope Stability
The use of a numerical method to analyze the stability of rock slopes has wide applicability. This method not only can simulate the complex mechanical and structural characteristics of a rock mass but also can analyze various boundary value problems and construction processes as well as predict and forecast the project. We adopted the commercial software FLAC3D for numerical calculations. First, we established a 3D numerical analysis model of the studied slope and simulated the current excavation state by combining forward and backward analysis. Second, we simulated the subsequent excavation and reinforcement process of the slope. Finally, we used the strength reduction method to calculate the stability safety factor of the slope under various working conditions during the construction period and operation period.
Numerical Analysis Models
The numerical analysis model of the slope is shown in Figures 12A–C; its dimensions were 600 × 500 × 700 m (X × Y × Z). The X-direction of the model was parallel to the water flow direction, and its positive direction pointed downstream. The Y-direction was consistent with the dam axis, and its positive direction pointed from the river valley to inside the mountain. The Z-direction was vertical, and its positive direction pointed upward. The mesh model was composed of 106,000 nodes and 585,600 elements.
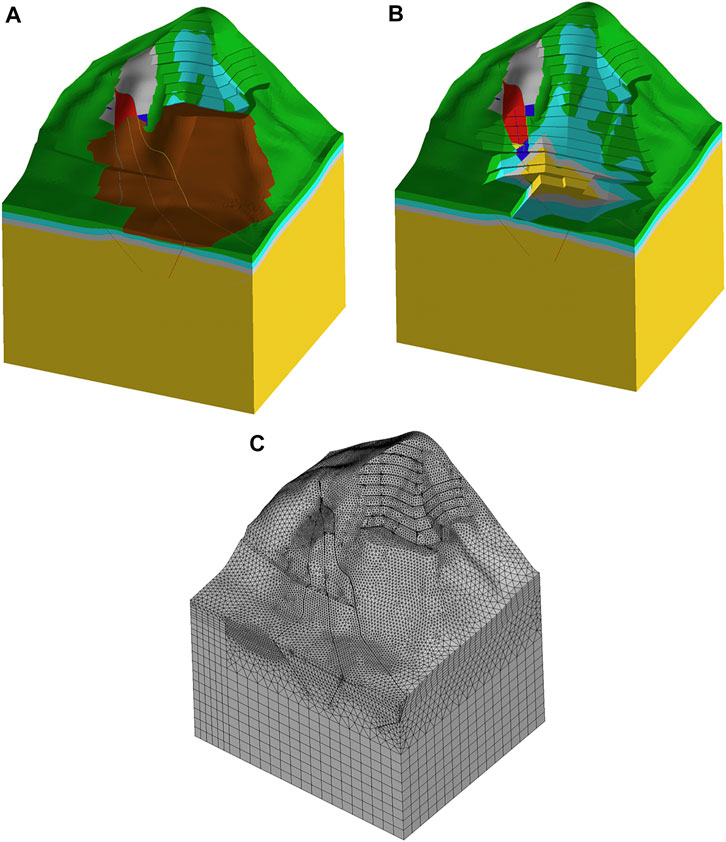
FIGURE 12. Analysis model: (A) origin slope; (B) excavation slope; (C) mesh grid.
The lithology of the slope stratigraphy was mainly diorite. Based on weathering characteristics of the rock mass, the model was divided into four zones from top to bottom: a strongly weathered zone, weakly weathered upper zone, weakly weathered lower zone and micro-neoliths. The geological structure mainly considered six structural surfaces: faults fz39, fz46, and fz54, fractures L919 and L920, and dykes. In the model, the excavation area, unloading area, and cable measures were considered in the simulation of the excavation process of the slope.
The prestressed anchor cables were simulated using the structural element “cable” in flac3d, which considers the cable’s axial tensile-compression properties, the contact properties of the cable-rock interface, and the magnitude of the prestress value.
Mechanical Parameters
The thickness of the strongly weathered zone on the slope was relatively large, generally 15–30 m. The rock mass was broken and mainly of a granular structure. Affected by blasting excavation, the strongly weathered rock mass was disturbed, and the strength of the rock mass decreased. According to the results of rock laboratory tests, in situ tests, and the development of structural surfaces, combined with the characteristics of the rock mass of the excavated slope, we proposed the main mechanical indexes (Table 1).
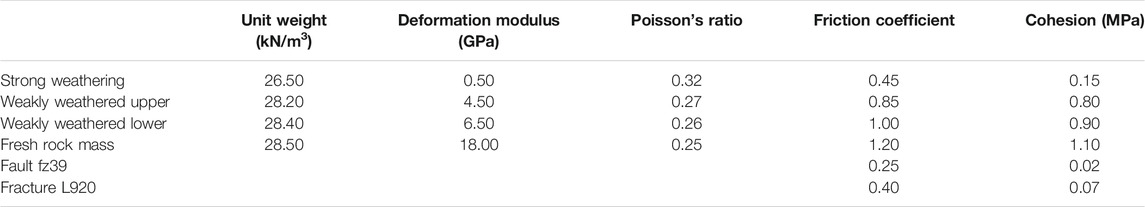
TABLE 1. Mechanical parameters of slope rock mass and structural surfaces.
We concluded that structural surfaces fz39, L920, and their combined block were the controlling factors of slope stability, and the decrease of shear strength of the structural surfaces caused by blasting excavation was an important reason for deep-seated deformation. Therefore, the shear strength parameter of structural surfaces is a dynamic parameter, which is a key variable for slope stability analysis. According to macroscopic geological characterizations, fault fz39 is a weak structural surface of “mud with rock debris type,” and fracture L920 is a structural surface of “rock block and rock debris with mud type.” On this basis, we used the uniform design method for inversion and evaluation. The inversion analysis had two goals: 1) the incremental deformation values measured by the multipoint displacement meters; and 2) the current slope should be close to the critical state, and the safety factor of slope stability should be between 1.05 and 1.00. According to the inversion results, the cohesion of fault fz39 was 20 kPa, and the friction coefficient was 0.25; the cohesion of fracture L920 was 70 kPa, and the friction coefficient was 0.40.
Blast Vibration Load
Because of the large number of elements in the numerical model, the quasi-static method was utilized in this research to analyze the blasting vibration effect of slope equivalently. Define
Where,
Numerical Analysis Results
We simulated the “excavation-support” process in which the slope was excavated at an elevation of 455 m using the structural surface mechanics parameters obtained from the inversion. The results better reflected the actual deformation behavior of the excavation slope. The areas with significant deformation were concentrated mainly in the range of block KT21, composed of structural surfaces fz39 and L920 (Figure 13A), and the deformation vectors were mainly downward along the slope (Figure 13B). When excavating the slope in the elevation range of 470–455 m, the deformation changed abruptly, with a growing range of 60.0–160.0 mm.
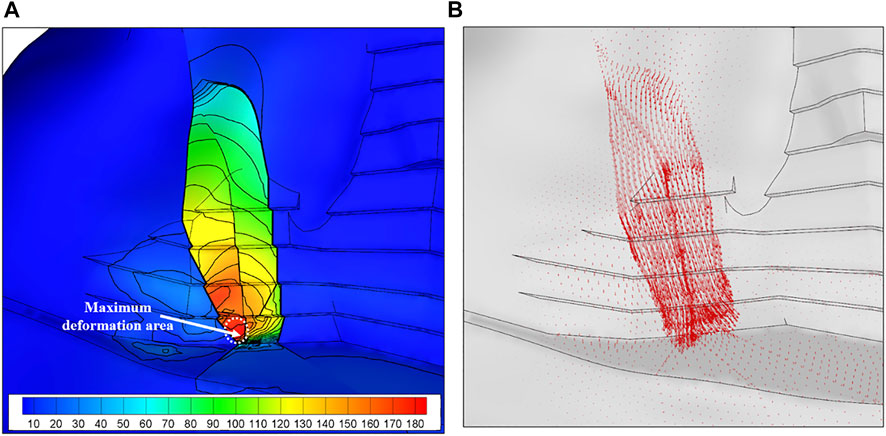
FIGURE 13. Distribution of incremental displacement when excavating to elevation 455 m: (A) displacement; (B) displacement vector.
The distributions of the incremental shear strain on the excavation slope are shown in Figures 14A–C. When the slope was excavated above an elevation of 485 m, the shear strain concentration zones were distributed mainly in the structural surfaces fz39 and L920 in the middle of the slope, and there were no obvious deformation signs at this stage. When the slope was excavated at an elevation of 485–470 m, the shear strain concentration zones appeared on the excavation face, and deep shear strain concentration zones developed along the structural surfaces. At this stage, cracks appeared on the excavation face, and the deep parts of the slope began to deform. When the slope was excavated at an elevation range of 470–455 m, a shear strain concentration zone appeared at the front edge of the excavation slope, and the deep shear strain concentration zone had been penetrated, corresponding to local slippage at the front edge of the slope and a sudden change of the deep deformation.
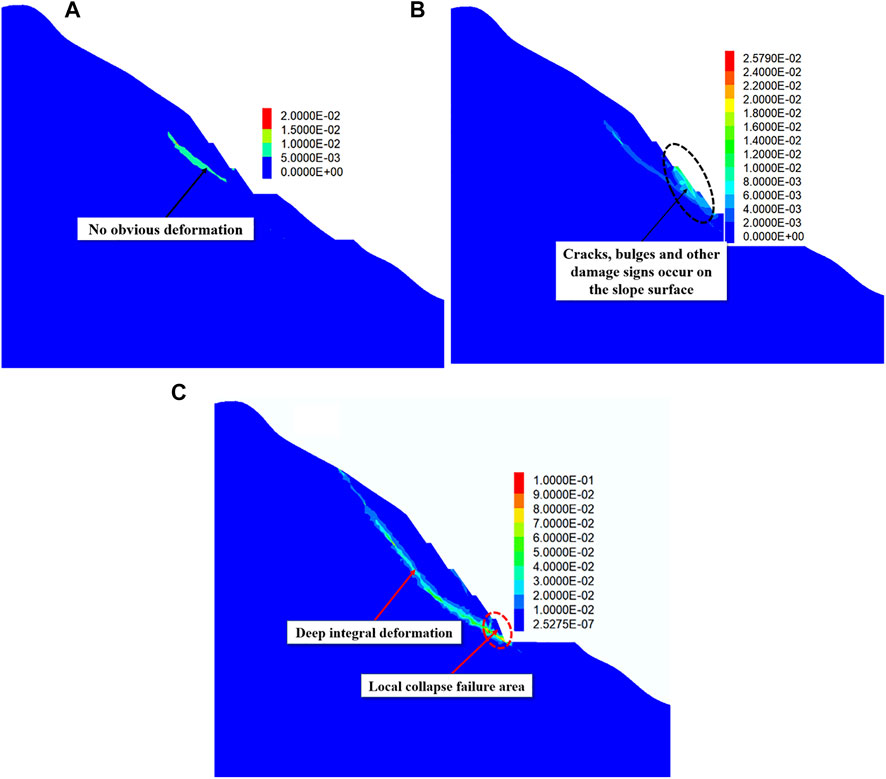
FIGURE 14. Evolution law of shear strain zone: (A) elevation 485 m; (B) elevation 470 m; (C) elevation 455 m.
On the basis of the current state of the excavation slope, we used the latest reinforcement support measures to simulate the construction process of “unloading-support-excavation-support” for the subsequent slope. The results showed that the excavation of the slope below an elevation of 455 m had a limited influence on the reinforced upper slope. The incremental deformation of the excavation slope at an elevation range of 470–455 m was less than 10.0 mm, and the incremental deformation of the excavation slope above an elevation of 470 m was generally less than 5.0 mm. For the excavation of the slope below an elevation of 455 m, the maximum incremental deformation within block KT21 was approximately 50.0 mm, and the remaining parts generally were less than 20 mm.
The essence of sliding failure of the slope is an unstable failure caused by insufficient shear strength of the rock mass or structural surfaces. We used the strength reduction method to calculate the failure mode and stability safety factor of the slope. The results showed that 1) the failure mode is the sliding of the combined block of structural surfaces fz39 and L920 along the direction of the intersection line. 2) In the current state, the safety factor increased from 1.04 to 1.80 after the implementation of reinforcement measures, and the safety of the slope was significantly improved. 3) The safety factor when all excavation was completed was 1.74. 4) The safety factors during project’s operation were between 1.50 and 1.70. In general, the efficacy of the reinforcing design measures was favorable, and the stability of the excavation slope was guaranteed.
Discussions
We identified five consistent correspondences in the mechanical response of the slope rock mass. Deformation depth corresponded to the buried depth of structural surfaces. The significant deformation region corresponded to the cracking failure on the slope surface. The region with the most deformation was also the area with the most cable force. The stepwise growth of slope deformation was consistent with nearby blasting. The obvious increase in deformation was consistent with a significant rainfall. This relationship of the excavation slope occurred mostly within the range of structural surfaces fz39 and L920, demonstrating the existence of the block. Block KT21 was the key to controlling the stability of the whole slope.
Fault fz39 was the controlling structural surface for slope stability. Identifying the extension and development of fault fz39 in the slope was essential for further understanding the damage range, stability analysis, and reinforcement design. During the construction period, in-hole video recording and acoustic testing were conducted on the boreholes, multipoint displacement meter holes, and cable holes. We determined the distribution characteristics of fault fz39 according to the presence of acoustic anomalies, collapse phenomena, or developed structural surfaces in the test holes. The length and arrangement scheme of cables initially were determined based on the distribution of the structural surfaces. Then, to ensure the slope’s stability, the tension and quantity of cables were calculated based on the numerical analysis results.
The impact of excavation blast is frequently disregarded from slope stability analysis during the slope design stage. For this project, however, the influence of blasting on the slope was no longer local but instead had extended to the deep part of the slope. The deformation increased stepwise with the blasting excavation of the slope near the fault. It also increased significantly compared with that without blasting, particularly through the structural surfaces fz39 and L920. Rock excavation and blasting is a complex process, and present understanding of the blasting and crushing mechanisms of rock is limited. Controlling blasting vibration to ensure the safety of the slope is a challenge that must be addressed for this type of structural surface-controlled slope.
Conclusion
In this paper, we presented a case study of large deep-seated deformation during slope excavation. The study focused on the geological conditions, the deformation and failure characteristics during the slope excavation process, and the attempts made to enhance slope stability. The following insights and conclusions can be noted:
1. Based on real-time monitoring information, the main deformation of the excavation slope was divided into three stages, and each stage corresponded to the process of “excavation–deformation–analysis and demonstration–reinforcement design–deformation convergence.” The main deformation range and depth coincided with the position of the structural surfaces fz39 and L920.
2. The block formed by fault fz39 and fracture L920 was a typical wedge failure mode, which had primary control over the stability of the slope. With the excavation of the slope, fault fz39 gradually was revealed on the excavation face, and the supporting effect of the “locking section” at the foot of the slope was weakened. The repeated vibration of blasting reduced the mechanical strength of the structural surfaces and the overall shear performance of the rock mass structure.
3. The principle of reinforcement is to reasonably increase the density, length, and tension of cables in combination with the buried depth and distribution of structural surfaces. Combined with the shape of block KT21, which is “wide at the top and narrow at the bottom, top-heavy” the sliding force of the block was reduced by unloading at the top of the excavation slope. The excavation must be stopped before the adjustment of slope foot reinforcements. In the process of excavation, it is necessary to reduce the charge of single holes, strictly control the blasting intensity, and dynamically adjust by sections and sequences.
4. At present, the slope has experienced several obvious deformation growth processes. The incremental deformation was used to invert the mechanical parameters of the structural surface. The numerical analysis results obtained were in good agreement with the monitoring data. The efficacy of the reinforcing design measures was favorable, and the stability of the excavation slope was guaranteed.
With the implementation of unloading on the natural slope and cable tensioning, the deformation rate of the measured values tended to converge, no new cracks appeared on the slope surface, and the existing failure parts, such as bulging and cracks, did not significantly develop.
Data Availability Statement
The original contributions presented in the study are included in the article/Supplementary Material, further inquiries can be directed to the corresponding author.
Author Contributions
All authors listed have made a substantial, direct, and intellectual contribution to the work and approved it for publication.
Funding
The research was funded by the National Key Research and Development Project of China (Grant No. 2017YFC1501305) and the National Natural Science Foundation of China (Grant No. 41807249).
Conflict of Interest
The authors declare that the research was conducted in the absence of any commercial or financial relationships that could be construed as a potential conflict of interest.
The reviewer DX declared a shared affiliation with several of the authors XD, SH to the handling editor at time of review
Publisher’s Note
All claims expressed in this article are solely those of the authors and do not necessarily represent those of their affiliated organizations, or those of the publisher, the editors and the reviewers. Any product that may be evaluated in this article, or claim that may be made by its manufacturer, is not guaranteed or endorsed by the publisher.
References
Chen, Z. Y., Mi, H. L., and Wang, X. G. (2001). A Three-Dimensional Limit Equilibrium Method for Slope Stability Analysis. Chin. J. Geotechnical Eng. 36 (07), 1579–1587. doi:10.3321/j.issn:1000-4548.2001.05.001
Dai, Z. H. (2002). Study on Distribution Laws of Landslide-Thrust and Resistance of Sliding Mass Acting on Antislide Piles. Chin. J. Rock Mech. Eng. 4, 517–521. doi:10.3321/j.issn:1000-6915.2002.04.013
Dawson, E. M., Roth, W. H., and Drescher, A. (1999). Slope Stability Analysis by Strength Reduction. Géotechnique 49 (6), 835–840. doi:10.1680/geot.1999.49.6.835
De Blasio, F. V. (2011). Introduction to the Physics of Landslides: Lecture Notes on the Dynamics of Mass Wasting. Berlin: Springer Science & Business Media.
Donald, I. B., and Chen, Z. (1997). Slope Stability Analysis by the Upper Bound Approach: Fundamentals and Methods. Can. Geotech. J. 34 (6), 853–862. doi:10.1139/t97-061
Dong, Z. H., Ding, X. L., Li, Q. J., Yu, S. X., and Lu, B. (2013). Numerical Simulation of High Slope Stability of in Construction Period at Dabenliugou Quarry in Construction Period. Yangtze River 14, 13–17. doi:10.16232/j.cnki.1001-4179.2013.14.008
Ersöz, T., and Topal, T. (2018). Assessment of Rock Slope Stability with the Effects of Weathering and Excavation by Comparing Deterministic Methods and Slope Stability Probability Classification (SSPC). Environ. Earth Sci. 77 (14), 1–18. doi:10.1007/s12665-018-7728-4
Ge, X. R., and Liu, J. W. (1988). Study on the Shear Resistance Behaviour of Bolted Rock Joints. Chin. J. Geotechnical Eng. 10 (1), 8–19. doi:10.3321/j.issn:1000-4548.1988.01.002
Gu, J. C., Shen, J., Chen, A. M., and Ming, Z. P. (2000). Damage Tests of Pre-Stressed Anchor Bars in Corrosion Environment. Chin. J. Rock Mech. Eng. S1, 917–921. doi:10.3321/j.issn:1000-6915.2000.z1.021
Ha, Q. L. (1997). Rock Slope Engineering and Unloading Nonlinear Rock Mass Mechanics. Chin. J. Rock Mech. Eng. 4, 386–391. doi:10.3321/j.issn:1000-6915.2008.11.006
Hu, Y., Lu, W., Wu, X., Liu, M., and Li, P. (2018). Numerical and Experimental Investigation of Blasting Damage Control of a High Rock Slope in a Deep valley. Eng. Geology. 237, 12–20. doi:10.1016/j.enggeo.2018.01.003
Huang, R. Q. (2007). Large-Scale Landslides and Their Sliding Mechanisms in China since the 20th Century. Chin. J. Rock Mech. Eng. 3, 433–454. doi:10.3321/j.issn:1000-6915.2007.03.001
Huang, R. Q. (2008). Geodynamical Process and Stability Control of High Rock Slope Development. Chin. J. Rock Mech. Eng. 8, 1525–1544. doi:10.3321/j.issn:1000-6915.2008.08.002
Li, S. C. (2010). Failure Mechanism and Engineering Application of Anchored Intermittent Jointed Rock Mass. Beijing: Science Press.
Liu, J. J. (1990). Collapse Process and Cause Analysis of Left Bank Slope of Manwan Hydropower Station. Yunnan Water Power 2, 31–37.
Liu, M. S. (2007). The Excavation Blasting Technique of Particularly High and Steep Slope and the Influence on its Stability. Ph.D. Hefei: University of science and technology of China.
Lu, W. B., Zhou, C. B., Chen, M., Jin, L., and Yan, P. (2008). Research on Transient Characteristics of Excavation Unloading. Chin. J. Rock Mech. Eng. 11, 2184–2192. doi:10.3321/j.issn:1000-6915.2008.11.003
Lu, W.-B., Hu, Y.-G., Yang, J.-H., Chen, M., and Yan, P. (2013). Spatial Distribution of Excavation Induced Damage Zone of High Rock Slope. Int. J. Rock Mech. Mining Sci. 64, 181–191. doi:10.1016/j.ijrmms.2013.08.030
Mantovani, F., and Vita-Finzi, C. (2003). Neotectonics of the Vajont Dam Site. Geomorphology 54 (1-2), 33–37. doi:10.1016/S0169-555X(03)00053-9
Onederra, I. A., Furtney, J. K., Sellers, E., and Iverson, S. (2013). Modelling Blast Induced Damage from a Fully Coupled Explosive Charge. Int. J. Rock Mech. Mining Sci. 58, 73–84. doi:10.1016/j.ijrmms.2012.10.004
Petley, D. N., and Allison, R. J. (1997). The Mechanics of Deep‐Seated Landslides. Earth Surf. Process. Landf 22, 747–758. doi:10.1002/(SICI)1096-9837(199708)22:83.3.CO;2-R
Petley, D. N., Mantovani, F., Bulmer, M. H., and Zannoni, A. (2005). The Use of Surface Monitoring Data for the Interpretation of Landslide Movement Patterns. Geomorphology 66 (1-4), 133–147. doi:10.1016/j.geomorph.2004.09.011
Qiao, J. P. (2002). Structure and Shape of Landslide. Chin. J. Rock Mech. Eng. 9, 1355–1358. doi:10.3321/j.issn:1000-6915.2002.09.015
Qin, B. M., Tang, B., Zhang, L. P., and Xu, B. T. (2022). Influence of Slope Excavation on Stability of Wedge-Shaped Rock Block. Jiangsu Water Resour. 1, 5–9. doi:10.16310/j.cnki.jssl.2022.01.004
Segalini, A., and Giani, G. P. (2004). Numerical Model for the Analysis of the Evolution Mechanisms of the Grossgufer Rock Slide. Rock Mech. Rock Eng. 37 (2), 151–168. doi:10.1007/s00603-003-0016-x
Sheng, Q., Ding, X. L., Feng, X. T., and Zhang, Z. Q. (2000). Displacement Back Analysis for the High Slope of the Three Gorges Project Considering the Effect of Excavation Unloading. Chin. J. Rock Mech. Eng. 19 (z1, 987–993. doi:10.3321/j.issn:1000-6915.2000.z1.036
Wang, M. Y., and Qian, Q. H. (1995). Attenuation Law of Explosive Wave Propagation in Cracks. Chin. J. Geotechnical Eng. 2, 42–46. doi:10.1007/BF02943584
Wei, Z. A., Li, S. H., Wang, J. G., and Wan, L. (2006). A Dynamic Comprehensive Method for Landslide. control. Eng. geol. 84 (1-2), 1–11. doi:10.1016/j.enggeo.2005.09.019
Xia, Q. F., and Lu, J. Y. (1986). Analysis of the Causes of Landslides at the Tianshengqiao Ⅱ Hydropower Station Site. Bull. Soil Water Consery. 4, 35–40. doi:10.13961/j.cnki.stbctb.1986.04.009
Yang, Y., Sun, G., Zheng, H., and Qi, Y. (2019). Investigation of the Sequential Excavation of a Soil-Rock-Mixture Slope Using the Numerical Manifold Method. Eng. Geology. 256, 93–109. doi:10.1016/j.enggeo.2019.05.005
Yang, Y., Sun, G., Zheng, H., and Yan, C. (2020a). An Improved Numerical Manifold Method with Multiple Layers of Mathematical Cover Systems for the Stability Analysis of Soil-Rock-Mixture Slopes. Eng. Geology. 264, 105373. doi:10.1016/j.enggeo.2019.105373
Yang, Y., Xu, D., Liu, F., and Zheng, H. (2020b). Modeling the Entire Progressive Failure Process of Rock Slopes Using a Strength-Based Criterion. Comput. Geotechnics 126, 103726. doi:10.1016/j.compgeo.2020.103726
Yang, Y., Wu, W., and Zheng, H. (2021a). Stability Analysis of Slopes Using the Vector Sum Numerical Manifold Method. Bull. Eng. Geol. Environ. 80 (1), 345–352. doi:10.1007/s10064-020-01903-x
Yang, Y., Wu, W., and Zheng, H. (2021b). An Uzawa-Type Augmented Lagrangian Numerical Manifold Method for Frictional Discontinuities in Rock Masses. Int. J. Rock Mech. Mining Sci. 148, 104970. doi:10.1016/j.ijrmms.2021.104970
Yang, Y., Xia, Y., Zheng, H., and Liu, Z. (2021c). Investigation of Rock Slope Stability Using a 3D Nonlinear Strength-Reduction Numerical Manifold Method. Eng. Geology. 292, 106285. doi:10.1016/j.enggeo.2021.106285
Zhang, Y. L., Feng, X. T., Fan, J. H., and Fang, X. R. (2002). Study on the Interaction between Landslide and Passive Piles. Chin. J. Rock Mech. Eng. 6, 839–842. doi:10.3321/j.issn:1000-6915.2002.06.015
Zheng, Y. R., and Zhao, S. Y. (2004). Application of Strength Reduction Fem in Soil and Rock Slope. Chin. J. Rock Mech. Eng. 19, 3381–3388. doi:10.3321/j.issn:1000-4548.2001.05.001
Zheng, Y., Chen, C. X., Zhu, X. X., Pan, Z. Y., Ou, Z., Zhou, Y. C., et al. (2014). Node Quasi-Static Stability Analysis of Rock Slope under Excavation Blasting Based on UDEC. Chin. J. Rock Mech. Eng. 33 (s2), 3932–3940. doi:10.13722/j.cnki.jrme.2014.s2.068
Zheng, H., Yang, Y., and Shi, G. (2019). Reformulation of Dynamic Crack Propagation Using the Numerical Manifold Method. Eng. Anal. Boundary Elem. 105, 279–295. doi:10.1016/j.enganabound.2019.04.023
Zheng, H. (2007). A Rigorous Three-Dimensional Limit Equilibrium Method. Chin. J. Rock Mech. Eng. 8, 1529–1537. doi:10.3321/j.issn:1000-6915.2007.08.002
Zhou, H. M., Sheng, Q., Li, W. S., and Xiao, G. Q. (2004). Excavation-Disturbed Zone and Weaken Degree of Mechanical Properties for Rockmass of TGP Shiplock Slope. Chin. J. Rock Mech. Eng. 7, 1078–1081. doi:10.3321/j.issn:1000-6915.2004.07.004
Zhou, Y. (2015). Stability Improvement of Left Bank Slope of Toppling and Creeping Rock Mass of Longtan Hydropower Station. Hongshui River 1, 16–21. doi:10.3969/j.issn.1001-408X.2015.01.005
Zhu, D. Y., and Qian, Q. H. (2007). Rigorous and Quasi-Rigorous Limit Equilibrium Solutions of 3D Slope Stability and Application to Engineering. Chin. J. Rock Mech. Eng. 8, 1513–1528. doi:10.3321/j.issn:1000-6915.2007.08.001
Zhu, J. B., Li, C., Liu, Z. J., Wang, B., Jiang, Y. Z., Liu, X. H., et al. (2017). Damage Tests of Pre-Stressed Anchor Bars in Corrosion Environment. Chin. J. Rock Mech. Eng. 36 (07), 1579–1587. doi:10.13722/j.cnki.jrme.2016.1097
Keywords: rock slope, fault, deep-seated deformation, blasting, movement monitoring, support design
Citation: Wu Y, Zhang Q, Ding X, Wang H, Huang S and Yin X (2022) Deep-Seated Deformation Mechanisms of Excavated Slope and Control Methods: A Case Study. Front. Earth Sci. 10:858542. doi: 10.3389/feart.2022.858542
Received: 20 January 2022; Accepted: 21 February 2022;
Published: 08 March 2022.
Edited by:
Yongtao Yang, Institute of Rock and Soil Mechanics (CAS), ChinaReviewed by:
Dongdong Xu, Changjiang River Scientific Research Institute (CRSRI), ChinaXiaodong Fu, Institute of Rock and Soil Mechanics (CAS), China
Wu Wenan, Beijing University of Technology, China
Copyright © 2022 Wu, Zhang, Ding, Wang, Huang and Yin. This is an open-access article distributed under the terms of the Creative Commons Attribution License (CC BY). The use, distribution or reproduction in other forums is permitted, provided the original author(s) and the copyright owner(s) are credited and that the original publication in this journal is cited, in accordance with accepted academic practice. No use, distribution or reproduction is permitted which does not comply with these terms.
*Correspondence: Qing Zhang, bHh6aGFuZ3FpbmdAaGh1LmVkdS5jbg==