
94% of researchers rate our articles as excellent or good
Learn more about the work of our research integrity team to safeguard the quality of each article we publish.
Find out more
ORIGINAL RESEARCH article
Front. Earth Sci., 02 March 2022
Sec. Geohazards and Georisks
Volume 10 - 2022 | https://doi.org/10.3389/feart.2022.857984
 Bo Wang1
 Lanying Huang2*
It has been difficult to establish velocity models that use reflected seismic signals with advanced prediction ahead of the tunnel face. The accurate establishment of advanced velocity models face issues including artifacts in migration results and incorrect calculation of velocity. This study presents a polarization migration velocity model building method to solve these issues. First, the artifacts in migration interfaces were eliminated by the polarization characteristics of three-component reflected signals. Second, the optimum velocity ahead of the tunnel face was determined according to the energy stack characteristics of common interface points. Finally, the velocity model was established based on optimum velocity parameters and corresponding polarization migration interfaces using a three-dimensional and three-component numerical simulation conducted on faults with high dip and different inclinations. The results indicate that the velocity errors in the advanced velocity model were 1 and 2% for each of the two layers, and the position errors of the two interfaces were smaller than 3 and 2%. The experimental results of the Maanshan tunnel verified the effectiveness of the polarization migration velocity model building method.
Abnormal geological structures, such as faults and fracture zones, are the principal sources of disasters (Li et al., 2017; Fan et al., 2021; Huang et al., 2021). The tunneling disturbance may trigger severe geological disasters such as water inrush, mud inrush, and collapse, which cause huge loss of life and property (Lambrecht and Friederich 2013). Accurate prediction of unfavorable geological bodies is necessary for tunnel disaster prevention and safety control. However, the accuracy of surface seismic prospecting is limited by the large depth and complex topographical and geological conditions of tunnels (Zhao et al., 2006; Gong et al., 2010; Prabhakaran and Jawahar Raj, 2018; Zhou et al., 2021). Thus, the use of a seismic advanced prospecting method is imperative under these conditions (Li et al., 2015).
Seismic advanced prospecting methods have been in use in the field of tunneling since a long time. Zeng (1994) proposed a similar seismic negative apparent velocity method based on the vertical seismic section principle. Amberg Company developed Tunnel Seismic Prediction (TSP) using three-component receivers in a linear observation system (Dickmann and Sander 1996). OYO Company developed Horizontal Seismic Profiling (HSP) (Inazaki et al., 1999). German Research Centre for Geosciences developed Integrated Seismic Imaging System (ISIS) technologies (Kneib et al., 2000). American NSA Engineering Company developed True Reflection Tomography (TRT) technology (Otto et al., 2002). Zhao et al. (2006) developed Tunnel Seismic Tomography (TST) technology. Liu and Mei (2011) developed Tunnel Geology Prediction (TGP) technology. Liu et al. (2017) designed a three-dimensional (3D) observation system for seismic prediction ahead of a tunnel face. Wang et al. (2019) designed a type of geophone and observation system for advanced detection.
Many scholars have studied the variations of the aforementioned advanced seismic imaging technologies. Lüth et al. (2008) used Kirchhoff prestack depth migration to detect the surrounding rock environment ahead of a tunnel face. Tzavaras et al. (2012) combined Kirchhoff prestack depth migration, Fresnel volume migration, and reflection-image spectroscopy. The application of the combined imaging techniques shows less spatial ambiguity and a higher resolution for most structures. Xiao and Xie (2012) used seismic tomography technology to detect a Karst cave in a tunnel. Cheng et al. (2014) introduced the reverse time migration imaging algorithm into the tunnel seismic prospecting method, which provides high image quality of prospecting results. Bellino et al. (2013) proposed a fully automatic backward method to process the data acquired by arbitrary 3D observation. Wang et al. (2020) used Hilbert polarization imaging method to find the breakpoint position of the fault in front of the roadway. However, research is limited for the multi-reflected interfaces and the propagation velocity of seismic waves. Velocity model building is essential for reflected seismic signal processing in a tunnel. Velocity data obtained from seismic advanced prospecting are critical for determining the surrounding rock structure and lithological distribution ahead of a tunnel face. Therefore, to solve a key scientific problem for geological prediction, a reflected seismic signal should be used to build an accurate velocity model for the unexcavated area ahead of a tunnel face.
Although velocity analysis has made great progress in the field of the surface seismic prospecting (Ashida and Sassa 1993; Grechka et al., 2002; Koren and Ravve 2006; Buske et al., 2009; Brossier, 2011; Joudaki et al., 2018), some problems are still faced during the tunneling applications of the advanced prospecting method (Yamamoto et al., 2011; Zhang et al., 2019; Chao et al., 2021). This is mainly because it is difficult to generate effective lateral offset of the observation system in the narrow space of a tunnel, and faults of different dips and inclinations may exist in the area to be excavated, which increases the difficulty of prospecting (Esmailzadeh et al., 2018). Amberg Company built an advanced velocity model with prestack diffraction migration (Dickmann and Sander 1996). Zhao et al. (2008) solved the problem of velocity change in different strata ahead of a tunnel face using the energy stack method of scattered waves. Gong et al. (2010) built a velocity model by residual curvature analysis and iteration. These methods cannot build precise velocity models or calculate parameters such as reflection interface dip, inclination, and interval velocity in the unexcavated area ahead of a tunnel face because of the small lateral offset in the tunnel.
This study presents a polarization migration velocity model building (PMVMB) method to solve this problem. Using this method, the velocity model ahead of a tunnel face can be built through the energy stack on the polarization migration interface under the restriction of the principal polarization angle. Numerical simulations and field experiments were conducted to verify the effectiveness of this method.
It is difficult to form an effective lateral offset between the source and receiver point because of the limitation of the actual environment in a tunnel. The internal width and height of the tunnel are usually less than 10 m (Liu et al., 2020). Because the stratigraphic dip of a tunnel is relatively large, the reflected seismic signals received by the widely used TSP linear observation system may not gather at a common reflection point (CRP) or common depth point. Signals derived from the adjacent reflection points on the same reflection interface will gather at a common interface point (CIP) (Figure 1). Figure 1 illustrates that the seismic reflected rays form only one-fold stack; i.e., there is no multifold stack. The velocity analysis method based on the energy stack of CRP gathers fails when there is no CRP gather. In this case, it may be better to build the tunnel velocity model using the PMVMB method, which is divided into the following two steps. After the reflected signal is selected, different hypothetical velocities are set, which leads to different polarization migration interfaces (energy arcs). The energy on different polarization migration interfaces is stacked, and the maximum value of stacked energy denotes the correct velocity.
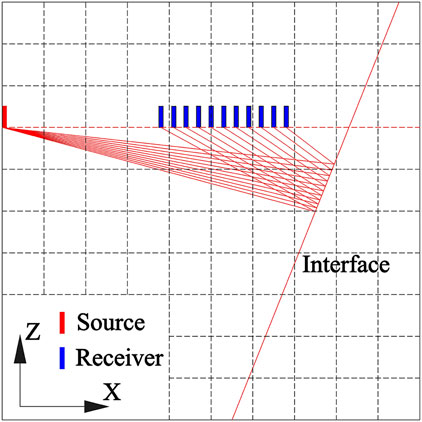
FIGURE 1. Schematic of seismic wave reflection from slant interface in the advanced detetion model. Unlike ground seismic exploration, there are few source and receivers in tunnel seismic advanced detection. It is difficult to stack in the common reflection point.
Since the interface ahead of the tunnel face is unknown, it is necessary to conduct migration imaging. However, because of the limited migration aperture in a tunnel, the traditional migration imaging method would cause symmetric artifacts. Therefore, a Hilbert polarization migration method, whose calculation principle is introduced in the following paragraphs, is used to eliminate the artifact and obtain accurate imaging of a reflection interface.
Hilbert transform is used on the effective seismic signals to build a covariance matrix, and eigenvalues and eigenvectors are solved through the covariance matrix (Diallo et al., 2006; Wang et al., 2016). The eigenvector with the largest eigenvalue is set as the principal polarization direction of the signals. After normalization, the eigenvector can be expressed as follows:
where
In actual tunnel seismic prediction, a common shot gather is derived from different reflection points on a reflection interface (Figure 1). In this case, polarization migration cannot form accurate reflection points but can form a reflection energy arc to represent the position of the reflection interface (Figure 2A).
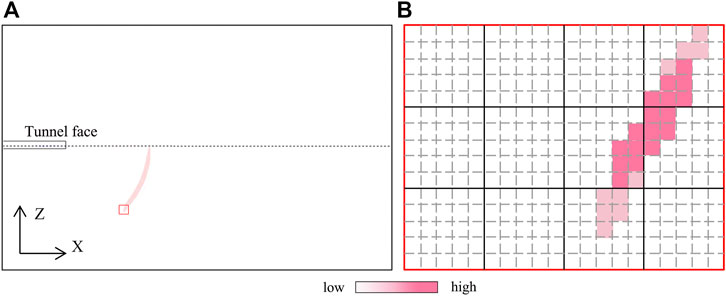
FIGURE 2. Principle diagram of reflection energy arc of migration. (B) is the partially enlarged schematic diagram of the marked out by the red rectangle in (A).
When calculating with different assumed velocities, each velocity has only one corresponding energy arc of polarization migration. The result of stacked energy corresponding to velocity
The space of the imaging area is gridded before polarization migration. Figure 2B indicates the amplitude of the selected energy arc within the grid. The amplitude value of each grid (denoted as
where m and n denote the horizontal and vertical coordinates of the grid,
The corresponding optimum migration velocity can be obtained by calculating the maximum value of stacked energy:
The process of the PMVMB method is shown in Figure 3. The first step is data preprocessing, which mainly includes observation system setting, bandpass filtering, first arrive pick processing, AGC, wave field separation, reflected wave extraction and time window setting. The second step is the size setting and meshing of the advance detection model. The third step is to initialize the model velocity, and the initial velocity value is generally the average velocity of the rock stratum in the detection area. The fourth step is to set the number of layers of the reflection interface, which is determined by the number of extracted reflected wave groups. The fifth step is to determine the effective time window of reflected waves of different reflected wave groups according to the time sequence, and the length of the time window is generally one period. The sixth step is to determine the principal polarization direction and angle of the reflection interface of layer I according to the reflected wave of the reflection interface of layer I. The seventh step is to determine the dip of the reflection interface according to the principal polarization direction, so as to eliminate the illusion of symmetry in the polarization migration. The eighth step is to set different velocity values for the model, adjust the velocity model, and carry out polarization migration according to different velocities. The ninth step is to compare the polarization migration energy values of different velocity, and determine the optimum velocity value corresponding to the maximum energy value. The 10th step is to determine the velocity model of the first layer according to optimum velocity value and interface dip. The 11th step is to determine the velocity model of other n-1 layers until all n layers are completed, and finally build the velocity model of the advanced detection model.
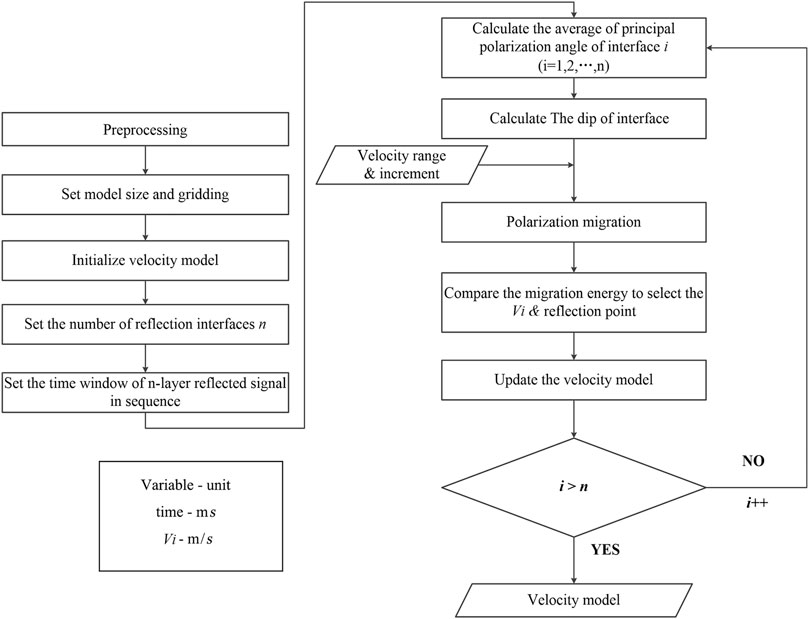
FIGURE 3. Calculation flowchart of the polarization migration velocity model building method for geological prediction ahead of the tunnel face.
The velocity range shown in Figure 3 should be determined according to lithological geophysical data of the tunnel. A smaller grid size will better represent the actual field conditions, but an unreasonably small grid size may be impractical because of the increase in workload calculation. The precision of seismic advanced prediction is determined by the wavelength of wavelets, so the grid cell size is usually set to be ≤2 m (Wang et al., 2016). The number of interface n is determined according to the reflected signal in CSP gather. One period length before and after the extreme point of energy is set as the time window range.
A three-dimensional model, which contains two reflection interfaces with different inclinations and velocities, is used to verify the calculation accuracy of the PMVMB method. A finite difference method is used to numerically simulate the system; the model is shown in Figure 5, and its parameters are shown in Table 1. The size of the model is 320 m × 200 m × 200 m, and the grid size is Δx = 0.5 m, Δy = 0.5 m, and Δz = 0.5 m. The sampling interval is 0.05 ms, and the source is Ricker wavelet with a frequency of 150 Hz.
The coordinates of the source are 20, 100, and 100 m and those of receivers are 30–60, 100, and 100 m in the X-, Y-, and Z-directions, respectively. The minimum offset is 10 m, and the interval of receivers is 2 m. In Figure 4B, the red square denotes the source location; the blue squares represent the 16 receivers that are numbered R1−R16; the last receiver is located on the tunnel face. Figure 4C shows the partially enlarged schematic of the tunnel and observation system presented in Figure 4B. The receivers are arranged in front of the source to receive the seismic signals. In Table 1, the velocity of seismic detection around the tunnel is represented by the corresponding data under label No. I, the velocity detected between the two reflection interfaces F1 and F2 is represented by the corresponding data under label No. II, and the velocity detected in the medium in front of reflection interface F2 is represented by the data under label No. III.
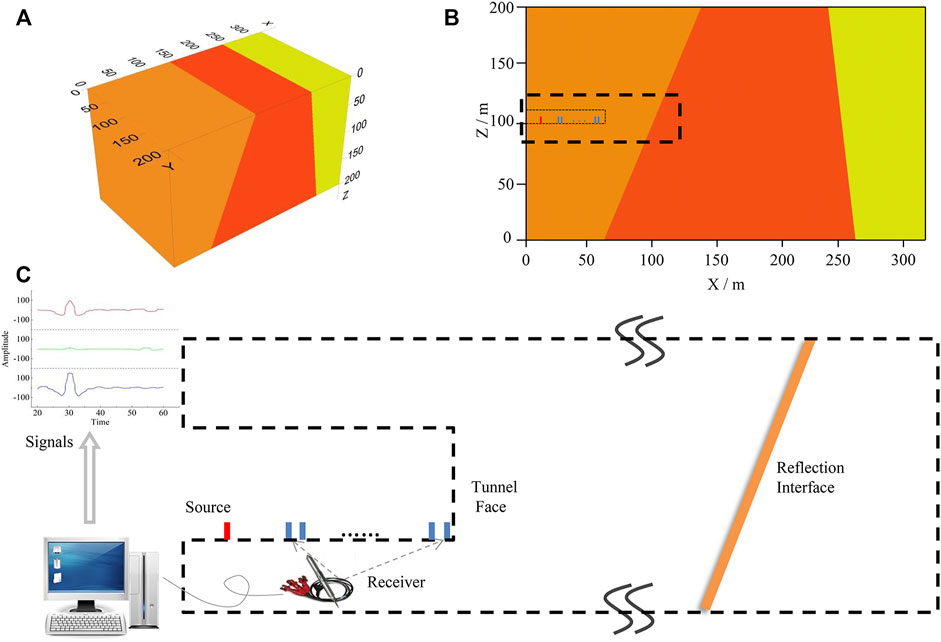
FIGURE 4. Geological model and seismic observation system. (A) 3D geological model; (B) XOZ diagrammatic cross-section; (C) The partially enlarged schematic diagram of observation system.
Figure 5 shows the preprocessed seismic signals of three components (X, Y, and Z). In Figure 5, A is direct wave, B and C denote the effective reflected signals, representing the reflected P-wave of the first interface and the second interface, respectively; D stands for the interference wave generated from the reflection of a model rear boundary; and E represents the boundary diffraction wave generated at the boundary point of the first interface, F1.
As an example, the reflected P-wave in the three-component seismic signals is selected to conduct energy stack with the X component shown in Figure 5. The location marked by the black line denotes the effective reflected events. The start time and end time are set to determine the range of effective waves for energy stacking.
Figure 6A shows the particle polarization trajectory calculated according to the P-wave signal reflected from the first interface and recorded by the second three-component receiver. A period length (33.26–39.93 ms) with the maximum amplitude point as its midpoint is selected to conduct polarization analysis. The particle trajectory is primarily linear, which is in line with the P-wave vibration. The particle vibration is mainly confined to the XOZ plane, and the principal polarization axis is inclined to the direction of the negative Z-axis, indicating that the reflected P-wave originates from the counter-trend interface. Then the maximum amplitude point can be selected to calculate the principal polarization angle,
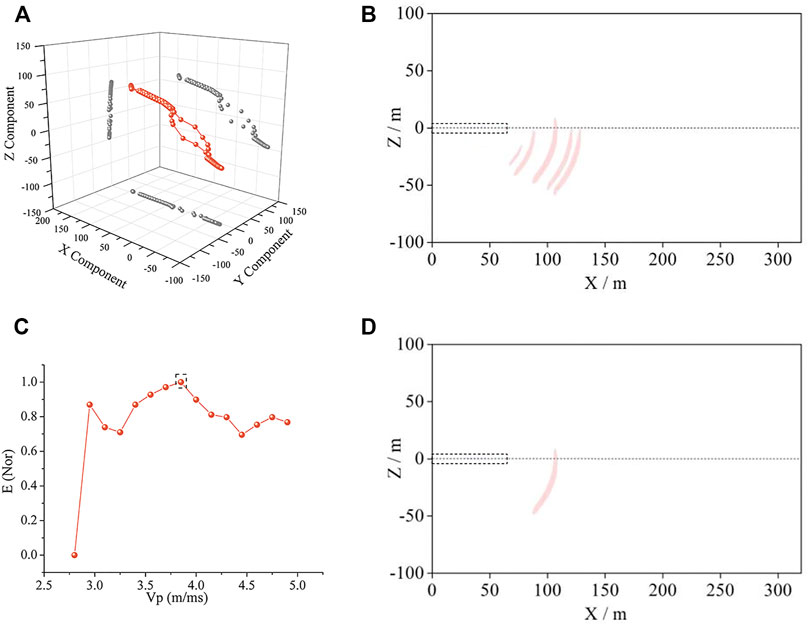
FIGURE 6. Polarization migration results of the first interface. (A) represents the particle vibration of No. 2 receiver, whose principal polarization angle is −25°. The polarization migration results in (B) are obtained by superposing all the 16 receivers. Since the migration results corresponding to 15 velocities (in part (C)) are difficult to display, the polarization migration interfaces corresponding to five velocities at relatively large intervals are selected. According to the velocity of Vp in (C) and the principle polarization angle in (A), polarization migration interface is confirmed.
The velocity model can be updated according to the calculation results in the first layer. Similarly, the velocity model for the second layer can be updated with reference to that of the first layer. A period length (110.4–117.07 ms) is selected to carry out migration analysis, and the results are shown in Figure 7A. Figure 7B shows the migration results at different velocities under the constraint of the principal polarization angle. Five velocities are selected, namely, 3.1, 3.55, 4.15, 4.75, and 5.2 m/ms, using a procedure similar to that used for the first interface. The polarization migration results of the five velocities are processed with energy superposition and the energy-velocity curve, and the results are shown in Figure 7C. The optimum velocity of P-wave between R1 and R2 is 4.0 m/ms. The accurate polarization migration interface can be extracted using the optimum velocity and principal polarization angle. The R2 interface is located at 257 m, is positively inclined, and has a dip of 78°, as shown in Figure 7D.
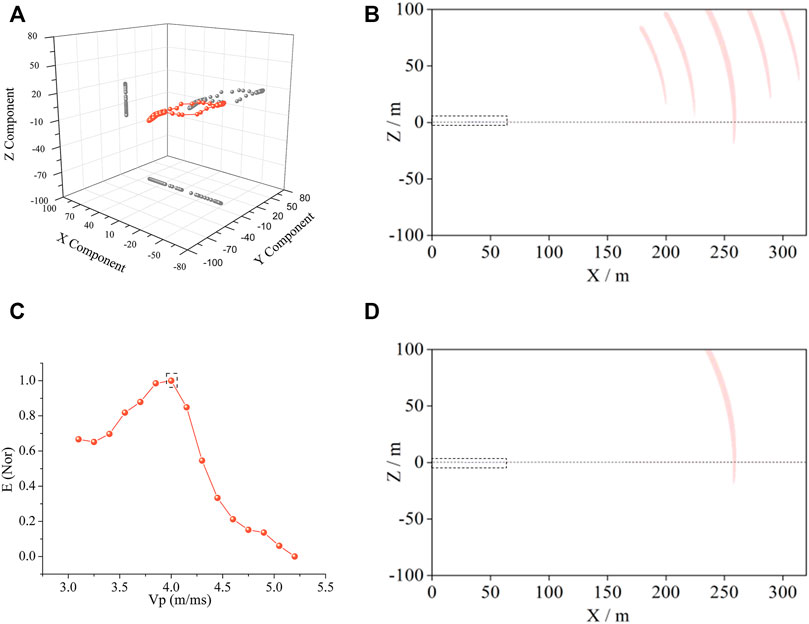
FIGURE 7. Polarization migration results of the second interface. (A) represents the particle vibration of No. 2 receiver. The polarization migration results in (B) are obtained by superposing all the 16 receivers. Since the migration results corresponding to 15 velocities (in part (C)) are difficult to display, the polarization migration interfaces corresponding to five velocities at relatively large intervals are selected. According to the velocity of Vp in (C) and the principle polarization angle in (A), polarization migration interface is confirmed.
Figure 8 shows the accurate polarization migration results of two interfaces. The black line in the figure denotes the reflection interface that is determined according to the migration results. The velocity model is established and shown in Figure 9 based on the reflection interfaces and velocities. The optimum velocity of the stratum behind the first reflection interface R1 is 3.85 m/ms, which is 0.05 m/ms more than the preset P-wave velocity (3.8 m/ms) in the actual geological model, and the relative error is 1%. The optimum velocity of the stratum behind the second reflection interface R2 is 4.0 m/ms, which is 0.1 m/ms less than the preset P-wave velocity (4.1 m/ms) in the actual geological model, and the relative error is 2%. The reflection interfaces of polarization migration are 98 and 257 m from the axis, which are, respectively, 3 m closer and 4 m farther than the actual geological model (101 and 253 m). The interface error is less than 2%.
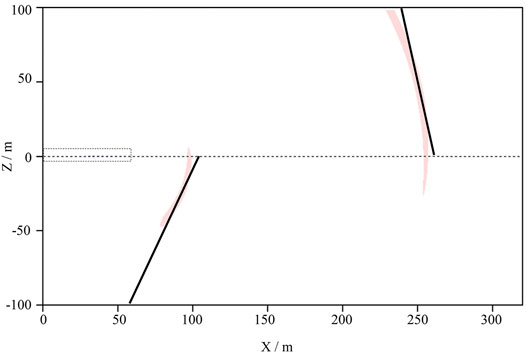
FIGURE 8. Polarization migration results of two reflection interfaces. The polarization migration results of the two-layer interface can be obtained, as shown in the red arc in the figure. Under the control of the principal polarization angle, the interface angles of the two layers are 65° and 78° respectively. The black lines are tangent to the red arcs and in line with the angle, and the lines are selected to the location of the reflection interfaces.
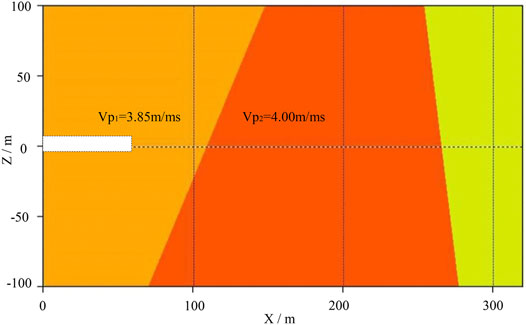
FIGURE 9. Velocity model of PMVMB method. The rightmost area represents the third layer of the model whose left boundary is defined by Figure 7D. Since there is no reflection interface on the rightmost area of the model, no reflected signals can be received. Accordingly, background velocity can be used as the velocity in this area because there is no way to solve the velocity of this area.
Jinfoshan reservoir is a water conservation project in the southeast of Chongqing Municipality, China. The specific location is shown in Figure 10A. Maanshan tunnel, the longest tunnel of this project, is located at K0+273.0 to K12 + 473.0. Channeling water from east to northwest, the tunnel crosses through the secondary fold of the north-west wing of Jinfoshan syncline, Lidoushan anticline, and Maanshan syncline. The tunnel axis is approximately perpendicular to the rock strike, and the dip of rock stratum is large. The lithology of surrounding rock in the tunneling area is mainly shale and sandstone. The rock is relatively broken and most of rock belong to III. The hydrogeological condition in the area is not particularly complex, and the karst is not developed, but the fault is relatively developed. Here, tunneling may be interrupted by a fault fracture zone, causing water inrush or mud inrush because of the complex geological structures. In this case, it is necessary to carry out effective advanced prediction.
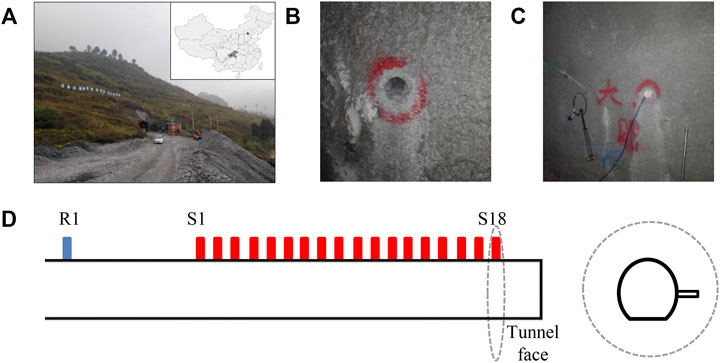
FIGURE 10. Layout of seimic observation system in Maanshan tunnel. (A) is the tunnel location. (B) is the layout of the blasthole. (C) is the position of the geophone. (D) is the schematic diagram of the observation system, and inside the dotted line is a cross section of the tunnel.
In field prospecting, when tunneling reached K4+088, the control range of reflected seismic advanced detection was K4+088 to 4 + 188. On the left side of the tunnel, there were 18 sources (numbered S1–S18) that were arranged at an interval of 2 m along the forward direction of the tunnel (Figure 10D). The geophone was arranged on the tunnel wall (R1) behind the source, and the depth was 3 m. The geophones were well coupled with boreholes on the tunnel wall. Soundproof cotton was used to plug the boreholes and eliminate sound wave interferences.
The signals in Figure 11A are the common receiver gather of X component received by R1. Four events can be seen in the seismic record in Figure 11B after seismic signal processing. The processing includes observation system setting, bandpass filtering, first arrival and pick processing, AGC, wave field separation, and reflected event time window setting. Event A denotes the diffracted wave caused by the conversion of the direct wave. Events B–D are the abnormal reflected P-wave generated on the tunnel face and reflection interfaces ahead of the tunnel face. The velocity model of the excavated area can be established from the early prospecting data and direct wave velocity, as shown in Figure 12. Events C and D are selected to build the velocity model for the area in front of the tunnel using the PMVMB method. According to the polarization migration results and geological data analysis, the two reflection interfaces Y1 and Y2 are located 27 and 79 m away from the tunnel face. The dip of Y1 and Y2 interfaces is 73° and −84°, respectively. In field prospecting, the tunnel face is located at K4+088, and the two reflection interfaces are located at K4+115 and K4+167. Later, tunneling shows that the F3 fault with a throw of 12 m and a dip of 74° is located at K4 + 114.5. The stratum behind the F3 fault is shale, and that ahead of the fault is the transitional formation consisting of dolomite and siltstone. The F4 fault is located at K4+168 with a throw of 23 m and a dip of −86°. The stratum ahead of the F4 fault is limestone. The results indicate that the reflection interface position error between the detection and the actual excavated result is less than 1 m.
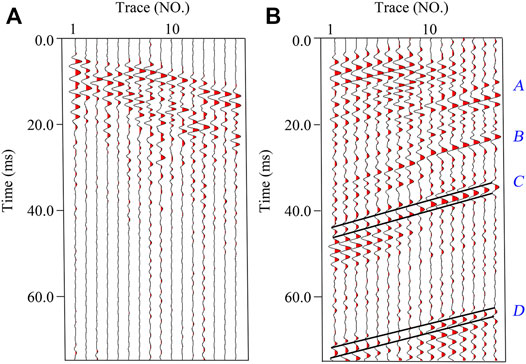
FIGURE 11. Original and preprocessed seismic record. Two events marked by black lines in (B) are selected as calculation signals of PMVMB method.
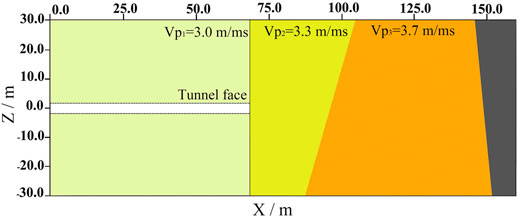
FIGURE 12. Velocity model and polarization migration results of PMVMB method. Since there are only two layers of reflected signals in Figure 11, the seismic wave velocity in the rightmost area in this figure cannot be determined.
1) The widely used TSP linear observation system was used to arrange three-component seismic wave receivers to pick up reflected seismic waves. With regard to three-component reflected signals, the velocity and the position of reflection interfaces can be accurately calculated with the PMVMB method. This method has a competitive edge over other velocity model building methods because it has relatively low observation system requirements. This method can decrease the difficulty of field construction and improve the detection efficiency compared with the TRT observation system, in which sources and receivers are arranged on both the roof and floor, as well as on both sides of the tunnel.
2) Because of the narrow construction space in the tunnel, the lateral offset between the sources and receivers is relatively small and leads to low stack folds of the detection area. Using traditional velocity model building methods, low stack folds will result in inaccuracy. This paper presents the concept of CIP. If there are n source-receiver pairs, n stack folds can be achieved by common interface points, thus effectively solving the problem of low stack folds. The PMVMB method is based on the energy stack characteristics of CIP, which can accurately establish the velocity model.
3) Compared with other methods, the advantage of the PMVMB method is that it uses the vector characteristics of three-component seismic signals. In the method, the principal polarization direction is calculated through matrix analysis, and the direction determines the principal energy direction of reflected wave propagation. Through the principal polarization direction, the symmetrical illusion problem that is difficult to be solved by other methods is eliminated, making the migration energy more accurate. The migration energy is the most important condition of velocity model building. The velocity analysis and migration imaging of other methods are carried out separately, and the procedure is cumbersome. The PMVMB method automatically combines the velocity analysis and migration imaging, and the velocity value and reflection interface are completed at one time, which has better efficiency and more accurate results. At the same time, the effective reflected signal is selected and then the velocity model building is carried out in the PMVMB method, which overcomes the negative impact of the interference signal of the reflected wave on the velocity model building. Therefore, the PMVMB method has relatively lower requirements on the reflected signal than other methods and has stronger adaptability to the actual field detection. However, it should be noted that the method is mainly applicable to the seismic advanced detection of active sources. The method is limited to the seismic advanced detection method for passive sources such as TBM and drilling machine, because the signal-to-noise ratio of the seismic reflection signal of passive sources is low (Wang et al., 2021).
4) Selecting an appropriate velocity increment, which influences the calculation accuracy, is difficult during energy stacking. If the velocity increment is too small, the complexity of calculation will increase; if the velocity increment is too large, a relatively large error between the optimum solved velocity and the actual velocity will occur. In other words, the error is caused by the improper selection of velocity increments. Therefore, further efforts should be made on choosing a velocity increment that adjusts according to the reflected signals and geological conditions of the tunnel advance prediction. In this paper, we only studied velocity model building of P-wave. The velocity model building method of S-wave is the same, and the premise is the separation of P-wave and S-wave (Liu et al., 2020).
This study demonstrates the PMVMB method in theory and introduces the calculation principle by which Hilbert polarization migration is used to eliminate the symmetric interface artifact. We also introduced a method for determining the optimum velocity based on the energy stack characteristics of CIP gather. We summarized the calculation steps and details of the PMVMB method. Three-dimensional and three-component numerical simulation was conducted with various combinations of high dips and different inclinations. According to three-component reflected signals, the principal polarization angle was calculated, and the polarization migration interfaces corresponding to different velocities were determined. The optimum velocity was determined in accordance with the principle of maximum stacked energy. Based on velocity parameters and corresponding polarization migration interfaces, a refined velocity model was established. A seismic advanced detection experiment was conducted in the Maanshan tunnel. The experimental results indicate that the PMVMB method can solve the actual problems such as inaccurate calculation results of velocity in the stratum ahead of the tunnel face and artifacts in migration results. Our research has practical significance for the detection of faults with high dip.
The original contributions presented in the study are included in the article/Supplementary Material, further inquiries can be directed to the corresponding author.
BW contributed to conception and methodology of the study. LH performed the data curation and visualization. LH wrote the first draft of the manuscript. BW reviewed and edited the manuscript. All authors contributed to manuscript revision, read, and approved the submitted version.
This paper was supported by the National Natural Science Foundation of China (No. 42174165).
The authors declare that the research was conducted in the absence of any commercial or financial relationships that could be construed as a potential conflict of interest.
All claims expressed in this article are solely those of the authors and do not necessarily represent those of their affiliated organizations, or those of the publisher, the editors and the reviewers. Any product that may be evaluated in this article, or claim that may be made by its manufacturer, is not guaranteed or endorsed by the publisher.
Ashida, Y., and Sassa, K. (1993). Depth Transform of Seismic Data by Use of Equi-Travel Time Planes. Exploration Geophys. 24, 341–346. doi:10.1071/eg993341
Bellino, A., Garibaldi, L., and Godio, A. (2013). An Automatic Method for Data Processing of Seismic Data in Tunneling. J. Appl. Geophys. 98, 243–253. doi:10.1016/j.jappgeo.2013.09.007
Brossier, R. (2011). Two-dimensional Frequency-Domain Visco-Elastic Full Waveform Inversion: Parallel Algorithms, Optimization and Performance. Comput. Geosciences 37 (4), 444–455. doi:10.1016/j.cageo.2010.09.013
Buske, S., Gutjahr, S., and Sick, C. (2009). Fresnel Volume Migration of Single-Component Seismic Data. Geophysics 74 (6), WCA47–WCA55. doi:10.1190/1.3223187
Chao, L., Zhang, K., Wang, J., Feng, J., and Zhang, M. (2021). A Comprehensive Evaluation of Five Evapotranspiration Datasets Based on Ground and grace Satellite Observations: Implications for Improvement of Evapotranspiration Retrieval Algorithm. Remote Sensing 13 (12), 2414. doi:10.3390/rs13122414
Cheng, F., Liu, J., Qu, N., Mao, M., and Zhou, L. (2014). Two-dimensional Pre-stack Reverse Time Imaging Based on Tunnel Space. J. Appl. Geophys. 104, 106–113. doi:10.1016/j.jappgeo.2014.02.013
Diallo, M. S., Kulesh, M., Holschneider, M., Kurennaya, K., and Scherbaum, F. (2006). Instantaneous Polarization Attributes Based on Adaptive Covariance Method. Geophysics 71, V99.
Dickmann, T., and Sander, B. K. (1996). Drivage-concurrent Tunnel Seismic Prediction (TSP). Felsbau 14 Nr. 6, 406–411.
Esmailzadeh, A., Mikaeil, R., Shafei, E., and Sadegheslam, G. (2018). Prediction of Rock Mass Rating Using TSP Method and Statistical Analysis in Semnan Rooziyeh spring Conveyance Tunnel. Tunnelling Underground Space Tech. 79, 224–230. doi:10.1016/j.tust.2018.05.001
Fan, Y., Cui, X., Leng, Z., Zheng, J., Wang, F., and Xu, X. (2021). Rockburst Prediction from the Perspective of Energy Release: A Case Study of a Diversion Tunnel at Jinping II Hydropower Station. Front. Earth Sci. 9, 711706. doi:10.3389/feart.2021.711706
Gong, X.-B., Han, L.-G., Niu, J.-J., Zhang, X.-P., Wang, D.-L., and Du, L.-Z. (2010). Combined Migration Velocity Model-Building and its Application in Tunnel Seismic Prediction. Appl. Geophys. 7, 265–271. doi:10.1007/s11770-010-0251-3
Grechka, V., Pech, A., and Tsvankin, I. (2002). Multicomponent Stacking‐velocity Tomography for Transversely Isotropic media. Geophysics 67, 1564–1574. doi:10.1190/1.1512802
Huang, X., Li, L., Zhang, C., Liu, B., Li, K., Shi, H., et al. (2021). Multi-step Combined Control Technology for Karst and Fissure Water Inrush Disaster during Shield Tunneling in spring Areas. Front. Earth Sci. 9, 795457. doi:10.3389/feart.2021.795457
Inazaki, T., Isahai, H., Kawamura, S., Kurahashi, T., and Hayashi, H. (1999). Stepwise Application of Horizontal Seismic Profiling for Tunnel Prediction Ahead of the Face. The Leading Edge 18, 1429–1431. doi:10.1190/1.1438246
Joudaki, V., Sohrabi-Bidar, A., Ajalloeian, R., Amini, N., and Dickmann, T. (2018). Evaluation of Tunnel Seismic Prediction (TSP) Test Results Based on Geological Observations and Analysis of the Parameters of the EPB Hard Rock Machine. Iranian J. Engineer. Geology. 11, 15–31.
Kneib, G., Kassel, A., and Lorenz, K. (2000). Automatic Seismic Prediction Ahead of the Tunnel boring Machine. First Break. 18 (7), 295–302. doi:10.1046/j.1365-2397.2000.00079.x
Koren, Z., and Ravve, I. (2006). Constrained Dix Inversion. Geophysics 71, R113–R130. doi:10.1190/1.2348763
Lambrecht, L., and Friederich, W. (2013). “Forward and Inverse Modeling of Seismic Waves for Reconnaissance in Mechanized Tunneling,” in EGU General Assembly Conference Abstracts, 15.4376L.
Li, S. C., Zhou, Z. Q., Ye, Z. H., Li, L. P., Zhang, Q. Q., and Xu, Z. H. (2015). Comprehensive Geophysical Prediction and Treatment Measures of Karst Caves in Deep Buried Tunnel. J. Appl. Geophys. 116, 247–257. doi:10.1016/j.jappgeo.2015.03.019
Li, S., Liu, B., Xu, X., Nie, L., Liu, Z., Song, J., et al. (2017). An Overview of Ahead Geological Prospecting in Tunneling. Tunnelling Underground Space Tech. 63, 69–94. doi:10.1016/j.tust.2016.12.011
Liu, B., Chen, L., Li, S., Song, J., Xu, X., Li, M., et al. (2017). Three-dimensional Seismic Ahead-Prospecting Method and Application in TBM Tunneling. J. Geotech. Geoenviron. 143 (12), 04017090. doi:10.1061/(asce)gt.1943-5606.0001785
Liu, B., Fan, K., Nie, L., Li, X., Liu, F., Li, L., et al. (2020). Mapping Water-Abundant Zones Using Transient Electromagnetic and Seismic Methods when Tunneling through Fractured Granite in the Qinling Mountains, China. Geophysics 85 (4), 147–159. doi:10.1190/geo2019-0067.1
Liu, Y., and Mei, R. (2011). Advantages of TGP advance Geology Prediction Technology in Tunnels. Tunn. Constr. Chin. Edition. 31 (1), 21–32.
Lüth, S., Giese, R., and Rechlin, A. (2008). “A Seismic Exploration System Around and Ahead of Tunnel Excavation–Onsite,” in World Tunnel Congress (Agra, India, 119–125.
Otto, R., Button, E., Bretterebner, H., and Schwab, P. (2002). The Application of TRT-True Reflection Tomography-At the Unterwald Tunnel,. Felsbau. 20, 51–56.
Prabhakaran, A., and Jawahar Raj, N. (2018). Mapping and Analysis of Tectonic Lineaments of Pachamalai hills, Tamil Nadu, India Using Geospatial Technology. Geology. Ecology, Landscapes 2 (2), 81–103. doi:10.1080/24749508.2018.1452481
Tzavaras, J., Buske, S., Groß, K., and Shapiro, S. (2012). Three-dimensional Seismic Imaging of Tunnels. Int. J. Rock Mech. Mining Sci. 49, 12–20. doi:10.1016/j.ijrmms.2011.11.010
Wang, B., Jin, B., Huang, L., Liu, S., Sun, H., and Liu, J. (2020). A Hilbert Polarization Imaging Method with Breakpoint Diffracted Wave in Front of Roadway,. J. Appl. Geophys. 177, 1–9. doi:10.1016/j.jappgeo.2020.104032
Wang, B., Sun, H., Li, X., Xing, S., and Ding, X. (2021). Seismic Wave Field Characteristics and Application of CO2 Concentrated Force Source. J. China Coal Soc. 46 (2), 556–565.
Wang, E., Liu, Y., Zhou, F., Lu, T., Huang, L., and Gao, Y. (2016). Reverse Time Migration Using Analytical Wavefield and Wavefield Decomposition Imaging Condition. Acta Geodyn. 13, 1–12. doi:10.1190/segam2016-13823057.1
Wang, Y., Fu, N., Lu, X., and Fu, Z. (2019). Application of a New Geophone and Geometry in Tunnel Seismic Detection. Sensors 19, 1246. doi:10.3390/s19051246
Xiao, Q. H., and Xie, C. J. (2012). Application of Tunnel Seismic Tomography to Tunnel Prediction in Karst Area. Rock Soil Mech. 33 (5), 1416–1420.
Yamamoto, T., Shirasagi, S., Yokota, Y., and Koizumi, Y. (2011). Imaging Geological Conditions Ahead of a Tunnel Face Using Three-Dimensional Seismic Reflector Tracing System. Int. J. JCRM. 6, 23–31.
Zeng, Z. H. (1994). Prediction Ahead of the Tunnel Face by the Seismic Reflection Methods. Chin. J. Geophys-CH. 37, 218–230.
Zhang, K., Wang, S., Bao, H., and Zhao, X. (2019). Characteristics and Influencing Factors of Rainfall-Induced Landslide and Debris Flow Hazards in Shaanxi Province, China. Nat. Hazards Earth Syst. Sci. 19 (1), 93–105. doi:10.5194/nhess-19-93-2019
Zhao, Y. G., Hui, J., and Xiaopeng, Z. (2008). The Technical Bug of TSP203 and Application of TST Technique. Chin. J. Eng. Geophys. 3, 15–22.
Zhao, Y., Jiang, H., and Zhao, X. (2006). Tunnel Seismic Tomography Method for Geological Prediction and its Application. Appl. Geophys. 3, 69–74. doi:10.1007/s11770-006-0010-7
Keywords: advanced prediction, FAULT, polarization migration, artifacts, velocity model
Citation: Wang B and Huang L (2022) A Polarization Migration Velocity Model Building Method for Geological Prediction Ahead of the Tunnel Face. Front. Earth Sci. 10:857984. doi: 10.3389/feart.2022.857984
Received: 19 January 2022; Accepted: 14 February 2022;
Published: 02 March 2022.
Edited by:
Chong Xu, Ministry of Emergency Management, ChinaReviewed by:
Jian Chen, China University of Geosciences, ChinaCopyright © 2022 Wang and Huang. This is an open-access article distributed under the terms of the Creative Commons Attribution License (CC BY). The use, distribution or reproduction in other forums is permitted, provided the original author(s) and the copyright owner(s) are credited and that the original publication in this journal is cited, in accordance with accepted academic practice. No use, distribution or reproduction is permitted which does not comply with these terms.
*Correspondence: Lanying Huang, aGx5eHppdEAxMjYuY29t
Disclaimer: All claims expressed in this article are solely those of the authors and do not necessarily represent those of their affiliated organizations, or those of the publisher, the editors and the reviewers. Any product that may be evaluated in this article or claim that may be made by its manufacturer is not guaranteed or endorsed by the publisher.
Research integrity at Frontiers

Learn more about the work of our research integrity team to safeguard the quality of each article we publish.